Article

Influencing Factors Analysis and Optimization of Land Use Allocation: Combining MAS with MOPSO Procedure

1
College of Geographic Information and Tourism, Chuzhou University, Chuzhou 239000, China
2
Anhui Province Key Laboratory of Physical Geographic Environment, Chuzhou 239000, China
3
College of Land Management, Nanjing Agricultural University, Nanjing 210095, China
*
Author to whom correspondence should be addressed.
Sustainability 2023, 15(2), 1401; https://doi.org/10.3390/su15021401
Submission received: 22 November 2022 / Revised: 26 December 2022 / Accepted: 10 January 2023 / Published: 11 January 2023

Abstract

:
The rural land use preferences of multiple agents are crucial for optimizing land-use allocation. Taking Guanlin Town, Yixing City, China as an example, this study analyzed the factors by agents effecting rural land use conversion probability, identified the objectives and the constraints within the optimization of rural land-use allocation, and simulated the optimal land-use allocation for 2030 by combining MAS with an MOPSO procedure. The results showed that the preferences and decisions of main actors effected the optimal land-use allocation. The Government determined the conversion between land-use types. The preferences of the entrepreneurs resulted in the distribution of industrial land. Town residents made a high contribution to the configuration of the town residential land by considering some factors. Rural families influenced land-use allocation by considering the quality of cultivated soils, and the optimal spatial location of aquaculture systems. Four optimization objectives were identified. The most relevant constraints were the upper and lower limits of each land-use type. The land-use types in Guanlin town in 2015 had a low intensification and an unreasonable structure. The modeling results indicated a tendency for concentrated spatial distributions of rural land. The results of the present study can provide useful support for decision-making within land planning and consequent management.

1. Introduction

Sustainable land use is recognized globally as a pre-requisite for achieving sustainable development [1]. Although global industrialization and urbanization have contributed to the rapid development of land resources, the need to conserve land resources is also recognized [2]. China has a strong dual urban–rural system in which urban areas feature prominently and in which there is heavy investment in industry. These features of China need to be considered when interpreting the strategies of land development adopted to date [3,4]. The implementation of new types of urbanization and rural revitalization strategies have contributed to the protection of agricultural land, ensured the stabilization of crop production, and allowed for the rising demands for built-up land [5,6]. The concentration of production factors in cities has resulted in problems in rural areas, such as the conversion of cultivated land to built-up land [7,8], the progressive depopulation of villages, and pollution of the soil and water environments [9]. Optimal rural land-use allocation improves land-use efficiency and promotes sustainable land use. However, it represents a complex spatial optimization problem in which portions of land are allocated to specific types or categories within a region [10].
The rational allocation of land resources is a fundamental aspect of land planning and includes the quantitative and spatial optimization in the distribution of land uses [11,12,13]. There have been various past studies on optimal land-use allocation. These include several studies on the optimal allocation of urban land use [14] or single rural land-use types, such as agricultural land [15,16], rural residential land [17,18], industrial land [19,20], and tourist land [21]. However, there have been relatively few past studies on the simultaneous optimization of the allocation of several rural land-use types. Moreover, previous studies have covered a wide range of spatial scales, including at the river basin [22,23], district [24], and county levels [25,26,27,28]. The Chinese administrative system divides land-use planning into five hierarchical levels: national, provincial, municipal, county, and township [29]. The township level represents the smallest administrative unit in China, and land-use change is particularly active at this level. Land-use change is a complex procedure that is influenced by various factors, including climate, topography, and values of farmers, among many. Central and local governments, entrepreneurs, town residents, and farmers are the main actors within the process of rural land-use change [30,31,32,33]. Nevertheless, there have been relatively few studies on optimal land-use allocation at a township scale considering the preferences and decisions of main actors, such as governments, entrepreneurs, town residents, and farmers. Therefore, these stakeholders’ decision-making behaviors and factors would be comprehensively considered in the context. On this basis, the representation of agent behavior is crucial within the optimal allocation of land-use. The optimal land-use allocation model was built including MAS and MOPSO. MAS represents the decision-making behaviors of the agents involved in rural land-use allocation. This idea has an innovative certain contribution to science. The present study adopted Guanlin town, Yixing City, China as a case study. The main aims of the present study were to: (1) Analyze the behaviors of decision-makers within the allocation of rural land use and the influencing factors affecting the process of adjusting the spatial distribution of land units; (2) Identify the objectives to be reached together with the constraints to be applied within the optimization of rural land-use allocation; and (3) Establish an optimal land-use allocation model combining MAS and MOPSO for optimizing the spatial layout of rural land use.

2. Data Sources and Methods

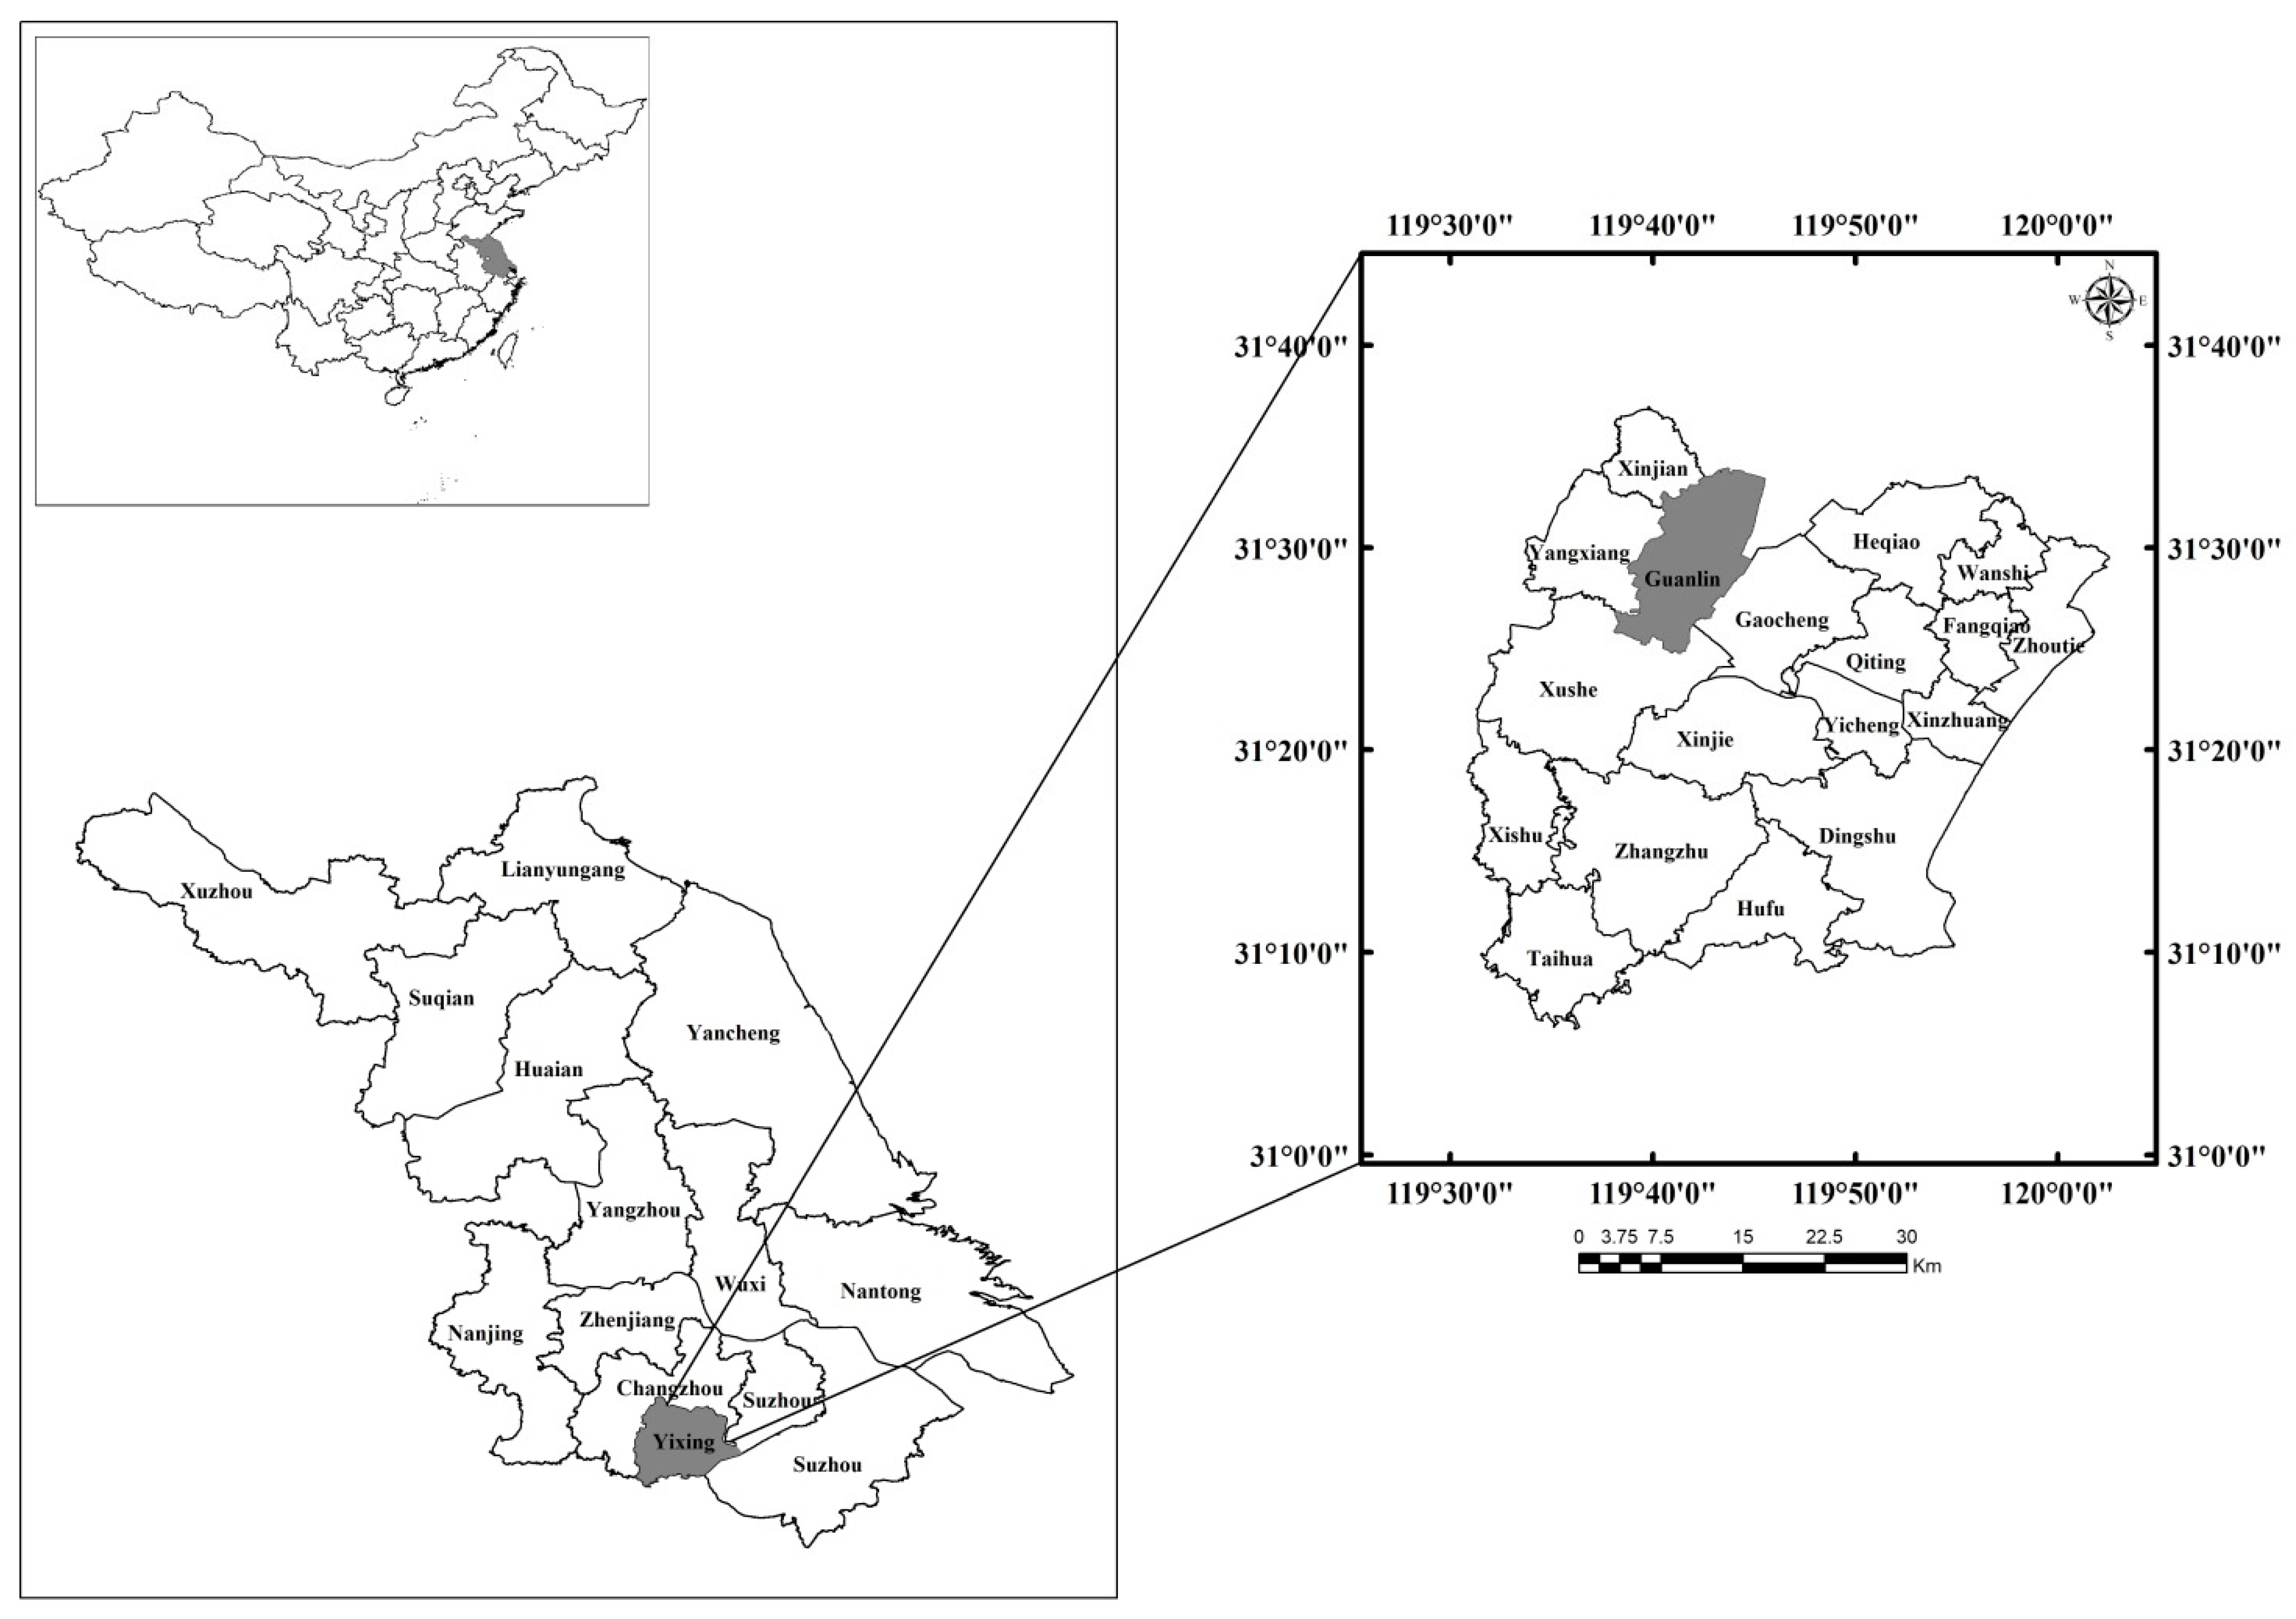
2.1. Overview of the Study Region

Guanlin Town is in southwest Yixing City, Jiangsu Province, China, between east longitude 119°38′–119°46′, north latitude 31°26′–31°33′, at the intersections of the Jiangsu, Zhejiang, and Anhui provinces (Figure 1). The town covers an area of 105.90 km2 and is in the heartland of the Yangtze River Delta Economic Circle, the most economically developed region of China. The resident and working population of this rural area exceeds 68,000, accounting for ~76% of the total population (reference to 2015) and represents an increase in the population of almost 3% compared to that in 2005. Based on the various advantages of good climate conditions, abundant water resources and a developed transportation system, Guanlin Town has experienced a rapid growth in aquaculture industries. Guanlin Town has recently emerged as the industrial and trade center of Yixing City, with this city having achieved a gross industrial production of 18.14 billion Chinese Yuan in 2015. The rapid growth of industrial enterprises and aqua-cultural activities in this area has resulted in large areas of cultivated land, water areas and inland beaches being converted to aquaculture surface and enterprise land, with the structure of rural land use simultaneously experiencing obvious changes.

2.2. Data Sources

QuickBird satellite images from 2015 was chosen as the base images. The spatial resolution of the images is 2.44 m. Land-use data for the study area were visually interpreted and then digitized in eCogniton Developer 8.7. Geometric correction was implemented using the quadratic polynomial method in ENVI 5.0 to allow image recording, and the error correction was limited to 0.5 pixels. The land-use categories were divided into seven classes: (1) cultivated land (paddy field and rained cropland); (2) aquaculture surface; (3) rural residential land; (4) town residential land; (5) enterprise land; (6) ecological land (gardens, woodland, grassland, water areas, and inland beaches); and (7) other land (transportation land, heterogeneous construction land, and unused land). In the study, the aquaculture surface refers to the land used for freshwater aquaculture and aquatic product storage. The high-resolution images from Google Earth were used as reference data. The present study extracted altitude and slope data from the ASTER Global Digital Elevation Model (30 m resolution) obtained from the Geospatial Data Cloud, Chinese Academy of Sciences (http://www.gscloud.cn, accessed on 1 July 2019.). The rural land-use data of 2006–2015 were summarized from the land-use change survey carried out by the Natural Resources Bureau of Yixing City, Jiangsu Province, China. The social and economic data were collected from Guanlin Town’s yearbook for 2015. GIS spatial analysis was used to calculate the thematic layers of Guanlin Town using land-use data and land-use planning, including distances to transportation, a river, an administrative town, a basic cultivated land conservation zone, urban built-up areas, and ecological protection areas. The study area was divided into many grids (the scale of 5 m × 5 m) in the optimization process. Each land-use grid should only be allocated with one land-use type and one agent. Therefore, the above data were normalized and then converted to raster maps (a resolution of 5 m) to ensure the optimal allocation of rural land use.
Decision-making behaviors of land-use agents and the objectives and constraints to be applied in the optimization of rural land allocation were obtained through semi-structured interviews. Interviews were held with the staff of the planning management department in Guanlin government. Questionnaire surveys of selected entrepreneurs, town residents and farmers were conducted in July and August 2016. The questionnaire aimed to determine the satisfaction with the current location and the factors influencing relocation. The survey covered ten companies, nine residential communities, and twelve administrations of villages in Guanlin Town. Of the 445 questionnaires issued, 410 (92%) were valid. The present study adopted several procedures to improve the representativeness and accuracy of the collected data: (1) semi-structured interviews were organized to capture the conditions of agents. Managers, government officials of Guanlin Town, and the heads of the administration of villages were interviewed. The present study chose data for enterprises, communities, and villages. The collection of data at the enterprise scale restricted the size of the community and the level of the village’ development; (2) Gender, age, and education level of the involved agents were accurately considered during the implementation of the survey. Agents were divided into groups, and a stratified random sampling was conducted to improve the representativeness of sampling; and (3) The investigators conducted in-depth interviews with agents in the absence of their superiors to enable their free expression of their willingness to participate in the optimization procedure. The investigators conducting the survey explained the survey to participants and guided them into completing the questionnaires. This contributed to increasing the authenticity and effectiveness of the survey data.

2.3. Building of the Optimal Land-Use Allocation Model

The optimal land-use allocation is a combinatorial and optimization problem including multiple objectives, discontinuous, and high-dimensional objectives. The optimal allocation of rural land use primarily depends on the decision-making behavior of agents, including government, entrepreneurs, town residents, and farmers. Agents exhibit rural land use decision-making behaviors based on their own attributes and perception of the surrounding geographical environment by comprehensively considering various frequently interacting factors. The probability of land conversion can be determined through the analysis of the behaviors of these agents. The representation of agent behavior is crucial within the optimal allocation of land-use [34]. Figure 2 shows the framework of the analysis adopted in the present study. Two modelling layers were embodied in entire model, namely MAS and MOPSO. In the optimal land-use allocation model, the study area was divided into many grids (the scale of 5 m × 5 m) in the optimization process. Each land-use grid should only be allocated with one land-use type and one agent. one agent contains two data: speed and location. The key to solve the optimal problem was processing efficiently the objectives and constraints and measuring the adaptability of agents in a grid or a cell. MOPSO expresses the agents’ adaptability and get their best location of the optimization procedure [35], whereas MAS represents the decision-making behaviors of the agents involved in rural land-use allocation [36]. Agents could sense the information around their local environment, and improve their adaptability through competition, cooperation, and self-learning with agents’ neighborhoods. In addition, agents selected the best position of the group and the individual by the global and local searching strategies independently. The MOPSO algorithm not only calculates the fitness values of agents according to objectives and constraints, but also designs specific operators accounting for the competition, cooperation, and self-learning among the agents and their neighborhoods to allow multi-objective spatial optimization [37,38].
The model was implemented using the MATLAB R2016a software and ArcGIS 10.3 in which the model was run recursively and specific terminal conditions were set [39]. Nine source program files were developed to achieve above goals, including “fitnessfunction.m”, “muloptfunction.m”, “yushufunction.m”, “compfunction.m”, “MaxMinfunction.m”, “neiborfunction.m”, “selflearnfunction.m”, and “Lijfunction.m”. In addition, we also set some constants were set: (1) To obtain the global optimal solution and prevent particles (agents or cells) from falling into local minima, the inertia constants were set to 0.4 and 0.9; (2) The probability of the cooperation and competition with the agents’ neighborhoods were both 0.85; (3) The size of self-learning with agents’ neighborhoods (sL size) was 6; (4) The radius of local search (sR) was 0.2; (5) The number of maximum iteration (SGen) was 10; and (6) The precision or the minimum error value (Amin) was 10−6.

2.4. The Probabilities Calculation of Rural Land Use Conversion

MAS focuses on the diversity of behaviors of agents [40]. The probabilities of rural land conversion were used to analyze the decision-making behaviors of agents and their interactions based on the understanding of the underlying driving forces. The conversion probability of a cell (i, j) was expressed as follows:
P ij = i = 1 4 a i C ij
C ij = farmland + built-up + ecology i = 1 k = 1 l w k d k i = 2 , 3 , 4
In Formulas (1) and (2), Pij is the land use conversion probability determined by agents and ai denotes the weight of an agent [subscript “i” (1 to 4) indicates the agent, as shown in Table 1, and they are the real numbers in the range of 0–1]. The starting set of weights was assessed according to the initial survey performed on the agents (see Table 1). The final set of weights was obtained through the application of the land use optimization algorithm. Cij represents the effectiveness of the decision of an agent in influencing the probability of land use conversion (subscript “j” represents the land-use type, as listed in Table 1). i = 1 indicates that the cell conversion probability is decided by the government; C1j is an integer in the range of 0–3; C1j = 0 indicates that the cell can be converted to another land-use type. The C1j value assigned to a cell corresponding to cultivated land within the protection zone (farmland), town built-up area (built-up), or ecological protection area [ecology] was 1, 2, and 3, respectively, otherwise 0 was assigned to C1j. Values of i of 2, 3, and 4 represented cell conversion probabilities of entrepreneurs, town residents, and farmers, respectively (listed in Table 2). wk and dk represent decision parameters and variables (listed in Table 3, Table 4 and Table 5), with the subscript “k” indicating the influencing factor k. Cij, wk, and dk are the real number in the range of 0–1.

2.5. Expression of the Objective Functions and Constraints

Land optimal allocation aims to achieve sustainability of land use by society, the economy, and ecology. The objective of optimal land-use allocation within the economy is to maximize economic benefits. Land use provides social security within social development. Ecological benefits of land-use allocation relate to the resulting ecological goods and services provided by land. The objective function aimed to maximize the total regional land-use benefit [41].
MaxF i = k = 1 K W ik S k
In Formula (3), Fi represents the total benefit [“i” (1 to 4) represents the economic revenue, basic living security, employment security, and the ecosystem services offered by each land-use type, listed in Table 6], Wik represents the benefit value coefficient of land-use type k, i.e., the average revenues of various land-use types, town endowment insurance, the incomes per unit area of employees, the ecosystem service values of various land types per unit area. Sk represents the areas of seven land-use types (according to the list shown in Table 1). The benefits corresponding to different land-use types k were determined by reference to the relevant literature. The incomes of employees per unit area were obtained through the questionnaire surveys and monetary values were assigned to the ecosystem services provided by various land types per unit area according to the method outlined in Costanza.
The upper and lower limits of land-use allocation was represented by the current and future values of land, respectively. The future value of each type of land for target years was predicted using the GM (1,1) model [42], Two constraints on the spatial pattern of land-use allocation were implemented. First, only one type of land use could be allocated to each cell (i, j). Second, the number of cells allocated to construction land within the neighborhood of cell (i, j) could be no less than 2 to prevent the growth of new construction land use and to fill the internal undeveloped land [43].

2.6. Calculation of the Fitness Value

Rural land use optimization is a combined optimization problem that involves discontinuous multiple objectives. The MOPSO algorithm solves the optimization problem by measuring the adaptive ability of any agent i, which is equivalent to a particle in the MOPSO algorithm. In the optimal allocation of land use, the adaptability of an agent is measured by fitness. Fitness is mainly determined by the objective functions and constraints, and is expressed as:
f i = β P ij x z x p x
In Formula (4), f(i) is the fitness value [subscript “i” represents the agent (particle) in the MOPSO), Pij denotes the probability of conversion of the j-th land-use type determined by the i-th agent, and has been calculated according to Formula (1); z(x) represents the values of the objective functions of land use unit x by handling the total regional land-use benefit (MaxFi) using the adaptive weight approach for transforming a multi-objective problem into a single-objective problem, p(x) is the constraint value of land use unit x using the penalty function for transforming a constrained optimal problems into one or a series of unconstrained optimal problems [44]. β is a constant fixed at (1,2), with a value of 1.5 generally use to increase fitness [38].

3. Results

3.1. The Influencing Factors of Rural Land Use Conversion Probability

3.1.1. Restricted Areas by Government

The government regulates the scale and spatial layout of land use through the General Land Use Planning, Town and Village Planning, and other related plans by rationally allocating rural land resources across both space and time. The local government within Guanlin Town designates areas for particular land practices and establishes zones with restricted land practices to optimize all types of rural land allocation (Table 2). Information gathered by General Land Use Planning has shown that basic cultivated land protection zones comprise two sub-categories: (1) traditional agricultural areas; (2) characteristic agricultural areas. The traditional agricultural areas are in the southern part of the town in which rice is traditionally grown. Two agricultural bases were constructed to facilitate the production of vegetables, aquaculture, high-quality rice, and other characteristic agricultural products. These bases were established in agricultural areas in the northern part of the town. Information provided by Guanlin Town, Village Planning, and the High-Tech Industrial Development Zone Plan has shown that residential and industrial functions are mainly considered in the town built-up areas. The spatial layout of rural construction land was optimized by designating agglomeration settlements, a new chemical industry, and a wire and cable industry in this area. Ecological buffer zones and corridors were also planned to protect the ecological environment of Guanlin Town. These restricted areas reflect decisions by government to control the rural land use.

3.1.2. Decision Factors by the Main Land Users

The entrepreneurs, town residents, and farmers are the main users of land. The sites these agents select affect the spatial layout of land use. The results of the questionnaire surveys showed that the factors affecting decisions were different among the different agents, thereby reflecting the type of agents involved. Specific decision variables and decision parameters can be detected for each type of agent.
(1)
Decision Factors by Entrepreneurs
The results of the questionnaire surveys showed that the entrepreneurs participated in the adjustment of industrial land within the framework set by governmental planning. The decision-making behaviors of the entrepreneurs were affected by resource cost, regional traffic, and economic development. Table 3 provides a summary of the main decision variables made by the entrepreneurs and the values of their corresponding parameters. The values assigned to the parameters indicated that proximity to the market and peripheral road conditions had the greatest influence on the variables. The wire and cable industries are in the middle of the national economic industrial chain. Therefore, these industries account for a large proportion of the raw material costs and downstream industries show a strong demand for the products they provide. Thus, the costs related to the supply channels and marketing were identified as relatively important variables within the entrepreneurs.
(2)
Decision Factors by Town residents
The results of the questionnaire surveys showed that both town residents and the government made decisions in selecting sites in town residential lands. Town residents selected land in compliance with government planning. Table 4 summarizes the main decision variables and the values of their parameters according to the decisions made by town residents. Convenient transportation and improved facilities were the basic requirements of town residents. Therefore, distance to the nearest supermarket, housing cost, and building quality were the main factors affecting site selection by town residents.
(3)
Decision Factors by Farmers
After being provided authorization by the government, farmers participated in the adjustment and decisions on rural land site selections through the questionnaire survey. As shown in Table 5, distance to farmland, land natural quality, and land use quality were the main factors affected their preferences for selecting cultivated land. Distance to aquaculture facilities, distance to the road network, and headwater conditions had major influences on the spatial distribution of aquaculture land. The main factors affecting the selection of land by farmers mainly included the distance to county markets, the distance to contracted land, and drinking water facilities.

3.2. Optimization Objectives and Constraints

3.2.1. Optimization Objectives

The four objectives to be maximized were selected according to the questionnaire survey. These were economic revenue, basic living security, employment security, and the ecosystem services offered by each land-use type. The average revenues of various land-use types from 2010 to 2015 were measured and expressed in monetary terms (Table 6). Town endowment insurance expresses the basic living security value. The incomes per unit area of employees reflected the employment security value. The ecosystem service values of various land types per unit area was calculated according to previous analyses. [45]. The maximized values of objectives for various land-use types were obtained by applying Equation (4), with the land use map of 2015 assumed as a reference.

3.2.2. Optimal Constraints

The results of the questionnaire survey showed that the upper and lower limits of each type of land area were the main constraints to land selection. The present study predicted the areas of various land-use types in 2015 and 2030 based on land-use data of 2006–2012 and 2006–2015, respectively. Table 7 shows the numerical restrictions of various land-use types in 2015 and 2030 according to database of land use, predictive values, and land use control values of General Land Use Planning. Although cultivated land accounted for the largest proportion of rural land, it showed the largest reduction in area from 2015 to 2030 (12.2%). The upper limit of aquaculture area showed an increasing trend, with a total increase of 52.9%. The upper and lower limits of town residential land area displayed small increases of 19.4% and 7.8%, respectively. Although the upper area limit of enterprise land area remained unchanged, the corresponding lower area limit showed an increase of 21.1%. The upper and lower area limits of ecological land decreased, and the areas of ecological land in 2015 and 2030 were reduced by 5.38 km2 and 2.80 km2, respectively. In addition, many paddy-duckweed ponds besides the Ge Lake were converted to aquaculture.

3.3. Optimal Allocation of Land Use

The optimal allocation results of land use were obtained after a few steps including running related files, loading the basic data, initializing parameters, using Raster to ASCII in ArcMap. The land use map for 2015 is shown in Figure 3a. Based on the land use map in 2015, optimal allocation results in 2015 and 2030 were shown in Figure 3b,c and Table 8. A comparison of actual land use in 2015 with predicted land use in 2030 indicated initial increases in the areas of cultivated land and rural residential land, followed by decreases, with overall decreasing trends of 13.7% and 6.2%, respectively. These two land-use types showed relatively concentrated spatial distributions. The areas of aquaculture and “other” increased progressively by rates of 50.5% and 13.7%, respectively. There were sporadic reductions in the areas of aquaculture in Qiancheng and Nanzhuang. The areas of enterprise land and town residential land first decreased and then increased by 2.3% and 1.9%, respectively. The spatial distributions of enterprise land in the southeast and west of the built-up area were more concentrated. The area of ecological land decreased by 1.64 km2, mainly due to being transformed into aquaculture land.
Running the optimization model after optimal land-use allocation was reached allowed the optimal weights to be attributed to the decisions of agents (Table 9). The values of these weights after this process were different from the starting values. Government remained the dominant decision maker and guided rural land-use allocation, with an average weight of ~0.6. The entrepreneurs, town residents, and farmers were the main land users, and their decision-making behaviors affected the area and spatial layout of land. The optimal weight of decisions made by agents in the entrepreneurs was 0.36, with their decisions affecting spatial change in enterprise land. The decisions of town residents affected the spatial layout of town residential land, and their optimal weight was calculated to be 0.27. Land use decisions by farmers were more complex, and had impacts on cultivated land, aquaculture area, and rural residential land, with resulting weights of 0.34, 0.36, and 0.33, respectively.

4. Discussion

4.1. Complexity of Rural Land Use—Based Structure and Layout

The land use structure of Guanlin Town was calculated according to land use survey data for 2015. Agricultural land accounted for the largest proportion of total area of Guanlin Town (42.37%), with cumulative areas of cultivated land and aquaculture of 44.86 km2. Ecological land showed the second largest area at 25.73 km2. The area of unused land was relatively small, accounting for only 1.81% of total area, lower than the average level of Wuxi City of 20.8%. This result indicates a relative shortage of land resources. The numbers of patches per km2 of cultivated land, ecological land, and “other” land were 10.832, 13.058, and 31.984, respectively, far exceeding those for aquaculture area, rural residential land, town residential land, and enterprise land of 3.064, 4.123, 0.481, and 1.896, respectively. On the other hand, the degrees of proximity of aquaculture area and cultivated land were relatively low at 58.245 and 62.301, respectively.

4.2. Accuracy of Model—Based Combining MAS and MOPSO

The optimal allocation of land use is a complex, multi-objective decision-making process. The model used in the present study was established by combining MAS and MOPSO and was based on the analysis of decision-making behaviors of agents, the influencing factors, optimal objectives, and constraints in the study area. A comparison of the model results with land use data for 2015 provided a model accuracy index of 0.8226, suggesting a good optimization effect. The model not only accurately reflected the environmental conditions and the impacts of agents on rural land-use allocation, but also further improved the representation of the interaction among the agents and the environment, thus providing an improved simulation of land-use change. The model is suitable for representing the interactions between individual agents and environment and for solving multi-objective optimal allocation of rural land use.

4.3. Rationality of Land Function Categories—Based Optimal Allocation of Land Use

The present study reclassified seven land-use types into four function categories: (1) ecological land (E), including rivers and lakes; (2) ecological productive land (EP), which refers to the aquaculture area; (3) productive ecological land (PE), referring to cultivated land; and (4) living productive land (LP), representing rural residential land, town residential land, and enterprise land. There is a need for government to strengthen the protection of land E. Land development and enterprise construction should be prevented in ecologically fragile and sensitive areas. EP land such as “Ring Dang” and the “Ring Lake” aquaculture belts should be constructed for protection of the ecological environment and aquaculture development of the region with Dushandang, Linjindang, and Gehu as the center. The area of the PE land can be stabilized, and agricultural modernization can be realized by splitting the agricultural land structure into two parts: (1) characteristic agriculture in the south of the town; and (2) traditional agriculture in the north of the town. The Dushan concentrated residential area could be added based on the existing planned village clusters. This would provide an accommodation solution for the large number of migrant workers employed by chemical enterprises. Moreover, the LP land in the middle of the town could be reclassified into four residential areas, namely, Old Town, Donghong, Jinghu, and Situ. This approach would decrease the scattered distribution of residential areas. The formation of three industrial zones, including for the chemical industry, high-end industry research and development, and traditional wire and cable industry would achieve optimized land use for industrial clusters and decrease the impact of industrial development on cultivated land. In contrast with approaches by General Land Use Planning, Town and Village Planning, and the High-Tech Industrial Development Zone Plan, the results obtained in the present study are backed up by objective research and are focused on maximization of benefits.

4.4. Limitations of the Influencing Factors and the Model

Rural land use is affected by macro policies and the human environment. The decisions and factors influencing the different levels of governments and types of farmers, town residents, and the entrepreneurs also vary. Future studies should formulate more detailed and reasonable rules to achieve more accurate modelling, and the quantitative expressions of constraint indicators, such as institutional policies and cultural deposits, should be further considered. The model represents many interactions between individual agents, and PSO remains in an immature stage. The calculation overhead of the model increases with increasing spatial resolution. Therefore, the computational limits placed on the model is an urgent problem that needs to be solved. Further studies may explore the synthesis of high convergence computing and multi-agent modelling to provide efficient operational support for the model. In addition, the particular characteristics of the rural land system in China and the complexity of multi-agent interactions indicates the need for future work to focus on the decision rules for multiple agents, including land policy and supervision. In addition, although the present study was initiated in 2016, the remote sensing data used only covers the period up to 2015. Subsequent studies should use more updated datasets.

5. Conclusions

Taking Guanlin Town, Yixing City, China as an example, this study analyzed the factors by agents effecting rural land use conversion probability, identified the objectives and the constraints within the optimization of rural land-use allocation, simulated the optimal land-use allocation for 2030 combining MAS with MOPSO procedure. Some conclusions can be drawn as follows.
The land use structure of Guanlin Town in 2015 was complex and indicated a relative shortage of land resources. The numbers of patches per km2 and the degrees of proximity of various types of land reflected that land-use types in Guanlin Town had a low intensification and an unreasonable structure, indicating the urgent need for land use optimization.
The decision-making behaviors of agents (government, entrepreneurs, town residents, and farmers) and the influencing factors adjusted the spatial distribution of rural land use. The agent types and their decisions were different among the different land types. Government determined the conversion between land-use types. The preferences of the entre-preneurs resulted in the distribution of industrial land. Town residents made a high contribution to the configuration of the urban town residential land by considering some factors. Rural families influenced land-use allocation by considering the quality of cultivated soils, and the optimal spatial location of aquaculture systems.
The four objectives to be maximized were selected according to the questionnaire survey. These were economic revenue, basic living security, employment security, and the ecosystem services offered by each land-use type. The most relevant constraints were the upper and lower limits of each land-use type.
The results of optimizing the spatial layout of rural land use indicated that the spatial distributions of different land-use types in rural land tend to remain concentrated. Running the optimization model after optimal land-use allocation was reached allowed the optimal weights to be attributed to the decisions of agents. The values of these weights after this process were different from the starting values.
The present study reclassified seven land-use types into four function categories: ecological land (E); ecological productive land (EP); productive ecological land (PE); and living productive land (LP). In contrast with approaches by General Land Use Planning, Town and Village Planning, and the High-Tech Industrial Development Zone Plan, the results obtained in the present study are backed up by objective research and are focused on the maximization of benefits.

Author Contributions

Conceptualization, J.L. and M.X.; Methodology, J.L.; Writing—original draft, J.L.; Writing—review & editing, J.L. and M.X.; Project administration, M.X. All authors have read and agreed to the published version of the manuscript.

Funding

This research was funded by [Youth Project of the National Natural Science Foundation of China] grant number [42001193], [Scientific Research Start-up Fund Project for Chuzhou University] grant number [2022qd026], [Science and Technology Project of Jiangsu Provincial Natural Resources Department] grant number [2021004], [Science and Technology Project of Chuzhou City] grant number [2021ZD010], [Foundation of Anhui Province Key Laboratory of Physical Geographic Environment, P.R. China] grant number [2022PGE009], and [Educational Commission of Anhui Province of China] grant number [2022AH051107].

Institutional Review Board Statement

This study not involving humans or animals.

Informed Consent Statement

This study not involving humans or animals.

Data Availability Statement

The data was collected by visiting farmers in China, not involving data sets.

Conflicts of Interest

The authors declare no conflict of interest.

References

  1. Scarborough, V.L.; Dunning, N.P.; Tankersley, K.B.; Carr, C.; Weaver, E.; Grazioso, L.; Lane, B.; Jones, J.G.; Buttles, P.; Valdez, F.; et al. Water and sustainable land use at the ancient tropical city of Tikal, Guatemala. Proc. Natl. Acad. Sci. USA 2012, 109, 12408–12413. [Google Scholar] [CrossRef] [Green Version]
  2. Huang, Q.; Song, W. A land-use spatial optimum allocation model coupling a multi-agent system with the shuffled frog leaping algorithm. Comput. Environ. Urban Syst. 2019, 77, 101360. [Google Scholar] [CrossRef]
  3. Liu, Y.; Schen, C.; Li, Y. Differentiation regularity of urban-rural equalized development at prefecture-level city in China. J. Geogr. Sci. 2015, 25, 1075–1088. [Google Scholar] [CrossRef]
  4. He, Y. Economic Logic of Development and Value Basis of Reform of China’s Rural Land System. Asian Agric. Res. 2019, 11, 6–9. [Google Scholar]
  5. Peng, J.; Yan, S.; Strijker, D.; Wu, Q.; Chen, W.; Ma, Z. The influence of place identity on perceptions of landscape change: Exploring evidence from rural land consolidation projects in Eastern China. Land Use Policy 2020, 99, 104891. [Google Scholar] [CrossRef]
  6. Chen, M.; Zhou, Y.; Huang, X.; Ye, C. The Integration of New-Type Urbanization and Rural Revitalization Strategies in China: Origin, Reality and Future Trends. Land 2021, 10, 207. [Google Scholar] [CrossRef]
  7. Huang, Y.; Hui, E.C.M.; Zhou, J.; Lang, W.; Chen, T.; Li, X. Rural Revitalization in China: Land-Use Optimization through the Practice of Place-making. Land Use Policy 2020, 97, 104788. [Google Scholar] [CrossRef]
  8. Liu, Y. Research on the urban-rural integration and rural revitalization in the new era in China. Acta Geogr. Sin. 2018, 73, 637–650. [Google Scholar]
  9. Schäfer, M.; Kröger, M. Joint problem framing in sustainable land use research. Land Use Policy 2016, 57, 526–539. [Google Scholar] [CrossRef]
  10. Liu, Y.; Fang, F.; Li, Y. Key issues of land use in China and implications for policy making. Land Use Policy 2014, 40, 6–12. [Google Scholar] [CrossRef]
  11. Zeng, Y.; Huang, W.; Jin, W.; Li, S. Multi-Agent Based Simulation of Optimal Urban Land Use Allocation in the Middle Reaches of the Yangtze River, China. ISPRS-Int. Arch. Photogramm. Remote Sens. Spat. Inf. Sci. 2016, 8, 1089–1092. [Google Scholar] [CrossRef] [Green Version]
  12. Zhang, H.; Jin, X.; Wang, L.; Zhou, Y.; Shu, B. Multi-agent based modeling of spatiotemporal dynamical urban growth in developing countries: Simulating future scenarios of Lianyungang city, China. Stoch. Environ. Res. Risk Assess. 2015, 29, 63–78. [Google Scholar] [CrossRef]
  13. Yin, C.; Kong, X.; Liu, Y.; Wang, J.; Wang, Z. Spatiotemporal changes in ecologically functional land in China: A quantity-quality coupled perspective. J. Clean. Prod. 2019, 238, 117917. [Google Scholar] [CrossRef]
  14. Sá, J.; Virtudes, A. Towards Rural Land Use: Challenges for Oversizing Urban Perimeters in Shrinking Towns. IOP Conf. Ser. Earth Environ. Sci. 2017, 95, 052016. [Google Scholar] [CrossRef] [Green Version]
  15. Srivastava, P.; Singh, R.M. Agricultural Land Allocation for Crop Planning in a Canal Command Area Using Fuzzy Multiobjective Goal Programming. J. Irrig. Drain. Eng. 2017, 143, 04017007. [Google Scholar] [CrossRef]
  16. Xia, M.; Zhang, Y.; Zhang, Z.; Liu, J.; Ou, W.; Zou, W. Modeling agricultural land use change in a rapid urbanizing town: Linking the decisions of government, peasant households and enterprises. Land Use Policy 2020, 90, 104266. [Google Scholar] [CrossRef]
  17. Tian, F.; Li, M.; Han, X.; Liu, H.; Mo, B. A Production–Living–Ecological Space Model for Land-Use Optimisation: A case study of the core Tumen River region in China. Ecol. Model. 2020, 437, 109310. [Google Scholar] [CrossRef]
  18. He, Q.; Tan, S.; Yin, C.; Zhou, M. Collaborative optimization of rural residential land consolidation and urban construction land expansion: A case study of Huangpi in Wuhan, China. Comput. Environ. Urban Syst. 2019, 74, 218–228. [Google Scholar] [CrossRef]
  19. Wu, J.; Zhang, W.; Zhou, Z. Construction resource allocation for industrial solid waste treatment centers in cities of Anhui Province, China. Manag. Environ. Qual. Int. J. 2019, 30, 1190–1202. [Google Scholar] [CrossRef]
  20. Zheng, D.; Shi, M. Industrial land policy, firm heterogeneity and firm location choice: Evidence from China. Land Use Policy 2018, 76, 58–67. [Google Scholar] [CrossRef]
  21. Lin, Z.; Vlachos, I.; Ollier, J. Prioritizing destination attributes for optimal resource allocation: A study of Chinese tourists visiting Britain. J. Travel Tour. Mark. 2018, 35, 1013–1026. [Google Scholar] [CrossRef]
  22. Behera, N.K.; Behera, M.D. Predicting land use and land cover scenario in Indian national river basin: The Ganga. Trop. Ecol. 2020, 61, 51–64. [Google Scholar] [CrossRef]
  23. Wang, Z.; Yang, J.; Deng, X.; Lan, X. Optimal Water Resources Allocation under the Constraint of Land Use in the Heihe River Basin of China. Sustainability 2015, 7, 1558–1575. [Google Scholar] [CrossRef] [Green Version]
  24. Santé, I.; Crecente, R. LUSE, a decision support system for exploration of rural land use allocation: Application to the Terra Chá district of Galicia (N.W. Spain). Agric. Syst. 2007, 94, 341–356. [Google Scholar] [CrossRef]
  25. Zheng, W.; Ke, X.; Xiao, B.; Zhou, T. Optimising land use allocation to balance ecosystem services and economic benefits—A case study in Wuhan, China. J. Environ. Manage. 2019, 248, 109306. [Google Scholar] [CrossRef]
  26. Zarei, A.; Dadashpoor, H.; Amini, M. Determination of the optimal land use allocation pattern in Nowshahr County, Northern Iran. Environ. Dev. Sustain. 2016, 18, 37–56. [Google Scholar] [CrossRef]
  27. Liu, Y.; Liu, D.; Liu, Y.; He, J.; Jiao, L.; Chen, Y.; Hong, X. Rural land use spatial allocation in the semiarid loess hilly area in China: Using a Particle Swarm Optimization model equipped with multi-objective optimization techniques. Sci. China Earth Sci. 2012, 55, 1166–1177. [Google Scholar] [CrossRef]
  28. Ma, X.; Zhao, X. Land Use Allocation Based on a Multi-Objective Artificial Immune Optimization Model: An Application in Anlu County, China. Sustainability 2015, 7, 15632–15651. [Google Scholar] [CrossRef] [Green Version]
  29. Zhang, H.; Zeng, Y.; Jin, X.; Shu, B.; Zhou, Y.; Yang, X. Simulating multi-objective land use optimization allocation using Multi-agent system—A case study in Changsha, China. Ecol. Model. 2016, 320, 334–347. [Google Scholar] [CrossRef]
  30. Duangjai, W.; Schmidt-Vogt, D.; Shrestha, R.P. Farmers’ land use decision-making in the context of changing land and conservation policies: A case study of Doi Mae Salong in Chiang Rai Province, Northern Thailand. Land Use Policy 2015, 48, 179–189. [Google Scholar] [CrossRef]
  31. Zhang, J.; Xu, Q.; Rao, Y.; Fu, M. Government, enterprise and resident: Roles of local agents in regulating and simulating built-up land use and change in a mining city. Land Use Policy 2017, 67, 222–238. [Google Scholar] [CrossRef]
  32. Liu, Y.; Liu, Y.; Chen, Y.; Long, H. The process and driving forces of rural hollowing in China under rapid urbanization. J. Geogr. Sci. 2010, 20, 876–888. [Google Scholar] [CrossRef]
  33. Liu, Y.; Yang, Y.; Li, Y.; Li, J. Conversion from rural settlements and arable land under rapid urbanization in Beijing during 1985–2010. J. Rural Stud. 2017, 51, 141–150. [Google Scholar] [CrossRef]
  34. Liu, D.; Zheng, X.; Wang, H. Land-use Simulation and Decision-Support system (LandSDS): Seamlessly integrating system dynamics, agent-based model, and cellular automata. Ecol. Model. 2020, 417, 108924. [Google Scholar] [CrossRef]
  35. Wang, H.; Li, W.; Huang, W.; Nie, K. A Multi-Objective Permanent Basic Farmland Delineation Model Based on Hybrid Particle Swarm Optimization. ISPRS Int. J. Geo-Inf. 2020, 9, 243. [Google Scholar] [CrossRef] [Green Version]
  36. Murray-Rust, D.; Brown, C.; van Vliet, J.; Alam, S.J.; Robinson, D.T.; Verburg, P.H.; Rounsevell, M. Combining agent functional types, capitals and services to model land use dynamics. Environ. Model. Softw. 2014, 59, 187–201. [Google Scholar] [CrossRef]
  37. An, L.; Zvoleff, A.; Liu, J.; Axinn, W. Agent-Based Modeling in Coupled Human and Natural Systems (CHANS): Lessons from a Comparative Analysis. Ann. Assoc. Am. Geogr. 2014, 104, 723–745. [Google Scholar] [CrossRef]
  38. Song, M.; Chen, D. A comparison of three heuristic optimization algorithms for solving the multi-objective land allocation (MOLA) problem. Ann. GIS 2018, 24, 19–31. [Google Scholar] [CrossRef] [Green Version]
  39. Liu, T.; Huang, D.; Tan, X.; Kong, F. Planning consistency and implementation in urbanizing China: Comparing urban and land use plans in suburban Beijing. Land Use Policy 2020, 94, 104498. [Google Scholar] [CrossRef]
  40. Bartkowski, B.; Beckmann, M.; Drechsler, M.; Kaim, A.; Liebelt, V.; Müller, B.; Witing, F.; Strauch, M. Aligning Agent-Based Modeling With Multi-Objective Land-Use Allocation: Identification of Policy Gaps and Feasible Pathways to Biophysically Optimal Landscapes. Front. Environ. Sci. 2020, 8, 103. [Google Scholar] [CrossRef]
  41. Chang, Y.-C.; Ko, T.-T. An interactive dynamic multi-objective programming model to support better land use planning. Land Use Policy 2014, 36, 13–22. [Google Scholar] [CrossRef] [Green Version]
  42. Xu, H.; Liu, B.; Fang, Z. New grey prediction model and its application in forecasting land subsidence in coal mine. Nat. Hazards 2014, 71, 1181–1194. [Google Scholar] [CrossRef]
  43. Strauch, M.; Cord, A.F.; Pätzold, C.; Lautenbach, S.; Kaim, A.; Schweitzer, C.; Seppelt, R.; Volk, M. Constraints in multi-objective optimization of land use allocation—Repair or penalize? Environ. Model. Softw. 2019, 118, 241–251. [Google Scholar] [CrossRef]
  44. Li, Y.; Chen, Y.; Zhao, M.; Zhai, X. Optimization of Planning Layout of Urban Building Based on Improved Logit and PSO Algorithms. Complexity 2018, 2018, 9452813. [Google Scholar] [CrossRef]
  45. Zhang, Y.; Bi, Z.; Zhang, X.; Yu, Y. Influence of Landscape Pattern Changes on Runoff and Sediment in the Dali River Watershed on the Loess Plateau of China. Land 2019, 8, 180. [Google Scholar] [CrossRef]
Figure 1. Location of Guanlin town.
Sustainability 15 01401 g001
Figure 2. The analysis framework of the study.
Sustainability 15 01401 g002
Figure 3. (ac) The actual data and the optimal allocation results. (a) actual data in 2015, (b) optimal allocation result in 2015, (c) optimal allocation result in 2030.
Sustainability 15 01401 g003aSustainability 15 01401 g003b
Table 1. Initial weights assigned to decisions of agents.
Rural Land-Use Type (j)Agent Types (ai)
GovernmentEntrepreneursTown ResidentsFarmers
cultivated land0.50.200.3
aquaculture surface0.50.200.3
rural residential land0.50.200.3
town residential land0.60.20.20
enterprise land0.60.400
ecological land1000
other land1000
Table 2. Decisions made by the government with respect to the rural land use of specifically restricted areas.
Restricted AreasDetails
basic cultivated land protection zonetraditional agricultural plots; characteristic agricultural areas
town built-up areaagglomeration settlements; the high-end cable industry section, research and development industry section, new chemical industry section, wire and cable industry
ecological protection areaecological buffer zones; ecological corridors
Table 3. Decision variables and values assigned to their parameters according to behavior of the entrepreneurs in land selection.
Target LayerCriterion LayerIndex Layer
VariableParameterVariableParameter
Entrepreneurs site selection A1Regional traffic B110.539, 0Proximity to resources C1010.088, 3
Proximity to market C1020.290, 5
Peripheral road conditions C1030.160, 2
Industry factor B120.297, 2Land cost C1040.127, 4
Labor cost C1050.091, 4
Energy and power cost C1060.078, 4
Economic factor B130.163, 8Urbanized economy C1070.048, 6
Localized economy C1080.082, 9
Market size C1090.032, 2
Table 4. Decision variables and values assigned to their parameters according to behavior of town residents in land selection.
Target LayerCriterion LayerIndex Layer
VariableParameterVariableParameter
Town residential land site selection
A2
Regional traffic B210.297, 2Distance to original residence C2010.018, 5
Distance to the nearest school C2020.047, 9
Distance to the nearest hospital C2030.077, 8
Distance to the nearest supermarket C2040.123, 7
Distance to the nearest river and green space C2050.029, 3
Community environment B220.163, 8Security level C2060.068, 2
Greening rate of community C2070.042, 9
Public facilities perfection C2080.016, 1
Social class structure C2090.010, 2
Property management level C2100.026, 4
Housing situation B230.539, 0Housing cost C2110.134, 1
Building area C2120.055, 2
Building quality C2130.204, 5
Building structure C2140.086, 5
Housing appreciation potential C2150.023, 4
Housing developer Brand C2160.035, 3
Table 5. Decision variables and values assigned to their parameters according to the behavior of farmers in land selection.
Target LayerCriterion LayerIndex Layer
VariableParameterVariableParameter
Cultivated land site selection A3Regional condition B310.251, 8Distance to residential land C3010.069, 8
Distance to farmland C3020.117, 3
Distance to river C3030.040, 5
Distance to village road C3040.024, 2
Facilities condition B320.159, 3Irrigation facility C3050.085, 8
Drainage facility C3060.047, 4
Flood control and diversion C3070.026, 1
Land quality B330.588, 9Natural quality C3080.317, 4
Use quality C3090.175, 1
Economic quality C3100.096, 4
Aquaculture surface site selection A4Regional condition B410.539, 0Distance to residential land C4010.033, 6
Distance to aquaculture land C4020.224, 4
Distance to load C4030.141, 1
Distance to market C4040.053, 1
Distance to wharf and town C4050.086, 8
Water condition B420.297, 2Headwater condition C4060.160, 2
Water-quality condition C4070.088, 3
Underwater quality C4080.048, 7
Surrounding environment B430.163, 8Natural environment C4090.088, 3
Infrastructure condition C4100.026, 8
Transaction environment C4110.048, 7
Rural residential land site selection A5Traffic and region B510.539, 0Distance to primary school C5010.055, 2
Distance to county market C5020.134, 1
Distance to health-center C5030.035, 3
Distance to town center C5040.023, 4
Distance to contracted land C5050.204, 5
Distance to residence C5060.086, 5
Facilities condition B520.297, 2Drinking water facility C5070.138, 4
Waste treatment facility C5080.082, 4
Cultural infrastructure C5090.028, 5
Recreational Facility C5100.047, 9
Surrounding environment B530.163, 8Green land area C5110.016, 1
neighborly relation C5120.010, 2
Security situation C5130.026, 4
Sanitary condition C5140.042, 9
Air-quality condition C5150.068, 2
Table 6. Optimization objectives calculated with respect to various land-use types. (unit: million Chinese Yuan).
Optimal Objectives (to Be Maximized)Cultivated LandAquaculture SurfaceRural Residential LandTown Residential LandEnterprise LandEcological LandOther Land
economic revenue231,481.52266,238.4274,037.582,200,352.007,902,817.6059,187.285575.80
basic living security159.99271.762878.062529.24107,645.1410.290.22
employment security3.067.4768.50105.00335.710.000.00
ecosystem service function20.80.540.260.250.593.860.30
Table 7. Numerical constraints as applied to various land-use types in 2015 and 2030 (km2).
Rural Land-Use TypeNumerical Restrictions in 2015Numerical Restrictions in 2030
Lower ValueUpper ValueLower ValueUpper Value
cultivated land 33.16 29.12
aquaculture surface9.4310.8410.8216.58
rural residential land6.927.156.456.99
town residential land5.767.076.887.62
enterprise land13.1517.2415.9317.24
ecological land25.7329.1220.3526.32
other land 5.98 8.77
Table 8. Areas and proportions of the different rural land-use type in Guanlin town. Actual and modelled results are compared.
Rural Land-Use TypeActual Conditions in 2015Optimal Allocation Results in 2015Optimal Allocation Results in 2030
Area (km2)Proportion (%)Area (km2)Proportion (%)Area (km2)Proportion (%)
cultivated land34.0432.1435.1233.1629.3927.75
aquaculture surface10.8210.2211.0910.4716.2815.38
rural residential land6.926.537.246.836.496.13
town residential land6.886.496.786.407.016.62
enterprise land15.9315.0514.2013.4116.3015.39
ecological land25.7324.3025.3823.9724.0922.75
other land5.585.276.105.766.345.98
Table 9. Optimal weights for decisions on land use made by various agents after model operations.
Rural Land-Use TypeAgent Types
GovernmentEntrepreneursTown ResidentsFarmers
cultivated land0.530.1300.34
aquaculture surface0.540.1000.36
rural residential land0.530.1400.33
town residential land0.610.120.270
enterprise land0.590.360.050
ecological land1000
other land1000
Disclaimer/Publisher’s Note: The statements, opinions and data contained in all publications are solely those of the individual author(s) and contributor(s) and not of MDPI and/or the editor(s). MDPI and/or the editor(s) disclaim responsibility for any injury to people or property resulting from any ideas, methods, instructions or products referred to in the content.

