Article

Failure Mode Analysis of Bridge Pier Due to Eccentric Impact Based on Separation of Pier and Beam

School of Civil Engineering, Jiangxi University of Engineering, Xinyu 330046, China
*
Author to whom correspondence should be addressed.
Sustainability 2023, 15(2), 1435; https://doi.org/10.3390/su15021435
Submission received: 7 December 2022 / Revised: 5 January 2023 / Accepted: 11 January 2023 / Published: 12 January 2023

Abstract

:
By considering the near-field vertical seismic spectrum and calculating the change in vertical contact force between the main beam and the pier, the possible vertical separation contact condition of a bridge is deduced. By calculating the extreme value of the pier–beam vertical contact force and the longitudinal deformation of the pier under the structural separation, the influence of the separation on the failure of the pier is determined. Separation increases the risk of pier failure under compression, bending, and shear, and different separation times lead to different longitudinal responses from the pier, and the first failure mode is different. Therefore, it is of great significance to reasonably design bridges near faults.

1. Introduction

As the main bearing component of a bridge, damage to the pier not only destroys traffic, but also affects rescue after a disaster [1,2]. Near-fault earthquakes not only have great velocity pulse effects; in addition, the proportion of vertical earthquake and horizontal earthquake exceeds the standard 2/3. These seismic features can affect the failures of piers [3,4].
Many scholars have carried out a series of studies on bridge structure damage caused by near-fault earthquakes. Jiang and Yang [5,6] used the vulnerable surface model to study the sensitive regions under different damage states and discuss the mechanism of structural brittleness changes caused by earthquake damage. Furthermore, many scholars have studied the influence of vertical seismic action on bridge structures. Sung [7] took the Santa Monica bridge as the research object and compared the experiment with the Zeus-NL hybrid simulation method to study the influence of axial force changes on the bridge structure. Rodrigues [8] applied different two-way horizontal loads and variable axial forces to reinforced concrete columns through experiments, and the test results showed that the horizontal deformation of concrete columns under irregular axial forces was less than under constant pressures. Quantitative studies have been carried out on the effects of tomography on complex structural anomalies [9,10,11]. Zuo and Yang [12,13] studied and developed a near-fault pulse seismic ductility spectrum based on machine learning and put forward suggestions for the seismic design of structures in near-fault areas. Zhong [14,15,16] analyzed the vulnerability of bridges through algorithms considering a near-field earthquake, especially pulse excitation. The above studies considered the situation of bridge impairment under bidirectional excitation for different models and obtained some results. However, for vertical seismic excitation, the numerical value specified in the code is more used for analysis, ignoring the large vertical excitation in the near-fault area.
In China, most girder bridges adopt rubber bearings, which lack tensile capacity. A near-fault vertical earthquake can cause the separation of the girder and the support. For the bridge collision, the current stage mainly considers the transverse adjacent beam collision [17], while the research on the vertical collision is less. The vertical collision is close to the beam rod collision. Ruan [18] analyzed the dynamic behavior of a moving free beam impacting the tip of a cantilever beam using the modal approximation technique; however, this collision condition belongs to a single collision, and the actual situation is that the pier and beam have multiple separation contacts. Yang [19] used theoretical methods to solve the vertical impact force of the pier beam under multiple separation conditions. However, Yang’s study only considered the vertical excitation and ignored the horizontal displacement of the bridge caused by the separation, and the analysis of collision process takes the structure as a whole. When the compressive stiffness of the bearing is low, the calculated force is unreasonable. The authors of [20,21] analyzed the influence of separation on the failure of a bridge pier under vertical and longitudinal excitation, but did not provide a qualitative discussion on separation conditions and only considered the flexural failure of the bridge pier.
In this study, the influences of pier–beam separation on bridge force and the displacement response are calculated by establishing a reliable theoretical method for dynamic bridge response. By using the mode superposition method [22], we calculate the limit solution of the vertical impact force of the pier beam and the longitudinal deformation of the pier top after the first pier–beam separation. Through calculation, we analyze the bridge separation under different excitation frequencies and amplitudes, and study the influence of dynamic response changes caused by separation on the failure mode of the bridge pier.

2. Structural Model

This paper mainly studies the separation of a pier and a beam and the impact of the separation on pier failure, which lays a foundation for the study of the combined influence of multispan structures in the future. Therefore, a double-span prestressed box girder bridge was selected in this paper, as shown in Figure 1. Both ends of the main beam are hinged with the ground, and the pier bottom is fixed. The displacements of horizontal excitation and vertical excitation are D(t) and B(t), respectively. The axial stiffness of the bearing is K C and the shear stiffness is K V . Three assumptions have been made, as follows:
(1)
It is assumed that the structure is permanently elastic, and the plastic effect is ignored;
(2)
It is assumed that the bridge is rigidly connected to the ground, and the coupling effect of soil and foundation is ignored;
(3)
Vertical and longitudinal dynamic responses are calculated separately, ignoring the coupling effect between them.

3. Bridge Dynamic Response Calculation

3.1. Vertical Dynamic Response

The vertical dynamic response of the bridge refers to [20,21]. Near-fault earthquakes may contain pulse-type earthquakes, which transfer most of the energy of the ground motion to structures in a short time. The impulse excitation is usually expressed as the superposition of two or more simple excitations, including rectangular excitation, sinusoidal excitation, and triangular excitation, as shown in Figure 2. To study the influence of different forms of pulse excitation on the vertical dynamic response of a bridge under vertical pulse excitation, the impulse of three kinds of pulse excitation is the same.
When the impulse generated by the three kinds of pulse excitation is the same, the ratio of the peak force is p 1 : p 1 : p 1 = 2 / π : 1 : 4 / π . For different levels of pulse excitation, B ¨ ( τ ) is
B ¨ ( τ ) = { 2 π α max rectangular   excitation α max × sin ω 0 τ sin usoidal   excitation 8 α max τ π t d triangle   excitation , 0   <   τ 0.5 t d 8 α max π t d ( t d τ ) triangle   excitation , 0.5 t d < τ t d
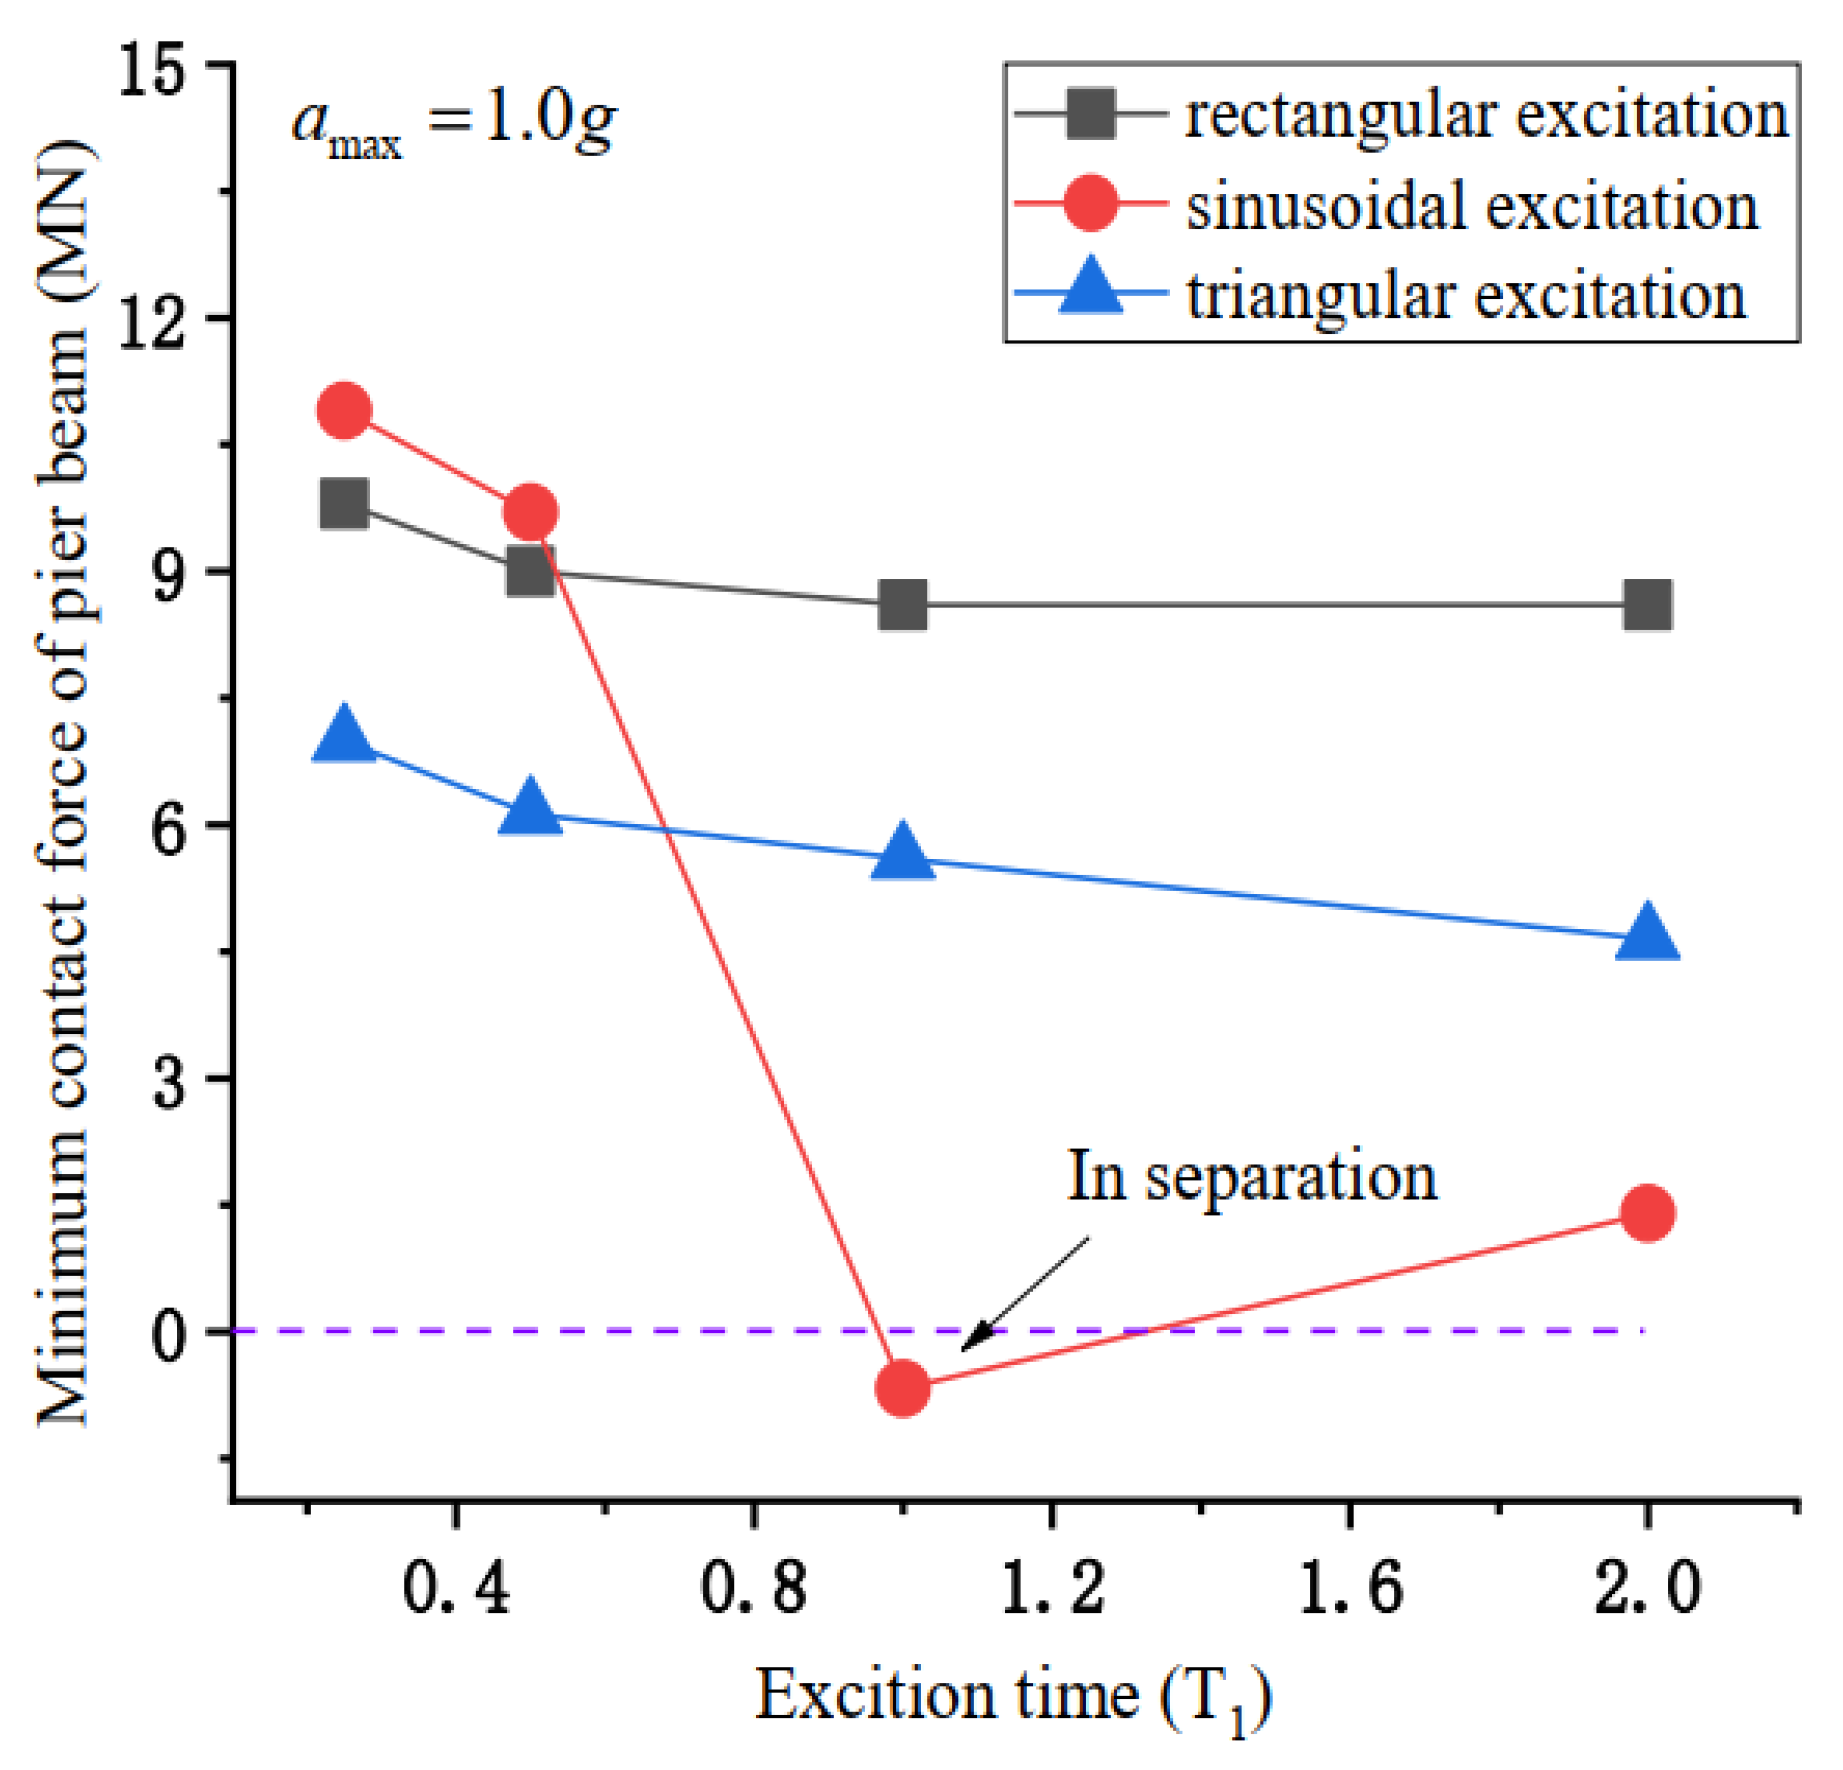
Figure 3 shows the relationship between pier–beam vertical contact force and excitation conditions. The range of excitation duration is 0.25 ~ 2 T 1 , and the range of excitation acceleration amplitude is 0.25~1.0 g. The value T 1 is the vertical first-order natural period of the bridge. Under the rectangular pulse excitation, the contact force changes the least. When the pulse excitation time exceeds T 1 , the contact force remains unchanged, and the minimum contact force is 8.6 MN. Under triangular pulse excitation, the vertical dynamic response of the pier beam increases monotonically with the increase in excitation duration and amplitude of excitation acceleration. When the excitation duration is 2 T 1 and the excitation acceleration amplitude is 1.0 g, the minimum contact force is 4.3 MN.
Under sinusoidal pulse excitation, the length of the pulse excitation and the amplitude of the excitation acceleration have more influence on the vertical dynamic response than rectangular and triangular pulse excitation. When the pulse excitation duration is T 1 , the vertical contact force is the lowest, which is because the vertical pulse excitation frequency is equal to the natural vertical frequency at this time. The resonance causes the vertical dynamic response of the bridge to surge. When the pulse excitation duration is T 1 , the vertical contact force is −0.58 MN, which means that the vertical separation of the pier beam occurs at this time.
According to the vertical dynamic responses of different pulse excitation forms, it can be concluded that the vertical separation is most easily caused by sinusoidal pulse excitation. However, a single sinusoidal pulse causes a significant excitation acceleration requirement for the pier–beam separation, which exceeds the specification. At the same time, the pulse excitation lasts for a short time, while the periodic excitation can last for a long time. When the excitation frequency is close to the natural vertical frequency, there is a large dynamic response. Next, the dynamic response of the bridge is analyzed theoretically by simple harmonic excitation.
For the near-fault seismic response, the maximum value of the acceleration response spectrum is concentrated in the range T = 0.1~0.5 s. The high-order frequency has little influence on the excitation response of the structure. According to the conventional engineering calculation, the first five orders of the modal truncation of the dynamic response are taken.
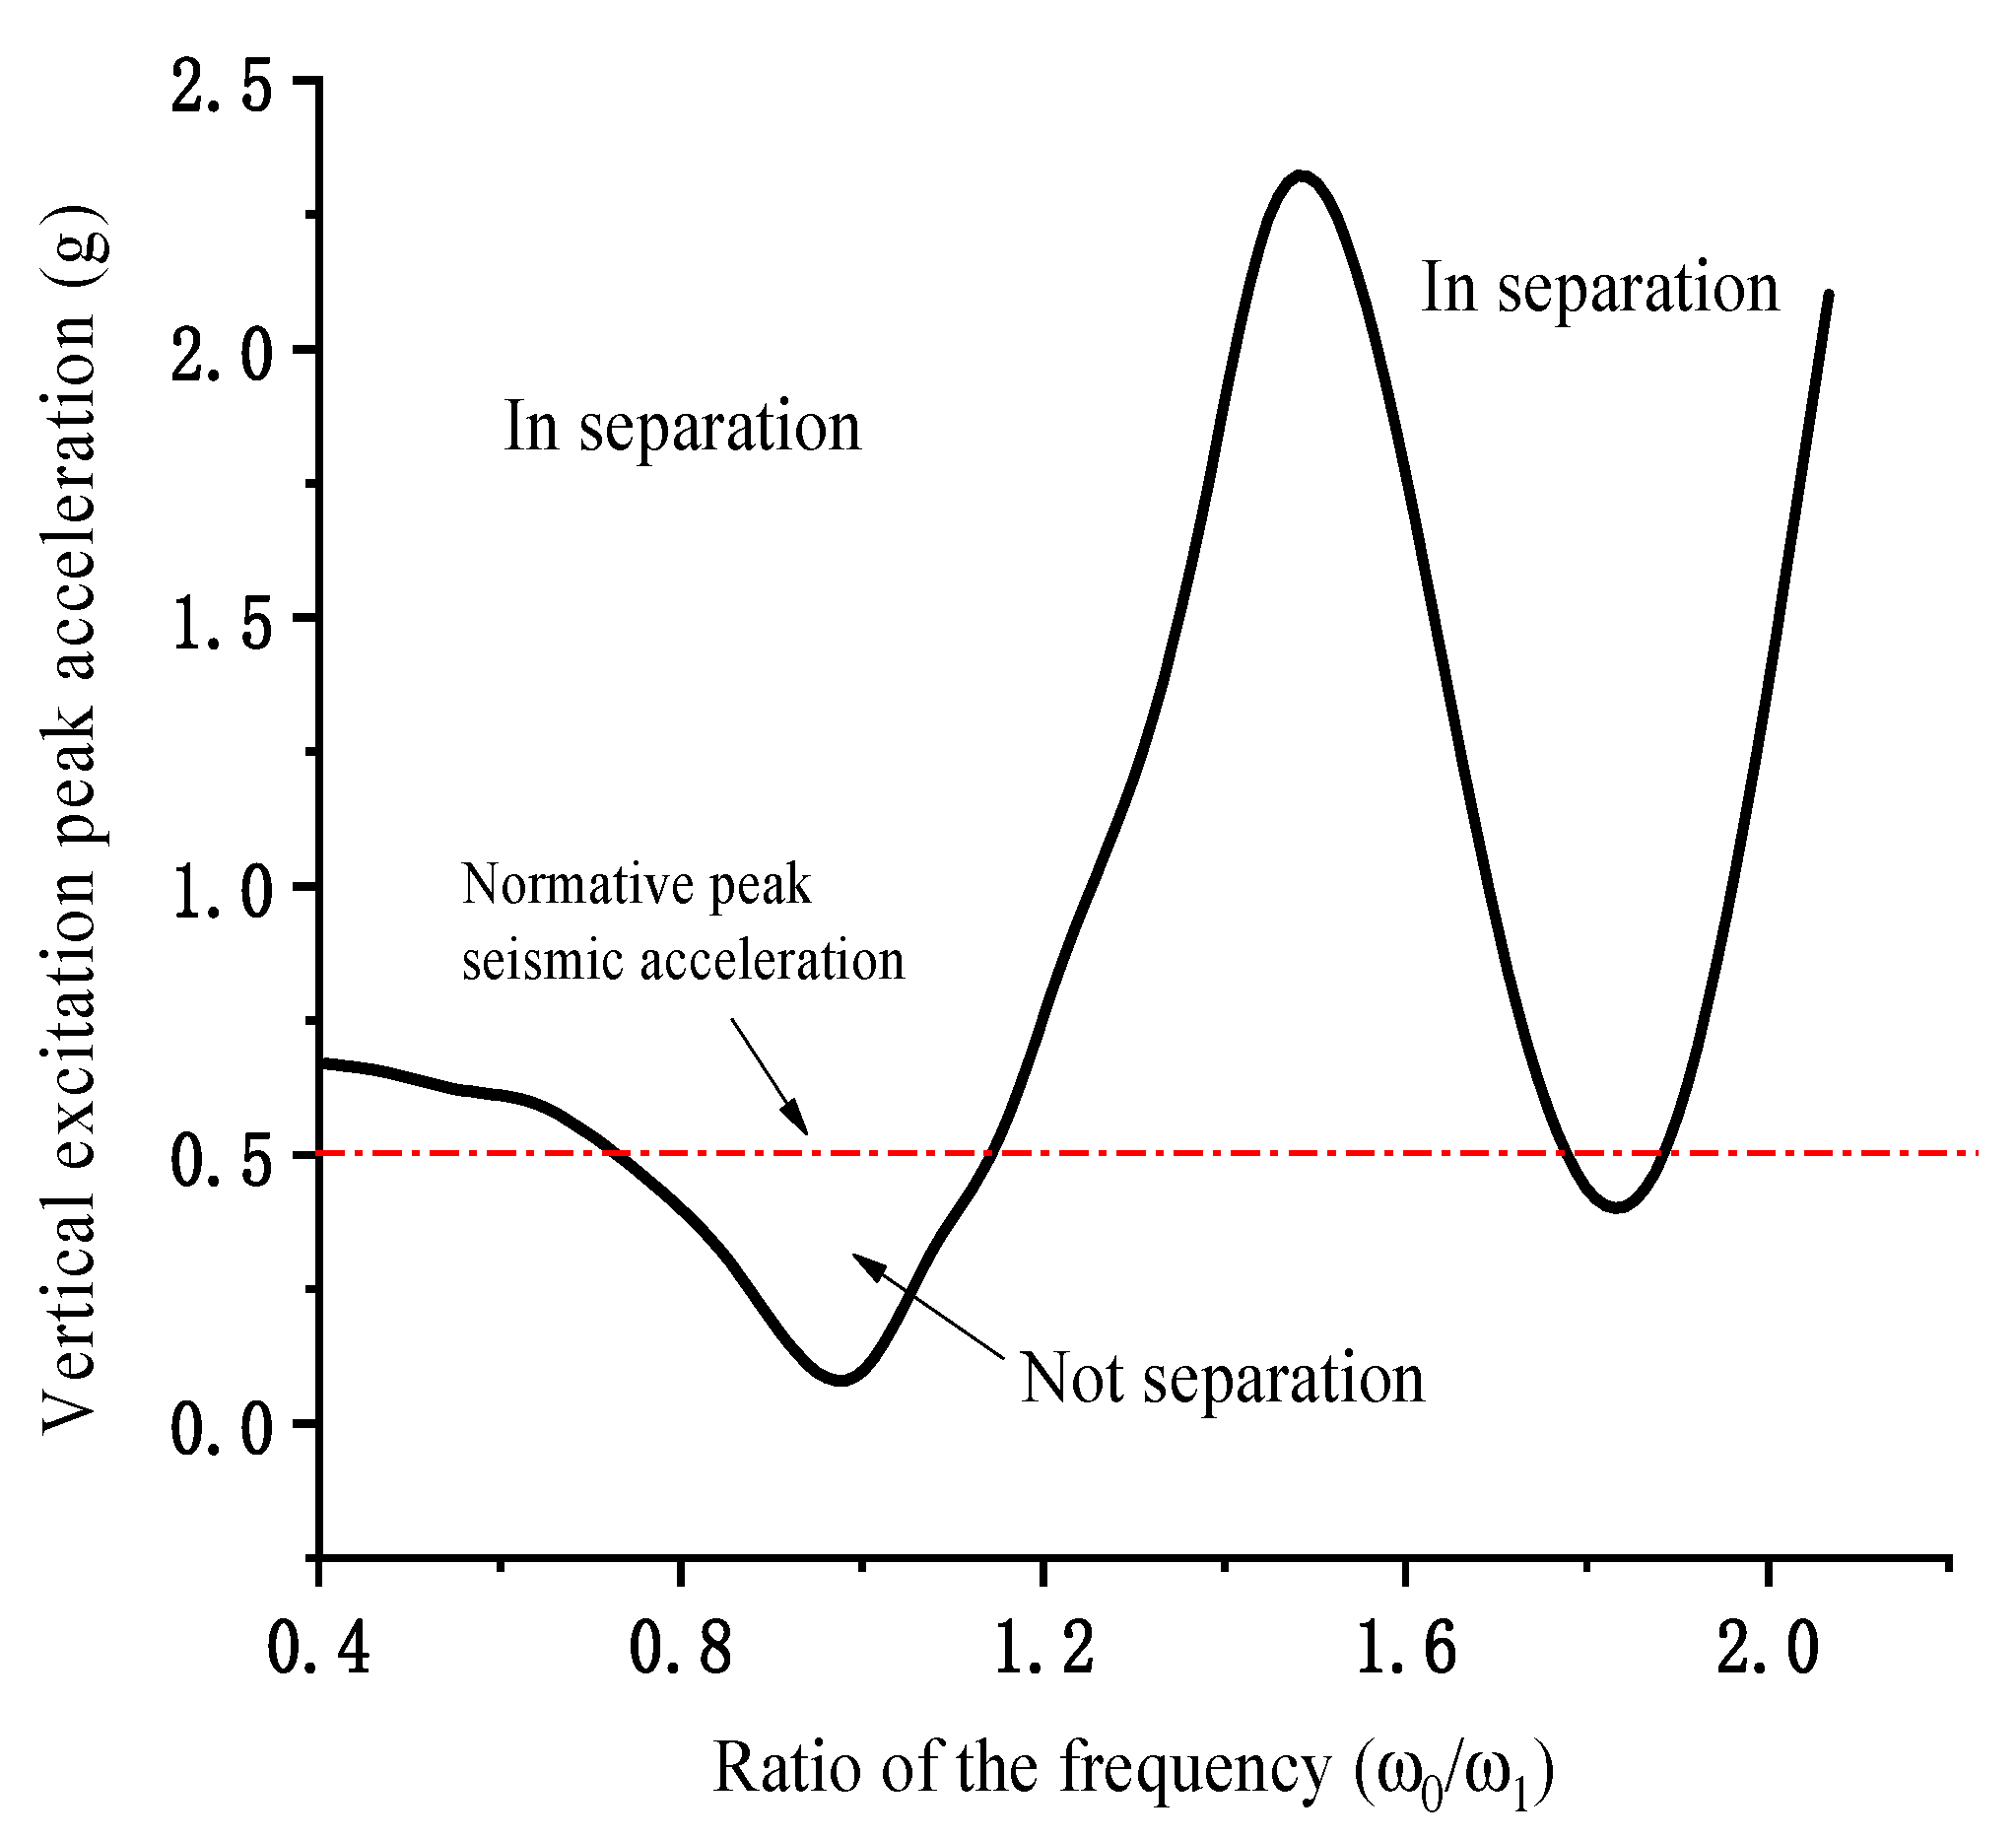
Figure 4 shows the separation of the piers and beams under different excitation frequencies and accelerations. When the ω 1   (vertical first-order natural frequency) is close to the ω 0   (excitation frequency), a slight vertical acceleration results in pier–beam separation. When the ω 0   deviates from the ω 1 , the vertical excitation acceleration required for the separation increases significantly. When ω 0 = 40 rad/s, the vertical excitation acceleration needs to reach 2.2 g to cause pier–beam separation. When the ω 0   is close to the ω 2   (vertical second-order natural frequency), the smaller excitation acceleration also causes pier–beam separation. Compared with the separation interval near the ω 1 , the separation interval of the second-order vertical natural frequency is narrower. The excitation acceleration required for the separation is greater, essentially exceeding the standard value. The separation of the bridge piers and beams mainly occurs when ω 0 ω 1 .
When pier and beam separation occurs, the natural frequency of the structure changes, resulting in a different dynamic response from when there is no separation. When the pier and beam collide in the vertical direction, there may be a large deviation in the longitudinal direction of the pier top. The longitudinal deformation of the pier top directly affects the degree of eccentric vertical collision. Therefore, it is necessary to analyze the extreme value of longitudinal pier deformation under the condition of pier–beam separation.

3.2. Longitudinal Dynamic Response

For the calculation of the longitudinal dynamic response of the bridge, refer to [20,21], where the time of the longitudinal separation is taken as the time of the vertical separation. In actual earthquakes, there is a time difference between horizontal and vertical earthquakes due to their different transmission wave velocities. In addition, many separation–collision phenomena occur during the seismic excitation time. By referring to the longitudinal displacement solution in [20], the theoretical solution of the longitudinal displacement response of a bridge pier after separation can be obtained through calculation, as shown in Equation (2). Because the natural frequency of the pier decreases after separation, the longitudinal deformation of the structure increases. Considering the phase difference, the extreme value of the longitudinal deformation of the bridge pier after separation is the sum of the extreme value of the initial state (the first two terms) and the excitation state (the third term).
W ¯ d ( x , t ) = [ n = 1 5 φ ¯ n r ( ξ ) q n r ( t 1 ) + n = 1 5 A n r B n r ω 0 2 B 0 ( ω 0 2 ω n r 2 ) sin ω 0 t 1 ] cos ω n r ( t t 1 ) + [ n = 1 5 φ ¯ n r ( ξ ) q ˙ n r ( t 1 ) + n = 1 5 A n r B n r ω 0 2 B 0 ω n r ( ω 0 2 ω n r 2 ) ω 0 cos ω 0 t 1 ] ω n r sin ω n r ( t t 1 ) n = 1 5 A n r B n r ω 0 2 B 0 ω n r ( ω 0 2 ω n r 2 ) ω n r sin ω 0 t
Here, φ ¯ n r is the pier wave mode function in the separation phase, q n t is the pier time function in the separation phase, ω 0 is the excitation frequency, ω n r is the pier natural frequency in the separation phase, and A n r and B n r are the correlation coefficients of the wave mode function.
The first part vibrates at the natural frequency of the separated pier, and the amplitude is not affected by the frequency. By calculation, the maximum absolute deformation value is 16.7 mm. The second part vibrates with the natural frequency of the separated pier, and the amplitude is affected by the frequency. By calculation, the maximum absolute deformation value is 32.6 mm. The maximum deformation obtained by the first two calculations is 34.5 mm. The third part vibrates at the excitation frequency. The amplitude is affected by the frequency, and the maximum value is 8.2 mm. Considering the different vibration frequencies of the first, second, and third terms, when considering the separation, the absolute value of the maximum deformation at the top of the pier increases to 42.7 mm, an increase of 120%. This situation is caused by the numerical difference between the   ω n r   and the   ω n   after separation.
Figure 5 shows the longitudinal deformation of the pier top under different excitation frequencies. When the peak excitation acceleration is 0.2 g, the pier and beam are always in contact, and the maximum deformation of the pier top occurs in the interval ω 1 = ω 0 . When the peak excitation acceleration of the excitation is 0.5 g and 0.8 g, vertical excitation causes pier–beam separation. When ω 0 μ 1 , the peak value of the pier roof deformation appears; μ 1 is the first longitudinal natural frequency of the structure.

3.3. Dynamic Response during a Collision

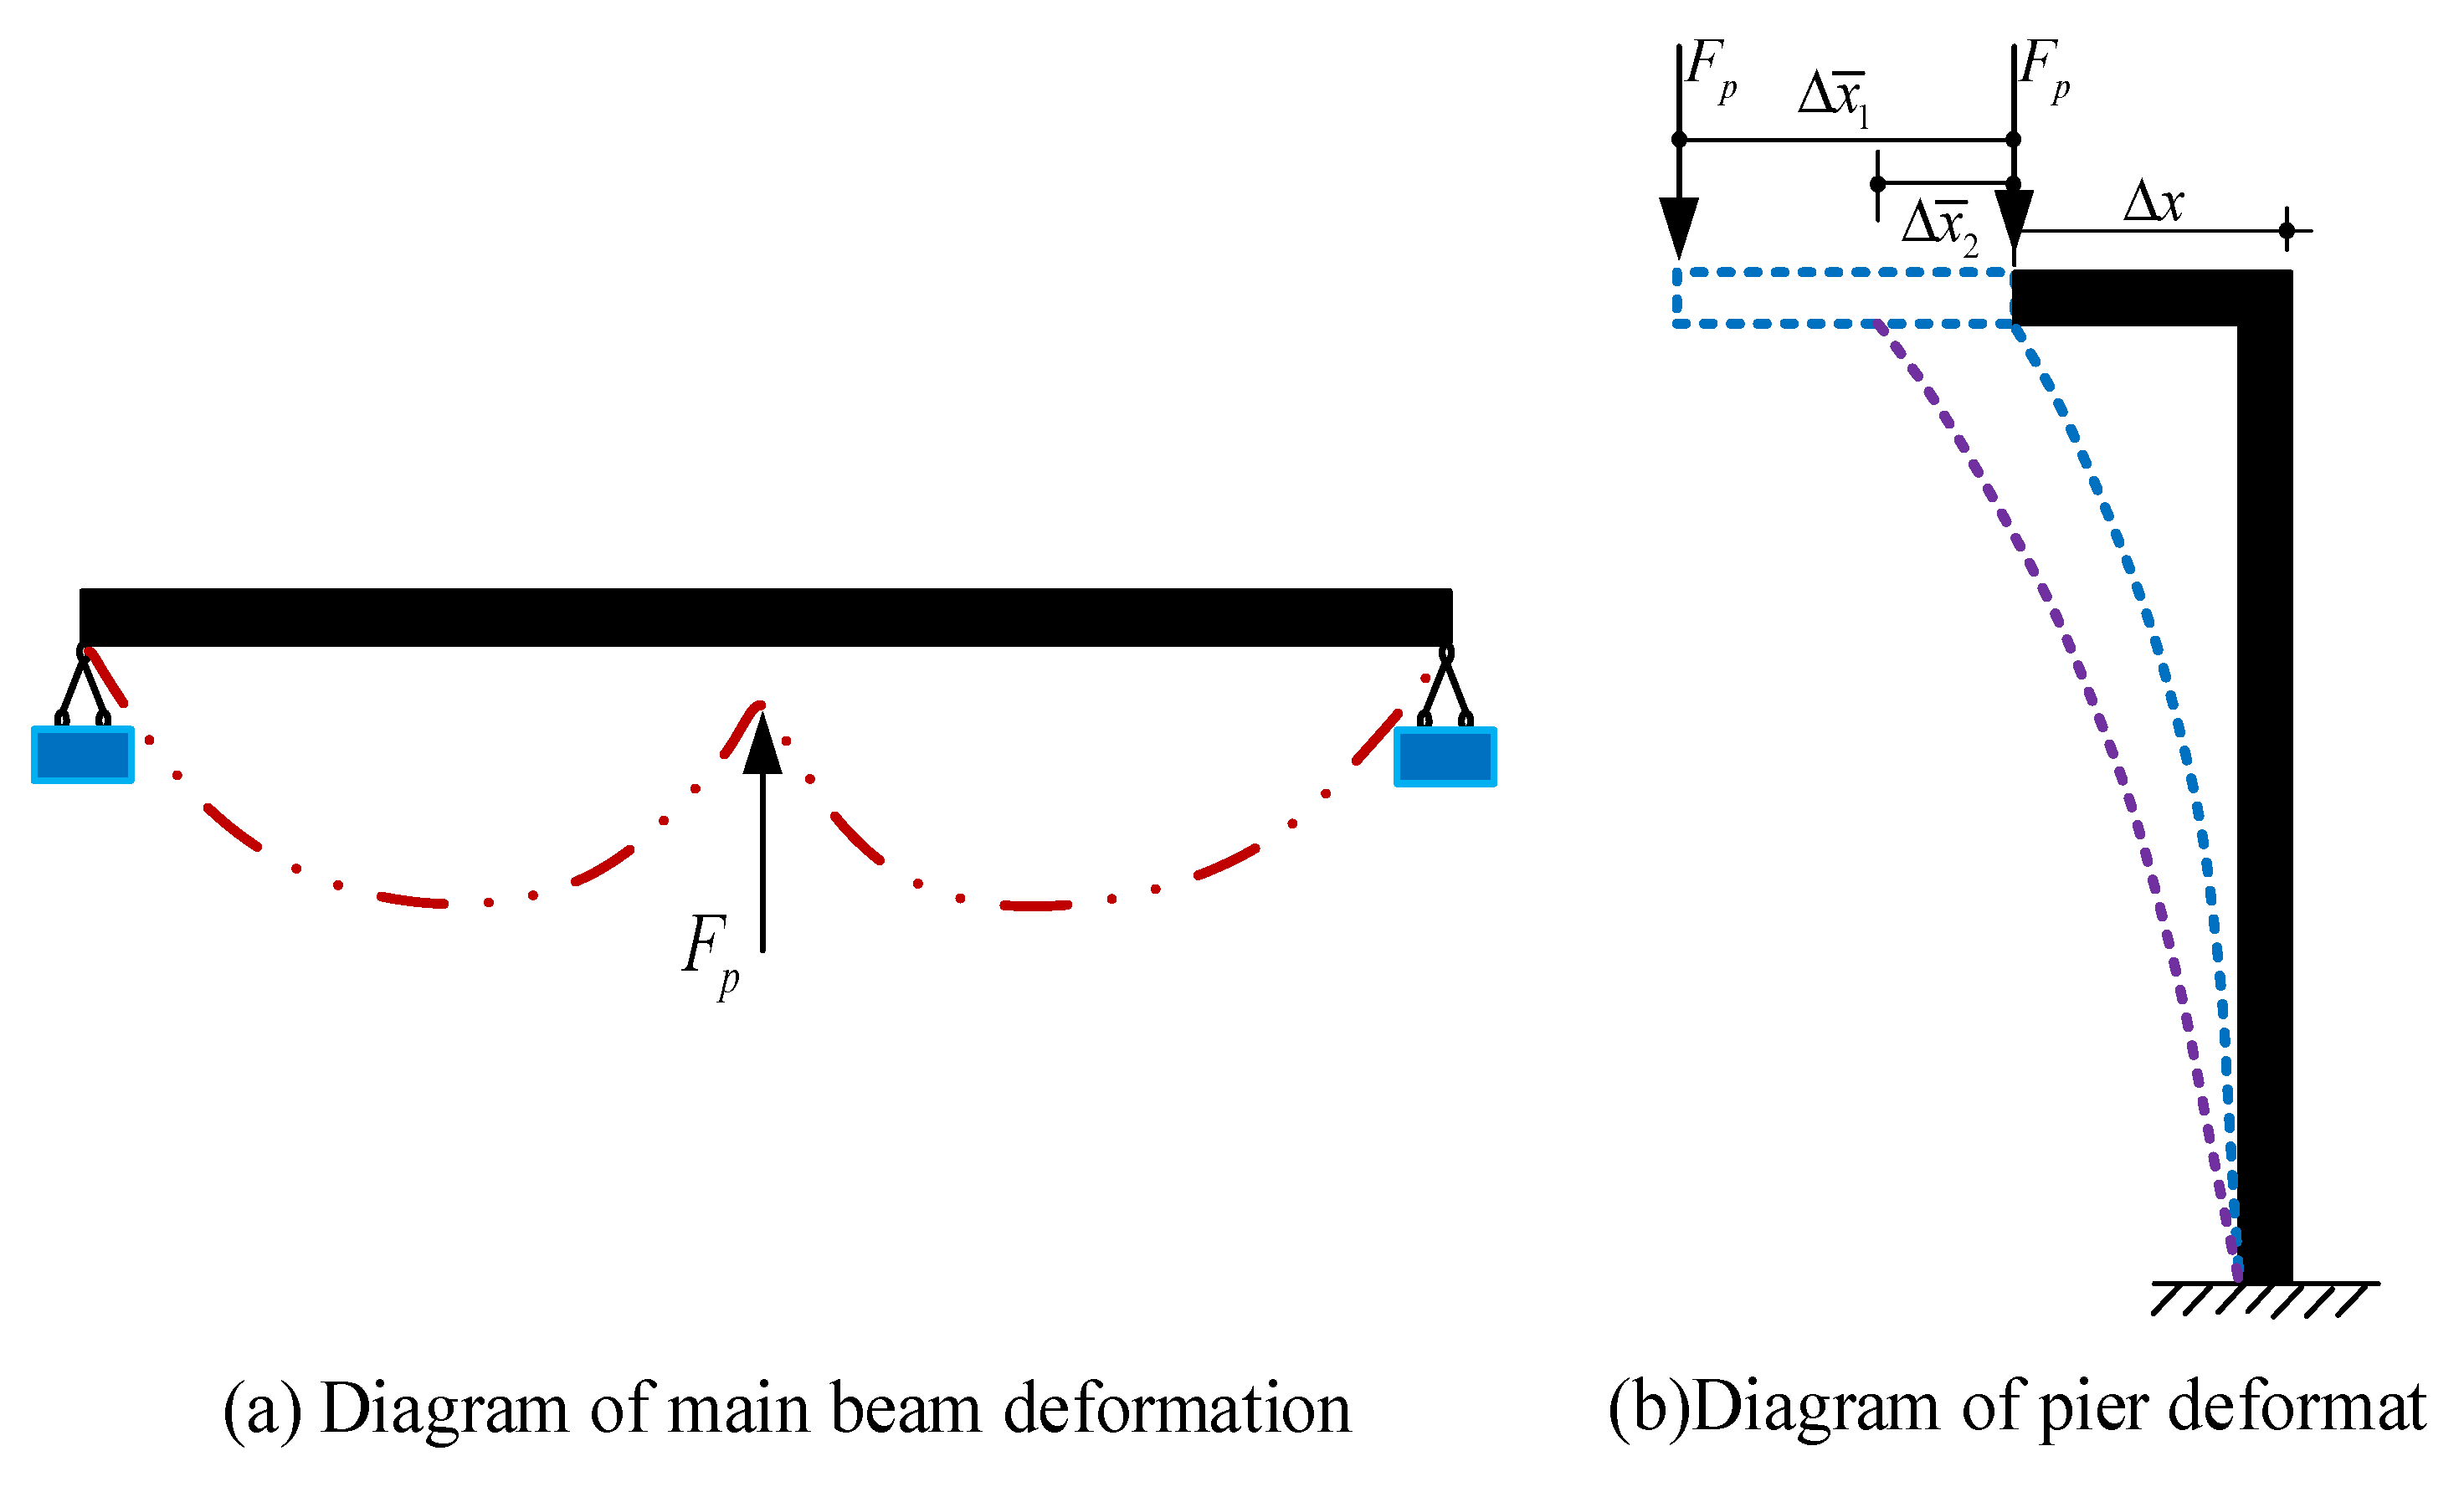
In the previous study, the vertical impact force of the structure was calculated using the model in Figure 6. In the actual collision process, the pier is in a longitudinal bending state. The eccentric distance between the vertical collision position of the pier beam and the pier axis is Δ x . To simplify the calculation, the structural collision model is simplified as Figure 6b. In the process of a vertical collision, the structure is affected by three forces: the vertical collision force, the bearing shear force, and the inertial force of the forced vibration of the piers. The indirect mode method [22] is adopted for the calculation, and the change in the bending strain energy of the bridge pier caused by the initial offset of the bridge pier during collision is ignored.
When the longitudinal deformation of the pier reaches its extreme value, the inertial force of the pier is very small; therefore, it is not urgent to ignore it here. During eccentric collision, the kinetic energy and strain energy of the main beam are converted into the axial compression strain energy of the bearing, and to the bending strain energy of the main beam and the pier. The kinetic energy and bending strain energy of the main beam at the time of collision are
T b = 1 2 L L ρ A b [ n = 1 5 φ ¯ n b ( x ) q ˙ n ( t 1 ) ] 2 d x U b = 1 2 L L E b I b [ n = 1 5 2 φ ¯ n b ( x ) x 2 q n ( t 1 ) ] 2 d x
where t 1 is the initial time of the collision between the main beam and the support.
The vertical collision diagram of the bridge is shown in Figure 7. During the collision, the strain changes of the bridge include the bending strain energy of the main beam and the bending strain energy of the pier.
The strain energy generated by the self-weight of the main beam during the collision process is
W b = L 3 E b I b ( 2 q 2 L 2 15 F p 2 24 )
The strain energy generated by the self-weight of the main beam during the collision process is
W r = H 6 E r I r ( 3 F p 2 η 2 Δ x 2 F v 2 H 2 )
where η is the eccentric impact amplification coefficient; for the coefficient value, we refer to [21]. The value K v is the bearing shear force.
According to the energy conservation in the collision process, it can be concluded that
T b + U b + W b = 1 2 K Δ y 2 + W r
where K = K 1 K 2 K 1 + K 2 .   K 1   is the bearing axial compression stiffness and K 2 is the axial stiffness of the pier.
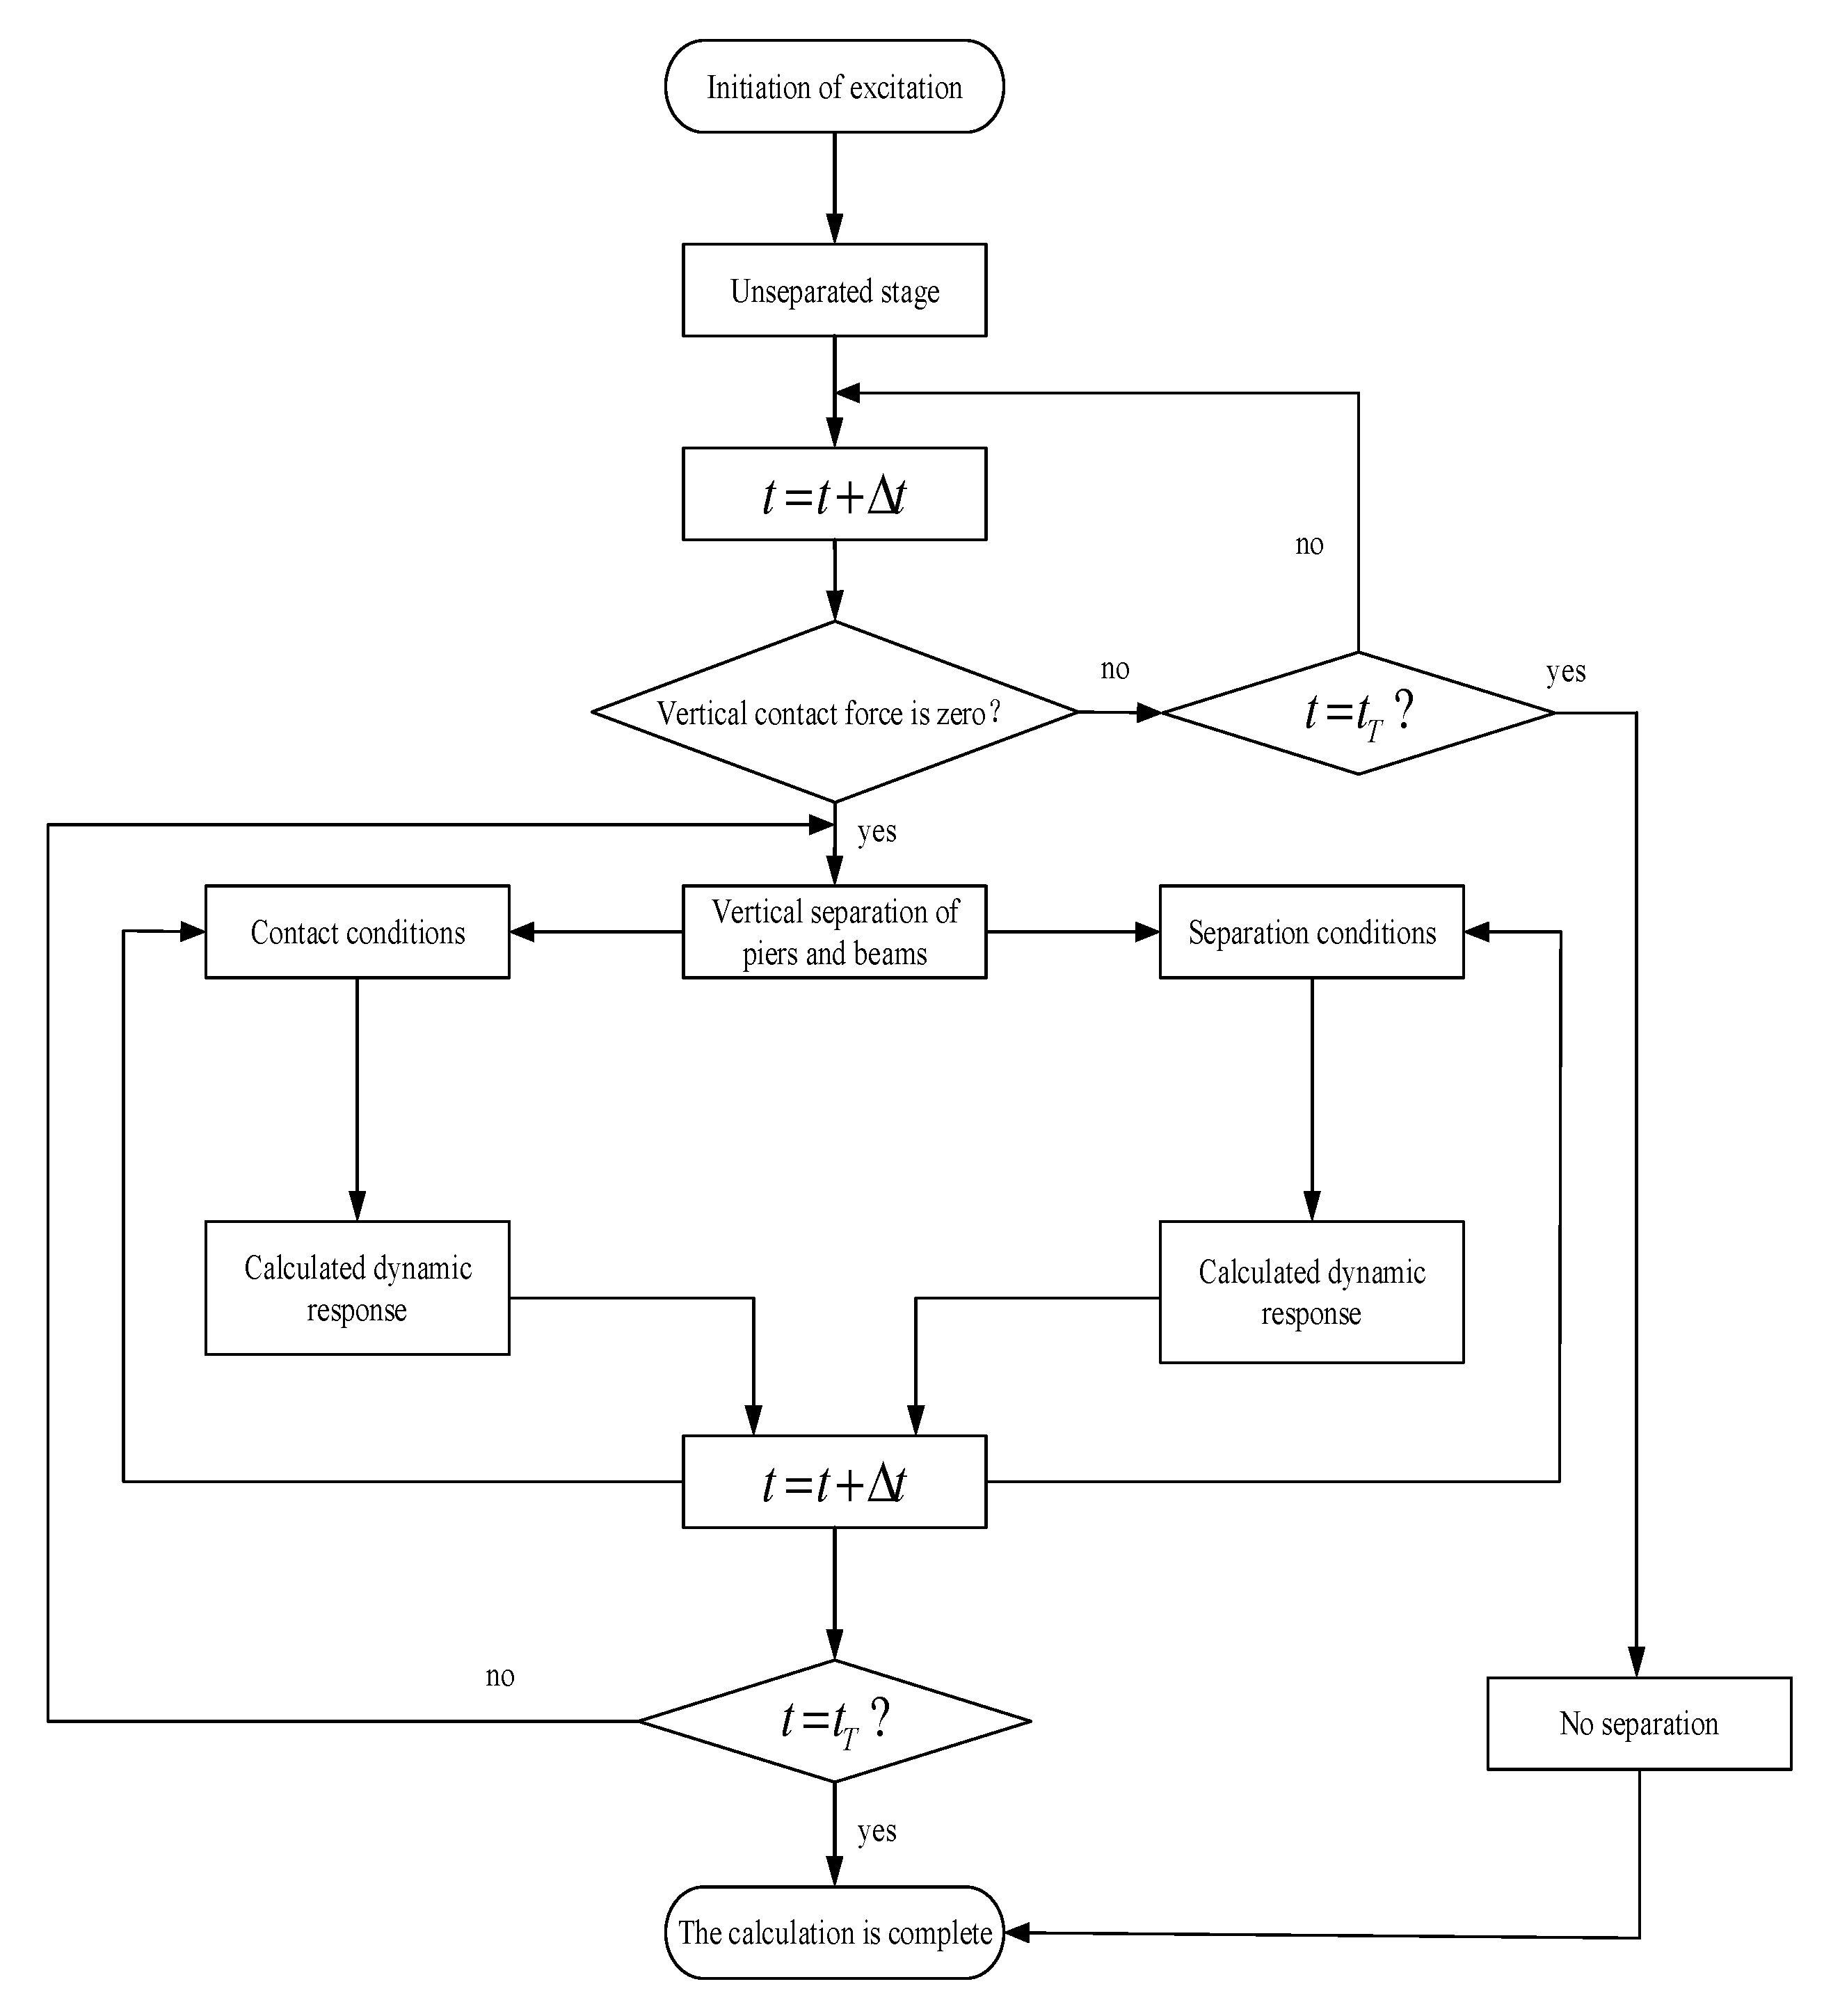
Under specific excitation conditions, piers and beams are separated and vertical collisions occur. The first collision is selected here for study. Figure 8 is the calculation flow chart of the vertical displacement response of the bridge under vertical excitation. When pier–beam separation does not occur, the calculation ends when the calculation time is 2 s. When the vertical contact force of the pier beam is zero, the analysis ends.
To ensure the accuracy of the calculation, an appropriate time-step increment must be selected. For the choice of time-step increment, since it is necessary to clearly express the transmission characteristics of the bending wave and the longitudinal wave in the main beam and pier, the time-step increment should not be too large. The longitudinal wave velocity of the pier is c r = E r / ρ r   = 3492 m/s, and the bending wave velocity of the pier is a r = E r I r / ρ r A r = 1060 m/s. The maximum time-step increment is less than the time taken by the bending wave and the longitudinal wave to pass through the whole pier. A time-step increment of 0.001 s was selected for the calculation.
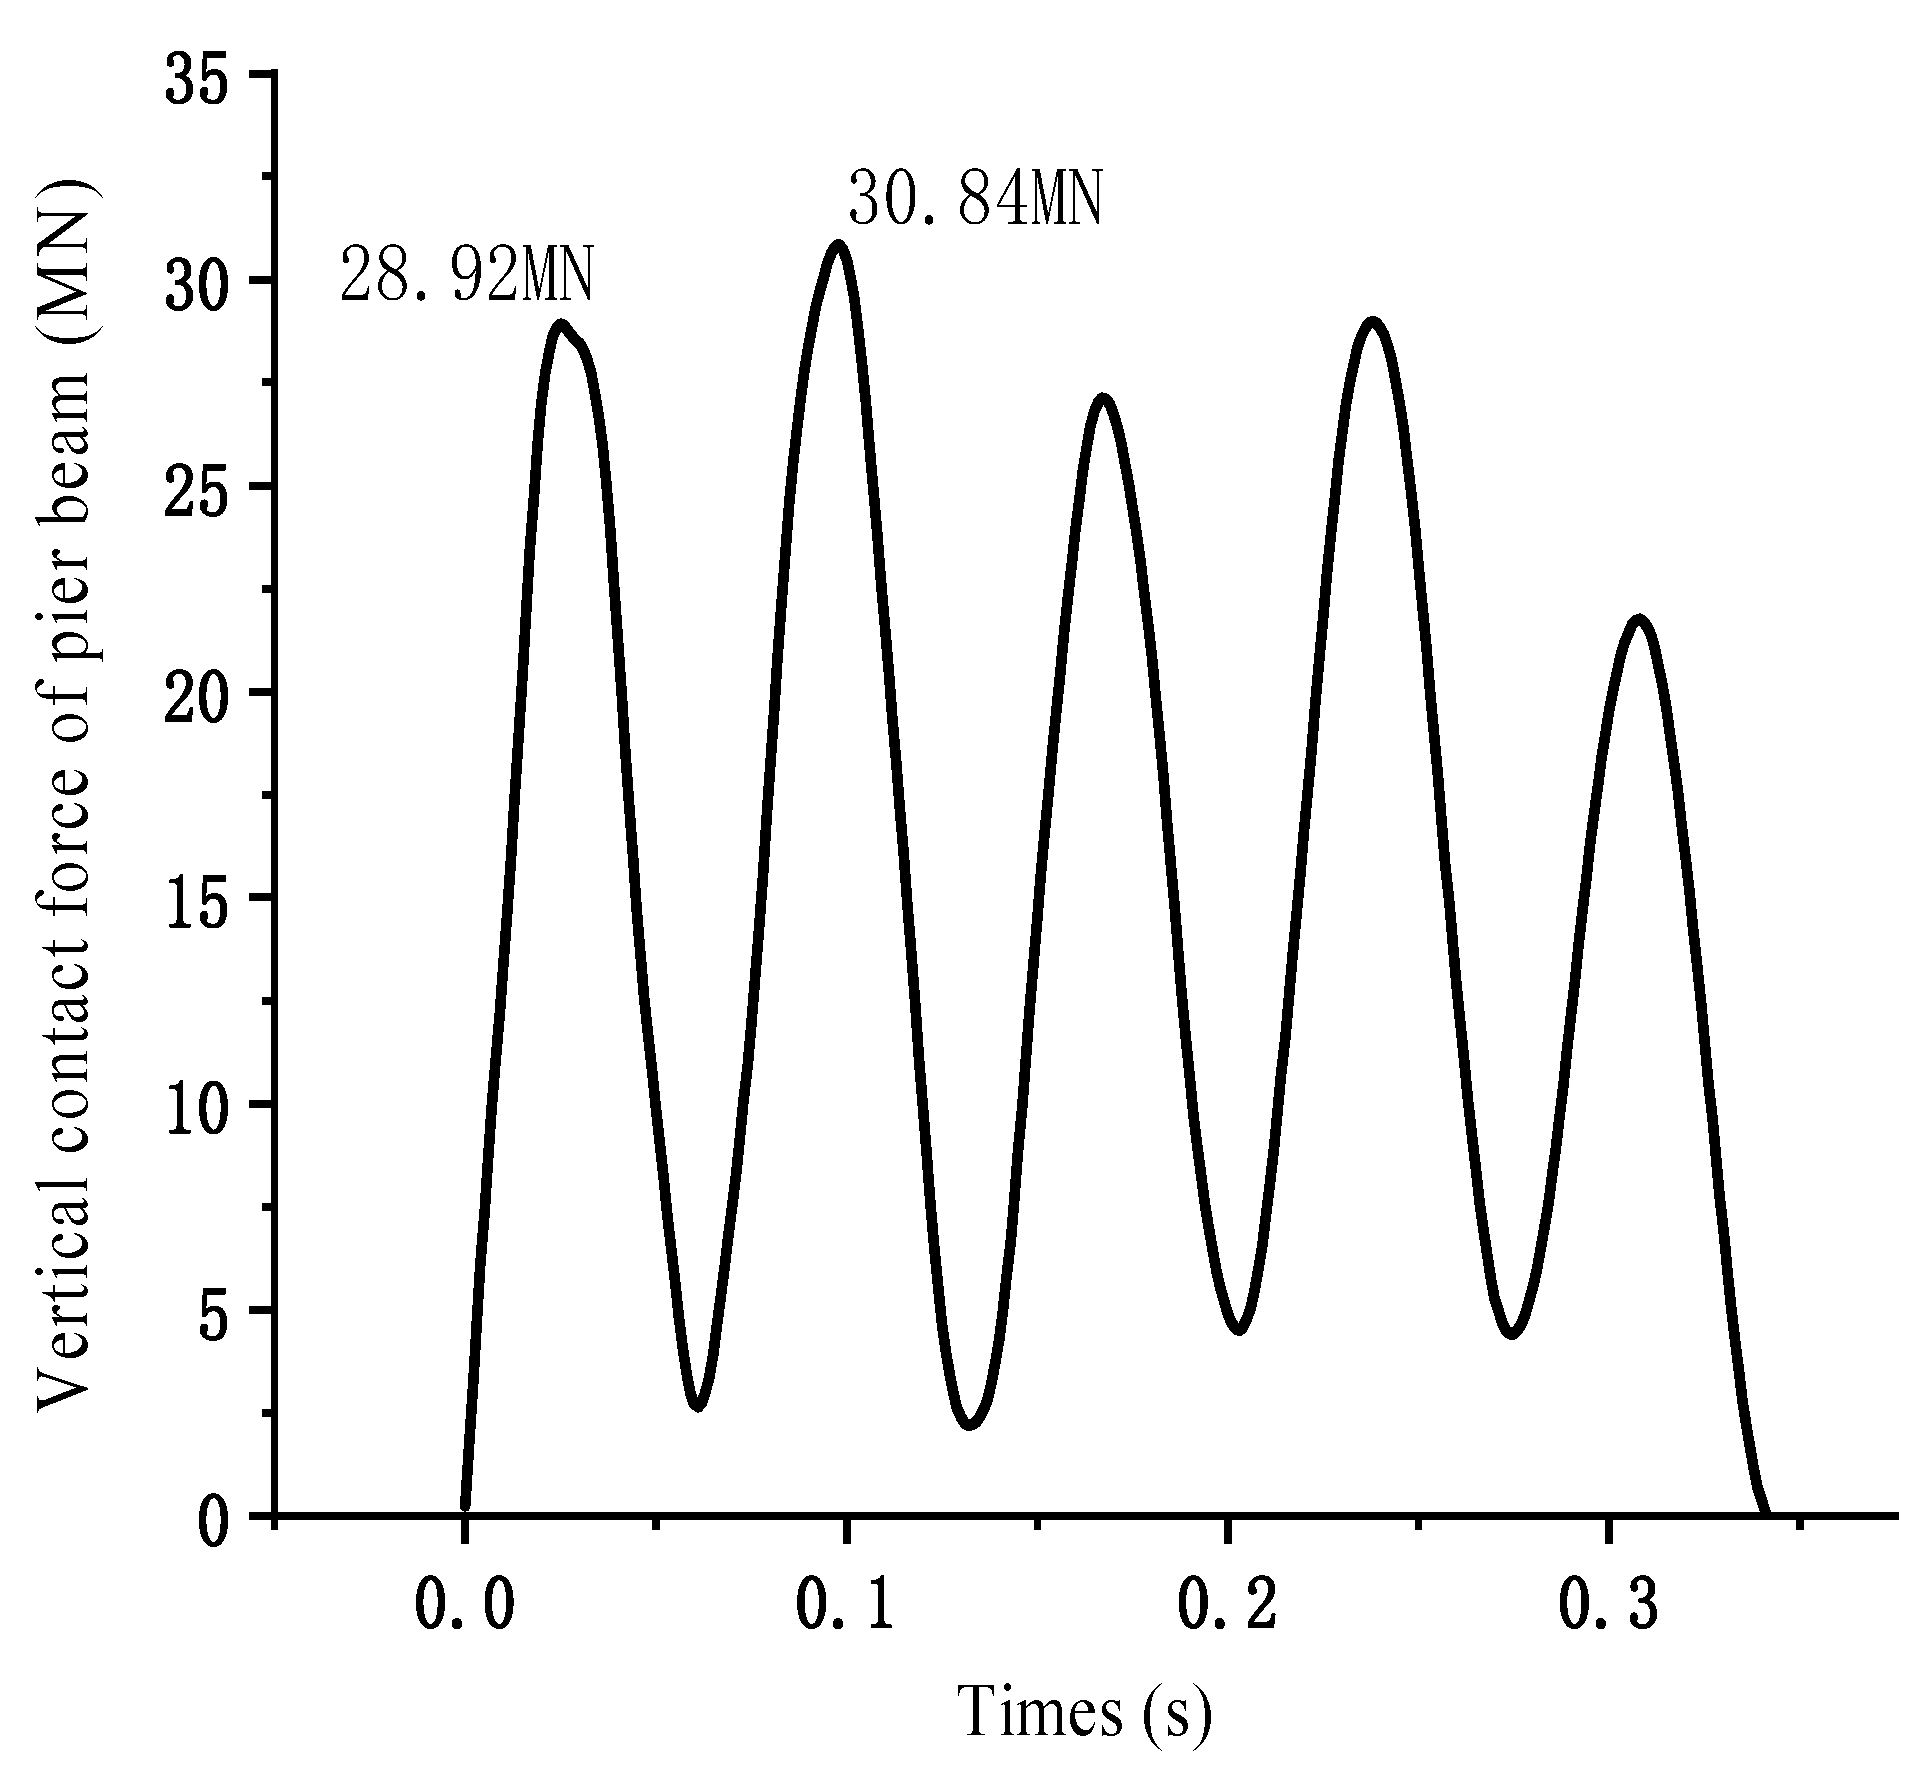
Figure 9 shows the change in the vertical collision force in the process of the first impact of the pier calculated by the indirect mode superposition method [2]. The contact force fluctuates with the first peak of 28.92 MN and the approximate maximum impact force of 30.84 MN. The maximum value does not appear in the first-wave peak because the collision process is also affected by the vertical excitation force vibration.
Figure 10 shows the vertical impact force under different levels of vertical peak excitation acceleration and excitation frequency. From the analysis, we concluded the following: (1) the maximum impact force of the pier beam increases monotonically with the increase in vertical excitation acceleration, and the slight fluctuation in the middle is due to the fact that the upthrow velocity in the middle of the main beam has a certain contingency at the vertical separation moment; (2) the collision mainly occurs when ω 0 ω 1 , and the closer the two frequencies, the greater the collision force; (3) when the excitation frequency/natural vertical frequency is <0.8 or >1.2, the change in excitation frequency has little influence on the maximum impact force of the pier beam.

4. Pier Failure

The previous research only considered the influence of the dynamic response change of the pier top and the increase in the vertical contact force on the bending failure of the pier under separation—collision coupling conditions. However, pier failure includes compression failure, bending failure, and shear failure. Nevertheless, the influence of the change in the dynamic response of bridges caused by separation on the failure mode of bridge piers still requires research.

4.1. Compression Failure

Under longitudinal excitation, a pier is always under eccentric compression. The previous studies indicate that when the excitation frequency is close to the natural vertical frequency of the bridge, the vertical impact force of the pier beam increases monotonically with the increase in the vertical excitation peak value. Moreover, the separation may increase the longitudinal deformation at the top of the pier and affect the allowable pressure of the pier. Three typical seismic waves from Imperial Valley, Northridge, and Kobe were used to analyze the time history of bridge pier damage. The excitation acceleration in the vertical direction is the excitation acceleration in the horizontal direction multiplied by the ratio parameter α(V/H). To simplify the calculation, α = 1 is taken here.
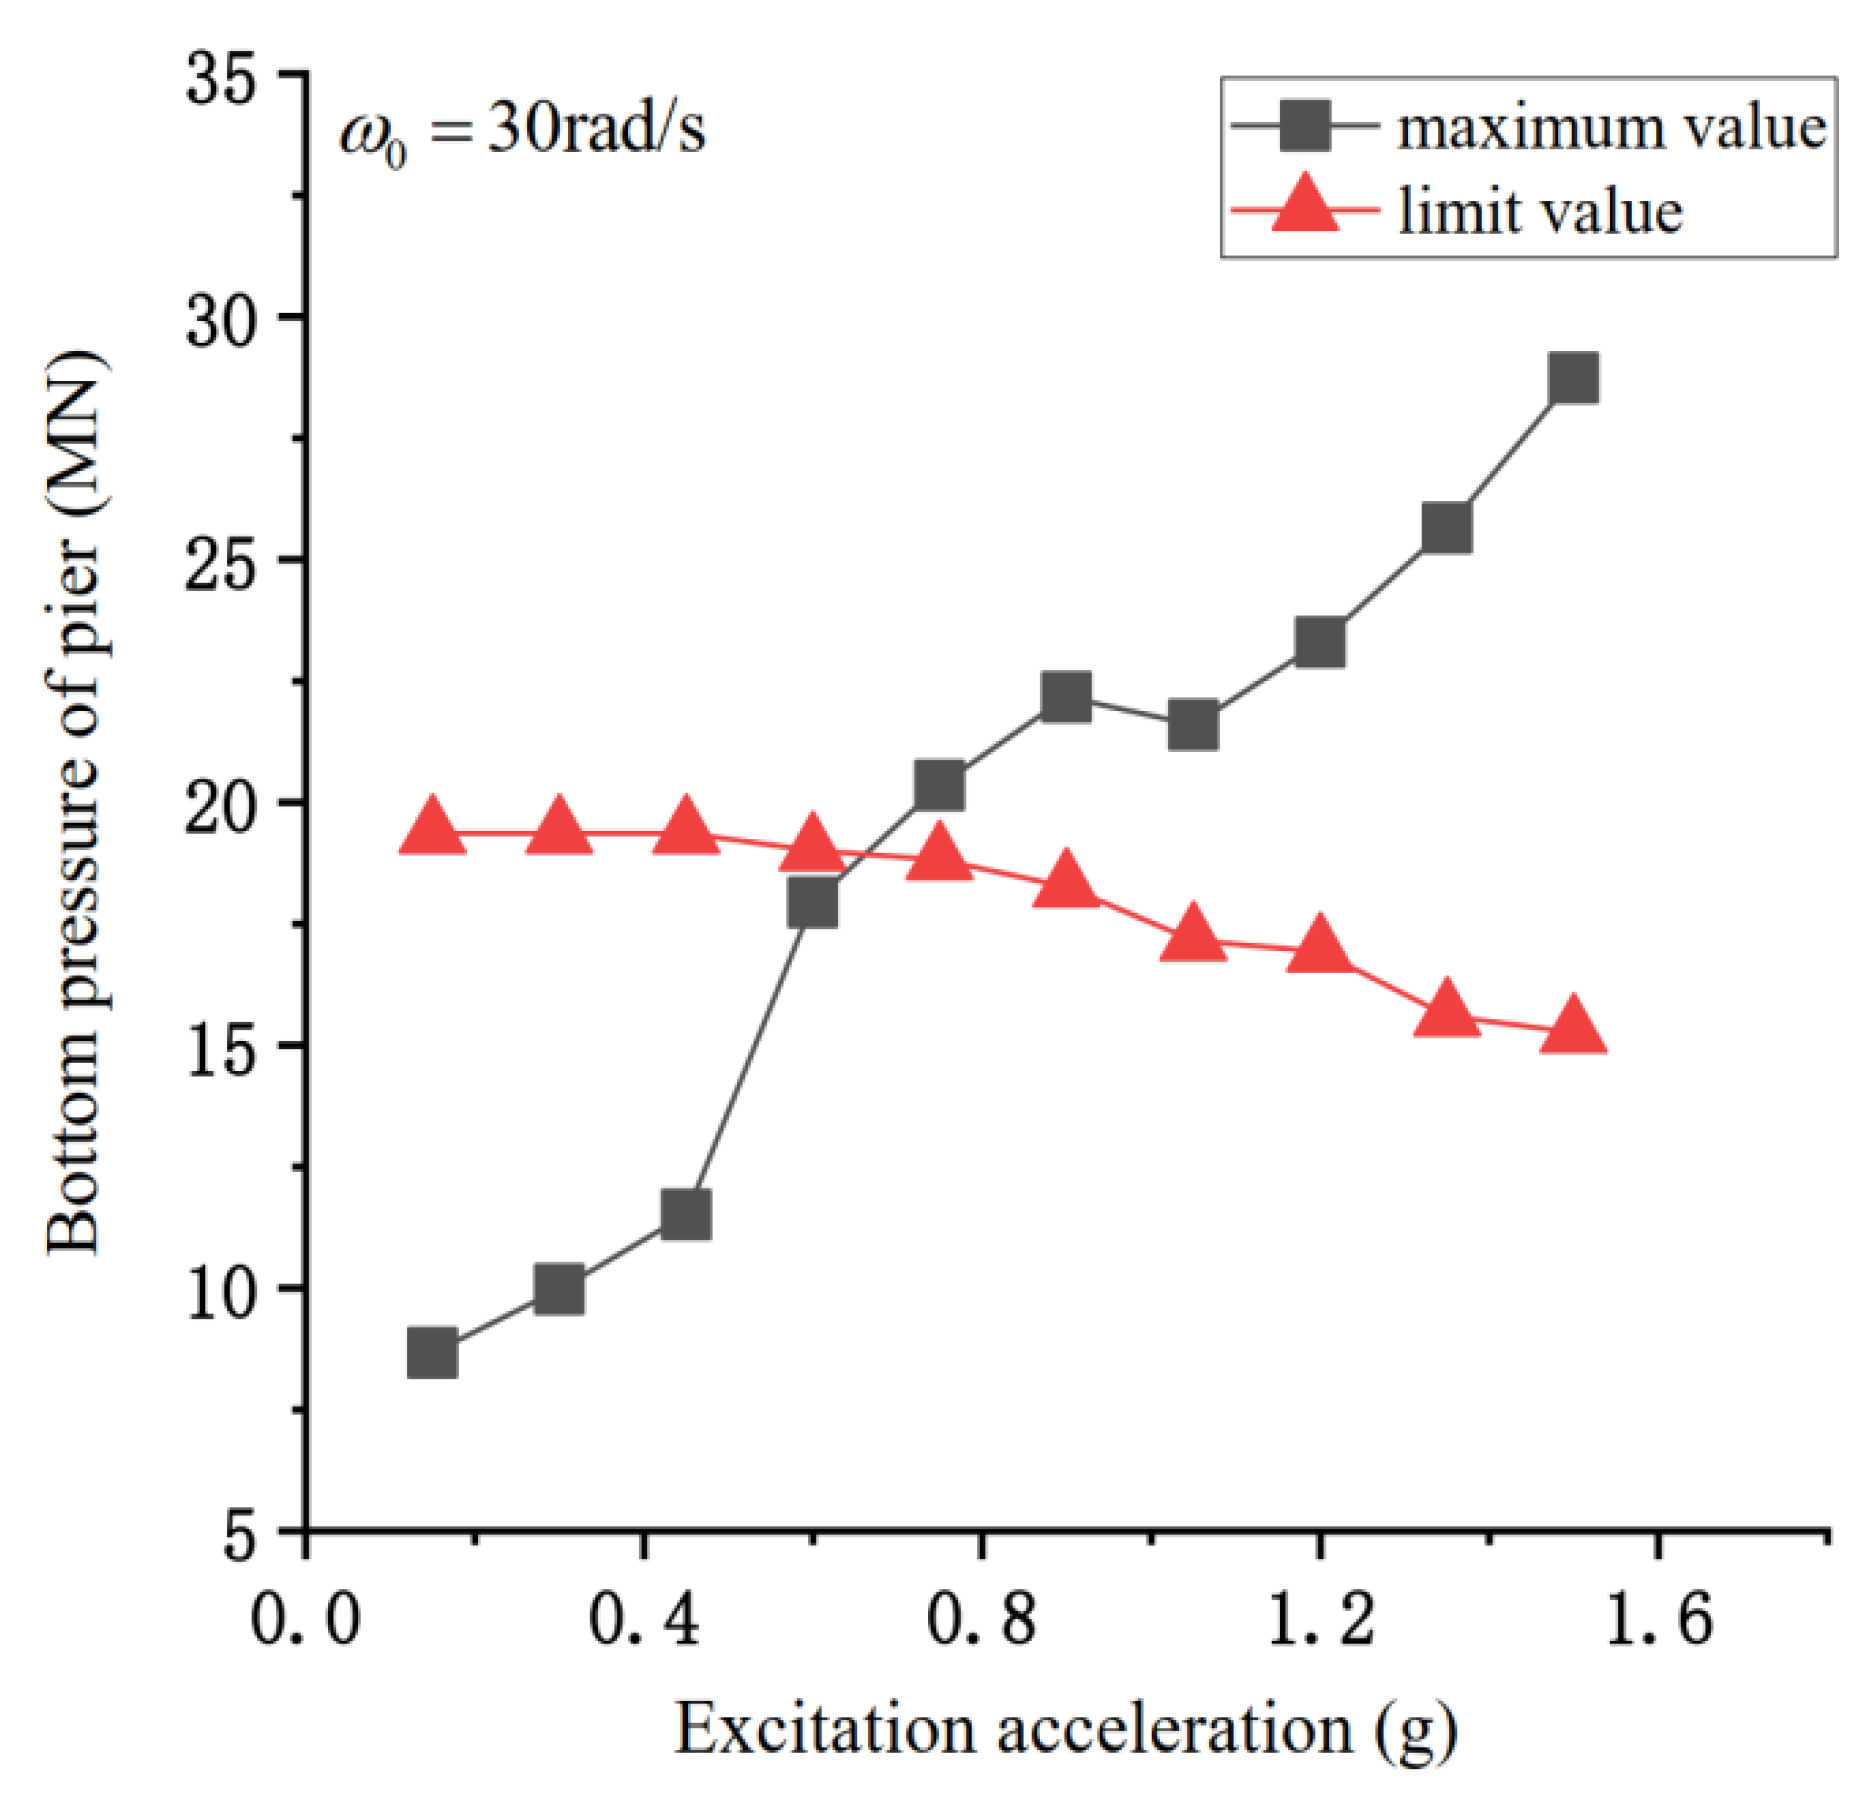
The maximum and allowable pressure at the bottom of the pier under different excitation amplitudes and the maximum pressure at the collision stage adopt the limit solution. In the case of eccentric compression, the bearing capacity of the bridge pier should conform to the requirements of Equation (7), as specified in the code [23].
γ 0 N d n u A f c d
Figure 11 shows the changes in pier bottom pressure under different excitation amplitudes. When the peak excitation acceleration is less than 0.55 g, the vertical contact force increases monotonically. Nevertheless, the longitudinal deformation of the pier top changes little because there is no pier–beam separation. When the excitation peak exceeds 0.55 g, vertical separation occurs, the extreme value of the longitudinal deformation at the top of the pier increases significantly, and the allowable pressure of the pier decreases. With the increase in excitation amplitude, the maximum values of the vertical contact force of the pier beam and the longitudinal deformation of the pier top increase monotonically. When the peak excitation acceleration is 0.65 g, the pier is destroyed under compression.
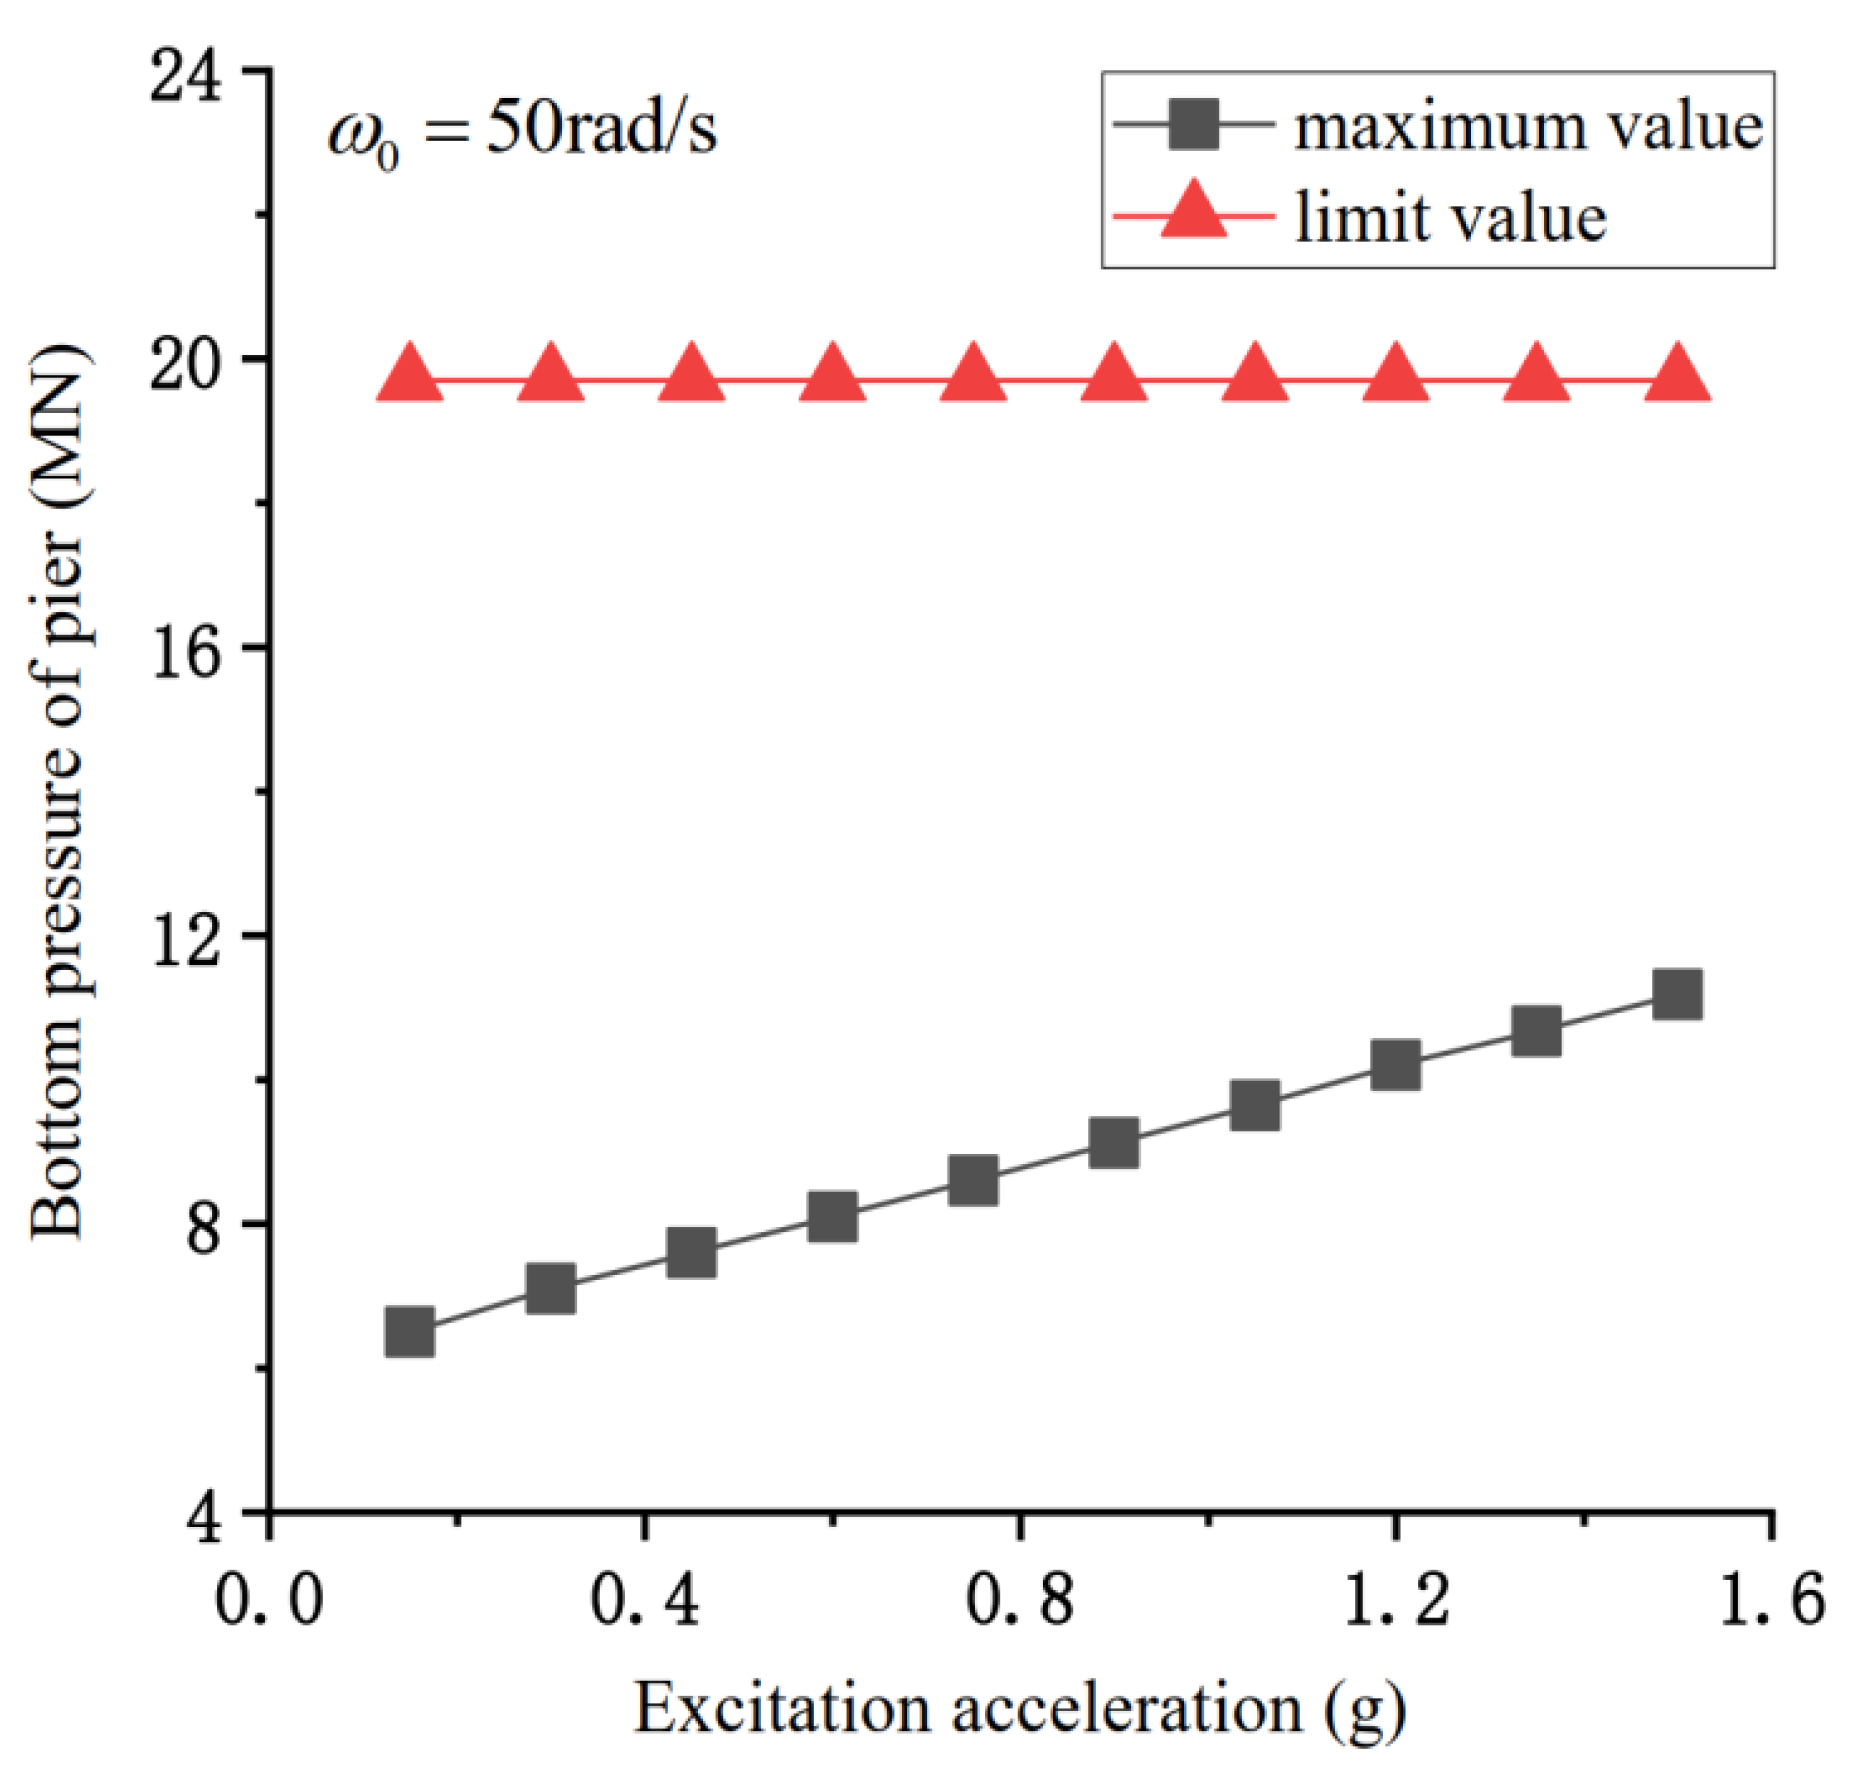
Figure 12 shows the change in the maximum and allowable pressure under different excitation peaks when ω 0 = 50 rad/s. When ω 0 is far away from ω 1 , the vertical contact force increases monotonically with the decrease in the excitation peak. Since the structure does not separate, and ω 0 is far away from μ 1 , the allowable value of the pier pressure remains constant. The maximum vertical contact force of the pier beam is always less than the allowable value, and the structure is in the safe range.
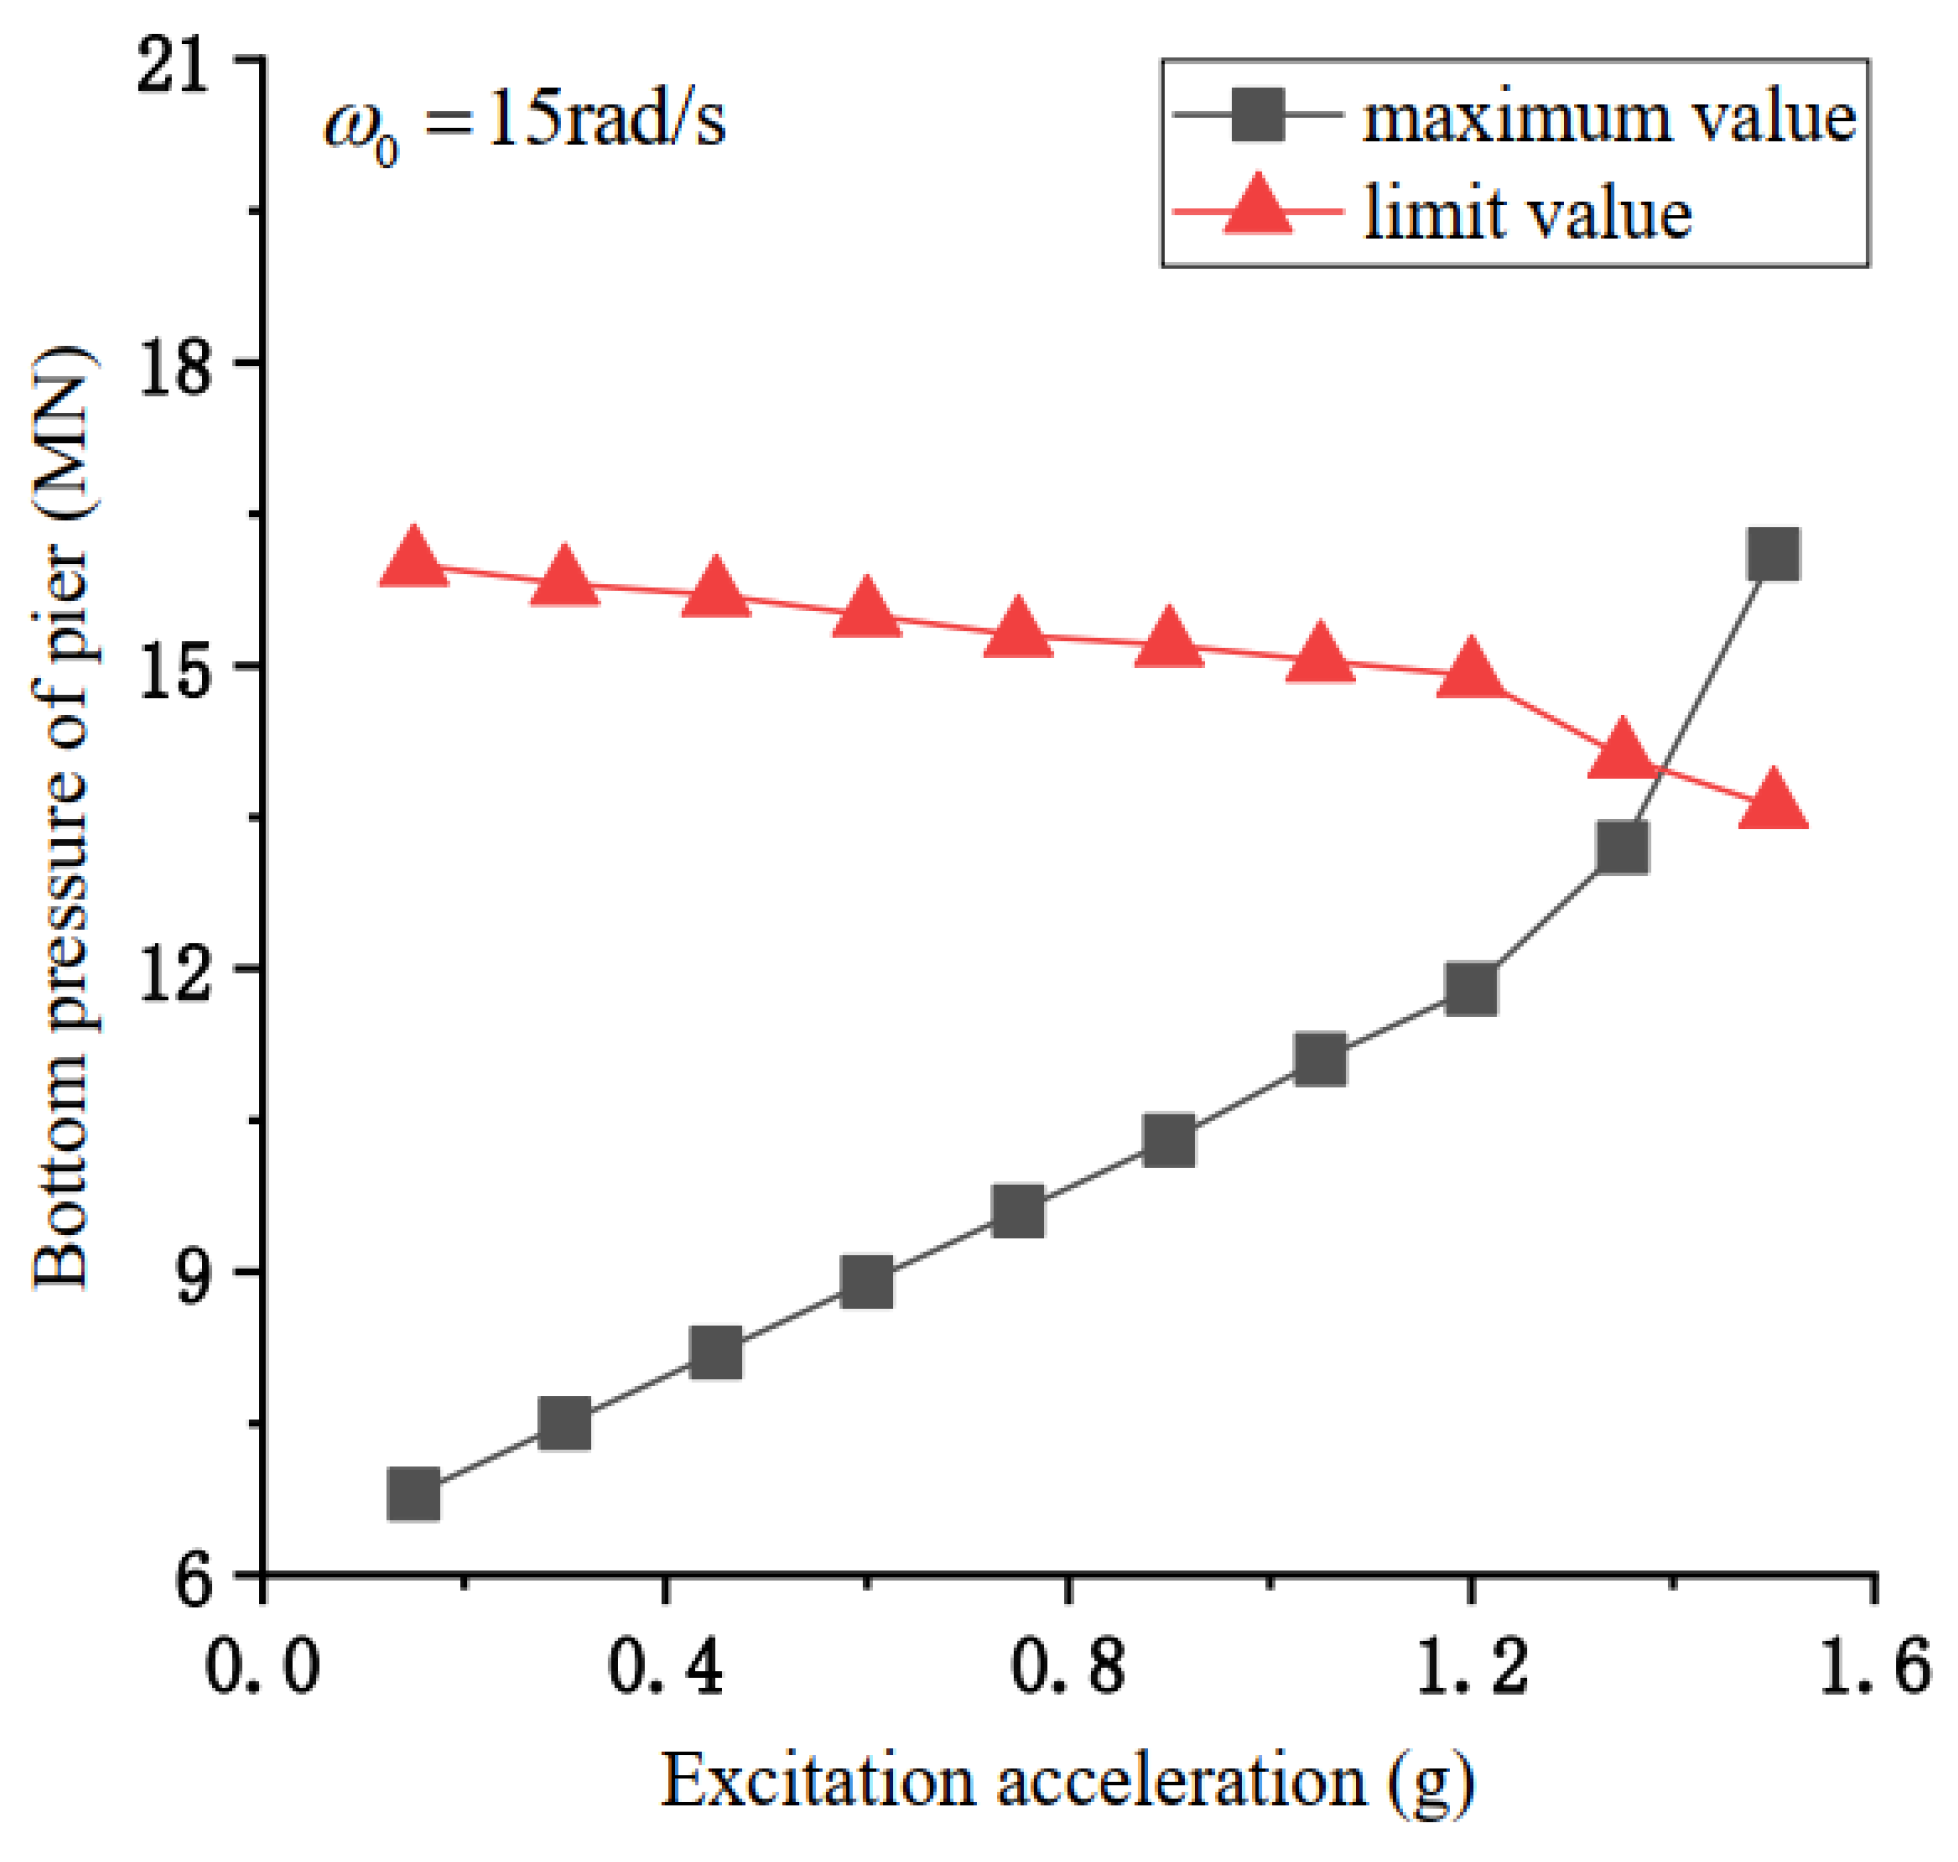
Figure 13 shows the changes in the maximum and allowable values of pier bottom pressure under different excitation amplitudes when ω 0 = 15 rad/s. At this point, the excitation frequency deviates from the natural vertical frequency of the bridge but approaches the longitudinal excitation frequency of the bridge. When the peak seismic acceleration is less than 1.2 g, the maximum pressure at the pier bottom increases monotonically with the increase in excitation. By contrast, the extreme deformation value at the pier top changes little. When the peak excitation acceleration exceeds 1.2 g, the structure separates and undergoes a small mutation, leading to a further decrease in the allowable pier pressure. When the peak excitation acceleration exceeds 1.5 g, the pier is destroyed under compression.

4.2. Bending Failure

To calculate the maximum bending moment at the bottom of the first impact pier, the calculation model is simplified as follows:
  • The maximum deformation time at the top of the pier is selected for the calculation. At this time, the bending moment generated by the horizontal vibration inertia force of the pier is zero;
  • To calculate the most unfavorable condition of the structure, it is assumed that the maximum eccentricity and the maximum impact force occur simultaneously;
  • Since the dead weight of the pier is minimal, the bending moment generated by its dead weight at the bottom is ignored;
  • The bending failure is only considered at the bottom of the pier, and the possible instability failure of the pier is ignored;
  • When the shear deformation of the rubber bearing exceeds the allowable deformation value, it is assumed that the rubber bearing fails, and the increase in deformation cannot improve the horizontal binding force;
  • The possible plastic changes at the bottom of the pier are ignored and it is assumed that the pier is always in an elastic stage.
The allowable bending moment calculation of an eccentric compression pier is shown in Equation (8), and the specific parameters are shown in the specification [23]:
N = α f c d A r ( 1 sin 2 π α 2 π α ) + ( α α t ) f s d A s M u d = 2 3 f c d A r sin 3 π α π + f s d A s r s sin π α + sin π α t π
Figure 14 shows the changes in the total and acceptable bending moments under different excitation amplitudes. With the increase in the excitation amplitude, the allowable bending moment continues to decrease. By contrast, the total bending moment continues to increase and surges when the amplitude is 0.55 g. At this point, the sudden change in the maximum bending moment is due to the sharp increase in the longitudinal displacement caused by the separation.

4.3. Shear Failure

The change in a pier’s longitudinal displacement and vertical force may also cause pier shear failure. See Equation (9) for the check calculation of the shear strength, and see the specification [23] for the meaning of each parameter.
V c ϕ ( V c + V s ) V c = 0.1 υ c A e
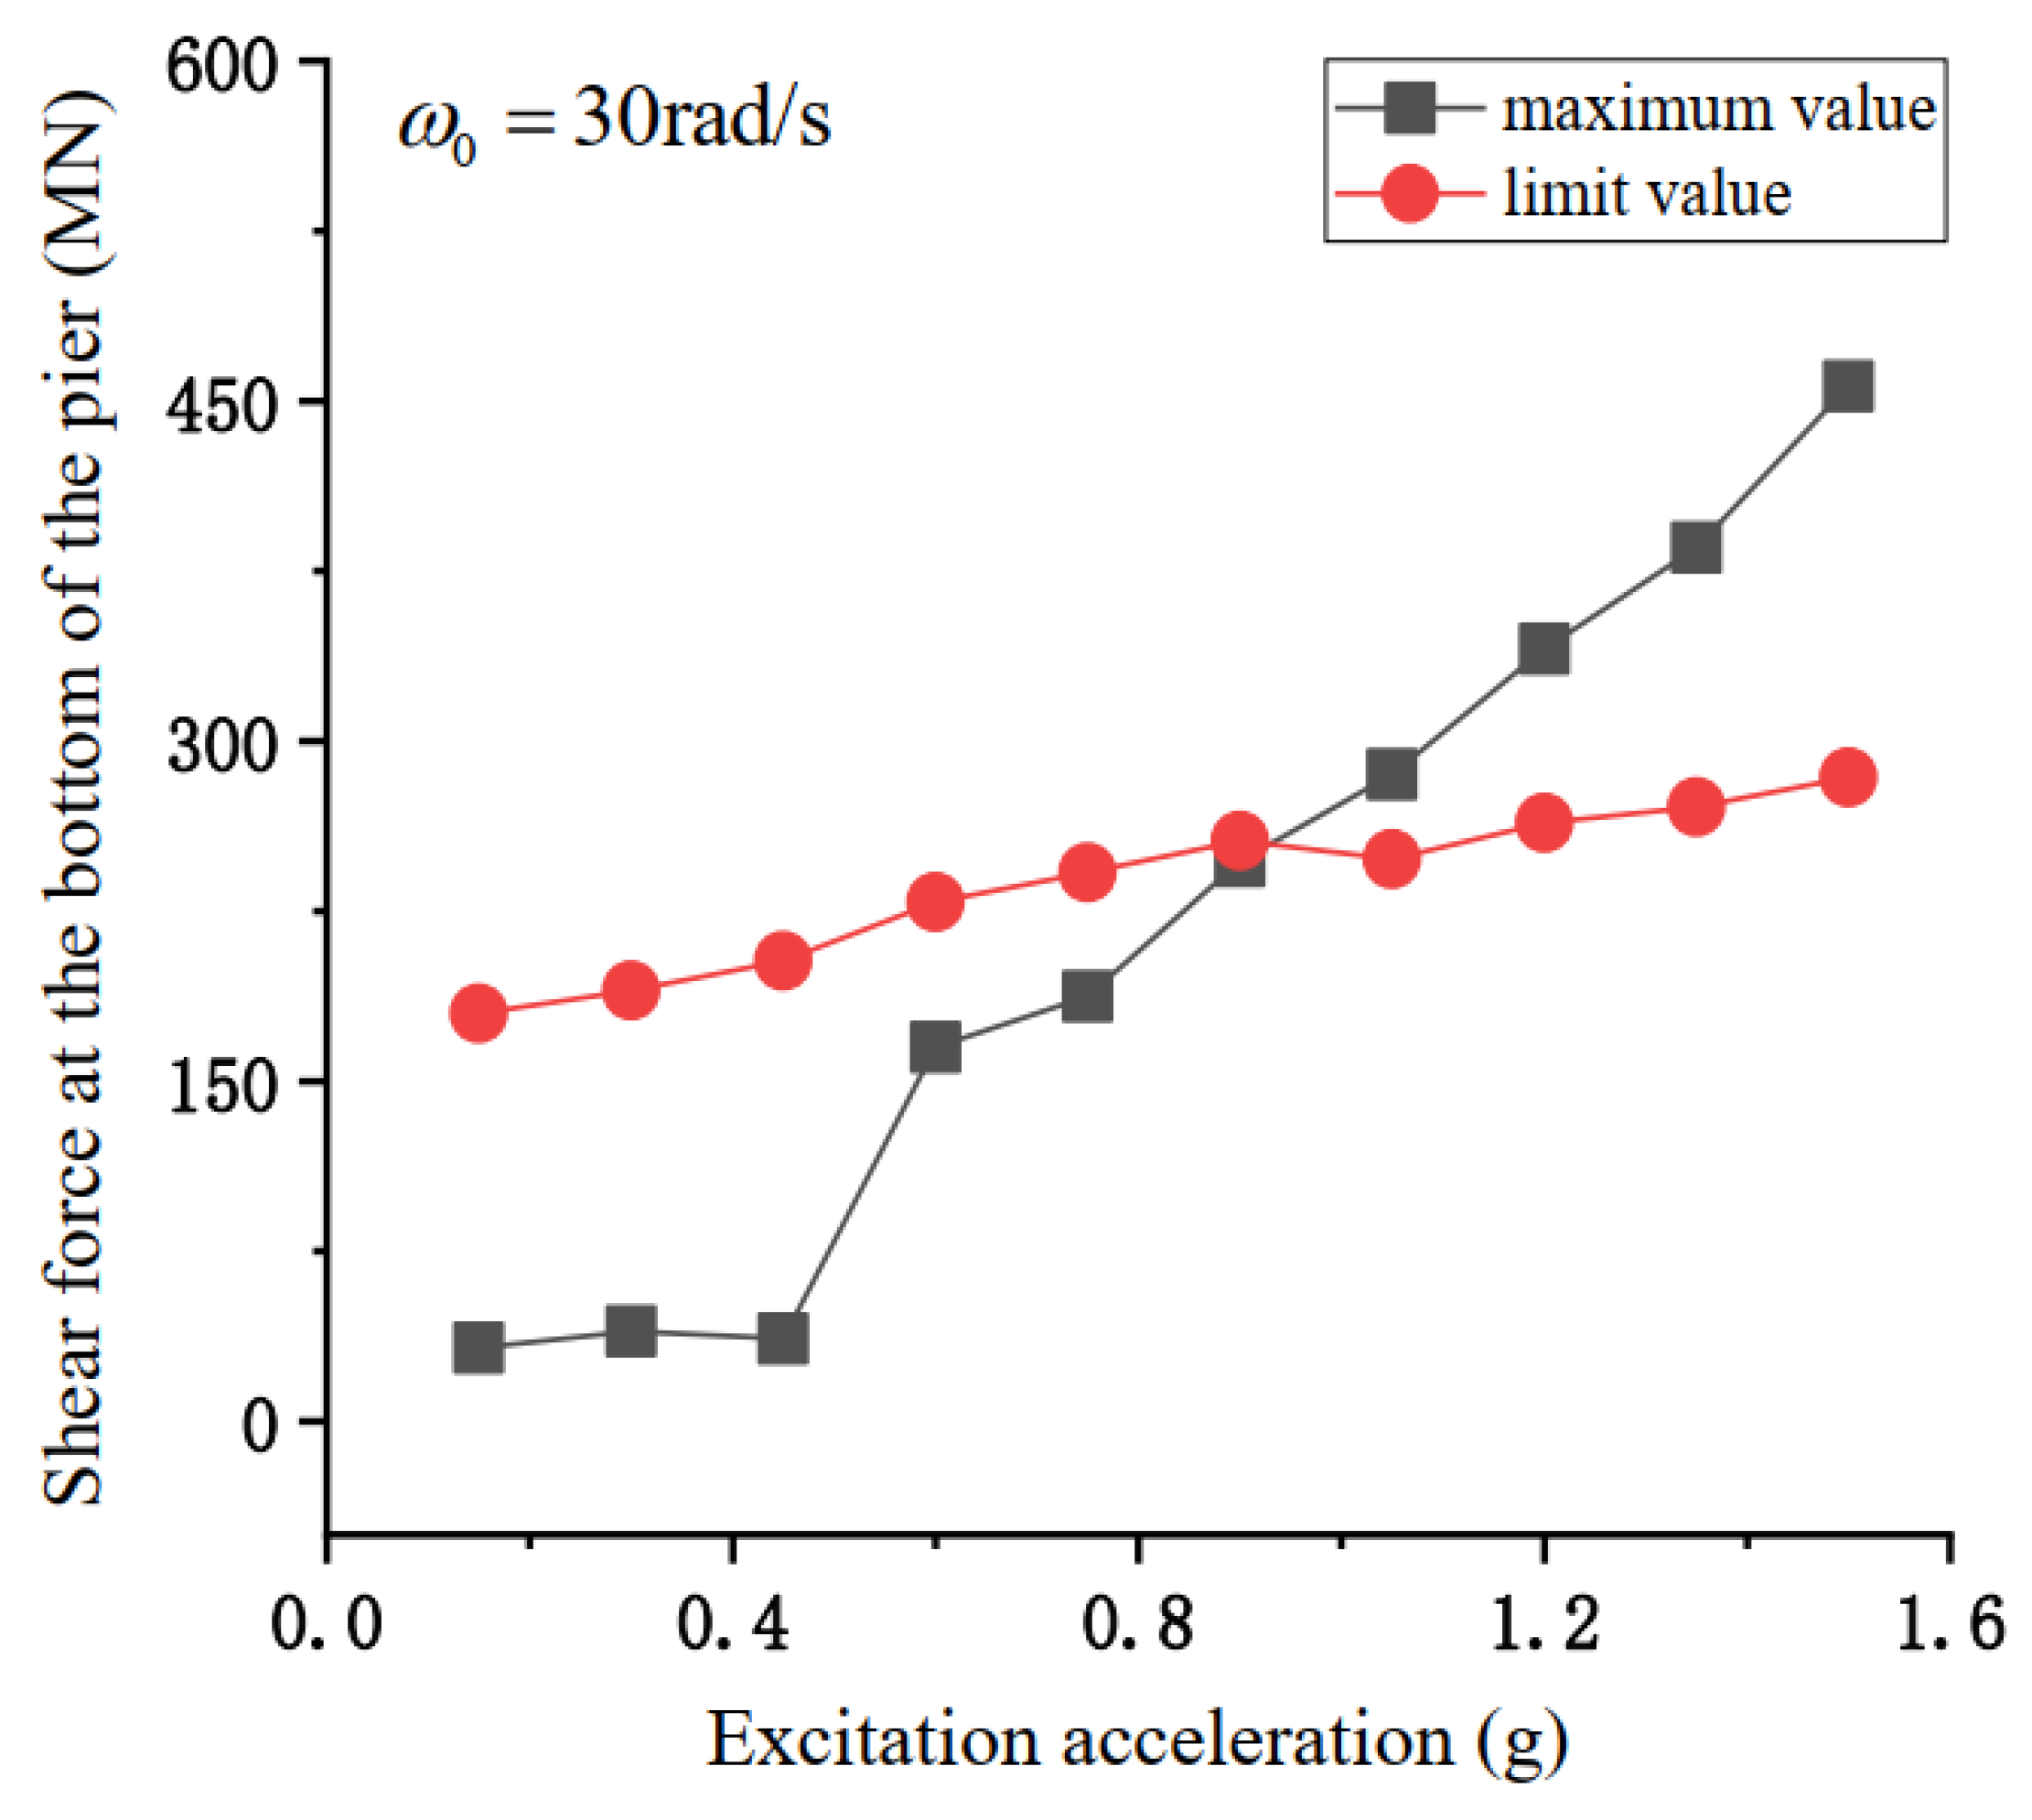
Since the elastic model is adopted in this paper and the plastic hinge interval is ignored, H is the height from the top to the bottom of the pier. In order to study the shear condition at the bottom of the pier when the bending moment is at its maximum, P is selected as the maximum pressure at the bottom of the pier. According to Equation (9), the shear strength of the bridge pier increases monotonically with the increase in the pier bottom pressure. The increase in pressure can not only increase the shear strength of the pier, but also lead to the increase in the bending moment at the bottom of the pier. Figure 15 shows the shear changes of the bridge pier under different vertical excitation amplitudes. When there is no separation between the main beam and the pier, both the shear design value and the allowable shear value of the pier increase with the increase in the vertical excitation amplitude, and the pier is always in the safe range. When the structure is separated vertically, the bending moment caused by the horizontal excitation and the eccentric collision increases greatly due to the increase in the pier deformation caused by the separation. However, the increase in the pier’s axial force can improve the pier’s shear design value. However, this increase is less than the shear force generated by the seismic excitation, and the bottom of the pier is damaged by the shear.

4.4. Influence of Dynamic Response on the Failure Mode of Bridge Pier

Under the conditions of pier–beam separation, there may be multiple modes of failure under high-amplitude excitation. However, the limit solution is adopted in the calculation of pier failure in the front, while the dynamic response of the bridge under the actual excitation is within the limit solution. Therefore, it is necessary to analyze the first failure mode of the bridge pier under the condition of separation.
The dynamic response of the bridge after pier–beam separation is calculated and compared with the standard formula. Two parameters affecting the failure of the pier are proposed: the vertical impact force of the pier beam and the longitudinal deformation of the pier top. Figure 16 shows the failure of the pier under different parameters. When the pier top is slightly deformed, the increase in the vertical collision force of the pier beam leads first to the compression failure of the structure, followed by shear failure, and, finally, bending failure. The failure modes of the bridge pier change with the increase in the maximum deformation. The failure gradually changes from compression failure to shear failure, and the pier bottom pressure required for failure gradually decreases. When large longitudinal deformation occurs at the pier top, bending failure occurs first, and only a small axial force is needed to cause it.
Regarding the bridge model in Figure 2, when ω 0 μ 1 , the top of the pier is deformed significantly, but the excitation frequency deviates greatly from the natural vertical frequency, the pier–beam contact force is low, and the pier is mainly subjected to bending failure. When the excitation frequency deviates significantly from the longitudinal frequency of the bridge and is close to the natural vertical frequency of the bridge, the deformation at the top of the pier gradually decreases, the pressure gradually increases, and shear failure gradually occurs. When ω 0 ω 1 , the pier is subjected to a large vertical impact force. Through the analysis of Figure 16, it can be found that compression failure is the most likely failure to be caused at this time. The failure modes of the pier are different with different excitation frequencies.

5. Conclusions

In this paper, a double-span continuous beam bridge is selected to analyze the influence of near-field vertical earthquake on pier failure. Analysis of the longitudinal displacement and vertical contact force response of the bridge is undertaken. Different types of possible damage of the pier under seismic excitation are solved. It is calculated that:
(1)
Under simple harmonic excitation, there is a risk of mound separation when the excitation frequency is close to the first-order vertical intrinsic frequency of the first-order of the bridge, and it is mainly focused on the excitation frequency being close to the first-order vertical intrinsic frequency interval.
(2)
The vertical separation of the mounds increases the longitudinal deformation on the top of the piers, and the frequency difference is larger. At the same time, the collision that the separation would cause would greatly increase the mound vertical contact force, and the closer the excitation frequency is to the natural vertical frequency, the greater the vertical excitation amplitude, and the greater the impact force.
(3)
With pier and beam separation, the increase in excitation amplitude causes a monotonic increase in dock longitudinal deformation. The dock will be damaged by compression, bending, and shearing. With the longitudinal deformation value of the pier top as the failure basis, when the vertical contact force of the pier beam is low, the flexural failure of the structure occurs first. With the increase in pier bottom pressure, the first failure mode gradually changes into shear failure. When the vertical impact force of the pier beam is large, only a small longitudinal deformation is required to cause compression failure of the pier beam.

Author Contributions

Formal analysis, W.A.; Data curation, M.K.; Writing—original draft, L.Z.; Writing—review & editing, L.M.; Supervision, H.Y. All authors have read and agreed to the published version of the manuscript.

Funding

This research was funded by Jiangxi Provincial Department of Education Science and Technology [CJJ202915] And The APC was funded by [CJJ202908].

Institutional Review Board Statement

Not applicable.

Informed Consent Statement

Not applicable.

Data Availability Statement

The datasets used and analysed during the current study are available from the corresponding author on reasonable request.

Conflicts of Interest

The authors declare no conflict of interest.

References

  1. Li, H.N.; Xiao, S.Y.; Huo, L.S. Damage investigation and analysis of engineering structures in the Wenchuan earthquake. J. Build. Struct. 2008, 29, 10–19. [Google Scholar]
  2. Zhuang, W.L.; Liu, Z.Y.; Jiang, J.S. Earthquake-induced damage analysis of highway bridges in Wenchuan earthquake and countermeasures. Chin. J. Rock Mech. Eng. 2009, 28, 1377–1387. [Google Scholar]
  3. Bozorgnia, Y.; Niazi, M.; Campbell, K.W. Characteristics of free-field vertical ground motion during the Northridge earthquake. Earthq. Spectra 1995, 11, 515–526. [Google Scholar] [CrossRef]
  4. Bozorgnia, Y.; Campbell, K.W. The Vertical -to-horizontal response spectral ratio and Entative procedures for developing simplified V/H and vertical design spectra. J. Earthq. Eng. 2004, 8, 175–207. [Google Scholar] [CrossRef]
  5. Jiang, Z.; Tao, Y.; Yu, T.P.; Yuan, W. A Novel Structure-Pulse Coupled Model for Quantifying the Column Ductility Demand under Pulse-Like GMs. J. Earthq. Eng. 2022, 26, 8185–8203. [Google Scholar]
  6. Shao, Y.; Wei, Y.; Yang, T.; Ni, M.; Zhong, J. Empirical models of bridge seismic fragility surface considering the vertical effect of near-fault ground motion. Structures 2021, 34, 2962–2973. [Google Scholar] [CrossRef]
  7. Sung, J.K.; Curtis, J.H.; Amr, S.E. Analytical Assessment of the Effect of Vertical Earthquake Motion on RC Bridge Piers. J. Struct. Eng. 2011, 137, 252–260. [Google Scholar]
  8. Rodrigues, H.; Furtado, A.; Arêde, A. Behavior of rectangular reinforced-concrete columns under biaxial cyclic loading and variable axial loads. J. Struct. Eng. 2016, 142, 1–8. [Google Scholar] [CrossRef]
  9. Long, J.D.; Xiao, J.T.; Ju, M. Quantitative investigation of tomographic effects in abnormal regions of complex structures. Engineering 2021, 7, 1011–1022. [Google Scholar]
  10. Zhang, Y.-B.; Yao, X.-L.; Liang, P.; Wang, K.-X.; Sun, L.; Tian, B.-Z.; Liu, X.-X.; Wang, S.-Y. Fracture evolution and localization effect of damage in rock based on wave velocity imaging technology. J. Cent. South Univ. 2021, 28, 2752–2769. [Google Scholar] [CrossRef]
  11. Nguyen Luan, T.; Ryan, T. Ultrasonic wavefield inversion and migration in complex heterogeneous structures: 2D numerical imaging and nondestructive testing experiments. Ultrasonics 2018, 82, 357–370. [Google Scholar] [CrossRef] [PubMed]
  12. Zuo, Y.; Sun, G.J.; Li, H.J. Comparison and Research of Unseating Prevention Measures in Seismic Codes of China and Foreign Countries. J. Disaster Prev. Mitig. Eng. 2016, 36, 617–623, 639. [Google Scholar]
  13. Tao, Y.; Xinzhe, Y.; Jian, Z.; Yuan, W. Near-fault Pulse Seismic Ductility Spectra for Bridge Columns Based on Machine Learning. Soil Dyn. Earthq. Eng. 2023, 164, 107582. [Google Scholar]
  14. Zhong, J.; Shi, L.; Yang, T.; Liu, X.; Wang, Y. Probabilistic seismic demand model of UBPRC columns conditioned on Pulse-Structure parameters. Eng. Struct. 2022, 270, 114829. [Google Scholar] [CrossRef]
  15. Zhong, J.; Zheng, X.; Wu, Q.; Jiang, L.; He, M.; Dang, X. Seismic fragility and resilience assessment of bridge columns with dual-replaceable composite link beam under near-fault GMs. Structures 2023, 47, 412–424. [Google Scholar] [CrossRef]
  16. Zhong, J.; Mao, Y.-H.; Yuan, X. Lifetime seismic risk assessment of bridges with construction and aging consideration. Structures 2023, 47, 2259–2272. [Google Scholar] [CrossRef]
  17. Khatiwada, S.; Chouw, N.; Butterworth, J.W. A generic structural pounding model using numerically exact displacement proportional damping. Eng. Struct. 2014, 62–63, 33–41. [Google Scholar] [CrossRef]
  18. Ruan, H.H.; Yu, T.X. Local deformation models in analyzing beam-on-beam collisions. Int. J. Mech. Sci. 2003, 45, 397–423. [Google Scholar] [CrossRef]
  19. Yang, H.B.; Yin, X.C.; Hao, H. Theoretical Investigation of Bridge Seismic Responses with Pounding under Near-Fault Vertical Ground Motions. Adv. Struct. Eng. 2015, 18, 452–468. [Google Scholar] [CrossRef] [Green Version]
  20. An, W.; Song, G.; Chen, S. Near-Fault Seismic Response Analysis of Bridges Considering Girder Impact and Pier Size. Mathematics 2021, 9, 704. [Google Scholar] [CrossRef]
  21. An, W.; Song, G. Influence of Bearing on Pier Failure Considering the Separation Condition under Near-Fault Earthquake. Symmetry 2021, 13, 692. [Google Scholar] [CrossRef]
  22. Xing, Y.F.; Wang, L.J. Analysis of wave propagation in the built-up structures of rod-beam and beam-beam. J. Beijing Univ. Aeronaut. Astronaut. 2013, 30, 520–523. [Google Scholar]
  23. CJJ 166-2011; Code for Seismic Design of Urban Bridges. Ministry of Housing and Urban-Rural Development of the People's Republic of China: Beijing, China, 2011.
Figure 1. Theoretical solution model of the bridge structure.
Sustainability 15 01435 g001
Figure 2. Acceleration curves of different pulse excitations.
Sustainability 15 01435 g002
Figure 3. The minimum force of pier beam under different vertical pulse excitations.
Sustainability 15 01435 g003
Figure 4. Vertical separation conditions of pier beam.
Sustainability 15 01435 g004
Figure 5. Longitudinal relative displacements of pier beams during different excitation periods.
Sustainability 15 01435 g005
Figure 6. Vertical collision calculation model.
Sustainability 15 01435 g006
Figure 7. Deformation of vertical impact bridge.
Sustainability 15 01435 g007
Figure 8. Flow chart of the bridge vertical displacement calculation program.
Sustainability 15 01435 g008
Figure 9. The vertical contact force of pier beam under the first impact.
Sustainability 15 01435 g009
Figure 10. Vertical contact force of pier beam.
Sustainability 15 01435 g010
Figure 11. Bottom pressure of pier when ω 0 = 30 rad/s.
Sustainability 15 01435 g011
Figure 12. Bottom pressure of pier when ω 0 = 50 rad/s.
Sustainability 15 01435 g012
Figure 13. Bottom pressure of pier when ω 0 = 15 rad/s.
Sustainability 15 01435 g013
Figure 14. Bending moment at the bottom of the bridge pier under different levels of vertical excitation acceleration.
Sustainability 15 01435 g014
Figure 15. Bottom shear of pier under different excitation amplitudes.
Sustainability 15 01435 g015
Figure 16. Failure of bridge pier under different axial forces.
Sustainability 15 01435 g016
Disclaimer/Publisher’s Note: The statements, opinions and data contained in all publications are solely those of the individual author(s) and contributor(s) and not of MDPI and/or the editor(s). MDPI and/or the editor(s) disclaim responsibility for any injury to people or property resulting from any ideas, methods, instructions or products referred to in the content.