Article

Research on Optimal Configuration of Landscape Storage in Public Buildings Based on Improved NSGA-II

College of Electrical, Energy and Power Engineering, Yangzhou University, Yangzhou 225009, China
*
Author to whom correspondence should be addressed.
Sustainability 2023, 15(2), 1460; https://doi.org/10.3390/su15021460
Submission received: 11 August 2022 / Revised: 19 December 2022 / Accepted: 6 January 2023 / Published: 12 January 2023

Abstract

:
The transition to clean and low-carbon energy in public buildings is crucial to energy saving and green social development. This paper focus on the sustainable development of public buildings and the construction of complementary power generation systems in existing public buildings. In the study, it was found that the constraints of the energy storage system could not be satisfied, which would result in the failure of the energy storage system for the purpose of peak regulation and stable operation of the microgrid. In order to satisfy the constraint conditions of the energy storage system, a spatial transformation method was proposed that improves the Non-dominated Sorting Genetic Algorithm-II (NSGA-II). The simulation results show that the spatial transformation Non-dominated Sorting Genetic Algorithm-II (STNSGA-II) has advantages in dealing with the strong constraints of the energy storage system. The introduction of the complementary power generation system with energy storage system in public buildings can save 23.74% to 31.17% from the perspective of optimal cost, and can reduce of CO2 emissions by at least 2478 kg from the perspective of carbon emission reduction. This study presents a case for transforming public buildings from simple consumers of energy systems to active contributors supporting large-scale wind and PV access.

1. Introduction

In recent years, with the development of the world economy, the increasing demand for various energy loads in different buildings has led to the continuous growth of energy consumption, and the proportion of building energy consumption has reached one-third of the total energy consumption [1]. In the classification of building energy consumption, public buildings account for the largest portion of total building energy consumption and the highest carbon emission intensity due to their unique energy consumption aggregation. In addition, because of the world’s current electricity mix, fossil fuels such as coal will further exacerbate environmental problems. Constructing a multi-source system in public buildings with access to various renewable energies can not only reduce the consumption of fossil energy, but also improve the surrounding environment, thus promoting the sustainable development of public buildings and essentially alleviating the greenhouse effect encountered by the world [2].
Currently, the energy problem has attracted the attention of many scholars, especially the problem energy saving in public buildings. Navaratnam, S et al. analyzed the potential for installing and configuring preset building systems to improve building efficiency and sustainable development in several aspects [3]. Energy performance assessment is an option to improve energy consumption, and Gonzalez, J et al. studied different building energy consumption assessment models to reduce the power demand and achieve the sustainable performance index of zero-energy buildings [4]. In addition, some scholars study the construction of a renewable energy microgrid through wind and solar power generation to supplement the energy of existing public buildings, so as to reduce the proportion of fossil energy consumption [5,6,7]. Studies [8,9] discussed the economic benefits of microgrid power generation in combination with climate factors. S. Lee conducted a study on energy cost optimization under power supply and demand conditions. Studies [10,11,12] investigated the consumption and management of renewable energy from the perspective of environmental protection. From the perspective of optimization strategy, approaches include the two-level energy sharing strategy [13], two-level optimization strategy [14], AC/DC mixed energy management strategy [15], optimization strategy combining long-term and short-term optimization [16] and unified decision structure [17]. These optimization strategies consider the interaction between the optimization results at different levels and are more rational for optimization interpretation.
Energy storage systems play a crucial role in reducing the energy consumption and cost of building energy systems and smoothing microgrid fluctuations, as they can store renewable generation and reduce the impact of direct grid connection while reducing costs and increasing flexibility in electricity usage. In calculating the maximum operating benefit of a microgrid, it is important to consider the role of the battery in the functioning of the building’s renewable energy systems and their influence of the life span [18,19,20,21]. Energy storage also plays a considerable role in load peak regulation, which reduces pressure on the grid due to the electrical load during peak hours, and improves the reliability and service level of the power supply [22,23]. At the same time, an energy storage system increases the flexibility of electric energy usage in the process of the joint optimization of energy consumption [24,25]. Reference [26] introduces the absorption and reuse of renewable braking energy through a regenerative inverter used in a traction power supply system. The applications of energy storage systems and grid-connected inverters in the construction of renewable energy systems is also an important research area.
In the past, solutions for multi-objective optimization problems mostly focused on the Weighted sum method [27], the YALMIP toolbox in MATLAB [28], etc. The main idea of this type of method is to integrate multiple goals into one goal and supplement the remaining goals with additional conditions, which will lead to the distortion of some goals. In recent years, with the independent study of intelligent algorithms, more and more scholars have been paying attention to the research on multi-objective algorithms based on the Pareto concept. Commonly used multi-objective optimization algorithms include game theory [29], NSGA [30], etc. In this type of multi-objective optimization, the status of each objective function is consistent, and the solution set obtained is called the non-dominant solution, which can lead to more realistic simulation conclusions. As shown in reference [31], the improved NSGA-II was used to solve the multi-objective optimization model of an integrated energy system with an optimal energy purchase cost and optimal carbon dioxide emissions. In the future, multi-objective optimization algorithms based on Pareto will become the mainstream method for solving optimization problems.
In the case of multi-energy involvement and multi-device coupling, mutual constraints become more complex. Using the energy storage system as an example, the solution of the algorithm may not conform to the actual physical meaning under complementary constraints. Therefore, it is more difficult to achieve a solution that completely conforms to the constraints of complex microgrid systems. The author of article [32] recommended an abandonment strategy for renewable energy in order to reduce the risk that opportunity constrained economic scheduling is not feasible, but this method is uneconomical from the perspective of energy utilization. It is viable to use the penalty function method to transform non-convex optimization into convex relaxation optimization [33], but it is hard to calculate the penalty factor of the penalty function method. A new two-stage two-population evolutionary algorithm was mentioned in reference [34] to solve the problem of the scarcity feasible solutions caused by constraints. However, this method will lead to complex modeling and heavy workload problems and is not conducive to the rapid optimization of the problem.
The review of the literature shows that the sustainable green development of public buildings has great research significance. The research on the renewable energy microgrid has been robust [8,9,10,11,12,13,14,15,16,17,35], but it is rarely applied to public buildings. The energy storage system has a high participation in building energy management [18,19,20,21,22,23,24,25], but it is not closely related to the renewable power generation systems of public buildings. A multi-objective algorithm is generally used to solve multi-objective optimization problems [27,28,29,30,31], but it is found from previous conclusions that the convergence of the algorithm is slow. The literature [32,33,34] has given several methods to deal with the constraints, but there are still strong constraints that are difficult to deal with.
This study considers the introduction of an energy storage system to participate in the scheduling of the optimization process of public building microgrids, and finds that sometimes the optimization schemes do not satisfy the energy storage constraints or even that they violate the fundamental physical meaning. As a result of this occurrence, the energy storage system is unable to produce the desired effect of energy saving and carbon reduction. This study looks at the difficult problem of energy storage system constraint in the multi-objective optimization of the public building microgrid. The main contributions of this paper can be summarized as follows:
  • Taking an existing public building as an example, a renewable energy microgrid structure based on wind power and photovoltaic power generation combined with an energy storage system is constructed;
  • Establishing a multi-objective renewable energy capacity allocation and optimization model for public buildings considering cost objectives, carbon emission reduction objectives and grid-connected security objectives;
  • Proposing a spatial transformation constraint processing method to transform the unsatisfied solution into a feasible solution in a feasible domain. The spatial transformation method combined with the NSGA-II is applied to the problem that the number of feasible solutions is reduced due to multi-variable mutual constraints and the problem that the strong constraints are difficult to meet.
  • Using the STNSGA-II proposed in this paper to simulate and solve the multi-objective renewable energy optimization model of public buildings to verify its effectiveness.

2. Power Supply Model

2.1. Microgrid Structure of Public Buildings

The complementary structure of a renewable energy power generation system and an energy storage system is shown in Figure 1.
The microgrid system consists of a renewable energy generation system, an energy storage system and an inverter system that exchanges energy with the power grid. In the renewable energy power generation system, wind turbines and photovoltaic panels are used as power generation equipment to generate clean electric energy, which is connected to the DC bus through a DC/DC converter. In the energy storage system, the storage battery is connected to the DC bus through a bidirectional DC/DC converter to supply the DC load. The renewable power generation system and the energy storage system form a complementary power generation system by connecting the DC bus. The complementary power generation system uses a DC/AC converter to link the AC bus to exchange power with the power grid and provide power for the AC load.

2.2. Wind Power Generation System Model

2.2.1. Fan Generation Model

The output power of the fan is limited by the real-time wind speed, and the output power of the fan is approximately the Weibull distribution when the wind speed does not reach the rated wind speed [36,37]. The fan output power per unit of scavenging area is shown in Equation (1)
P wind ( t ) = 1 2 C p ρ v 3
where Cp is the wind energy utilization coefficient. ρ is the air density at the height of the fan hub. The relationship between the air density and height can be expressed by Equation (2):
ρ = 1.2097 9.799 × 1 0 5
First, the fan output power is zero when the actual wind speed does not reach the fan’s starting wind speed. Second, when the actual wind speed exceeds the rated wind speed but does not reach the maximum wind speed of the fan, the output power of the fan is the rated power. Then, the maximum output power of the fan is obtained under the condition that the actual wind speed exceeds the maximum wind speed of the fan but does not exceed the fan cut-off wind speed. Another situation where the fan output is zero occurs when the actual wind speed exceeds the fan’s cut-off speed and the fan generator is locked to protect the fan. The output power of the fan can be calculated by Equation (3):
P wind = 0     ,     v < V ci   or   v V co 1 2 C p S ρ v 3 ,   V ci v < V r P f r , V r v < V m P fm   ,     V m v < V co   ,
where v is the actual wind speed, Vci is the cut-in wind speed, Vr is the rated wind speed, Vm is the maximum wind speed and Vco is the cut-off wind speed. Pwind is the output power of the fan, Pfr is the rated output power of the fan and Pfm is the maximum output power of the fan. S is the actual scavenging area of fan blade, which can be calculated from S = π(Dfan/2)2, and Dfan is the diameter of fan blade.

2.2.2. Calibration of Wind Speed at Fan Hub Height

The fan installation height is variable for different building scenarios, so it is more troublesome to obtain the wind speed at each fan installation height. In this paper, the wind speed at the fan hub is corrected by the wind speed at the unified observation point [38], which can be calculated by Equation (4).
v = v h 0 ( h i s + h f a n ) / h 0 a f a n
where h0 is the unified observation height of the wind speed; the height of the observation point in this paper is 10 m. vh0 is the measured wind speed at h0. hfan is the vertical height of the fan from the horizontal plane, his is the overall height of the fan, and hfan + his is the vertical height between the fan hub and the horizontal plane. afan is the wind speed correction coefficient, which is 0.25 in urban areas in this paper.

2.3. Photovoltaic Power Generation Model

The output power of the PV is related to the intensity of the solar radiation and the environmental temperature [37,39], and the output power is shown in Equation (5).
P p v = f P p v , s t c G p G s t c [ 1 + α p v ( T p v , p T p v , s t c ) ]
where Ppv is the output power of the PV, f is the PV array power derating factor, Ppv,stc is the rated capacity of the PV array, Gp is the actual solar irradiance on the surface of the PV array, Gstc is the solar radiation of the PV array under standard test conditions, Tpv,p is the actual temperature of the PV array surface, Tpv,stc is the temperature under standard test conditions, and αpv is the power temperature coefficient.

2.4. Battery Energy Storage Model

The battery always needs to work in a safe state of charge, and the charging and discharging power of the battery is limited by the state of charge [18,19,20,21,22,23,24,25,40]. The relationship between battery charging and the charging state has been described in the literature, but the specific charging and discharging conditions of batteries are rarely studied.
In this paper, the energy storage system is complemented by a renewable generation system for energy. The excess power is stored in the battery while the renewable generation capacity is used by the load, and the power is released when the renewable generation capacity is insufficient to supply the load.
The charging condition and state of charge model of the storage battery can be expressed by Equations (6) and (7), respectively.
P wind ( t ) + P pv ( t ) P load ( t ) > 0 C bat ( t 1 ) < C bat , max
C bat ( t ) = ( 1 δ ) C bat ( t 1 ) + [ P wind ( t ) + P pv ( t ) P load ( t ) ] η c
The discharge condition and discharge state model of the battery can be expressed by Equations (8) and (9).
P wind ( t ) + P pv ( t ) P load ( t ) < 0 C bat ( t 1 ) > C bat , max
C bat ( t ) = ( 1 δ ) C bat ( t 1 ) + [ P wind ( t ) + P pv ( t ) P load ( t ) ] / η c
where Cbat(t) and Cbat(t − 1) represent the energy storage capacity of the battery at time t and time t − 1, respectively. Cbat,max, Cbat,min denote the maximum and minimum capacities of the battery, respectively. δ is the self-discharge rate of the battery. ηc and ηd denote the charging and discharging efficiencies of the battery, respectively.

2.5. Grid-Connected Inverter Power Model

At the peak output of the renewable energy system, the clean electric energy may appear surplus after being used for load and battery storage. At the same time, there may be a shortage of clean electricity during periods of low power output from the renewable generation system. The grid-connected inverter connects the microgrid with the power grid for power change to accomplish a balance between the supply and the demand of the microgrid. The surplus electric energy of the renewable single generation system can be sold to the power grid to achieve certain economic benefits. The shortfall in renewable generation is made up by purchasing electricity from the grid. The energy exchanged from the grid to the microgrid can be expressed by Equation (10):
P g r i d ( t ) = P l o a d ( t ) P w i n d ( t ) P p v ( t ) P b a t ( t )
where Pgrid(t) is the electric energy exchanged between the microgrid and the power grid at time t and Pbat(t) is the electric energy actually released by the energy storage system at time t. When Pgrid(t) > 0, it means that the renewable generation cannot meet the load demand at the current moment, and insufficient power is provided by the grid; when Pgrid(t) < 0, it means that the microgrid system has surplus generation and power delivered to the grid.
In this paper, the strategy of not limiting the output of new energy sources is adopted, considering that limiting the output of new energy sources will produce wasteful energy phenomena such as abandoning wind and light, so the capacity of the grid-connected inverters needs to be reasonably configured. In an operation cycle, in order to ensure that the renewable energy generation is not restricted at every operation moment, the capacity limit of the grid-connected inverter needs to be set so that, at the moment in the operation cycle when the grid-connected energy is the largest, it can meet the requirement of unrestricted renewable power generation throughout the whole operation cycle. The specific calculation method is as in Equation (11).
Ca p grid = max ( P grid ( t ) )
where Capgrid is the capacity of the grid-connected inverter.

3. Optimal Allocation Model of Public Building

3.1. Average Daily Processing Model

In this paper, an idea of daily average processing is proposed to standardize the optimization variables of different time scales. The basic idea is to convert the optimization operation on a long time scale with the unit of years into an optimization operation on a short time scale of 24 h a day after the annual daily average processing. The calculation method is shown in Equation (12):
y i = n = 1 365 y n i 365 , i = 1 , 2 , 3 , , 24
where yni is the variable data collected at hour i on n days of a year, and yi is the variable data after the annual average of hour i.
The proposed averaging method can convert the annual generation characteristics of the renewable power generation system and the charging and discharging characteristics of the energy storage system under long-term operation into the characteristics of one day for analysis. In the renewable power generation system, the capacity of the wind power generation equipment, the storage battery in the energy storage system and the grid-connected inverter usually need to be configured based on annual operation parameters. The process of equipment capacity allocation in the microgrid system can be simplified by short-term optimization scheduling based on the daily generation characteristics and the daily charging and discharging characteristics of the batteries of the renewable power generation system after daily processing.

3.2. Economic Objectives of Microgrid Systems

In this paper, the cost of the public construction of a microgrid system is mainly composed of three parts. The first part of the cost includes the purchase cost and the operation and maintenance costs of the generation equipment in the renewable power generation system. The second part of the cost includes the purchase cost and operation and maintenance costs of the storage battery in the energy storage system. The last part of the cost includes the transaction profits and losses resulting from the energy exchange between the microgrid systems of public buildings and the grid. The cost objective function is shown in Equation (13).
C = m i n ( C c + C o & m + C g r i d )
where C is the total cost of the microgrid system of public buildings, Cc is the cost of equipment acquisition in the microgrid, Co&m is the operation and maintenance cost of the equipment in the microgrid, and Cgird represents the transaction profit and loss cost generated by the energy exchange between the microgrid and the power grid.

3.2.1. Equipment Acquisition Cost

The Equipment Acquisition Cost function is shown in Equation (14).
C c = i = 1 4 N i C i k
where Ni is the installed number of pieces of equipment, respectively, the number of fans, photovoltaic panels, batteries and inverters. Ci is the purchase cost of each piece of equipment. k is the number of days of equipment life. In this paper, the life cycle of the equipment is 20 years, and the number of days in a full cycle of life is k = 20 × 365 = 7300.

3.2.2. Equipment Operation and Maintenance Costs

The equipment needs to be maintained during its service life. The operation and maintenance cost model of the equipment is shown in Equation (15):
C o & m = 1 k j = 1 20 ( 1 + r ) j ( C o & m - w i n d + C o & m - p v + C o & m - b a t + C o & m - g r i d )
where Co&m-wind is the operation and maintenance cost of the fans in a working cycle. Co&m-pv is the operation and maintenance cost of photovoltaic array in a working cycle. Co&m-bat represents the operation and maintenance cost of the battery in a working cycle, and Co&m-grid represents the operation and maintenance cost of the inverter in a working period. r is the inflation rate, and j is the service life of the equipment. In this study, the battery was replaced every five years, and the life of the other devices was twenty years.

3.2.3. Electricity Transaction Cost of Microgrid System

The microgrids of public buildings are interconnected with the grid through grid-connected inverters, and the energy exchange with the grid is manifested by grid-connected inverters. The cost of the transactions between the public building microgrid system and the power grid in an optimization period is calculated by Equation (16).
C g r i d = t = 1 24 C E ( t ) P g r i d ( t )
where CE(t) is the electricity price at time t. In this paper, the TOU price in an optimization period is illustrated in Figure 2.

3.3. Microgrid System Grid-Connected Security Objective

In the design of a renewable power generation microgrid, the fluctuation of the grid-connected inverter is an important index for evaluating the risk of grid-connected security issues. In this study, the grid-connected inverter fluctuation is regarded as the grid-connected security objective of the microgrid system. The grid-connected inverter fluctuation index δgrid is defined as the standard deviation of the power transmitted between the grid-connected inverter and the grid. A small value of δgrid indicates a small range of inverter switching power variation and high grid-connected security of the renewable power generation system. The calculation method of δgrid is shown in Equation (17).
δ g r i d = m i n t = 1 24 ( P g r i d ( t ) P ¯ g r i d ) 2 24
where P ¯ g r i d is the average value of the electric energy exchanged between the inverter and the external grid within an optimization cycle.

3.4. Environmental Protection Objective of Public Building Microgrid System

A report from the United Nations Economic Commission for Europe, “Integrated Life-cycle Assessment of Electricity Sources,” mentioned that the carbon emissions from coal power generation are 751–1095 g CO2/kWh, while the carbon emissions from photovoltaic power generation are 27–122 g CO2/kWh, and the lowest carbon emissions from wind power generation are only 7.8–16 g CO2/kWh. Evidently, wind and photovoltaic and other renewable energy have absolute advantages in energy savings and emissions reduction.
In this study, the carbon dioxide emission reduction index Mco2 is constructed for the renewable power generation systems of public buildings to measure the contribution of wind power generation and photovoltaic power generation to the sustainable development of a low-carbon environment.
M c o 2 = m a x t = 1 24 [ ( m g r i d - c o 2 m w i n d - c o 2 ) P w i n d ( t ) + ( m g r i d - c o 2 m p v - c o 2 ) P p v ( t ) ]
where mgrid-co2 is the carbon emission of coal power generation, mwind-co2 is the carbon emission of fan power generation, and mpv-co2 is the carbon emission of photovoltaic power generation.

4. Constraint Condition

4.1. Power Balance Constraint

To balance the load demand and ensure the stable operation of the system. Power balance constraint is given by Equation (19).
P p v ( t ) + P w i n d ( t ) + P b a t ( t ) + P g r i d ( t ) = P l o a d ( t )
In Equation (19), the left side of the equation represents the source of electric energy supply in public buildings at time t, and the right side of the equation represents the energy load of public buildings. It should be noted that when Pbat(t) is negative, the battery is in the charging state, which is equivalent to the load; when Pgrid(t) is negative, it means that the microgrid has surplus electric energy and sells electricity to the grid.

4.2. Constraint of Active Power Shortage of New Energy Power Generation System

In the microgrid system of public buildings, insufficient active power from the power supply will lead to the decrease of the frequency of the microgrid, which may seriously lead to the collapse of the microgrid. It is necessary to ensure the reliability of the power supply of the renewable energy generation system and limit the active power deficiency of the renewable energy generation system within the permissible range. The active power deficiency rate δloss is the ratio between the insufficient energy and the demand load of the generation system, and the calculation method is given by Equation (20).
δ l o s s = P l o a d ( t ) [ P w i n d ( t ) + P p v ( t ) + P b a t ( t ) ] P l o a d ( t ) δ l o s s , m a x
where δloss,max is the maximum active power deficiency rate of the new energy power generation system.

4.3. Restriction on the Number of Installed PV Arrays

The hot spot effect in photovoltaic modules caused by the mutual occlusion of the photovoltaic arrays will reduce the service life and output power of the photovoltaic modules. In order to ensure the normal operation of the photovoltaic arrays, a reasonable distance between PV arrays is required prior to installation. Taking the winter solstice as an example, the declination angle at this time is −23.26°, and there is no shading phenomenon during the effective photovoltaic power generation time (solar hour angle 45°~−45°), so there is no shading phenomenon throughout the year. The spacing between adjacent photovoltaic arrays is calculated as shown in Equation (21).
D p v - p v = L p v s i n α t a n 4 5 ° t a n φ + t a n 23.26 ° t a n 4 5 ° t a n 23.26 ° t a n φ
where Dpv-pv is the distance between adjacent PV arrays and Lpv is the length of the photovoltaic array. α is the angle between the photovoltaic array and the horizontal plane, which is 30° in this paper. φ is the latitude of photovoltaic placement area, which is 32.24° N in this paper.
In this paper, photovoltaic power generation is developed on the roof of public buildings. The maximum capacity of the photovoltaic array is constrained by the area of the roof, and the actual number of photovoltaic arrays that can be installed is mainly affected by the size of the photovoltaic panels and the effective area of the roof. The roof is a regular rectangular flat roof, and the roof area is an effective area. The installation method for the photovoltaic panels has their long sides parallel to the long side of the roof, and 20% of the roof space is reserved for easy maintenance. The calculation method for the maximum number of photovoltaic panels is as follows:
N p v , m a x = 80 % × L r o o f l p v c o s α + D p v p v × D r o o f d p v
where Npv,max is the maximum number of photovoltaic panels installed, · is the downward integral function, Lroof is the length of the roof, Droof is the width of the roof and dpv is the width of the photovoltaic panels.
The constraint on the installed quantity of photovoltaic arrays is shown in Equation (23):
N p v N p v , m a x
where Npv is the actual number of photovoltaic arrays installed.

4.4. Fan Installation Quantity Constraint

The fan is set up in the open space on the roof of the building. In general, the distance between adjacent fans in the longitudinal direction is not less than five times the fan diameter, and the distance between adjacent fans in the transverse direction is not less than three times the fan diameter.The maximum number of installed fans and the constraints on the number of fans are expressed in Equations (24) and (25), respectively.
N f a n , m a x = L r o o f 5 D f a n × D r o o f 3 D f a n
N f a n N f a n , m a x
where Nfan is the actual installed number of fans, and Nfan,max is the maximum installed number of fans.

4.5. Wind and Photovoltaic Complementary Power Generation Constraints

On the one hand, due to the limited installation area, a reasonable allocation of the number of fans and photovoltaic installation is conducive to space utilization. On the other hand, photovoltaic power generation is relatively large during the day, while only wind power outputs at night, so the characteristics of both should be fully utilized to balance the power output. The constraints are shown in Equations (26) and (27):
N f a n S f a n + N p v S p v S r o o f
K m i n N p v P p v N f a n P w i n d K m a x
where Sfan is the floor area of the fan installation, Spv is the area occupied by a single photovoltaic array considering the distance between photovoltaic arrays and Spv = (Lpvcosα + Dpv-pv)dpv. Kmin and Kmax are the minimum and maximum values of the ratio between wind power and photoelectric power, respectively.

4.6. Battery Constraints

The most commonly used battery scheduling model in the latest research [18,19,20,21,22,23,24,25] has several notable features. The first, which ensures that the battery is in a safe state of charge during any running time, can be expressed by Equation (28).
S O C b a t , m i n S O C b a t ( t ) S O C b a t , m a x
where SOCbat,min is the minimum state of charge to ensure the safe operation of the battery, which is valued at 20% in this study. SOCbat,max is the maximum charge state of the battery, which is valued at 100%. The charging and discharging power of the battery cannot exceed the maximum charging and discharging power of the battery, which can be represented by Equation (29).
0 P b a t ( t ) P b a t , m a x
where Pbat,max is the maximum allowable charging and discharging power of the battery. When Pbat(t) is negative, the battery is charged; while Pbat(t) is positive, the battery is discharged. As shown in Equation (30), it is also necessary to ensure that the battery can return to its original state after one operation cycle, which means that the total charge and discharge power within one operation cycle is zero.
t = 1 24 P b a t ( t ) Δ T = 0
where ∆T is the optimization running time step, and its value in this paper is one hour.

5. Methods

5.1. Outline of NSGA-II

Some of the methods for solving multi-objective problems proposed in the literature review are analyzed. One method is to convert multi-objective problems into single-objective problem solving. Multi-objective optimization using this method is generally faced with the problem that it needs to assign weight to each objective in the multi-objective problem, and the process of assigning weight is very dependent on the tendency of the decision makers. For different optimization problems, this kind of decision tendency is not the same, so it is not universal.
Due to its non-dominant principle, NSGA can solve multi-objective optimization in a real sense without considering the will of decision makers, so it is widely used in multi-objective scheduling optimization of power systems. However, NSGA algorithm still has shortcomings in the field of practical engineering. Non-dominated sorting has high computational complexity, the absence of elite strategy may lead to the loss of some outstanding individuals and the need to manually specify shared parameters, which undoubtedly increases the workload of the algorithm. All these factors will prolong the running speed of the algorithm.
The NSGA-II is an algorithm improved by Deb et al. based on some defects of the NSGA, mainly including the following improvements:
  • The fast non-dominated sorting method reduces the computational complexity of non-dominated sorting;
  • Elite strategy is introduced to expand the sampling space and improve the accuracy of the optimization results;
  • The introduction of crowding comparison operators overcome the defect that shared parameters need to be specified in the NSGA, and the crowding comparison operators are used as the comparison criteria between individuals of the population.
  • The individuals of the population are evenly distributed in the whole Pareto frontier to ensure the diversity of the population. The NSGA-II is described in detail in reference [41].
Deb et al. also proposed a super-dimensional multi-objective solving algorithm, NSGA-III, whose basic algorithm framework is roughly the same as that of the NSGA-II, but with a different selection mechanism [42,43]. The NSGA-II uses the crowded distance method to select individuals with the same non-dominant rank, while the NSGA-III uses the reference point method to select individuals. The NSGA-III adopts a method based on reference points to solve the problem of the poor convergence and diversity of the algorithm if the crowding distance continues to exist in a multi-objective optimization problem with more than three objectives. The NSGA-III is a good way to solve many objective optimization problems. However, in this paper, only three objective functions are set, and the NSGA-II has ensured the uniform distribution of Pareto solutions.

5.2. Application and Defect of NSGA-II

The NSGA-II has become one of the most popular multi-objective optimization algorithms. It has the ability to deal with large space problems when dealing with multi-objective optimization. The NSGA-II does not require prior knowledge of the problem domain and is insensitive to the convexity of the solution model. However, there is also the problem of unsatisfactory processing constraints.
The penalty function method is an approach to solving the restriction by adding the constraint term with a penalty factor into the fitness function. It is viable for transforming non-convex functions to convex relaxation functions using a penalty function [33]. However, choosing the penalty factor of the penalty term is always a difficult problem. It is also pointed out in reference [34] that using a penalty function to solve the restriction may result in a smaller number of possible solutions.
The Pareto dominance relation is commonly used to deal with constraints [44]. In this approach, an indicator is set to measure the degree to which the solution violates the constraint. However, the solution set derived by this method cannot completely satisfy the constraints, and some of the solution sets are actually outside the constraint space. Especially for energy storage systems, there is often a mismatch between operational solutions and actual physical phenomena.

5.3. The Improvement of NSGA-II

In this study, the improved NSGA-II is used to solve the model. The decision variables are the number of fans and photovoltaic panels, the capacity of the battery banks and grid-connected inverters, and the charging and discharging variation of the energy storage system within 24 h. The method of population generation is real coding, and the objective function is used as fitness functions to solve the optimal multi-objective combination configuration under constraints.
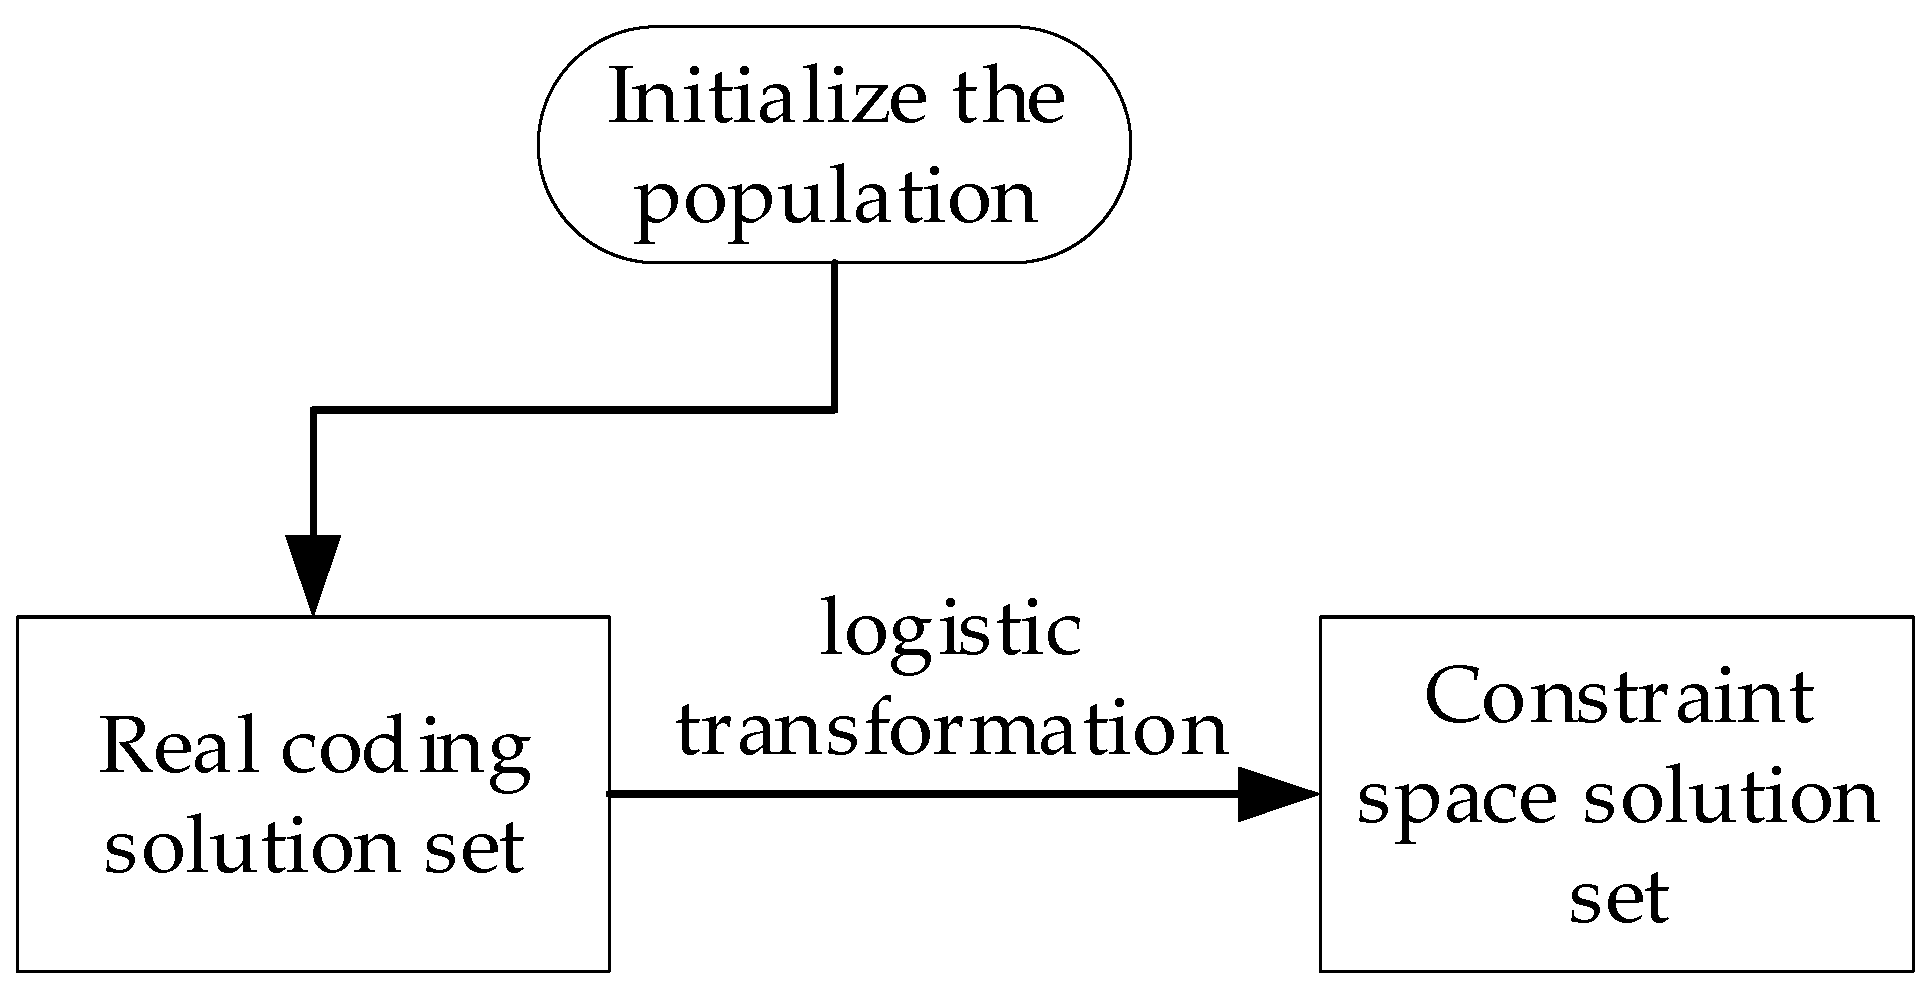
In view of the problem that the penalty function method may reduce the optimization performance and the non-dominant method cannot entirely achieve the strongly constrained solution. A constraint processing method for spatial transformation is proposed, and its processing flow is shown in Figure 3.
The basic idea of this method is to convert the variables generated by real encoding into other variables that satisfy the constraints, so as to complete the transformation process from the coding space to the constrained space. The transformation from the coding space to the constraint space can naturally make the variables satisfy the constraints without decreasing the number of feasible solutions. At the same time, the constrained nonlinear optimization problem is transformed into an unconstrained nonlinear optimization problem by using this variable transformation method.
In this paper, the energy storage system is strongly constrained in view of the phenomena that violate the actual physical meaning in the optimization results. The logic of variable transformation under the strong constraint of energy storage is given by using the proposed spatial transformation method. The constraints of the energy storage system are shown in Equations (28)–(30). x(t) is the ratio of Pbat(t) to Cbat,max and represents the change in state of charge.
x ( t ) = P b a t ( t ) C b a t , m a x
Equations (28)–(30) can be simplified as Equation (32):
t = 1 24 x ( t ) = 0 x m i n x 0 + t = 1 t x ( t ) x m a x , t = 1 , 2 , 24 x m a x x ( t ) x m a x
where x0 is the state of charge at the initial moment of the energy storage system, xmax is the maximum state of charge and xmin is the minimum state of charge. Assuming x′(t) is the variable that satisfies the constraints after the spatial transformation, and the transformation logic is given as follows:
  • The transformation logic of the equality constraint t = 1 24 x ( t ) = 0 :
    x ( t ) = x ( t ) t = 1 24 x ( t ) 24
In Equation (33), subtracting the mean value of the initial coding variable during optimization means that the DC component is eliminated, so that the transformed coding naturally satisfies the equality constraint.
  • The transformation logic of inequality constraints
The inequality constraint x m i n x 0 t = 1 t x ( t ) x m a x x 0 needs to be satisfied in all optimization periods. The constraint condition is not satisfied in the following two cases of optimization variables:
t = 1 t x ( t ) > x m a x x 0 , o r t = 1 t x ( t ) < x m i n x 0
At this time, the maximum absolute value m a x t = 1 t x ( t ) of t = 1 t x ( t ) is calculated, and all variable values are compressed by multiples of this maximum absolute value. Then the transformed variables can meet the inequality constraint. The calculation method is shown in Equation (35):
x ( t ) = x ( t ) m a x t = 1 t x ( t ) x m i n x 0 t = 1 t x ( t ) x m a x x 0
The inequality constraint −xmax ≤ x(t) ≤ xmax can be satisfied by setting upper and lower limits when coding, without considering transformation.

5.4. STNSGA-II Algorithm Flow

The parameters of the algorithm are set as follows: the population number is sizepop = 2000, the number of iterations is Gen = 500, the crossover probability is pc = 0.9, and the mutation probability is pm = 0.1.
First, the initial population is generated by encoding real numbers in the range of variables. Then, the coding space solution set is transformed into a constraint space solution set that meets the constraint conditions by logic transformation, and the fitness value is calculated. According to the calculated fitness value, the original population of the real coding space is sorted according to the fast non-dominated sorting and crowding computing principles. Half of the parent population was selected to participate in mating by competitive competition, the offspring population was generated by crossing and mutation, and the offspring and parent generations were merged to form the combined population. The combined population was logically transformed to meet the constraints, and then the fitness value of the combined population was calculated. According to the calculated fitness value of the combined population, the combined population was ranked according to the fast non-dominated ranking and crowding principle. We selected the top sizepop populations in the sorted combined population as the parent generation of the next iteration, and judged whether the iteration termination condition was met until the end of the iteration. The flow chart of the STNSGA-II is shown in Figure 4.

6. Case Studies and Simulation Results

6.1. Simulation Case and Initial Data Processing

6.1.1. Simulation Case

In this paper, a public gymnasium in Yangzhou is taken as an example for simulation analysis. The building has four floors above ground and two floors underground, with a length of 171.75 m, an external width of 80.3 m and a height of 25.55 m. There are two regular rectangular open spaces on the roof of the building, with a total available roof area of 75 × 100 + 68 × 67 m2. The fans and photovoltaic arrays are installed on the roof.
According to the annual actual meteorological data in Yangzhou, the power generation capacity of the renewable power generation system is obtained by combining the above established fan and photovoltaic models. To avoid an unreasonable selection of the typical daily load under the influence of meteorological and seasonal factors, the curve of the sunrise force of the fan and photovoltaic array and the curve of daily electric load of the building under the equilibrium condition are obtained through daily average processing. The renewable power generation system and energy storage system are combined for short-term optimal scheduling. The optimal allocation scheme based on multi-objective conditions is analyzed in this paper.

6.1.2. Fan Data Processing

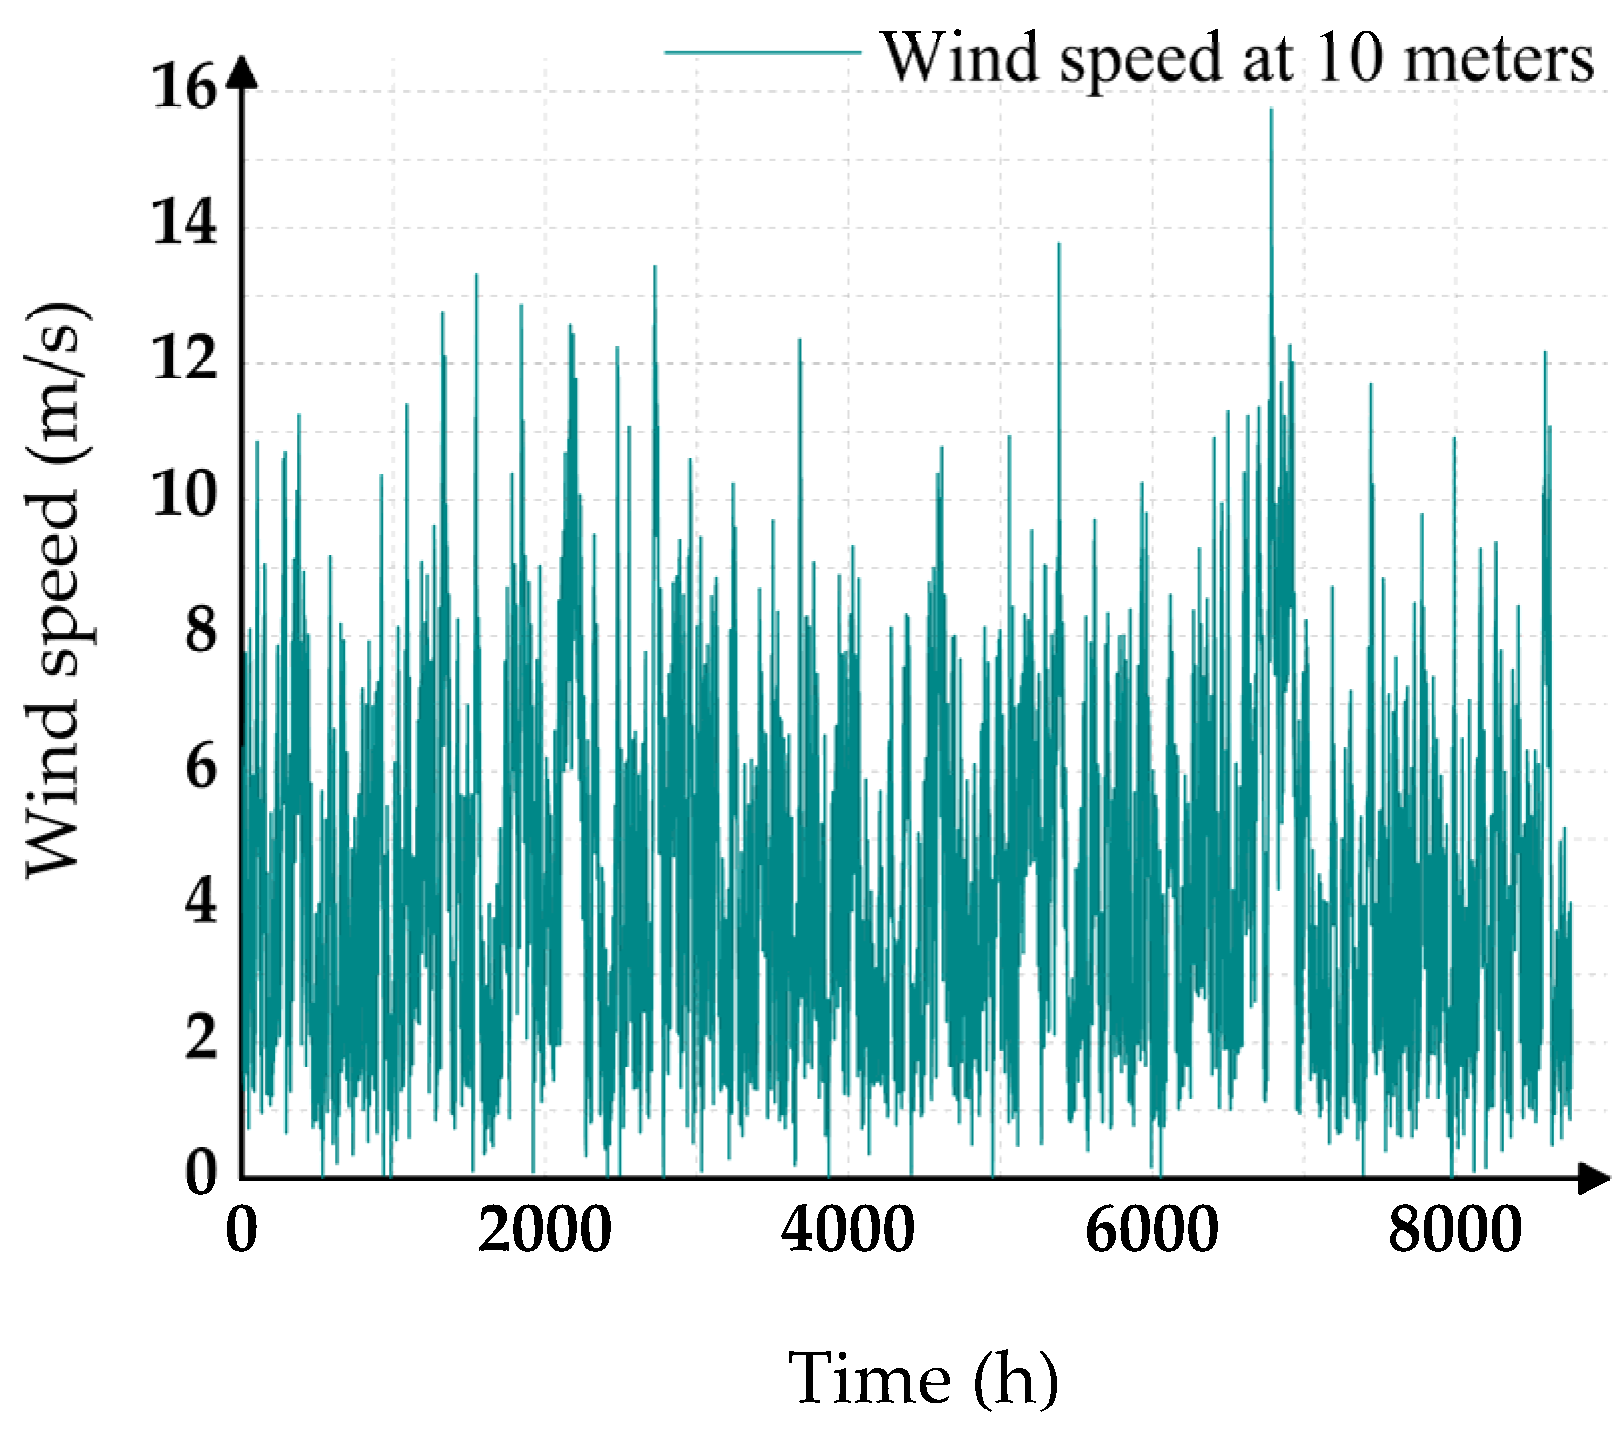
In this paper, the wind speed at a 10 m high observation point is selected as the original data, as shown in Figure 5. The fan models and parameters selected in this paper are shown in Table 1.
The wind speed at the hub of the fan wheel is modified according to Equations (2) and (4), and the modified wind speed is shown in Figure 6:
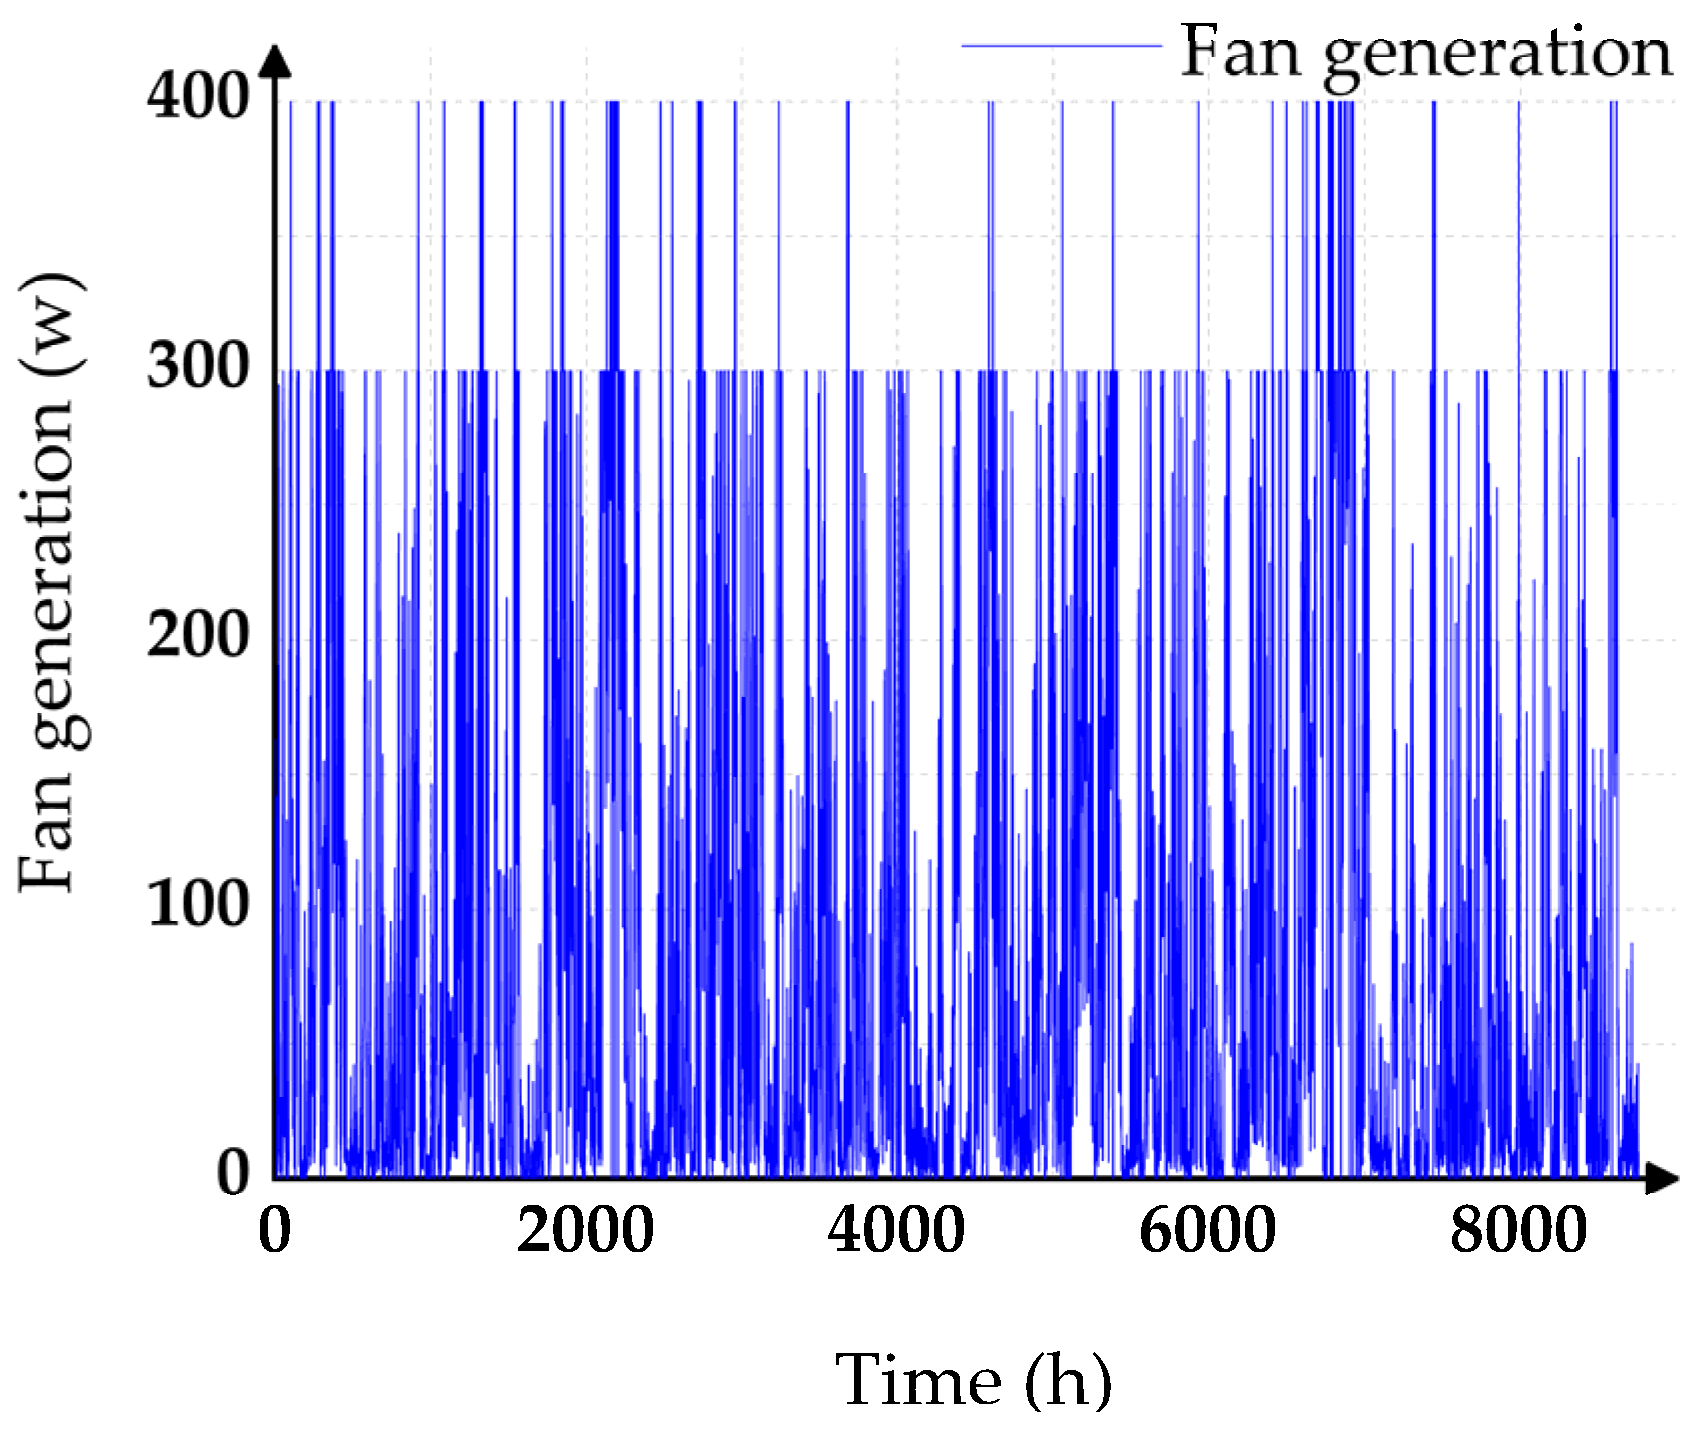
The annual hourly energy yield of a single fan is calculated by Equation (3) based on the modified wind speed and selected fan parameters, and the energy yield is shown in Figure 7.

6.1.3. Photovoltaic Arrays Data Processing

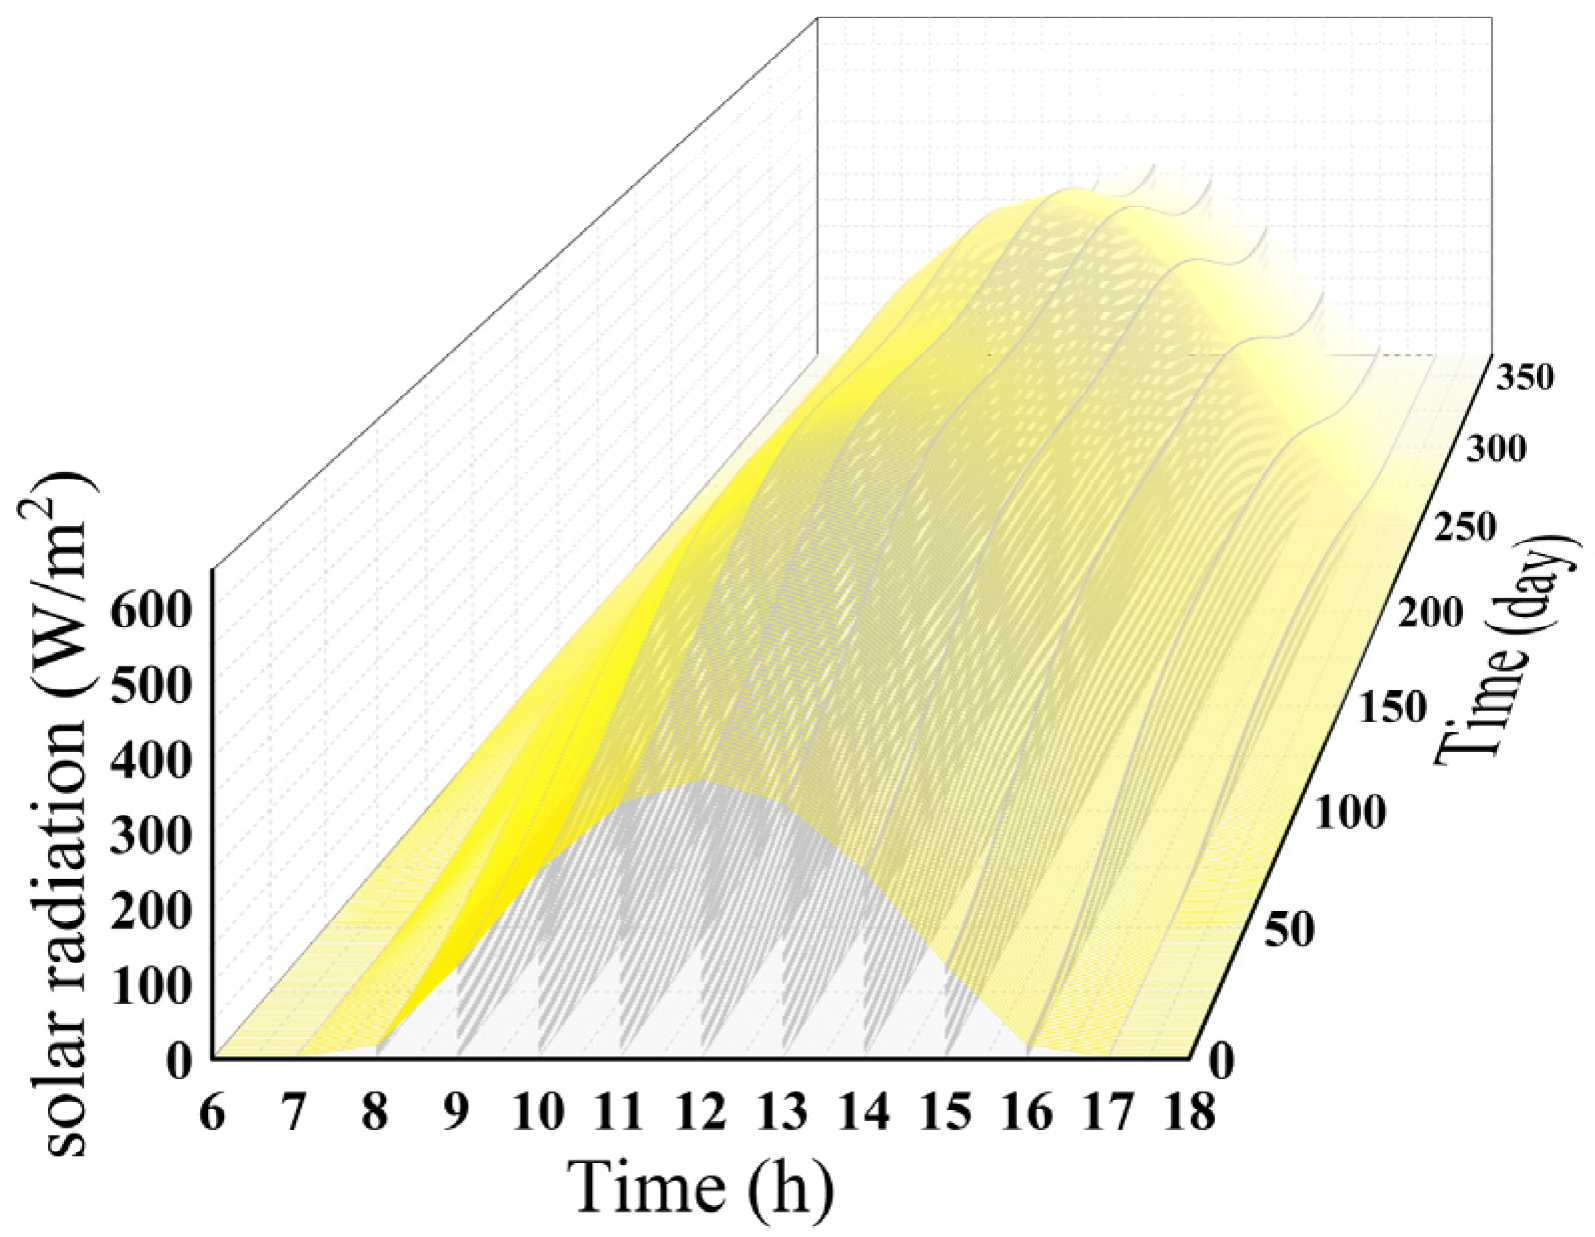
The original data for the annual solar radiation intensity distribution obtained by the Yangzhou Meteorological Bureau is shown in Figure 8:
As can be seen from Figure 8, due to the influence of the plum rain season in Yangzhou City, the effective solar radiation in the summer decreased compared with that in spring and autumn. Table 2 shows the model and parameters of the selected PV panel.
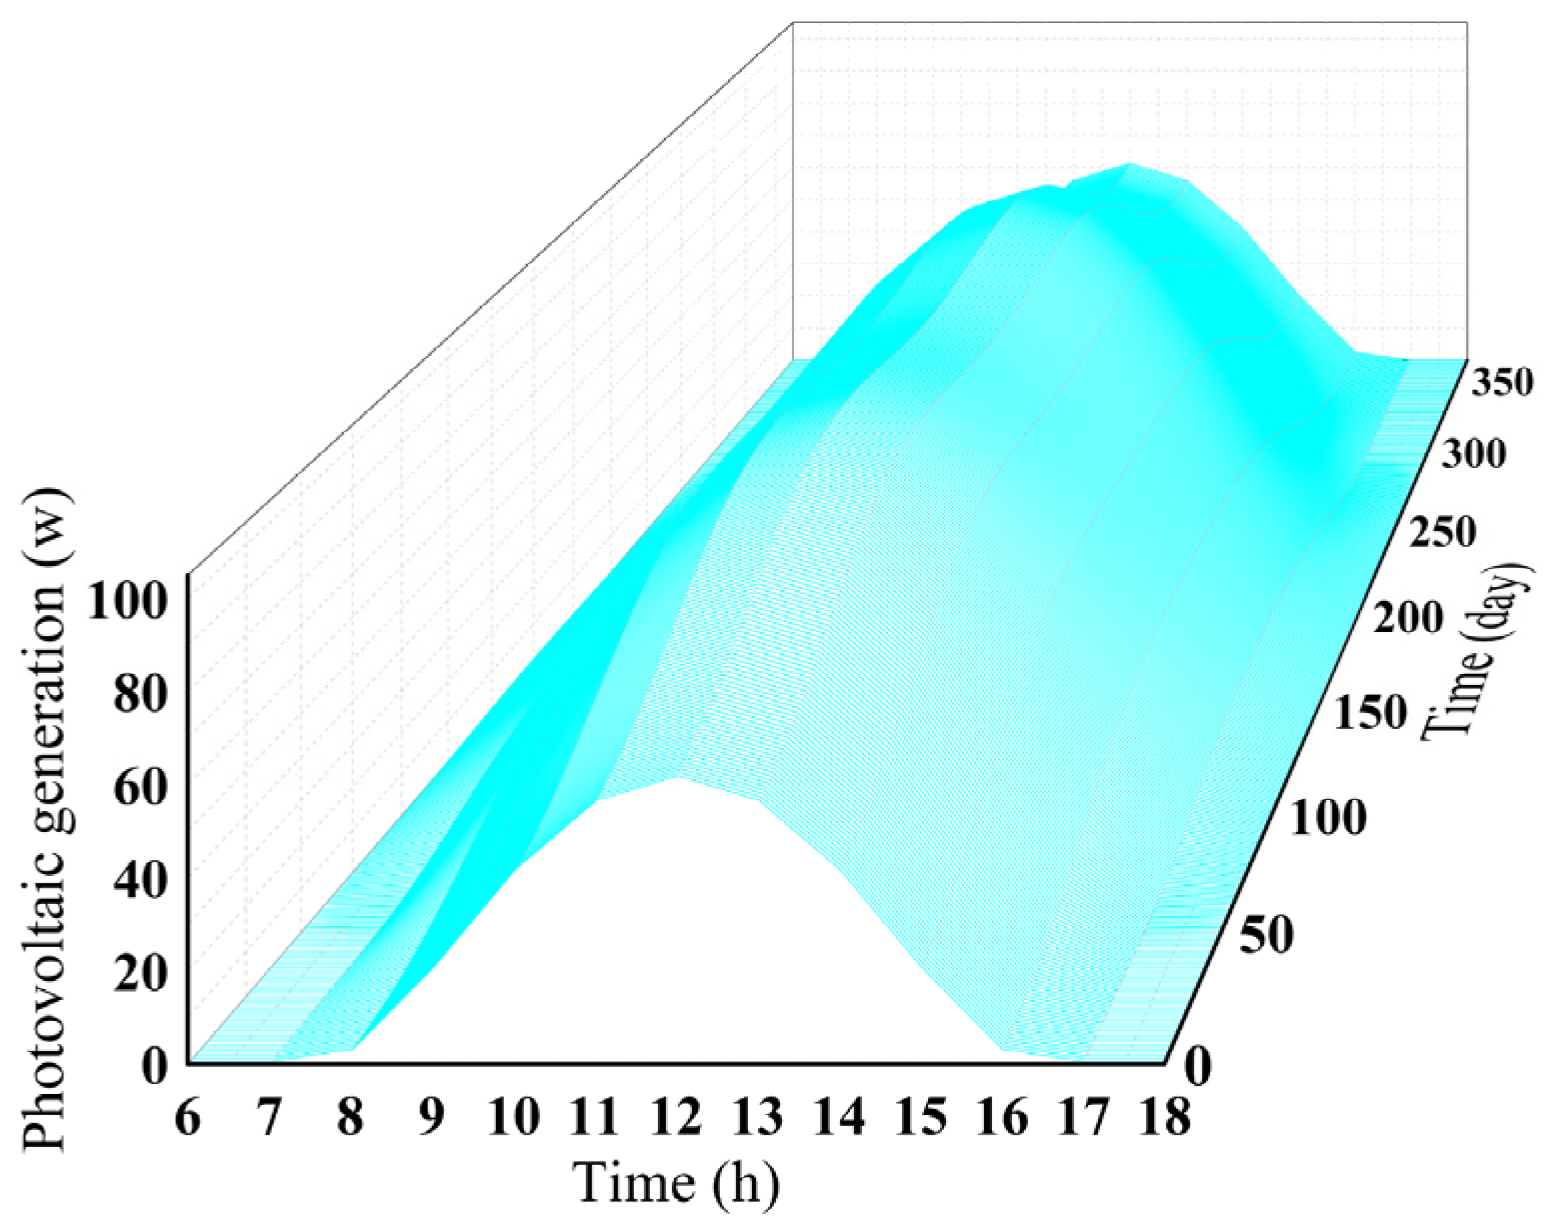
The annual hourly energy yield of a single photovoltaic panel can be obtained by substituting the solar radiation amount and the selected photovoltaic panel parameters into Equation (5), as shown in Figure 9 below:

6.1.4. Building Electricity Load

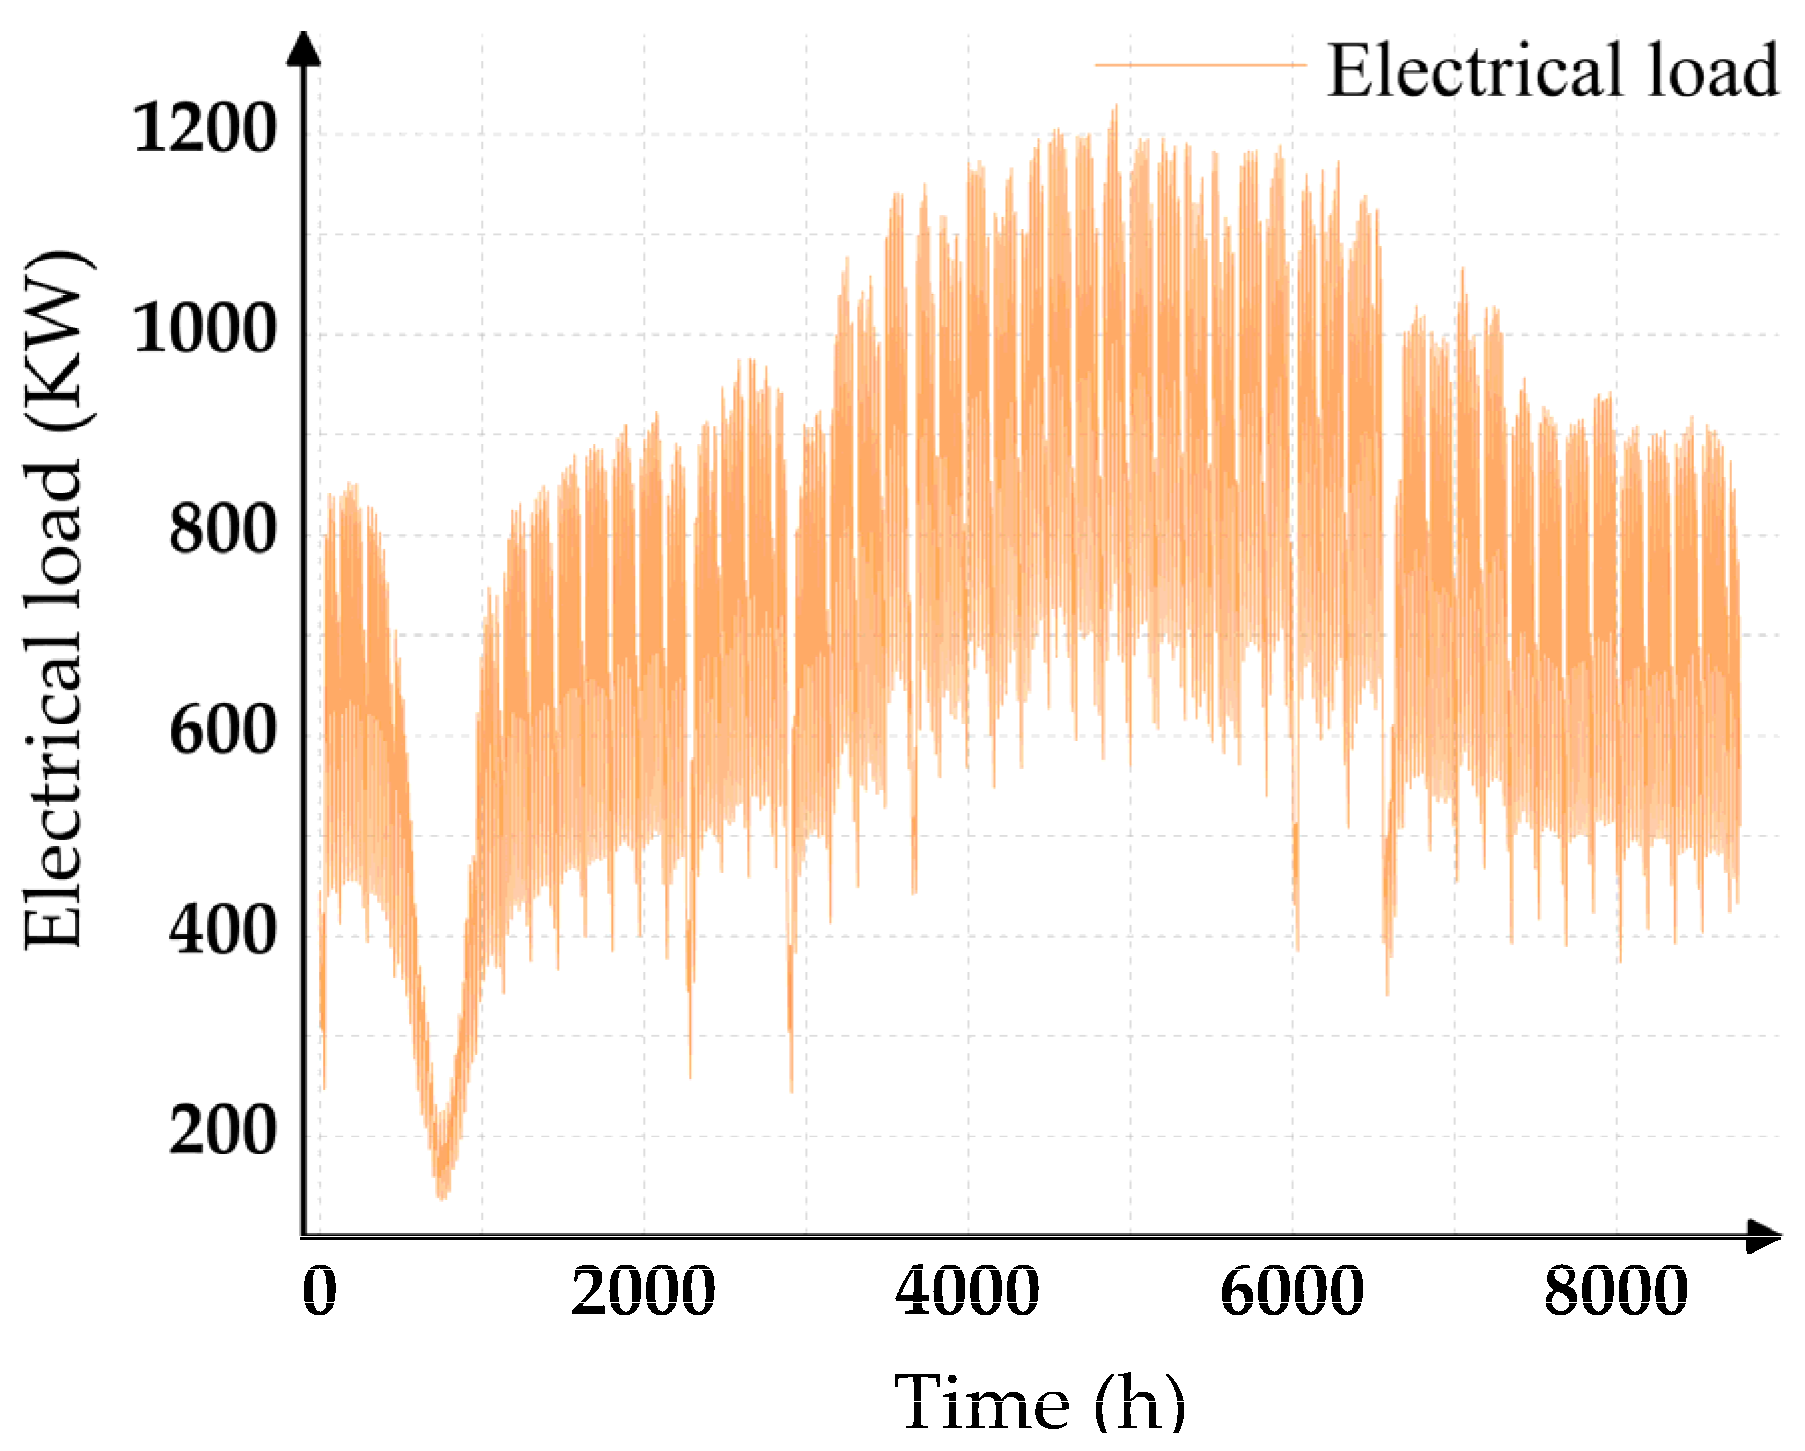
In this paper, the annual electricity load data of the public sports center is shown in Figure 10.
It can be seen that this building has typical summertime peak energy characteristics.

6.1.5. Datas Averaging Processing

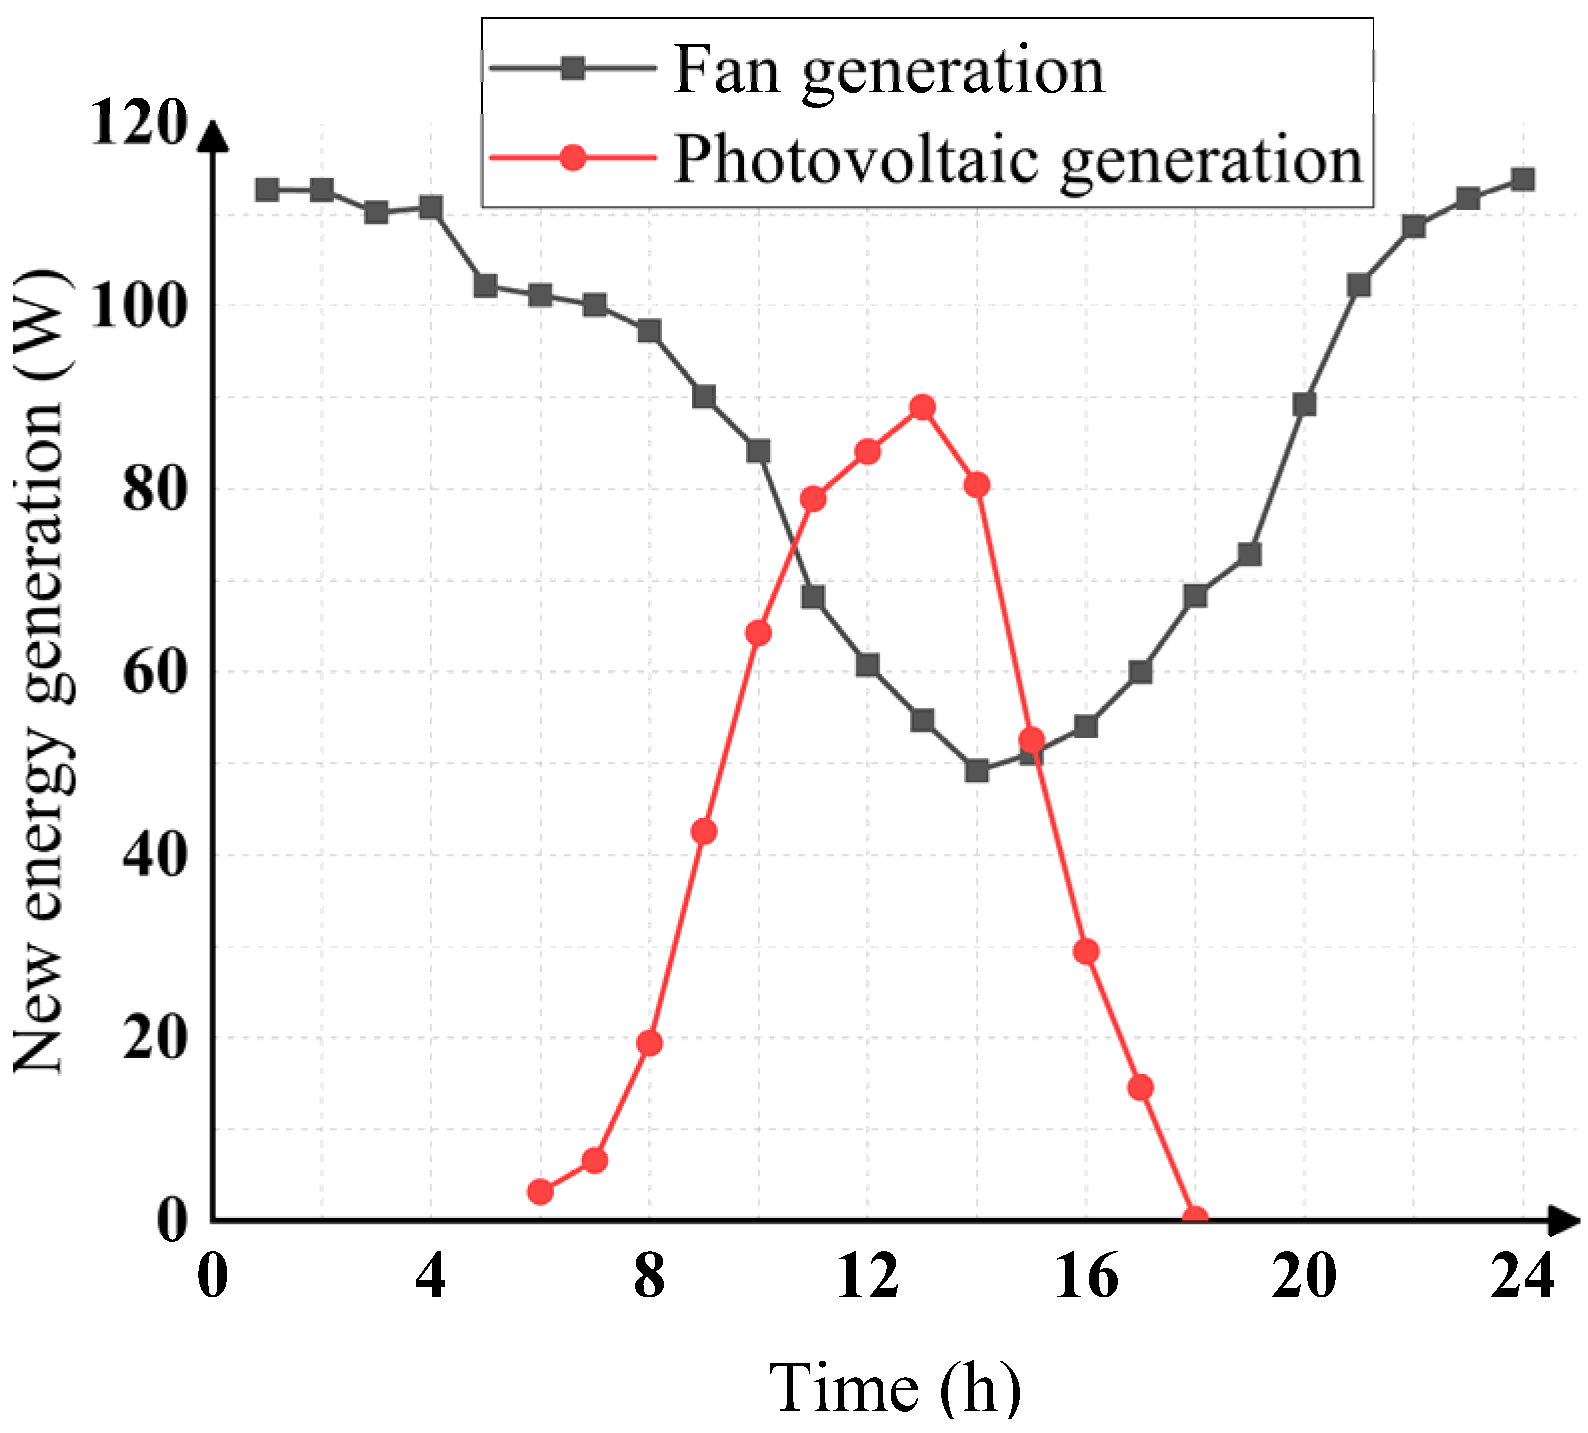
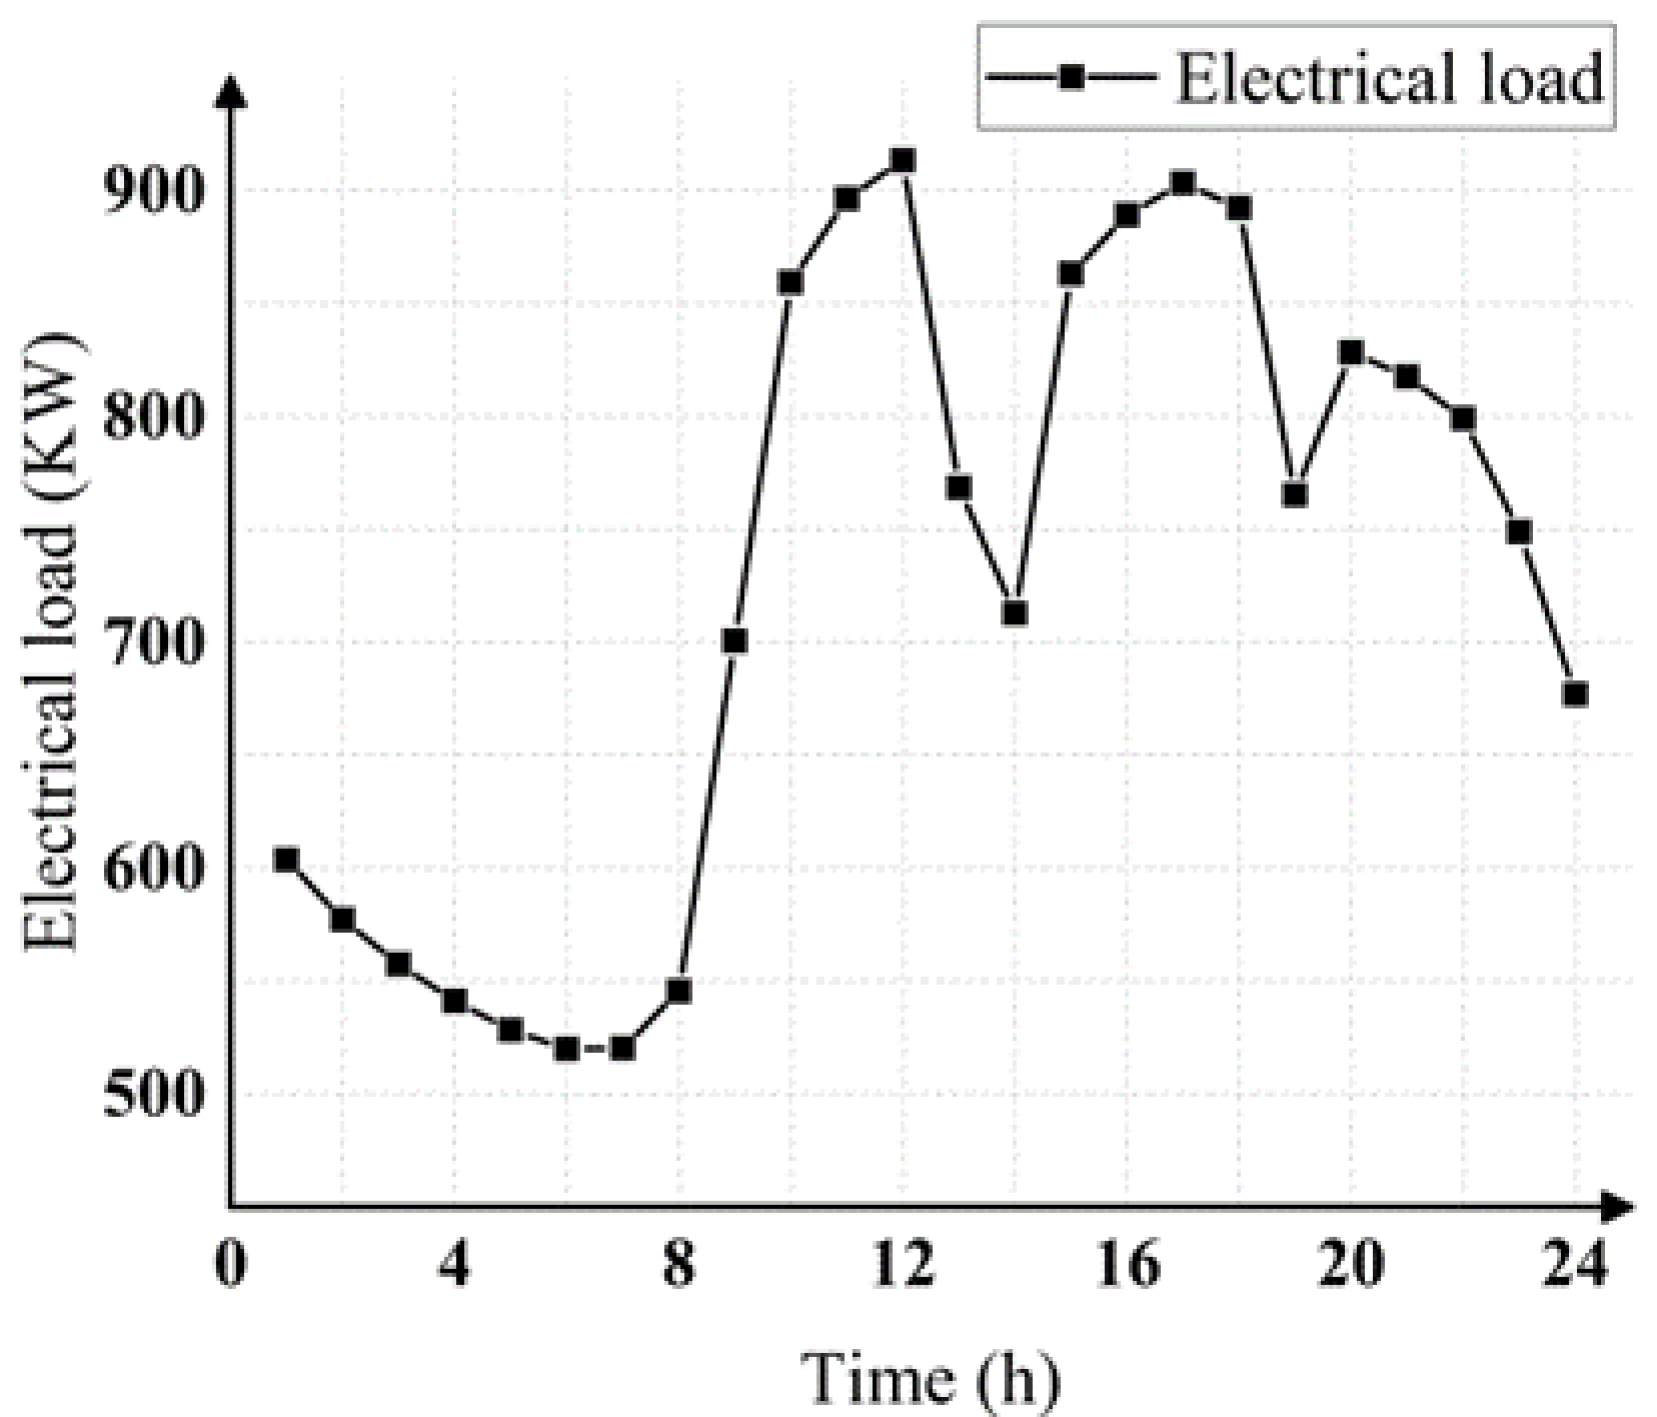
According to the daily averaging method proposed in this paper, the average daily energy production of a single fan and a single photovoltaic block and the average daily load of the building can be obtained. The average daily result is shown in Figure 11 and Figure 12.
The curves in Figure 11 shows the sunrise force of a single fan and a single photovoltaic block after daily averaging. The output of the fan will decrease to a certain extent during the day, and the output of the fan will be large at night. However, the output of the photovoltaic block is zero at night but reaches the maximum at noon. The curve in Figure 12 is the daily electricity load curve for the gymnasium after the annual load is daily averaged, and it basically conforms to the typical daily load characteristics of the region.

6.2. Simulation Results of Multi-Objective Optimization and Analysis

6.2.1. Simulation Results

In this paper, the optimization period is 24 h. Under this short time scale, the capacity allocation and operation optimization of the renewable power generation system combined with energy storage system are carried out under the condition of three objectives. The STNSGA-II proposed in this paper is used to solve the constrained multivariate nonlinear programming problem, and its performance is compared with that of the NSGA-II. Table 3 shows the initial installation cost and operation and maintenance costs of each device in this paper.
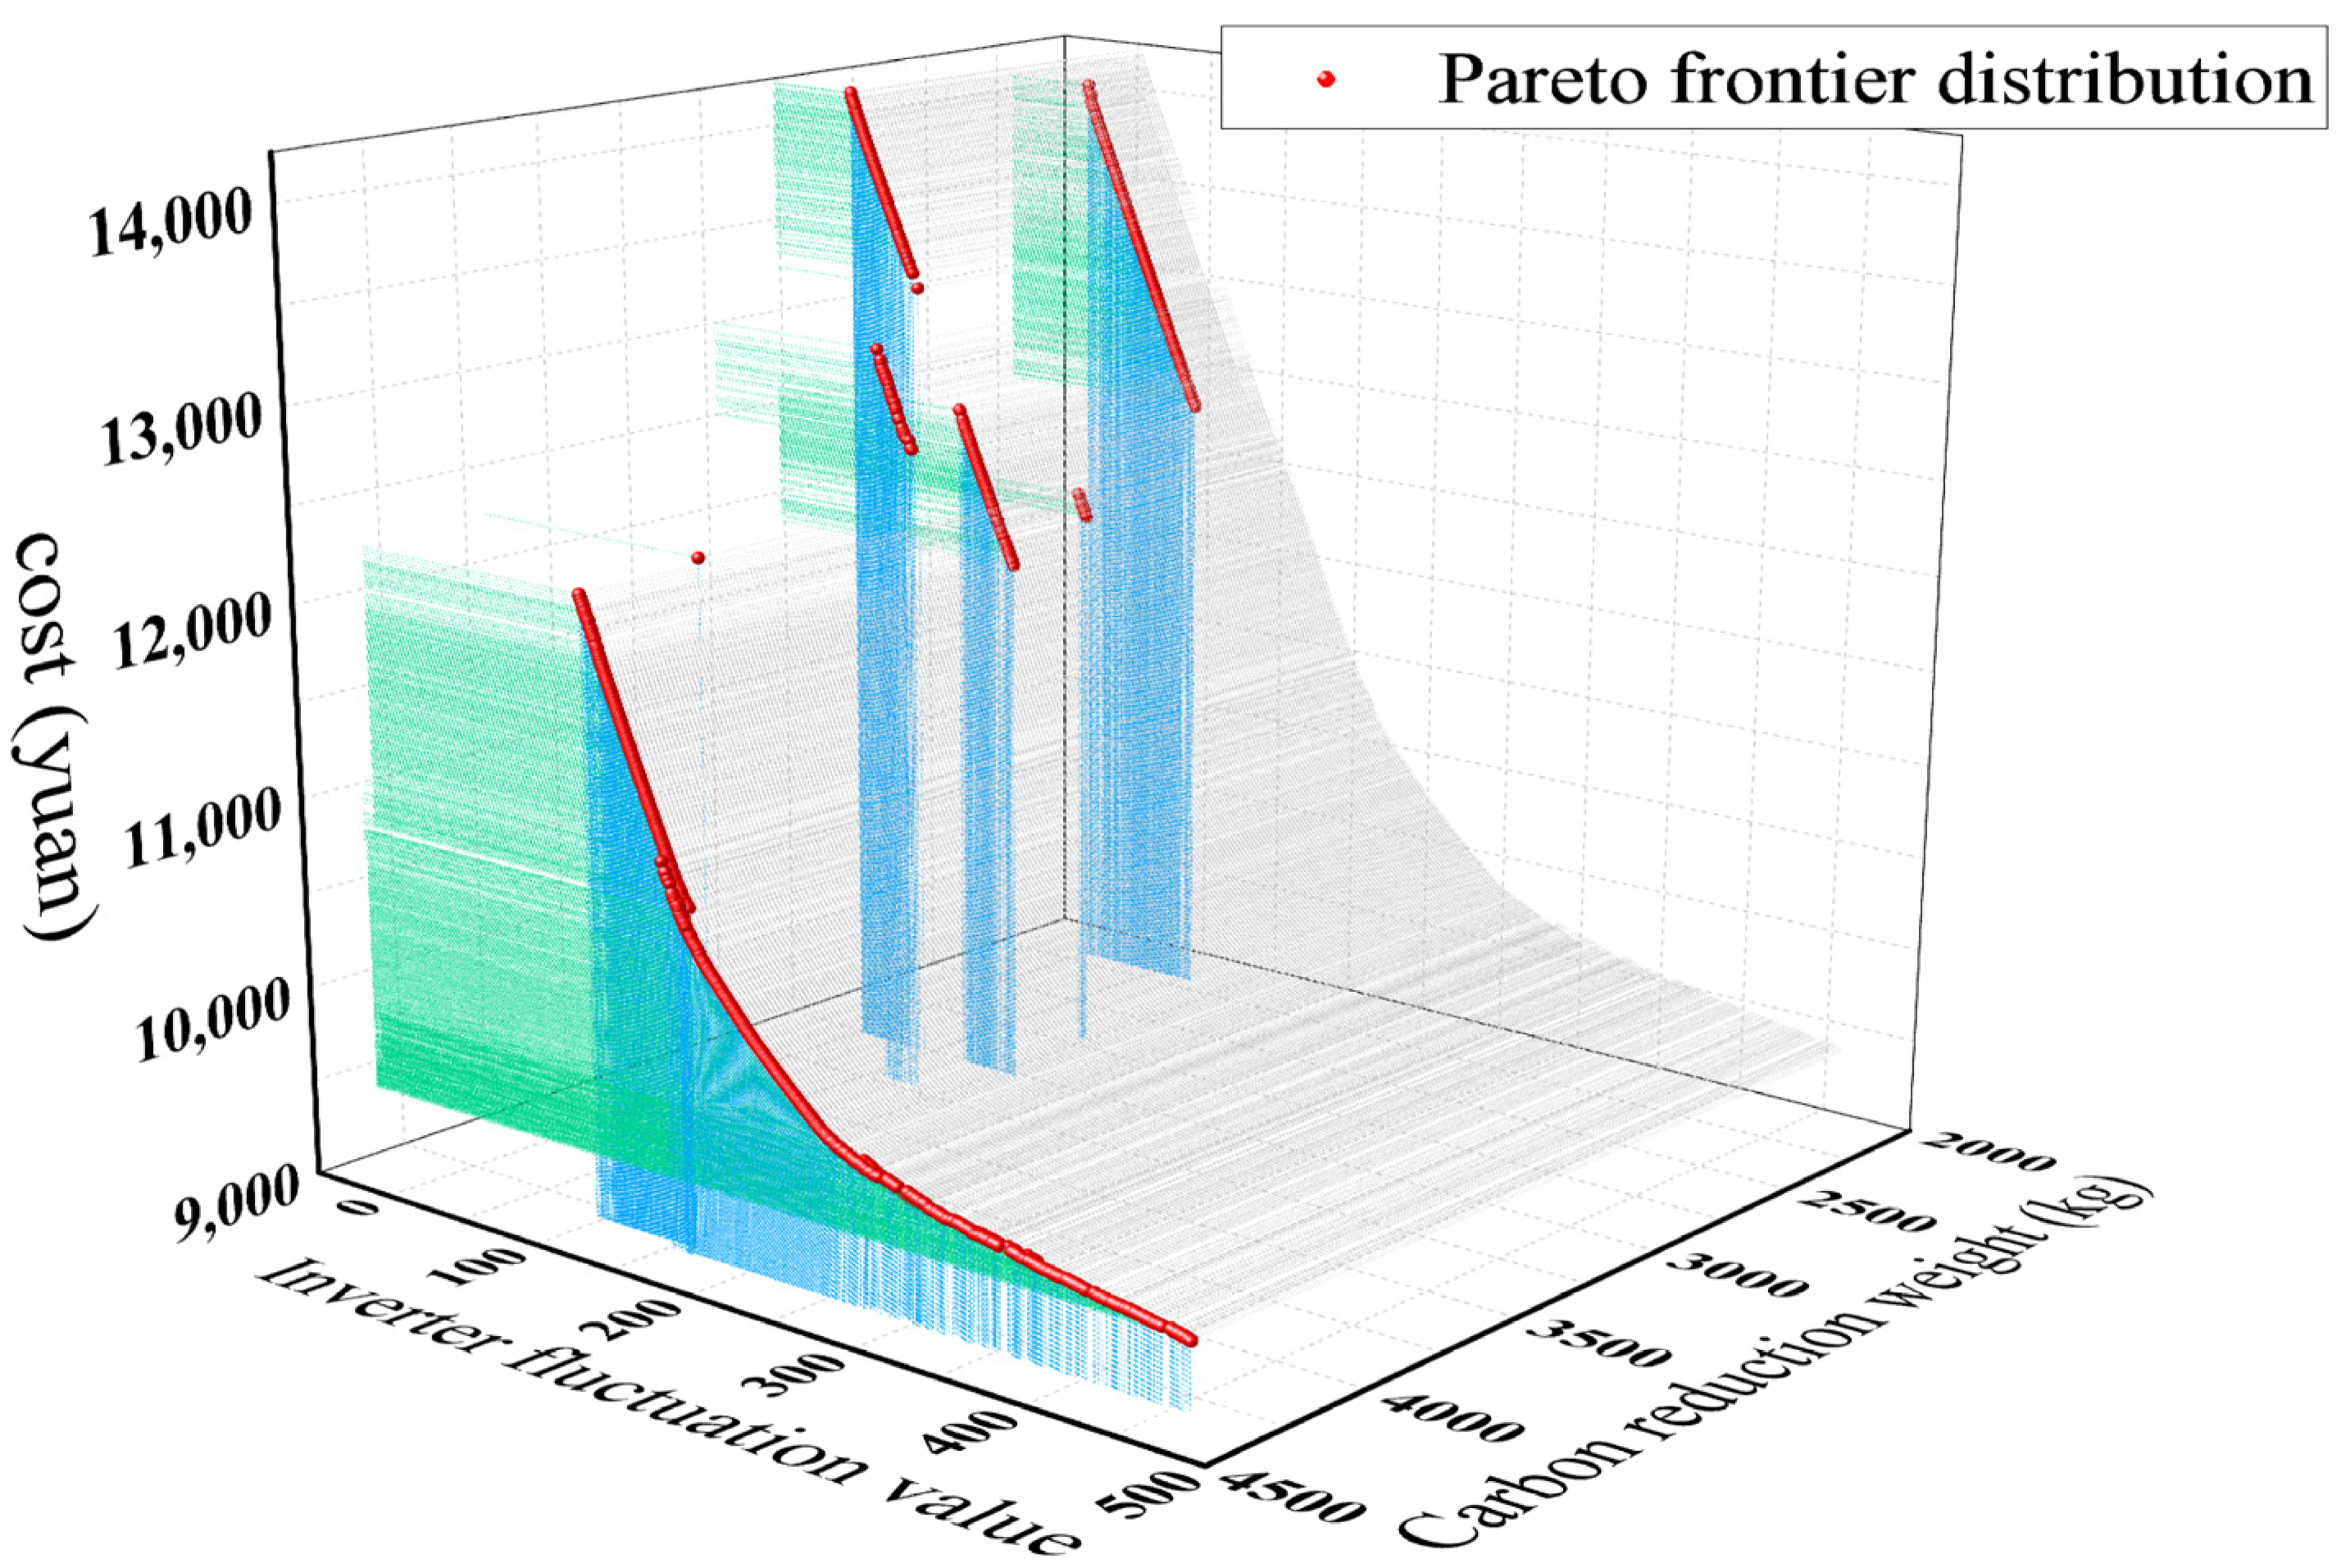
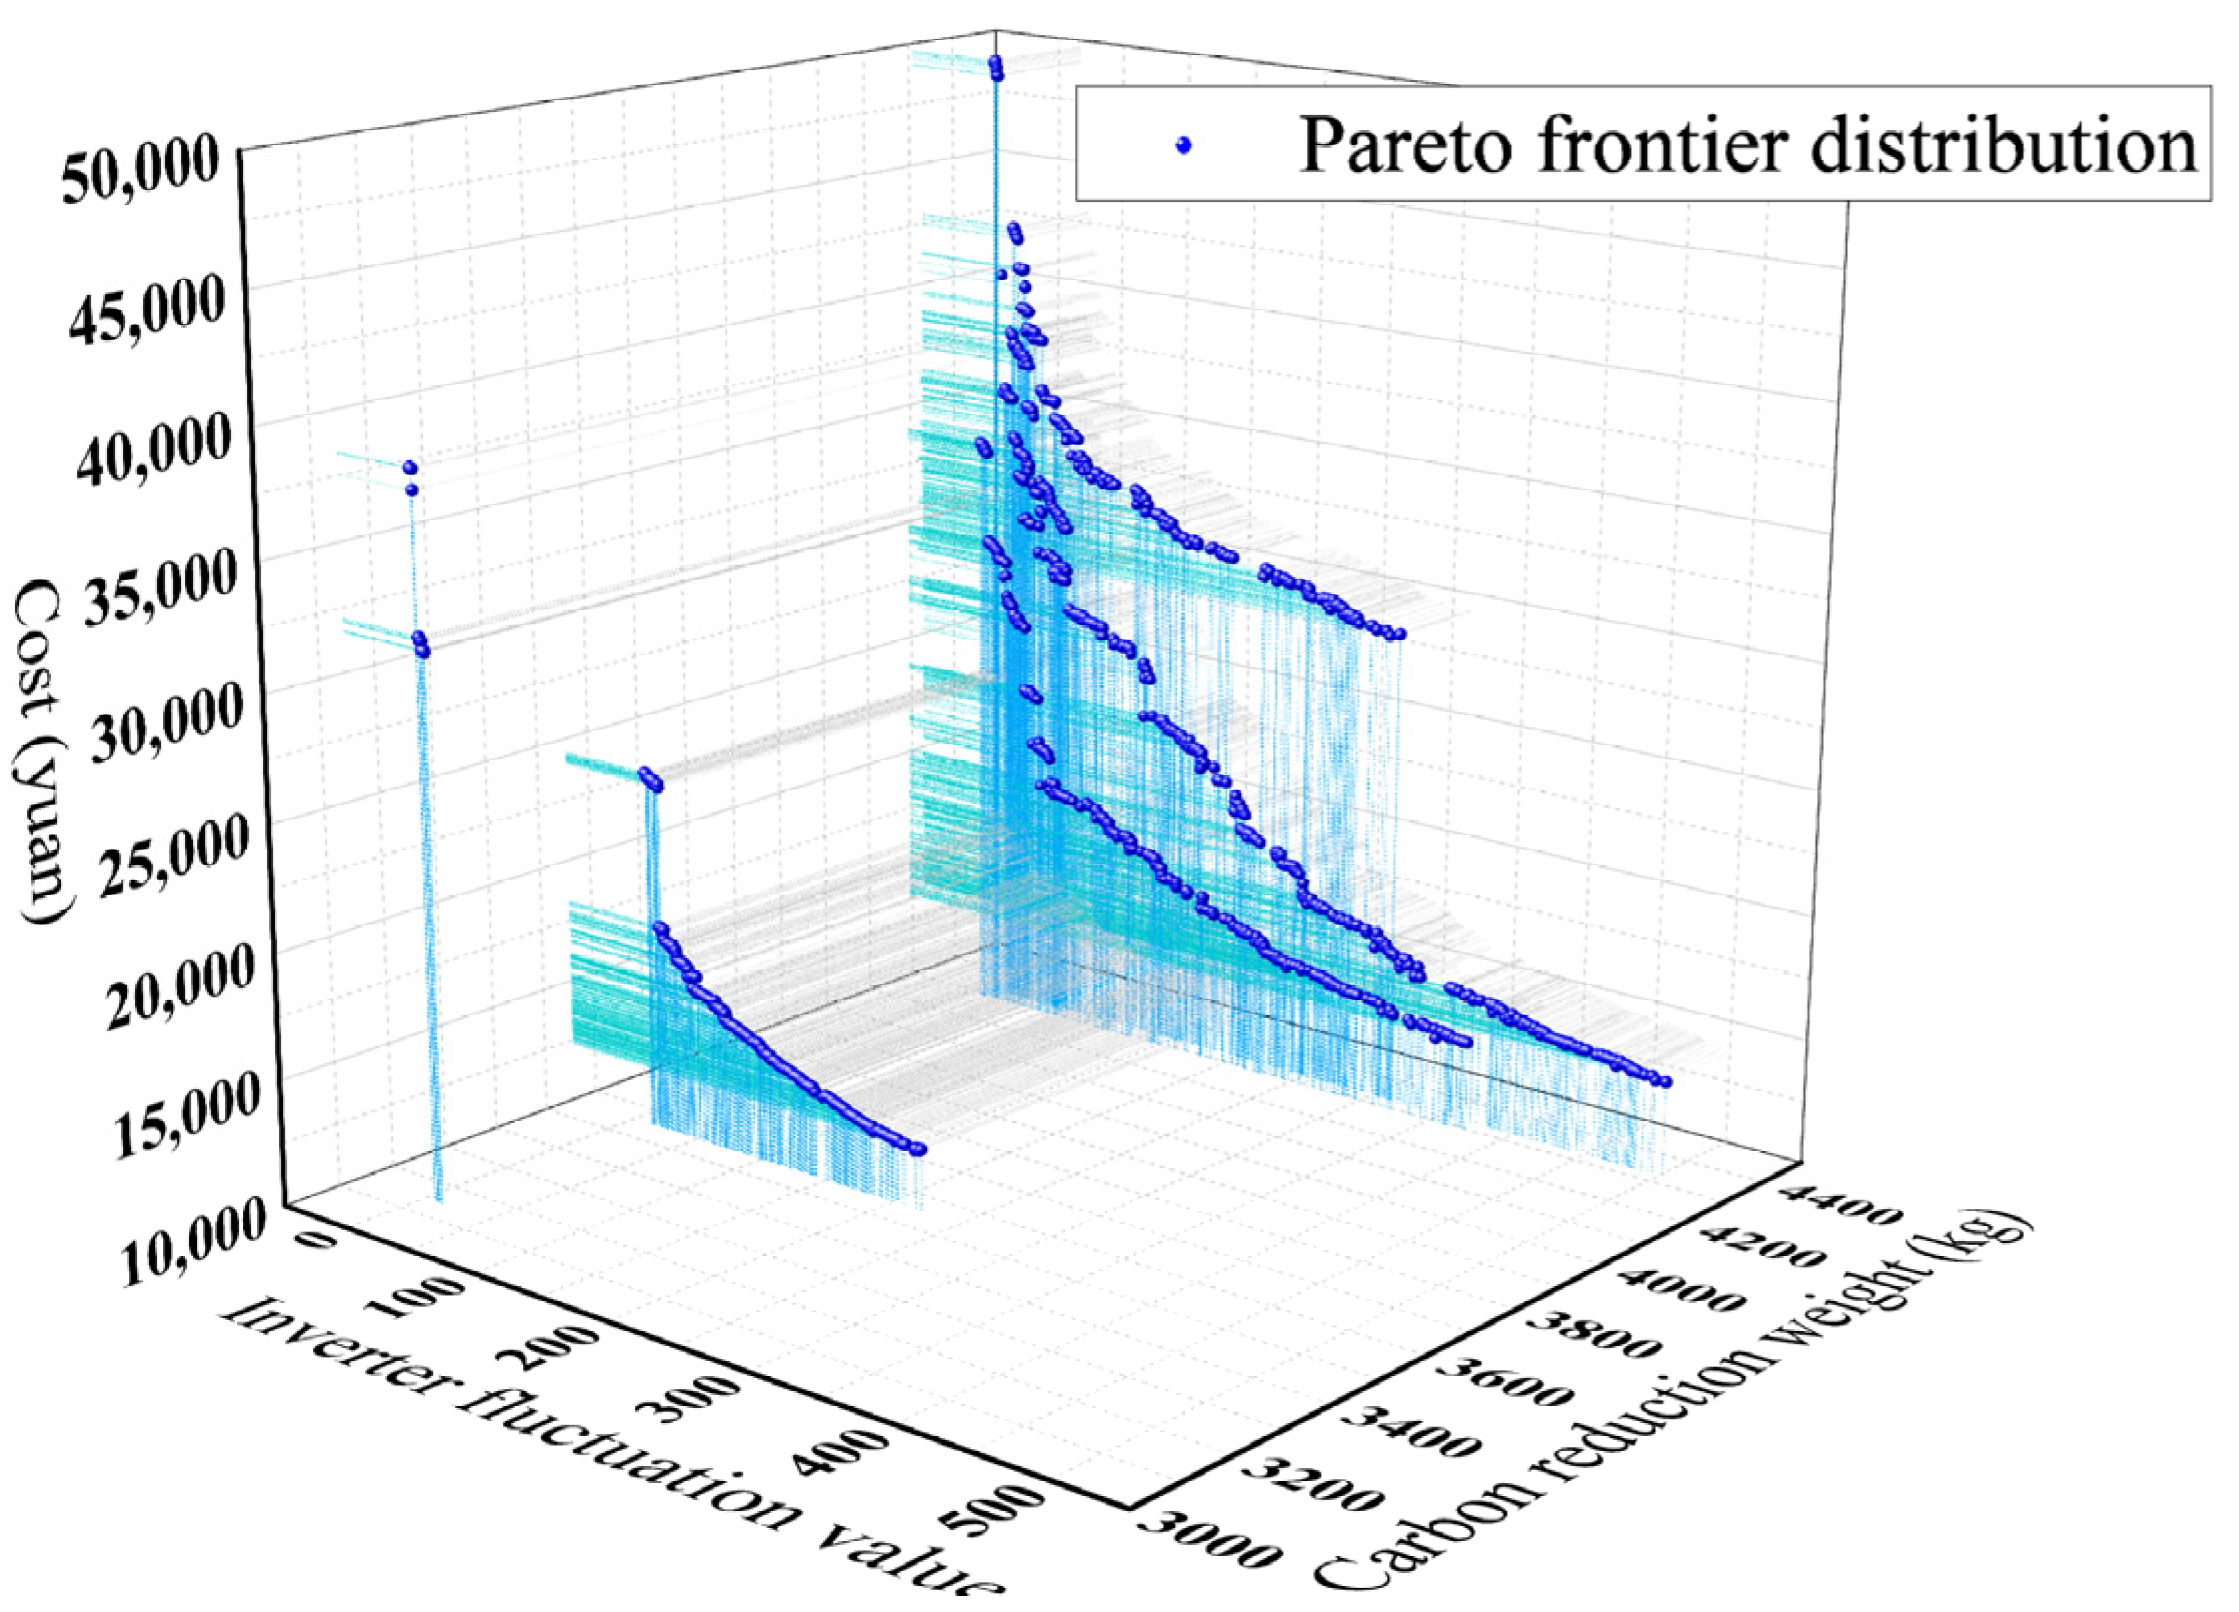
Figure 13 and Figure 14 show the Pareto front distribution trend diagrams produced by STNSGA-II and NSGA-II, respectively.
Figure 13 and Figure 14 show the simulation results of the algorithm comparison. The coordinate axes respectively represent the cost target, the grid-connected inverter fluctuation mean square deviation target and the carbon emission reduction target. From the simulation results for the two algorithms, it can be seen that the convergence of the STNSGA-II is better, and that a Pareto-optimal front with a better distribution can be obtained. By observing the images produced by the two algorithms from the perspective of cost target, the cost of the STNSGA-II is not more than 14,000 yuan, and the solution set is mainly between 9500 and 13,000 yuan, while the cost target as solved by the traditional NSGA-II is not optimal. As can be seen from Figure 14, the solution set is mainly concentrated between 20,000 and 40,000 yuan, which is obviously uneconomical compared with the solution set provided by the STNSGA-II. On the whole, the STNSGA-II is more competitive in regard to the cost target. Observing the images provided by the two algorithms from the goal of energy saving and emission reduction, the distribution trends of the solution sets yielded by the two algorithms are basically similar. From the point of view of power grid security, these two algorithms show that the solution set with a high cost has a high power grid security, and the reason for this phenomenon may be the increase in the battery storage capacity allocation in the system, which increases the cost and reduces the influence of the microgrid on the power grid by relying on the peak regulating capacity of the battery.
Table 4 shows several groups of different Pareto front distribution schemes yielded by the two algorithms, which are used to discuss the advantages of the STNSGA-II over the NSGA-II in detail, and analyze the practical benefits of the public building microgrid system established in this paper for sustainable development from the point of view of economic benefits, grid-connected security and green environmental protection.

6.2.2. Economic Analysis

Before the microgrid system is built for the public gymnasium introduced in this paper, all of the electricity demand is provided by the power grid, and the daily electricity cost reaches 13,114 yuan. It can be simply considered that the original cost of the building is the electricity cost.
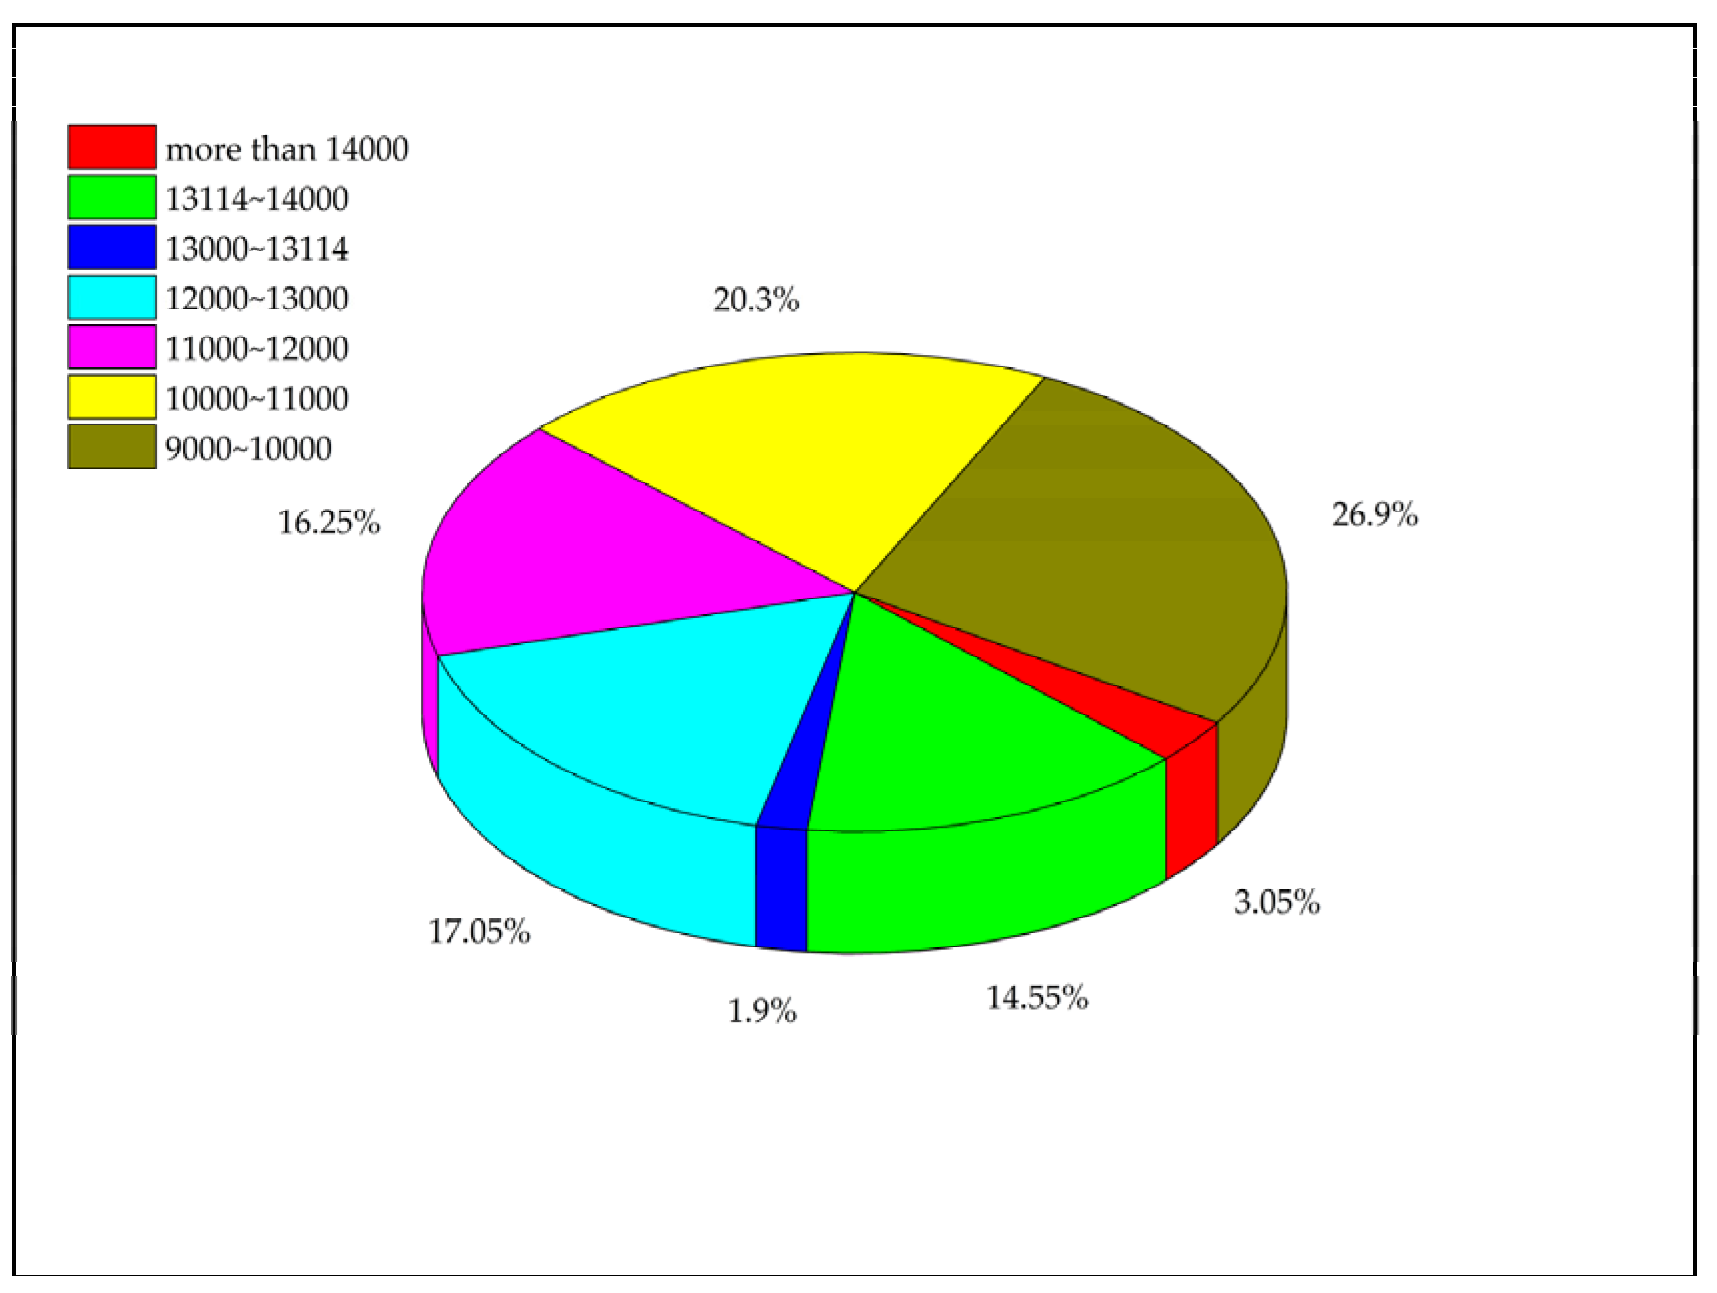
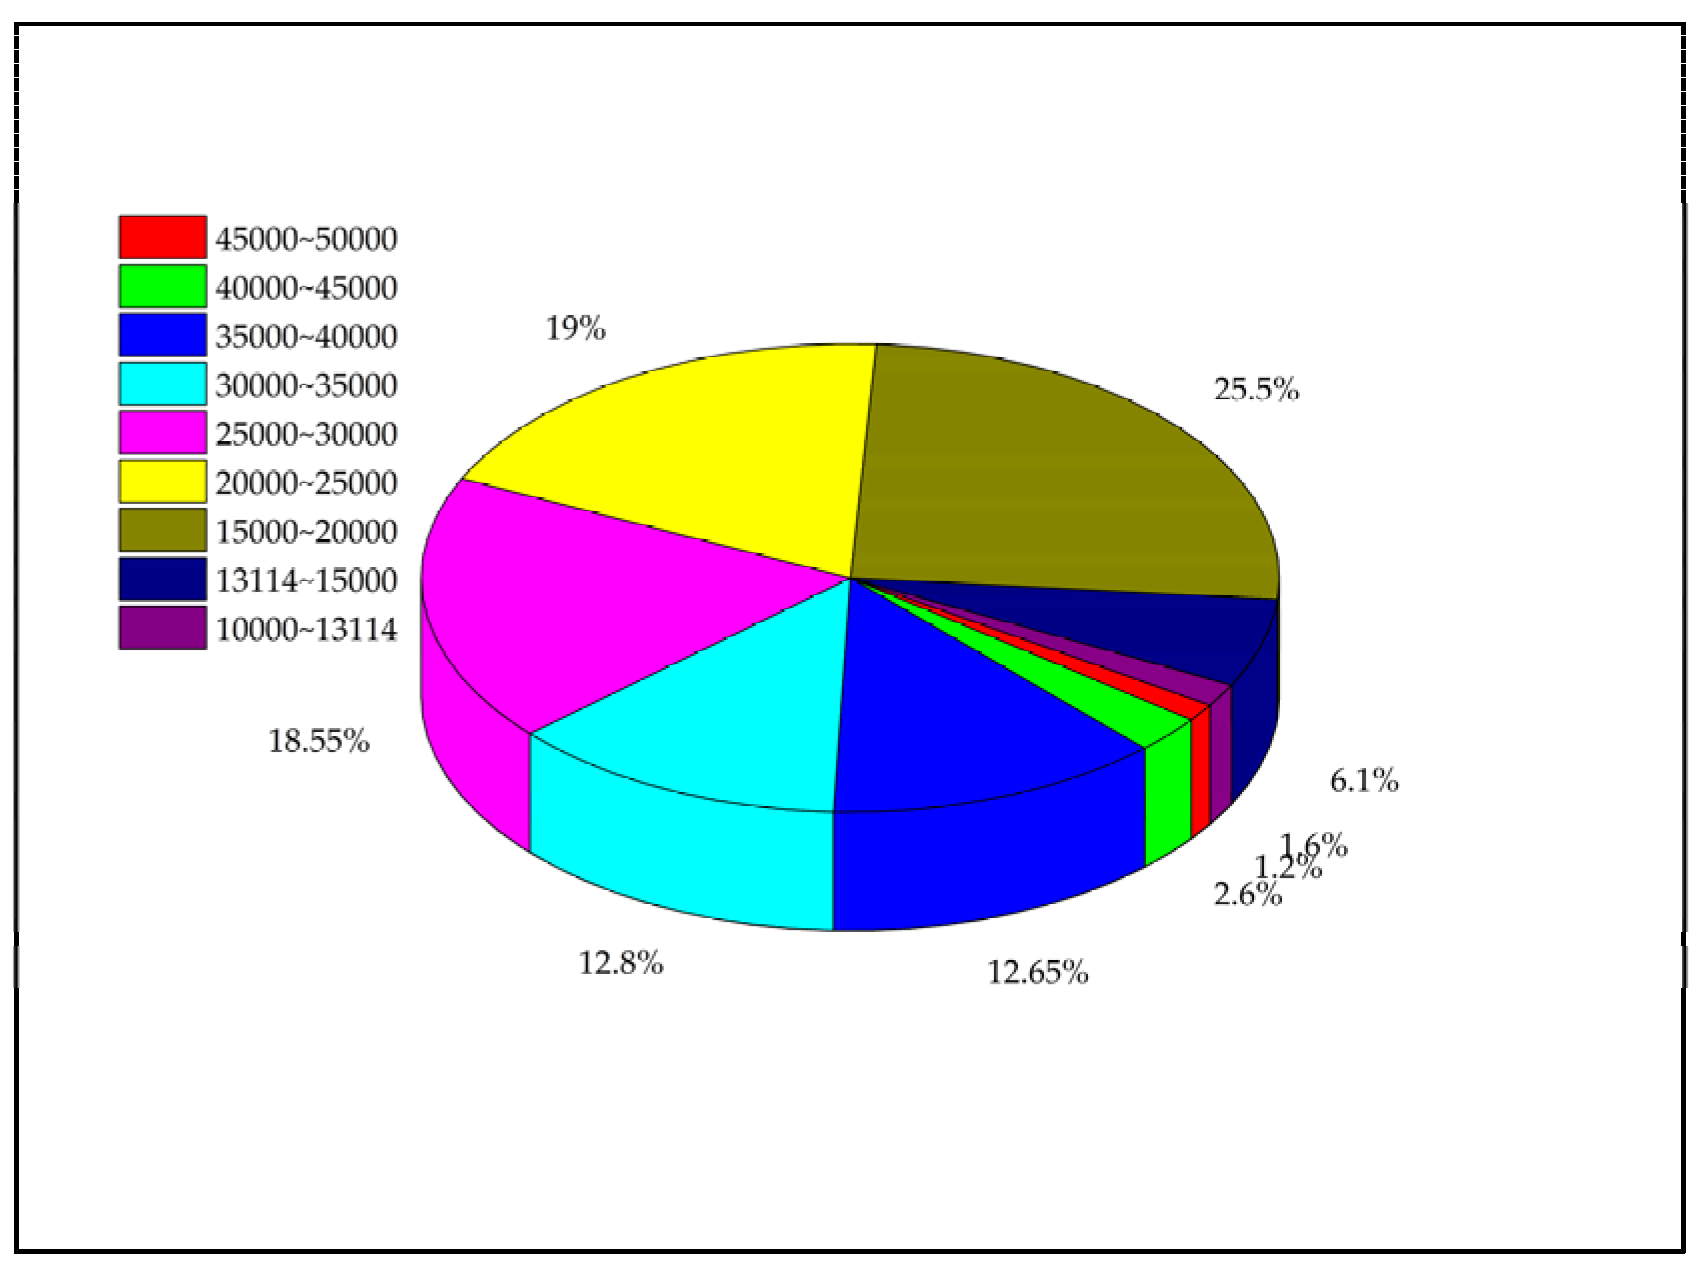
Figure 15 shows a pie chart of the distribution of cost objective values yielded by the STNSGA-II. As can be seen from Figure 15, 82.4% of the obtained Pareto solution sets have cost targets lower than the original cost, and these solution sets with lower than original costs are encouraged in terms of economic benefits. Among them, programs of 9000 yuan to 10,000 yuan account for 26.9% of the total, and the cost of these programs was reduced by 23.74% to 31.37% compared with the original cost. Only 17.6% of all solution sets were above the original cost, and these solution sets were considered uneconomical. Figure 16 shows a pie chart of the cost objective distribution for the set of Pareto solutions yielded by the NSGA-II. As can be seen from the figure, only 1.6% of the options are below the original cost, and most of the option sets are not desirable from an economic point of view.
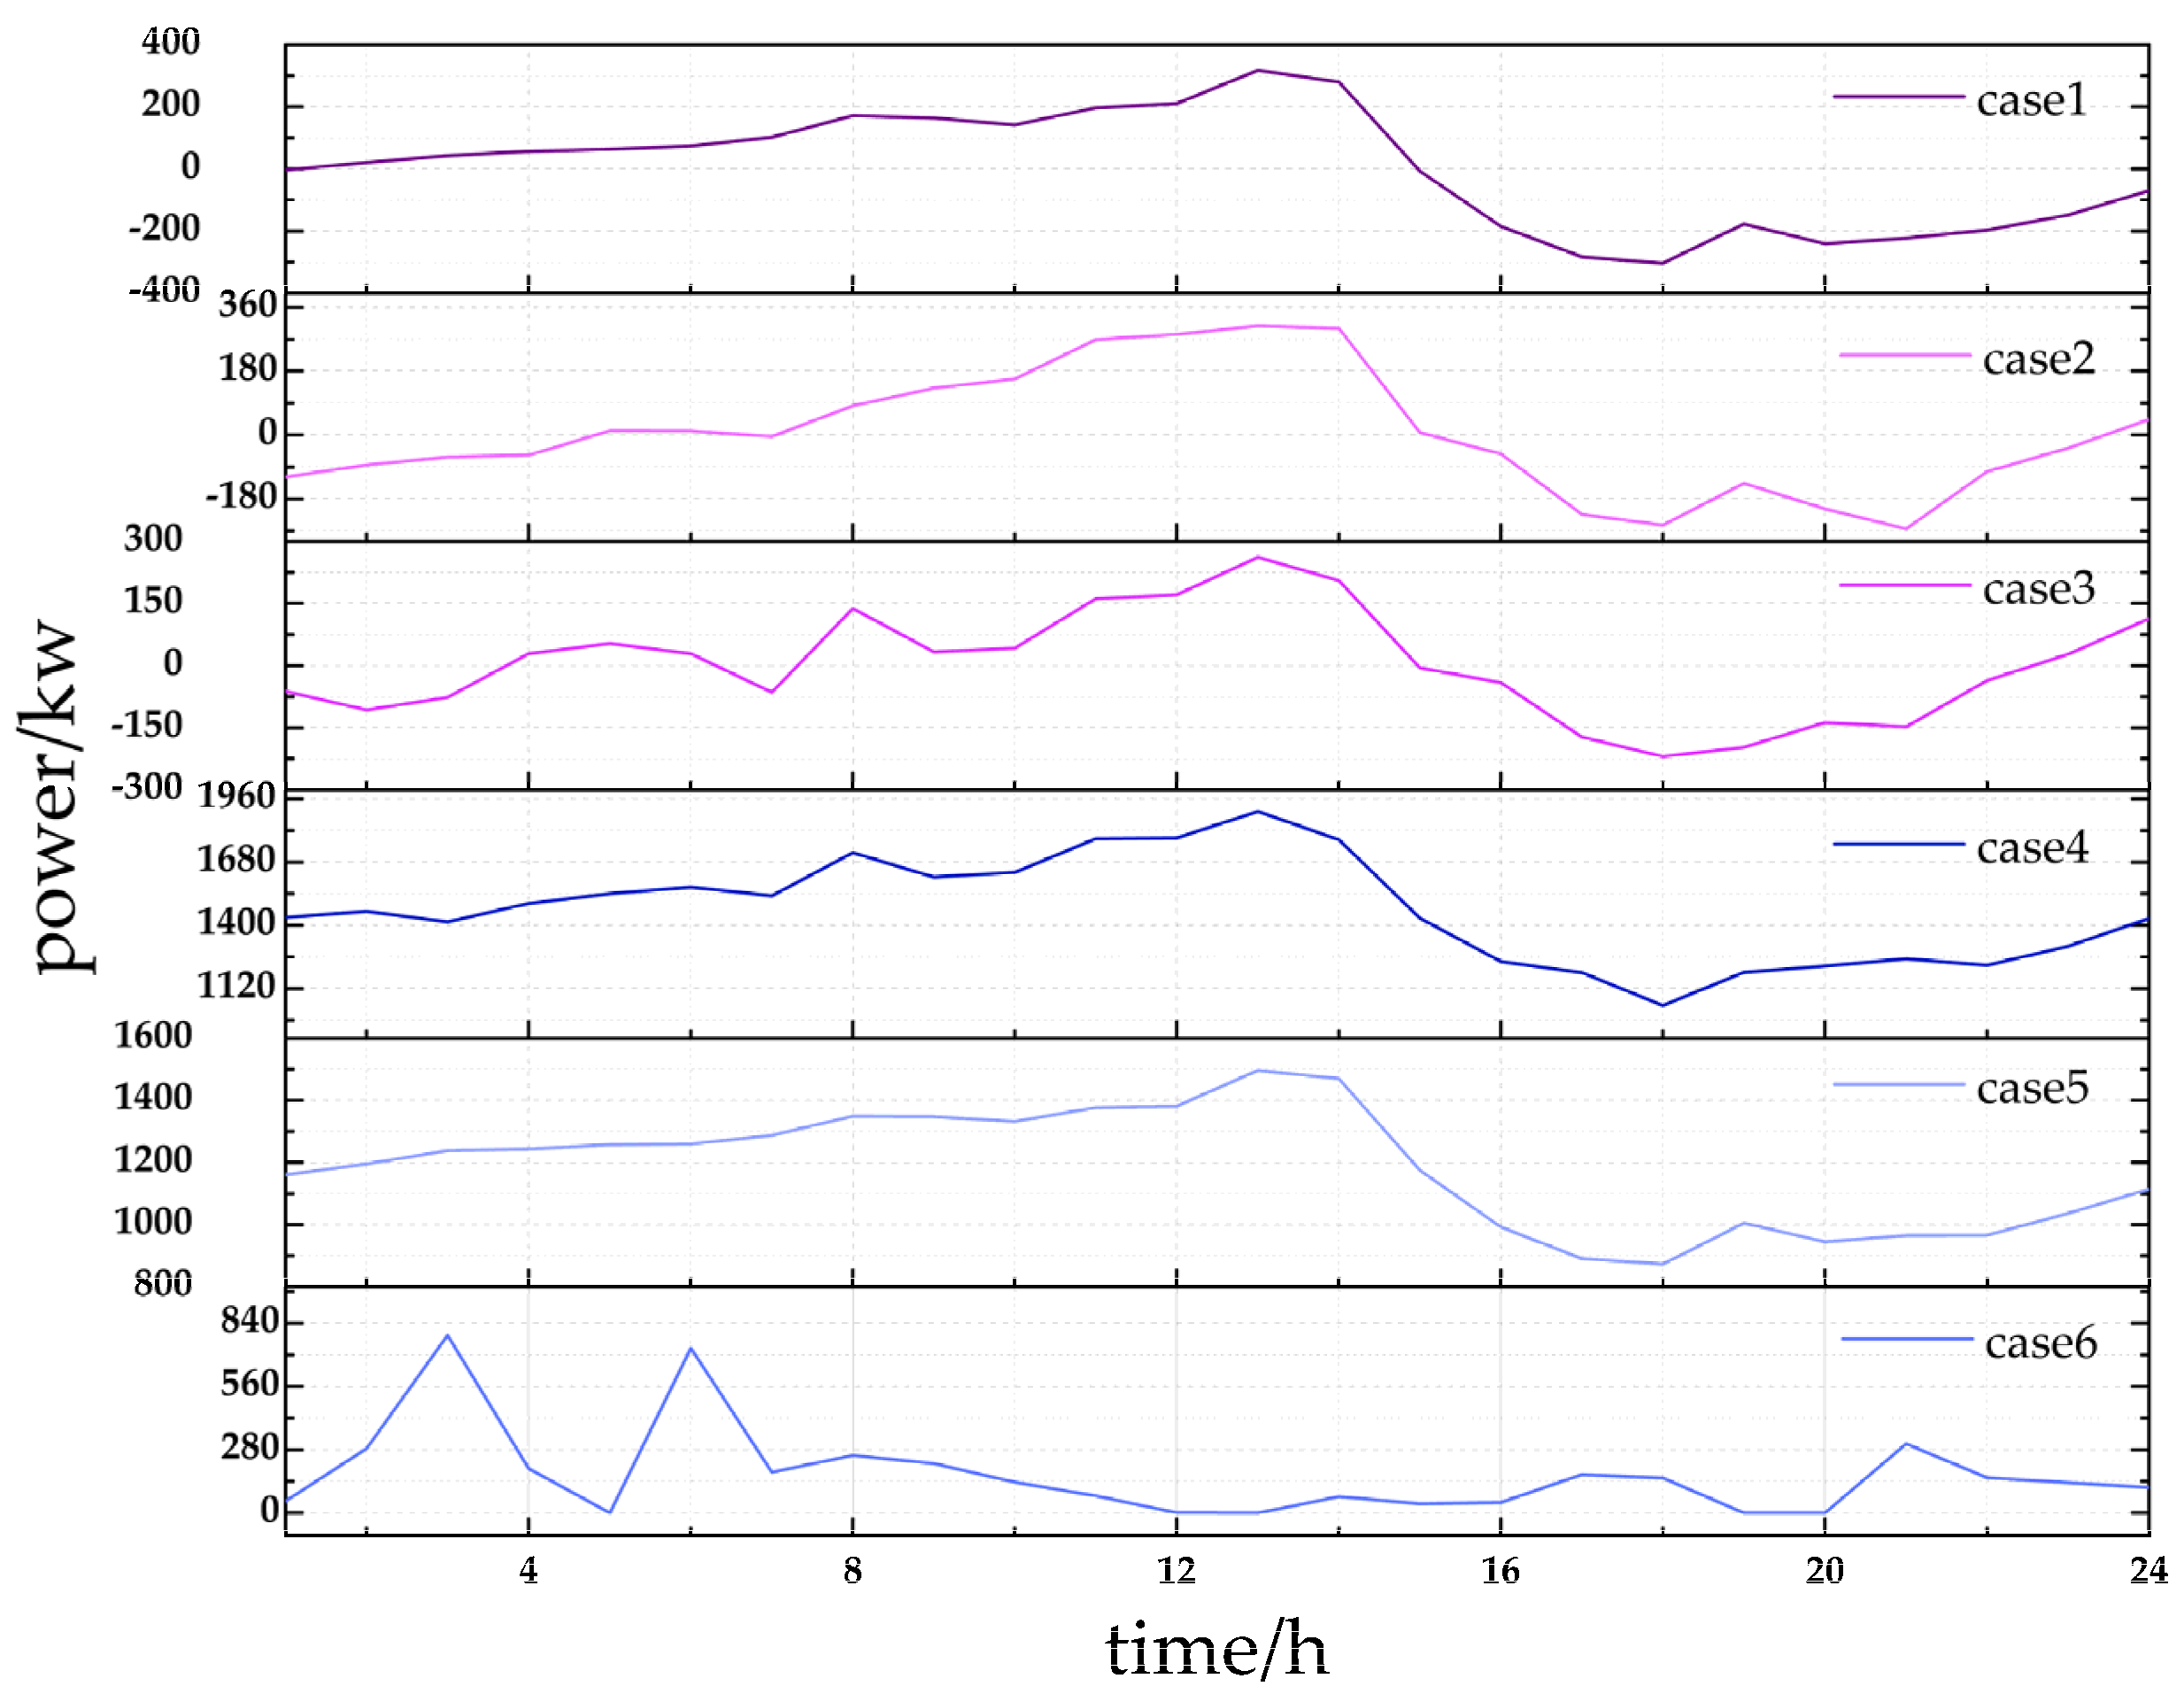
Table 4 shows the capacity configurations for the six schemes and the values established for the three targets. Figure 17 shows the charge–discharge power curves corresponding to the six Cases for the energy storage system. As can be seen from Table 3, Case 1 has the highest cost among the Cases produced by the STNSGA-II, which is reflected in the relatively low configuration of the renewable generation system and the low utilization of the roof. The main capital is invested in the energy storage system, with the total cost slightly higher than the original cost. While this shows relative competitiveness in other respects, it is not desirable only in economic terms. Compared to Case 1, pleaeboth Cases 2 and 3 increase the equipment capacity configuration of the renewable generation system and increase the utilization rate of the building roof. Cases 2 and 3 both increase the investment cost of power generation equipment and reduce the investment of battery capacity in the energy storage system to a certain extent, reflecting that the total cost is less than the original cost, which is economically conducive to the promotion of microgrid system in public buildings.
At the same time, it can be found that the simulation results of the two algorithms differ significantly in terms of the cost objective. It can be found in Table 4 that there is no significant difference in the device configuration between solutions 4, 5 and 6, provided by the NSGA-II, and solutions 1, 2 and 3, provided by the STNSGA-II. By observing Figure 17, it can be found that the energy storage system corresponding to Cases 1–3 can basically ensure that the battery returns to the initial state in one working cycle, while in Cases 4–6, it can be found that the battery has been absorbing electric energy from the external grid, thus increasing the cost. However, the energy storage system is clearly not able to absorb such a large amount of electrical energy, indicating that the NSGA-II fails to satisfy the constraints of the energy storage system at the time of solution, leading to a violation of the physical meaning in the optimization scheme. From the above analysis, it can be seen that the STNSGA-II has an advantage over the NSGA-II in dealing with the strong constraints of energy storage in terms of the cost objective.

6.2.3. Analysis of Grid-Connected Security

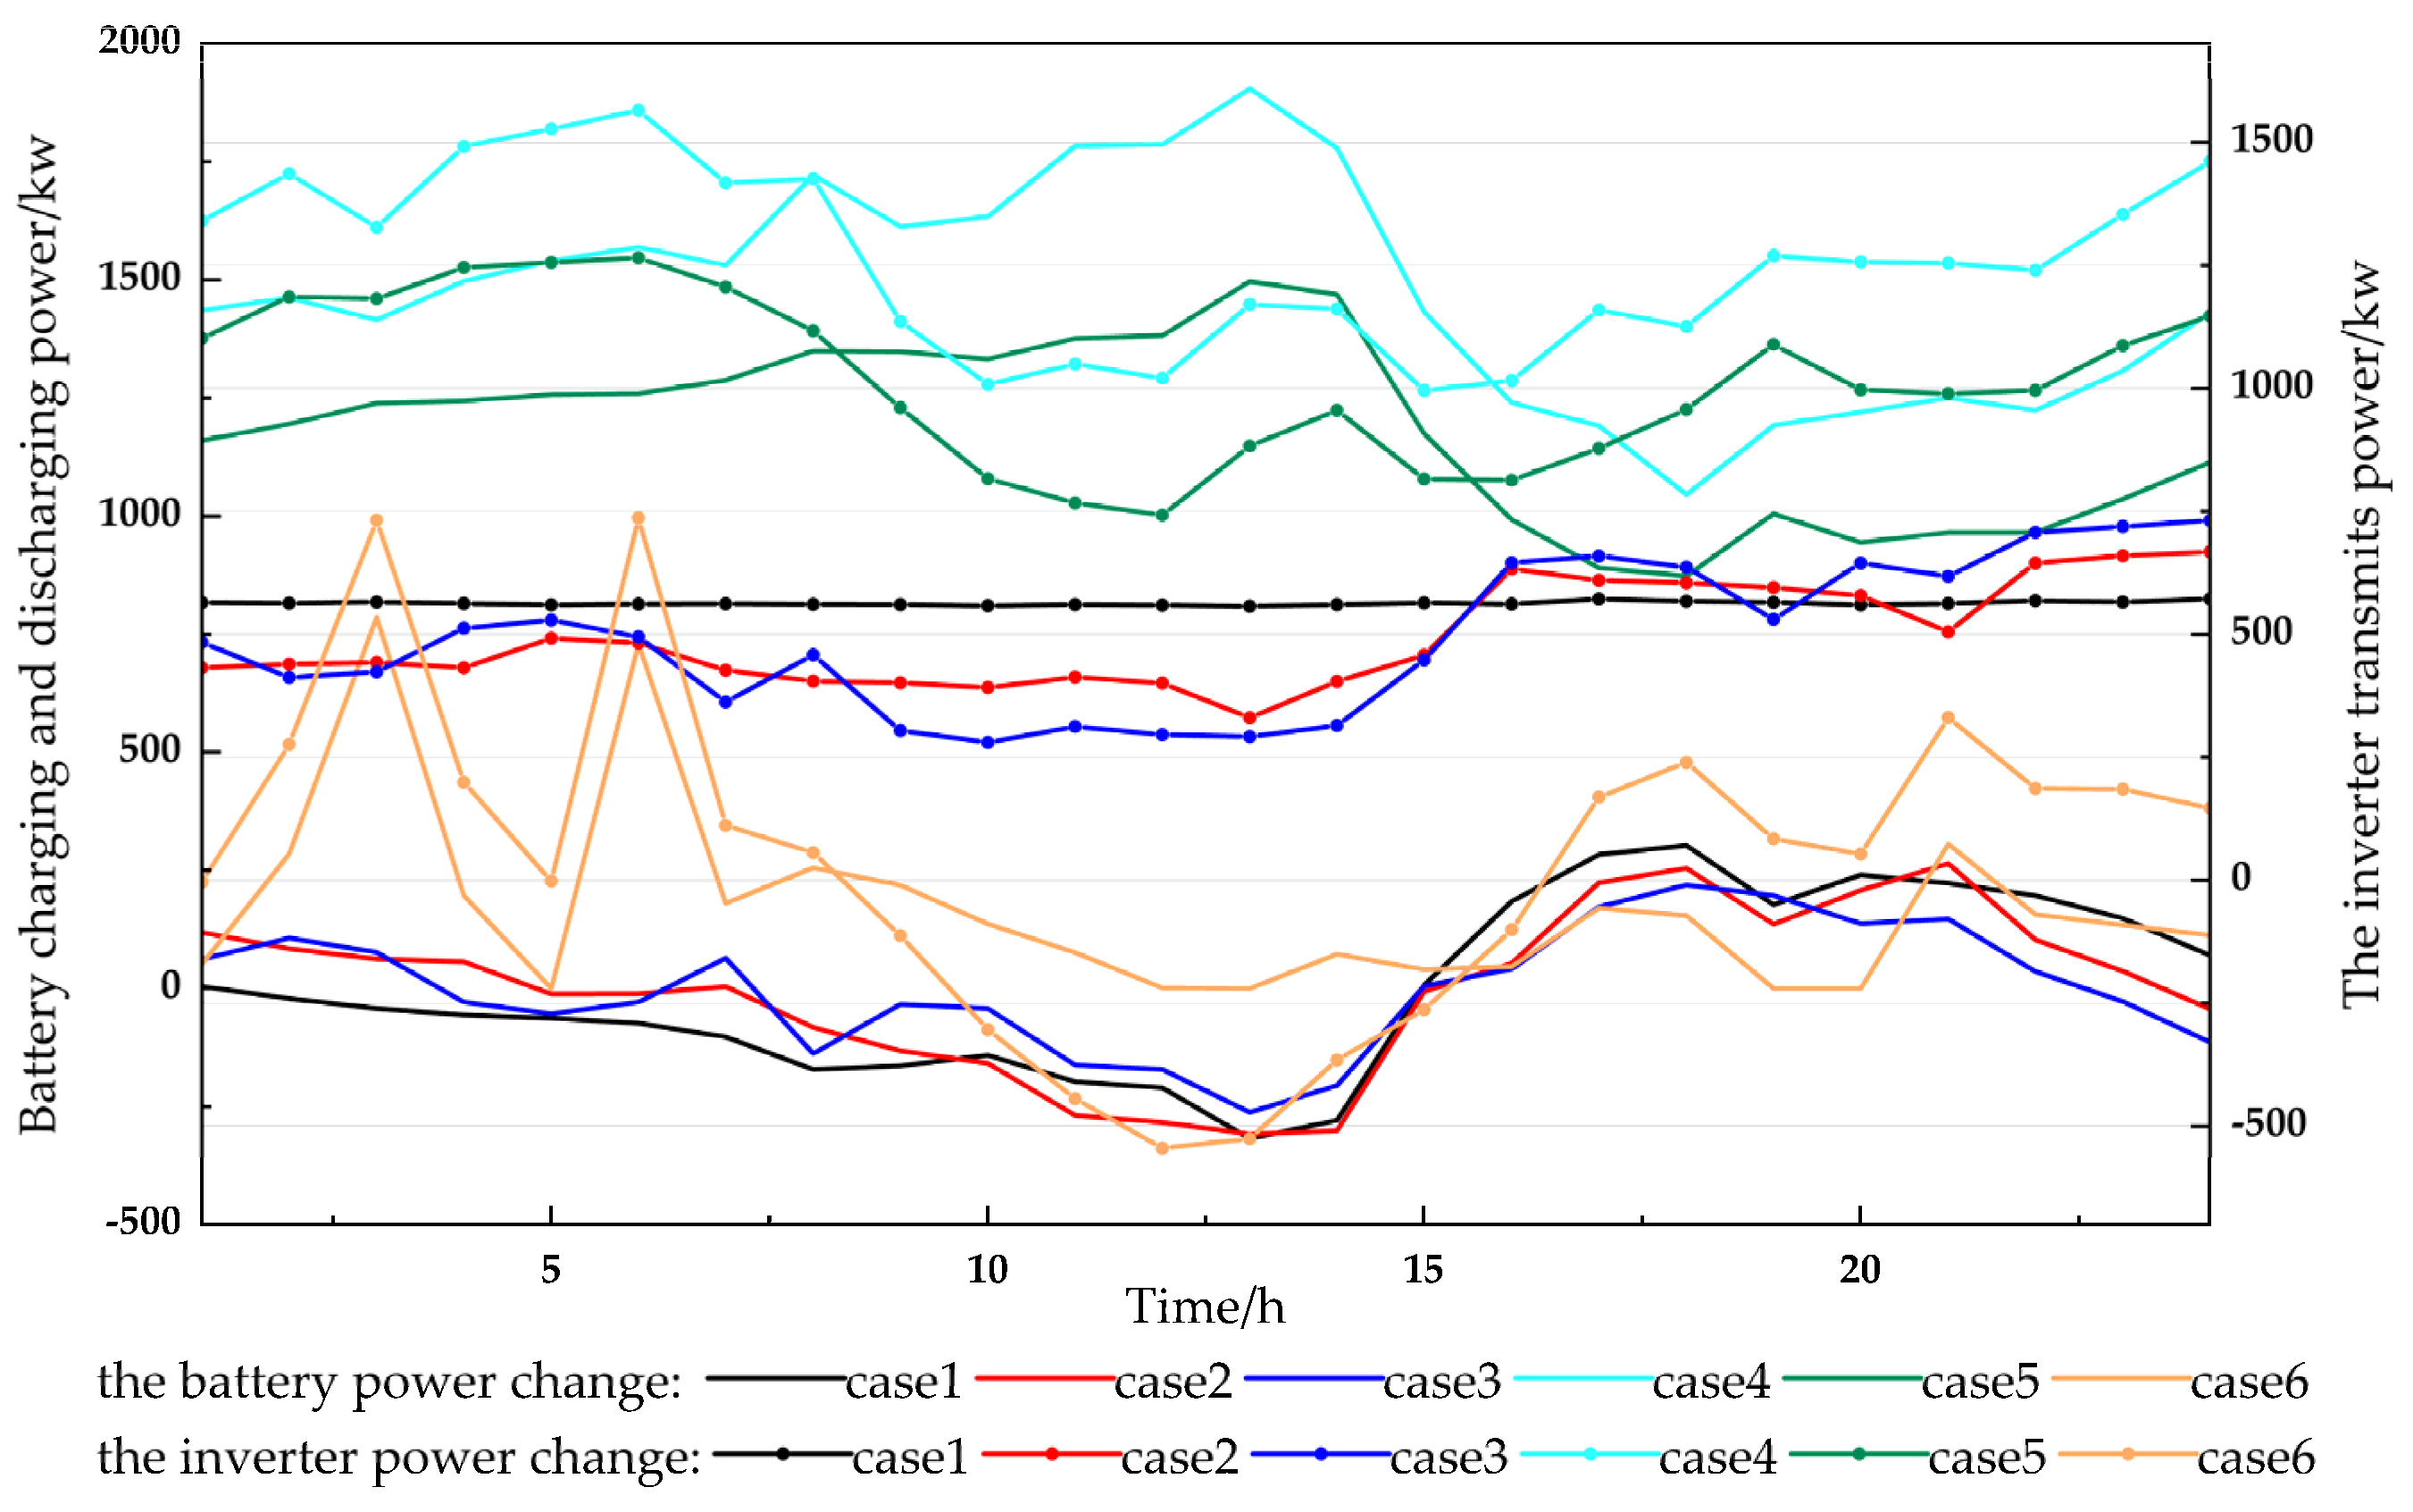
In this paper, the index reflecting the grid-connected security is the mean square deviation value of the grid-connected inverter energy fluctuation. The small fluctuation of the grid-connected inverter means that the energy exchange between the microgrid system of public buildings and the power grid is not frequent, and the power grid protection ability is strong. Figure 18 shows the energy change process of the grid-connected inverter and battery for several schemes in an optimization period.
As can be seen from the figure, the transmission power of the inverter in Case 1 is basically maintained at 560 kw, and its mean square deviation is only 3.84. The power exchange curve of the inverter in Case 1 is the most stable among the six schemes. In Cases 2 and 3, the inverter power varies to some extent. In Case 2, the inverter power varies between 300 kW and 660 kW with a maximum difference of 336.53 kW and a mean squared deviation of 101.8. In Case 3, the inverter power varies from 280 kW to 740 kW with a maximum variation of 451.69 kW and a mean squared deviation value of 150.77.
At the same time, it can be observed that Cases 4–6 have relatively large inverter power ranges. Case 4 has a maximum variation of 569.53 kW with a mean squared deviation value of 55.69. Case 5 has a maximum variation of 523 kW and a mean squared deviation of 9.7. Case 6 has a maximum amplitude variation of 1281 kW, with a mean squared deviation of 334.33.
It is worth noting that, in those schemes with small mean square deviation values, the corresponding battery power changes are generally more frequent. This indicates that the setting of appropriate energy storage scheduling is conducive to the reduction of power fluctuations at the parallel network ports. It can also be considered that the fluctuations of the microgrid system can be transferred to the power charging and discharging of the energy storage system, thus realizing the effect of the fluctuations of the grid connections.

6.2.4. Carbon Reduction Analysis

In this paper, part of the coal power consumption is replaced by the electricity produced by the renewable power generation system, which shows that the proportion of coal power in the whole public building energy structure is reduced and the permeability of renewable energy is increased. In this process, reducing part of the coal power consumption is equivalent to reducing the use of coal and indirectly reducing carbon emissions.
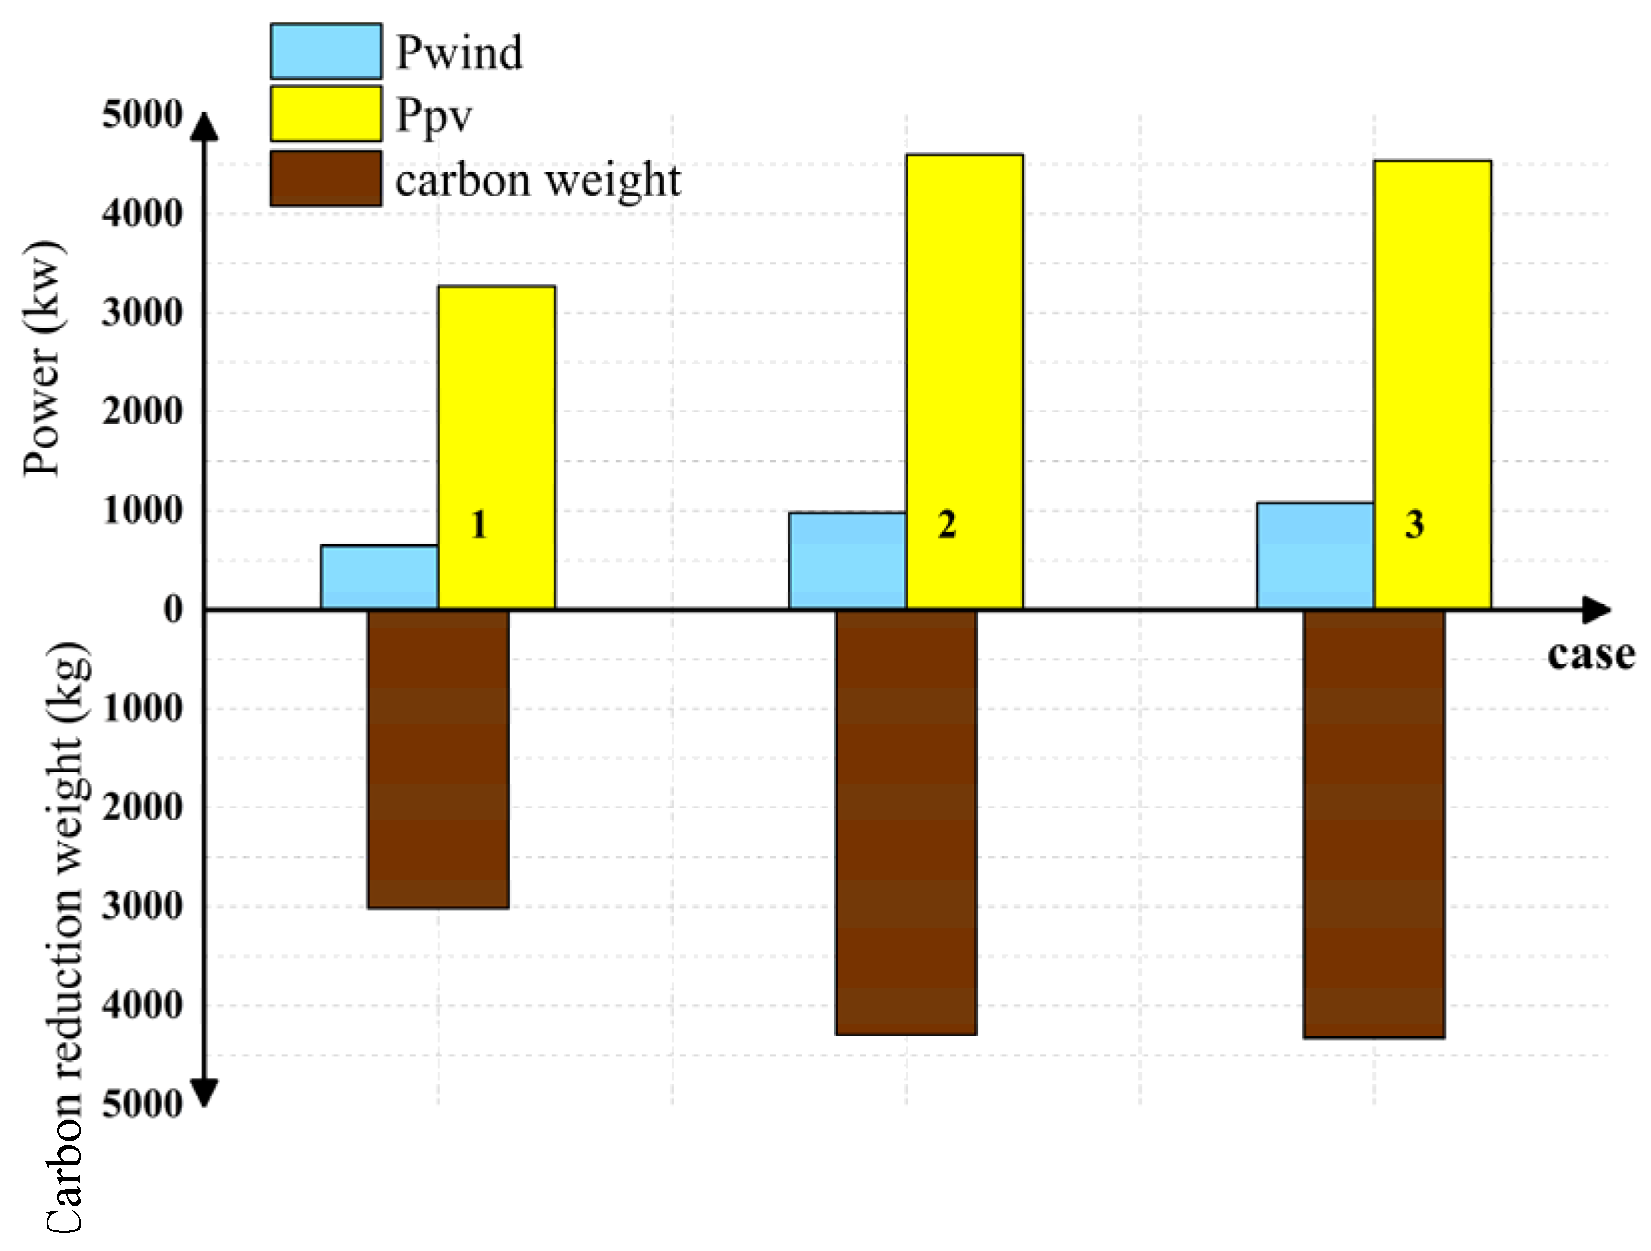
It can be found that the degree of low-carbon benefits is directly related to the electricity generation of wind energy and light energy. Figure 19 shows the bar charts of wind energy and light energy output and the carbon emission in several schemes.
From the data in Table 4 and the bar chart in Figure 19, it can be concluded that, with the increase of the installed number of wind turbines and photovoltaics, the more renewable energy is produced, the more carbon emissions are reduced.

6.2.5. Comparative Analysis of Algorithms

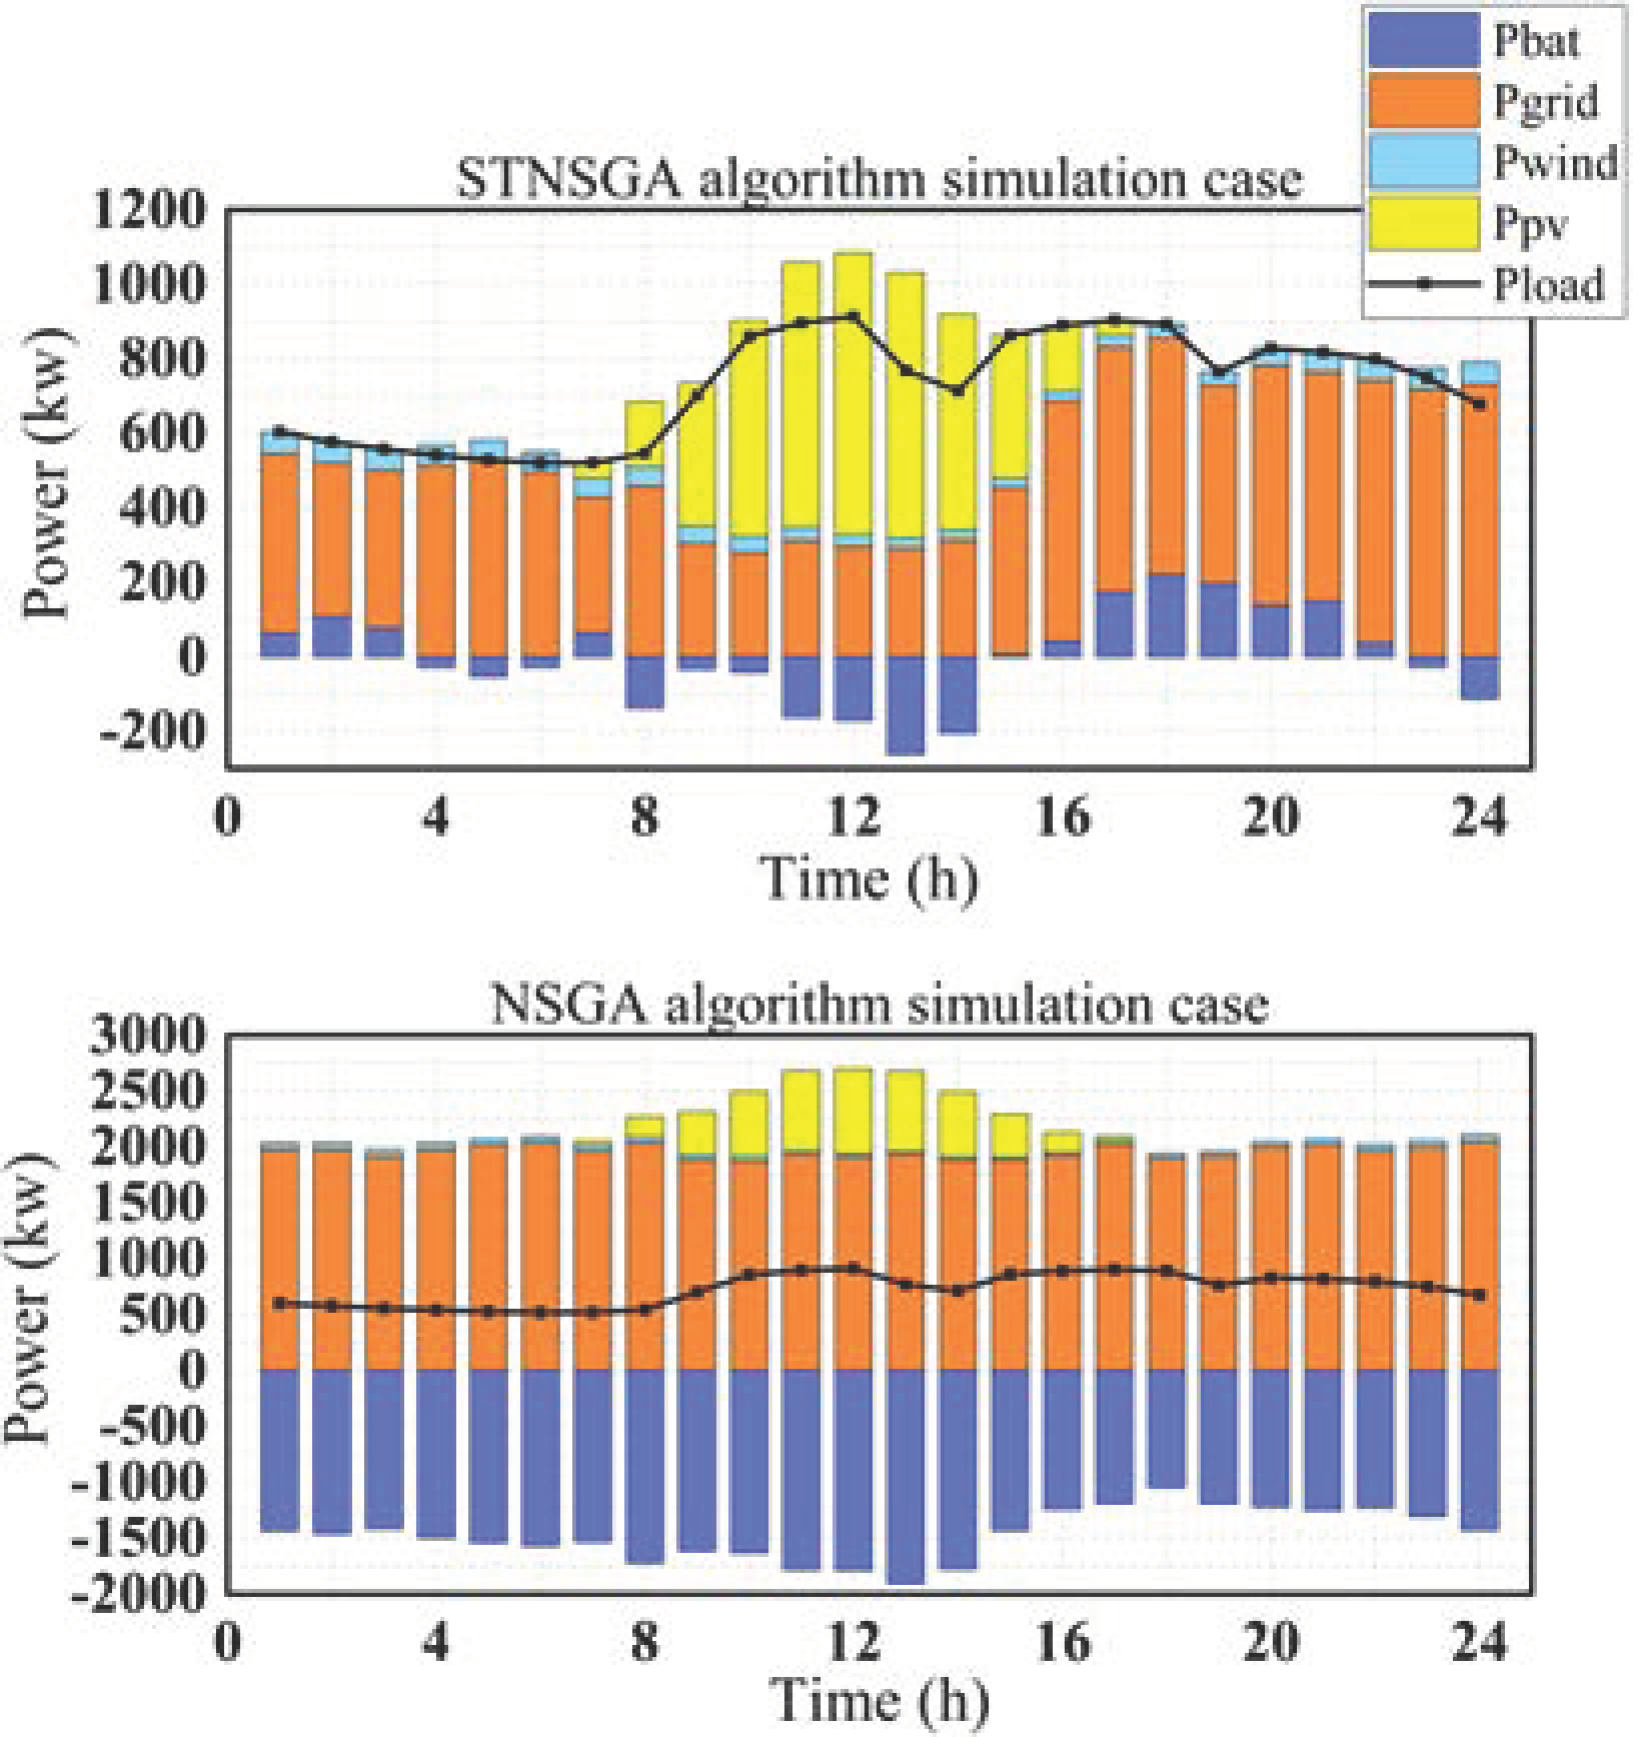
Cases 3 and 4 are comparative simulation results under the same power generation equipment configuration, which are used to analyze the advantages of the STNSGA-II compared with the NSGA-II. Figure 20 shows the power balance diagram of the two schemes.
It can be found that the electricity purchased from external electricity far exceeds the actual electricity required by the building according to the power balance curve of Case 4. The excess electricity is stored with the renewable energy in an energy storage system that simply cannot handle such a large amount of energy. Obviously, this scheme is contrary to the actual physical meaning. This is also a problem as the NSGA-II is difficult to deal with under strong constraints. The penalty function method is one of the most commonly used methods for dealing with constraint problems. It is expected to obtain a subset of solutions that slightly violate the constraints as viable solutions. However, there are often too few feasible solutions during the simulation, which prolongs the running time of the algorithm. Observe that the reason for this irrational optimization scheme is only related to the constraints of the energy storage system. The notion of spatial transformation proposed in this paper is essentially a mathematical transformation of variables. By transforming the variables of the energy storage system to satisfy the constraints, it is natural to avoid unreasonable phenomena by considering the transformed variables as optimization results.
In Case 3, the batteries store excess electric energy in the peak period of renewable energy generation and release electric energy for building use in the peak period of the electricity price. This process not only relieves the pressure in the peak period of electricity consumption, but also generates certain economic benefits.
From the analysis of the cost target, because the constraints of the energy storage system are not met, the battery continues to absorb electric energy from the external grid, which leads to a surge in costs, on the one hand, and, on the other hand, a situation in which the energy storage system cannot absorb the excessive electric energy. At the same time, it has also been found in grid-connected fluctuation analysis that the battery continues to draw energy from the external grid, resulting in an increased energy variation of the grid-connected inverter, leading to the unstable operation of the microgrid. Clearly, energy storage systems that do not satisfy the constraints involved in the microgrid scheduling of public buildings will have negative effects. The proposed spatial transformation constraint treatment is nested into the NSGA-II to transform these unconstrained energy storage variables so that the transformed energy storage variables satisfy the constraints. In experimental comparisons, energy storage scheduling that satisfies the constraints has certain benefits in terms of cost and grid connection fluctuations. The modified STNSGA-II is effective in dealing with optimization problems under the strong constraints of energy storage.

6.2.6. The Future Research

Although this paper seeks an effective way to deal with battery energy storage constraints in public building microgrid systems, a more detailed consideration of different types of energy storage constraints is still needed. For example, different kinds of energy storage methods, such as thermal energy storage, electric energy storage, chemical energy storage, etc. require the study of different characteristics of energy storage [45].
In this paper, the choice of the battery as the energy storage element appears to be somewhat monolithic. Batteries are characterized by a high energy density and low power density. This works in the form of a typical slow charge, slow release. When large-scale renewable energy is plugged into public building systems using batteries alone as storage units, their capacity will be configured for larger sizes. In the follow-up study, the combination of multiple energy storage modes can be considered [46].
In this way, the fluctuations of the microgrid are transmitted to the frequent charging and discharging processes of the battery, which reduces the battery’s lifetime to some extent. The follow-up study should consider extending the battery life while stabilizing the fluctuation [47]. The combination of supercapacitors and batteries assemble into a hybrid energy storage system should be the focus of subsequent research.

7. Conclusions

In this study, the construction of renewable energy microgrids in existing public buildings is considered, with the purpose of making public buildings sustainable. We describe the sustainable development of public buildings as a multi-objective optimization problem, with three objectives. The first objective is the optimal operation of the economy, the second is the operation with minimal fluctuations of the microgrid, and the third is the maximum reduction of the carbon emissions. To improve the operating efficiency of the microgrid, energy storage has been introduced into the renewable power generation systems in public buildings. The NSGA-II is used to generate the Pareto-optimal solution. It has been found in studies that energy storage variables fail to satisfy their own constraints, which adversely affects the operation of the microgrid. In order to solve this problem, a constraint treatment method of space transformation is proposed to make the battery meet the constraint conditions. The STNSGA-II is obtained by improving the NSGA-II with the spatial transformation method. Simulation results show that energy storage systems that satisfy the constraints can reduce the operational cost and improve the stability of the microgrid. The detailed findings of this paper are as follows:
  • The application of a renewable power generation system in public buildings has a practical significance. The use of clean and renewable energy can not only increase the diversity of energy and reduce the use of fossil energy, but it can also produce certain economic benefits and reduce the cost of daily energy use;
  • The energy storage system absorbs the energy produced by the renewable power generation system, and, at the same time, participates in the peak cutting and valley filling of the whole operation cycle. It converts the fluctuation of the wind power and photovoltaic grid-connected energy into the charging and discharging process of the battery, which plays an important role in the protection of the power grid;
  • In this study, aiming at the drawbacks of the traditional NSGA-II, with which it is difficult to solve multi-objective strong constraint problems, a spatial transformation constraint processing concept is proposed to deal with strong constraints. Results show that the STNSGA-II has more advantages than the NSGA-II in solving constrained nonlinear multi-objective optimization problems.

Author Contributions

Conceptualization, S.L. and H.Z.; methodology, S.L. and H.Z.; software, H.Z.; validation, S.L., H.Z. and G.X.; formal analysis, G.X.; resources, S.L.; data curation, H.Z.; writing—original draft preparation, H.Z.; writing—review and editing, S.L., H.Z. and G.X.; visualization, S.L., H.Z. and G.X.; funding acquisition, S.L. All authors have read and agreed to the published version of the manuscript.

Funding

This research was funded by the Anhui Province Key Laboratory of Intelligent Building and Building Energy Saving, grant number IBES2020KF07.

Institutional Review Board Statement

Not applicable.

Informed Consent Statement

Not applicable.

Data Availability Statement

Not applicable.

Conflicts of Interest

The authors declare no conflict of interest.

Nomenclature

SymbolMeaning
afanThe wind speed correction coefficient
CThe total cost of the microgrid system of public buildings
Cbat(t)The energy storage capacity of the battery at time t
Cbat(t − 1)The energy storage capacity of the battery at time t − 1
Cbat,maxThe maximum capacity of the battery
Cbat,minThe minimum capacity of the battery
CcThe cost of equipment acquisition in the microgrid
CE(t)The electricity price at time t
CgirdTransaction profit and loss cost generated by energy exchange between the microgrid and power grid
CiThe purchase cost of each piece of equipment
Co&mThe operation and maintenance cost of the equipment
Co&m-windThe operation and maintenance cost of the fans in a working cycle
Co&m-pvThe operation and maintenance cost of the photovoltaic array in a working cycle
Co&m-batThe operation and maintenance cost of the battery in a working cycle
Co&m-gridThe operation and maintenance cost of the inverter in a working period
CpThe wind energy utilization coefficient
CapgridThe capacity of the grid-connected inverter
DfanThe diameter of the fan blade
Dpv-pvThe distance between adjacent PV arrays
DroofThe width of the roof
dpvThe width of the photovoltaic panels
fThe PV array power derating factor
GenThe number of iterations
GpThe actual solar irradiance on the surface of the PV array
GstcThe solar radiation of the PV array under standard test conditions
h0The unified observation height of the wind speed
hfanThe vertical height of the fan from the horizontal plane
hisThe overall height of the fan
jThe service life of the equipment
kThe number of days of equipment life
KmaxThe maximum value of the ratio between wind power and photoelectric power
KminThe minimum value of the ratio between wind power and photoelectric power
LpvThe length of the photovoltaic array
LroofThe length of the roof
Mco2The carbon dioxide emission reduction index
mgrid-co2The carbon emission of coal power generation
mpv-co2The carbon emission of photovoltaic power generation
mwind-co2The carbon emission of fan power generation
NfanThe actual installed number of fans
Nfan,maxThe maximum installed number of fans
NiThe installed number of pieces of equipment, respectively, the number of fans, photovoltaic panels
NpvThe actual number of photovoltaic arrays installed
Npv,maxThe maximum number of photovoltaic panels installed
NSGA-IINon-dominated Sorting Genetic Algorithm-II
Pbat(t)The electric energy actually released by the energy storage system at time t
Pbat,maxThe maximum allowable charging and discharging power of the battery
pcThe crossover probability
PfmThe maximum output power of the fan
PfrThe rated output power of the fan
Pgrid(t)The electric energy exchanged between the microgrid and the power grid at time t
P ¯ g r i d The average electric energy exchange value between the inverter and the external grid within an optimization cycle
pmThe mutation probability
PVPhotovoltaic
PpvThe output power of the PV
Ppv,stcThe rated capacity of the PV array
PwindThe output power of the fan
rThe inflation rate
SThe actual scavenging area of the fan blade
SfanThe floor area of the fan installation
sizepopThe population number
SOCThe state of charge
SOCbat,maxThe maximum charge state of the battery
SOCbat,minThe minimum charge state of the battery
SpvThe area occupied by a single photovoltaic array considering the distance between photovoltaic arrays
STNSGA-IISpatial Transformation Non-dominated Sorting Genetic Algorithm-II
Tpv,pThe actual temperature of the PV array surface
Tpv,stcThe temperature under standard test conditions
vThe actual wind speed
VciThe cut-in wind speed
VcoThe cut-off wind speed
Vh0The measured wind speed at h0
VmThe maximum wind speed
VrThe rated wind speed
αThe angle between the photovoltaic array and the horizontal plane
αpvThe power temperature coefficient
δThe self-discharge rate of the battery
δgridThe grid-connected inverter fluctuation index
δlossThe active power deficiency rate
δloss,maxThe maximum active power deficiency rate of the new energy power generation system
ηcThe charging efficiencies of the battery
ηdThe discharging efficiencies of the battery
ρThe air density at the height of the fan hub
φThe latitude of photovoltaic placement area
· The downward integral function

References

  1. Sharma, S.; Verma, A.; Xu, Y.; Panigrahi, B.K. Robustly Coordinated Bi-Level Energy Management of a Multi-Energy Building Under Multiple Uncertainties. IEEE Trans. Sustain. Energy 2021, 12, 3–13. [Google Scholar] [CrossRef]
  2. Al-Refaie, A.; Lepkova, N. Impacts of Renewable Energy Policies on CO2 Emissions Reduction and Energy Security Using System Dynamics: The Case of Small-Scale Sector in Jordan. Sustainability 2022, 14, 5058. [Google Scholar] [CrossRef]
  3. Navaratnam, S.; Ngo, T.; Gunawardena, T.; Henderson, D. Performance Review of Prefabricated Building Systems and Future Research in Australia. Buildings 2019, 9, 38. [Google Scholar] [CrossRef] [Green Version]
  4. González, J.; Soares, C.A.P.; Najjar, M.; Haddad, A.N. BIM and BEM Methodologies Integration in Energy-Efficient Buildings Using Experimental Design. Buildings 2021, 11, 491. [Google Scholar] [CrossRef]
  5. Das, S.S.; Das, A.; Dawn, S.; Gope, S.; Ustun, T.S. A Joint Scheduling Strategy for Wind and Solar Photovoltaic Systems to Grasp Imbalance Cost in Competitive Market. Sustainability 2022, 14, 5005. [Google Scholar] [CrossRef]
  6. Lee, Y.H.; Jeong, I.W.; Sung, T.H. An Assessment of the Optimal Capacity and an Economic Evaluation of a Sustainable Photovoltaic Energy System in Korea. Sustainability 2021, 13, 12264. [Google Scholar] [CrossRef]
  7. Chen, Y.; Chen, Z.; Yuan, X.; Su, L.; Li, K. Optimal Control Strategies for Demand Response in Buildings under Penetration of Renewable Energy. Buildings 2022, 12, 371. [Google Scholar] [CrossRef]
  8. AlKassem, A.; Draou, A.; Alamri, A.; Alharbi, H. Design Analysis of an Optimal Microgrid System for the Integration of Renewable Energy Sources at a University Campus. Sustainability 2022, 14, 4175. [Google Scholar] [CrossRef]
  9. Szypowski, M.; Siewierski, T.; Wędzik, A. Optimization of Energy-Supply Structure in Residential Premises Using Mixed-Integer Linear Programming. IEEE Trans. Ind. Electron. 2019, 66, 1368–1378. [Google Scholar] [CrossRef]
  10. Qi, J.; Liu, L.; Shen, Z.; Xu, B.; Leung, K.; Sun, Y. Low-Carbon Community Adaptive Energy Management Optimization Toward Smart Services. IEEE Trans. Ind. Inform. 2020, 16, 3587–3596. [Google Scholar] [CrossRef]
  11. Wang, B.; Xie, X.; Ding, W.; Yang, D.; Ying, L.; Zhu, G. Optimization of Retail Packages Adapted to the Electricity Spot Market with the Goal of Carbon Peak and Carbon Neutrality. In Proceedings of the 2021 IEEE 4th International Conference on Renewable Energy and Power Engineering (REPE), Beijing, China, 9–11 October 2021; pp. 311–317. [Google Scholar] [CrossRef]
  12. Qi, J.; Lai, C.; Xu, B.; Sun, Y.; Leung, K.-S. Collaborative Energy Management Optimization Toward a Green Energy Local Area Network. IEEE Trans. Ind. Inform. 2018, 14, 5410–5418. [Google Scholar] [CrossRef]
  13. Cui, S.; Wang, Y.; Xiao, J. Peer-to-Peer Energy Sharing Among Smart Energy Buildings by Distributed Transaction. IEEE Trans. Smart Grid 2019, 10, 6491–6501. [Google Scholar] [CrossRef]
  14. Razmara, M.; Bharati, G.R.; Shahbakhti, M.; Paudyal, S.; Robinett, R.D. Bilevel Optimization Framework for Smart Building-to-Grid Systems. IEEE Trans. Smart Grid 2018, 9, 582–593. [Google Scholar] [CrossRef]
  15. Thirugnanam, K.; El Moursi, M.S.; Khadkikar, V.; Zeineldin, H.H.; Hosani, M.A. Energy Management Strategy of a Reconfigurable Grid-Tied Hybrid AC/DC Microgrid for Commercial Building Applications. IEEE Trans. Smart Grid 2022, 13, 1720–1738. [Google Scholar] [CrossRef]
  16. Aaslid, P.; Korpas, M.; Belsnes, M.M.; Fosso, O. Stochastic Optimization of Microgrid Operation with Renewable Generation and Energy Storages. IEEE Trans. Sustain. Energy 2022, 13, 1481–1491. [Google Scholar] [CrossRef]
  17. Oskouei, M.Z.; Mohammadi-Ivatloo, B.; Erdinç, O.; Erdinç, F.G. Optimal Allocation of Renewable Sources and Energy Storage Systems in Partitioned Power Networks to Create Supply-Sufficient Areas. IEEE Trans. Sustain. Energy 2021, 12, 999–1008. [Google Scholar] [CrossRef]
  18. Wu, X.; Tang, Z.; Stroe, D.-I.; Kerekes, T. Overview and Comparative Study of Energy Management Strategies for Residential PV Systems with Battery Storage. Batteries 2022, 8, 279. [Google Scholar] [CrossRef]
  19. Antoniadou-Plytaria, K.; Steen, D.; Tuan, L.A.; Carlson, O.; Ghazvini, M.A.F. Market-Based Energy Management Model of a Building Microgrid Considering Battery Degradation. IEEE Trans. Smart Grid 2021, 12, 1794–1804. [Google Scholar] [CrossRef]
  20. Ruiz-Cortes, M.; Gonzalez-Romera, E.; Amaral-Lopes, R.; Romero-Cadaval, E.; Martins, J.; Milanes-Montero, M.I.; Barrero-Gonzalez, F. Optimal Charge/Discharge Scheduling of Batteries in Microgrids of Prosumers. IEEE Trans. Energy Convers. 2019, 34, 468–477. [Google Scholar] [CrossRef]
  21. Vašak, M.; Kujundžić, G. A Battery Management System for Efficient Adherence to Energy Exchange Commands Under Longevity Constraints. IEEE Trans. Ind. Appl. 2018, 54, 3019–3033. [Google Scholar] [CrossRef]
  22. Taylor, Z.; Akhavan-Hejazi, H.; Cortez, E.; Alvarez, L.; Ula, S.; Barth, M.; Mohsenian-Rad, H. Customer-Side SCADA-Assisted Large Battery Operation Optimization for Distribution Feeder Peak Load Shaving. IEEE Trans. Smart Grid 2019, 10, 992–1004. [Google Scholar] [CrossRef] [Green Version]
  23. Vedullapalli, D.T.; Hadidi, R.; Schroeder, B. Combined HVAC and Battery Scheduling for Demand Response in a Buildin. IEEE Trans. Ind. Appl. 2019, 55, 7008–7014. [Google Scholar] [CrossRef]
  24. Ahmad, A.; Khan, J.Y. Roof-Top Stand-Alone PV Micro-Grid: A Joint Real-Time BES Management, Load Scheduling and Energy Procurement from a Peaker Generator. IEEE Trans. Smart Grid 2019, 10, 3895–3909. [Google Scholar] [CrossRef]
  25. Hao, H.; Wu, D.; Lian, J.; Yang, T. Optimal Coordination of Building Loads and Energy Storage for Power Grid and End User Services. IEEE Trans. Smart Grid 2018, 9, 4335–4345. [Google Scholar] [CrossRef]
  26. Zhang, G.; Tian, Z.; Tricoli, P.; Hillmansen, S.; Wang, Y.; Liu, Z. Inverter Operating Characteristics Optimization for DC Traction Power Supply Systems. IEEE Trans. Veh. Technol. 2019, 68, 3400–3410. [Google Scholar] [CrossRef]
  27. Wang, Q.; Li, Y.; Ma, Y.; Chen, X. Research on multi-objective optimization design technology of regional integrated energy system. In Proceedings of the 16th IET International Conference on AC and DC Power Transmission (ACDC 2020), Online, 2–3 July 2020; pp. 1683–1688. [Google Scholar] [CrossRef]
  28. Wang, F.; Zhou, L.; Ren, H.; Liu, X.; Shafie-khah, M.; Catalão, J.P.S. Multi-Objective Optimization Model of Source–Load–Storage Synergetic Dispatch for a Building Energy Management System Based on TOU Price Demand Response. IEEE Trans. Ind. Appl. 2018, 54, 1017–1028. [Google Scholar] [CrossRef]
  29. Fleischhacker, A.; Auer, H.; Lettner, G.; Botterud, A. Sharing Solar PV and Energy Storage in Apartment Buildings: Resource Allocation and Pricing. IEEE Trans. Smart Grid 2019, 10, 3963–3973. [Google Scholar] [CrossRef]
  30. Wang, Y.; Wang, Y.; Huang, Y.; Yu, H.; Du, R.; Zhang, F.; Zhang, F.; Zhu, J. Optimal Scheduling of the Regional Integrated Energy System Considering Economy and Environment. IEEE Trans. Sustain. Energy 2019, 10, 1939–1949. [Google Scholar] [CrossRef]
  31. Mei, R.; Wu, T.; Geng, D.; Zhang, M.; Liu, Y.; Qian, X.; Sun, Y. Multi-objective optimization of integrated energy system based on improved NSGA-II algorithm. In Proceedings of the 2020 39th Chinese Control Conference (CCC), Shenyang, China, 27–29 July 2020; pp. 1721–1726. [Google Scholar] [CrossRef]
  32. Yang, Y.; Wu, W.; Wang, B.; Li, M. Chance-Constrained Economic Dispatch Considering Curtailment Strategy of Renewable Energy. IEEE Trans. Power Syst. 2021, 36, 5792–5802. [Google Scholar] [CrossRef]
  33. Garifi, K.; Baker, D.; Christensen, D.; Touri, B. Convex Relaxation of Grid-Connected Energy Storage System Models With Complementarity Constraints in DC OPF. IEEE Trans. Smart Grid 2020, 11, 4070–4079. [Google Scholar] [CrossRef]
  34. Ming, M.; Wang, R.; Ishibuchi, H.; Zhang, T. A Novel Dual-Stage Dual-Population Evolutionary Algorithm for Constrained Multi-Objective Optimization. IEEE Trans. Evol. Comput. 2021, 26, 1129–1143. [Google Scholar] [CrossRef]
  35. Lee, S.; Kwon, B.; Lee, S. Joint Energy Management System of Electric Supply and Demand in Houses and Buildings. IEEE Trans. Power Syst. 2014, 29, 2804–2812. [Google Scholar] [CrossRef]
  36. Abdul Majid, A. Forecasting Monthly Wind Energy Using an Alternative Machine Training Method with Curve Fitting and Temporal Error Extraction Algorithm. Energies 2022, 15, 8596. [Google Scholar] [CrossRef]
  37. Li, J.; Zhao, H. Multi-Objective Optimization and Performance Assessments of an Integrated Energy System Based on Fuel, Wind and Solar Energies. Entropy 2021, 23, 431. [Google Scholar] [CrossRef] [PubMed]
  38. Toma, P.; Dorin, P.; Radu, E.; Daniel, M. Sizing photovoltaic-wind smart microgrid with battery storage and grid connection. In Proceedings of the 2014 IEEE International Conference on Automation, Quality and Testing, Robotics, Cluj-Napoca, Romania, 22–24 May 2014; pp. 1–5. [Google Scholar] [CrossRef]
  39. Ren, F.; Wang, J.; Zhu, S.; Chen, Y. Multi-objective optimization of combined cooling, heating and power system integrated with solar and geothermal energies. Energy Convers. Manag. 2019, 197, 111866. [Google Scholar] [CrossRef]
  40. Faisal, M.; Hannan, M.A.; Ker, P.J.; Lipu, M.S.H.; Uddin, M.N. Fuzzy-Based Charging–Discharging Controller for Lithium-Ion Battery in Microgrid Applications. IEEE Trans. Ind. Appl. 2021, 57, 4187–4195. [Google Scholar] [CrossRef]
  41. Deb, K.; Pratap, A.; Agarwal, S.; Meyarivan, T. A fast and elitist multiobjective genetic algorithm: NSGA-II. IEEE Trans. Evol. Comput. 2002, 6, 182–197. [Google Scholar] [CrossRef] [Green Version]
  42. Deb, K.; Jain, H. An Evolutionary Many-Objective Optimization Algorithm Using Reference-Point-Based Nondominated Sorting Approach, Part I: Solving Problems with Box Constraints. IEEE Trans. Evol. Comput. 2014, 18, 577–601. [Google Scholar] [CrossRef]
  43. Jain, H.; Deb, K. An Evolutionary Many-Objective Optimization Algorithm Using Reference-Point Based Nondominated Sorting Approach, Part II: Handling Constraints and Extending to an Adaptive Approach. IEEE Trans. Evol. Comput. 2014, 18, 602–622. [Google Scholar] [CrossRef]
  44. Li, F.; Li, X.; Zhang, B.; Li, Z.; Lu, M. Multiobjective Optimization Configuration of a Prosumer’s Energy Storage System Based on an Improved Fast Nondominated Sorting Genetic Algorithm. IEEE Access 2021, 9, 27015–27025. [Google Scholar] [CrossRef]
  45. Homa, M.; Pałac, A.; Żołądek, M.; Figaj, R. Small-Scale Hybrid and Polygeneration Renewable Energy Systems: Energy Generation and Storage Technologies, Applications, and Analysis Methodology. Energies 2022, 15, 9152. [Google Scholar] [CrossRef]
  46. Bharatee, A.; Ray, P.K.; Subudhi, B.; Ghosh, A. Power Management Strategies in a Hybrid Energy Storage System Integrated AC/DC Microgrid: A Review. Energies 2022, 15, 7176. [Google Scholar] [CrossRef]
  47. Tshiani, C.T.; Umenne, P. The Impact of the Electric Double-Layer Capacitor (EDLC) in Reducing Stress and Improving Battery Lifespan in a Hybrid Energy Storage System (HESS) System. Energies 2022, 15, 8680. [Google Scholar] [CrossRef]
Figure 1. Microgrid structure of renewable energy power generation system and energy storage system in public building.
Sustainability 15 01460 g001
Figure 2. Daily variation curve of electricity price.
Sustainability 15 01460 g002
Figure 3. Flow chart of solution set transformation.
Sustainability 15 01460 g003
Figure 4. Flow chart of STNSGA-II.
Sustainability 15 01460 g004
Figure 5. Observation point wind speed.
Sustainability 15 01460 g005
Figure 6. Modified wind speed.
Sustainability 15 01460 g006
Figure 7. Annual hourly energy yield of a single fan.
Sustainability 15 01460 g007
Figure 8. Hourly solar radiation throughout the year.
Sustainability 15 01460 g008
Figure 9. Annual hourly PV generation.
Sustainability 15 01460 g009
Figure 10. Annual hourly building electrical load.
Sustainability 15 01460 g010
Figure 11. Average daily power generation of fan and PV.
Sustainability 15 01460 g011
Figure 12. Average daily electric load.
Sustainability 15 01460 g012
Figure 13. Pareto frontier distribution as calculated by STNSGA-II.
Sustainability 15 01460 g013
Figure 14. Pareto frontier distribution as calculated by NSGA-II.
Sustainability 15 01460 g014
Figure 15. Pie chart of cost distribution yielded by STNSGA-II.
Sustainability 15 01460 g015
Figure 16. Pie chart of cost distribution yielded by NSGA-II.
Sustainability 15 01460 g016
Figure 17. Energy storage charging and discharging power curves of 6 cases.
Sustainability 15 01460 g017
Figure 18. Hourly variation of batteries and inverters.
Sustainability 15 01460 g018
Figure 19. Renewable energy daily power generation and carbon emission reduction.
Sustainability 15 01460 g019
Figure 20. Power balance diagram of two case.
Sustainability 15 01460 g020
Table 1. Fan parameters.
Fan ModelVciVrVmaxVcoPfrPfmhfanDfanCpT
FD-300 W (400 W)2 m/s10 m/s13 m/s15 m/s300 w400 w2 m1.22 m0.421520–40 °C
Table 2. PV parameters.
PV Array ModelHP-S100-12S
Pv size850 × 680 × 30 mm
NOCT45 °C ± 2 °C
Pstc100 W
αpv−0.5% (±0.05%)/°C
Upv18.00 V
Ipv5.60 A
Gstc1000 W/m2
Tpv,stc25 °C
Table 3. Unit cost of equipment and annual operation and maintenance cost.
Device TypeCcCo&m
Fan4500 ¥/KW800 ¥/KW
Photovoltaic9000 ¥/KW100 ¥/KW
Storage battery1800 × 4 ¥/KW60 ¥/KW
Grid-connected inverter250 ¥/KW50 ¥/KW
Table 4. Comparison of data of two algorithms.
AlgorithmCaseFanPhotovoltaicBattery
(kwh)
Inverter
Capacity (kwh)
Average Daily Cost (yuan)Inverte
Fluctuation
Carbon Emission Reductions (kg)
STNSGA-II131064863670.6659.914,1903.843014.3
247191252472.8793.512,058101.84298
351890041630.5731.510,993150.774328.8
NSGA-II451890041401.6761.536,03055.694328.4
535966201404.1369.232,0629.73146.5
646591412323.6993.713,976334.334294.4
Disclaimer/Publisher’s Note: The statements, opinions and data contained in all publications are solely those of the individual author(s) and contributor(s) and not of MDPI and/or the editor(s). MDPI and/or the editor(s) disclaim responsibility for any injury to people or property resulting from any ideas, methods, instructions or products referred to in the content.