Article

Impact of Landscape Pattern on River Water Quality Based on Different Topographic Relief Areas: A Case Study of Chishui River Basin in Southwest China

College of Mining, Guizhou University, Guiyang 550025, China
*
Author to whom correspondence should be addressed.
Sustainability 2023, 15(2), 1476; https://doi.org/10.3390/su15021476
Submission received: 24 November 2022 / Revised: 30 December 2022 / Accepted: 8 January 2023 / Published: 12 January 2023

Abstract

:
The water quality of the basin is affected by many factors. The unique geological conditions in karst areas create highly heterogeneous geographical characteristics, which makes the relationship between water quality and landscape more complex and uncertain. In order to further study how these factors affect water quality in typical karst basin, this study takes Chishui River Basin in Southwest China as the research object, and Kruskal-Wallis test, Pearson correlation analysis and geographic detector methods were used to quantitatively explore the difference between STR and LTR water quality factors and the impact of landscape on water quality under the driven of temperature, precipitation, population density and per capita GDP. The novelty of this study is that according to the topographic and geomorphic features of Chishui River Basin, sub-basins with different topographic relief are divided to study the difference of the influence of surface landscape on river water quality driven by topography, meteorology and human activities. The results show that: (1) The water quality in the area with large topographic relief (LTR) is better than that in the area with small topographic relief (STR); (2) In STR, human activities are more obvious, and dry land and construction land have a significant impact on water quality; In LTR, forest land is the main factor; (3) In STR, the interaction between population density and landscape indicators is obvious, while in LTR, the interaction between precipitation and landscape indicators is significant; (4) In STR, the focus is to coordinate the relationship between natural landscape types and man-made landscape types; In LTR, it is more necessary to harness steep slope farmland. Understanding the influencing factors of water quality in different topographic relief areas can determine more targeted protection measures in different topographic relief areas to achieve the purpose of protecting water quality.

1. Introduction

In recent decades, affected by global changes and human activities, the ecological environment has been seriously damaged and the ecosystem service function has declined [1]. The Millennium Ecosystem Assessment report released by the United Nations in 2005 shows that 15 of the world’s 24 ecosystem services have degraded in the past half century, including water resources protection [2]. Water resources are the basic resources for human survival and development [3]. Rivers are one of the most important water resources, various factors affecting the river water quality [4]. Water quality is the decisive factor of water resources quality. Point source pollution has been basically controlled at present, and non-point source pollution has become the key to affect water quality [5]. As a product of human activities, landscape pattern affects the ecological environment of rivers by changing ecological processes such as hydrological cycle, soil erosion, nutrient migration and transformation. Therefore, it is of great significance to explore the relationship between landscape pattern and river water quality for land use management planning and effective protection of water ecological environment resources.
With the rapid development of landscape ecology, geographic information system (GIS) technology and remote sensing (RS) technology, the study of landscape water quality has been paid more attention. Scholars at home and abroad have done a lot of research on how different landscape patterns affect environmental water quality. The proportion of farmland and urban land has a significant positive correlation with water pollution [6]. After rapid urbanization, infrastructure construction such as impermeable roads and roofs is increasing, providing more ways for NPS pollutants (such as urban runoff, agricultural activities and the deposition of air pollutants) [7]. Forests are the “sink” landscape in the nutrient cycle [8]. Zhang et al. [9] used principal component analysis, redundancy analysis and partial least squares regression analysis to study the impact of land use and landscape pattern characteristics on surface seasonal water quality. Wang et al. [10] used Spearman correlation analysis and redundancy analysis to explore the response of water quality indicators to coastal land use types from river coastal buffer zones with different topography and different spatial scales. Fan et al. [11] used the methods of correlation analysis, redundancy analysis and stepwise regression analysis to explore the response law of river water quality to watershed landscape pattern. Shi et al. [6] showed that landscape indicators such as patch density (PD), largest patch index (LPI) and landscape shape index (LSI) were closely related to river water quality. However, it is not enough to consider the impact of landscape pattern on watershed water quality. There are many other factors that can also affect watershed water quality. In nature, temperature, precipitation, and topography directly affect surface runoff, which affects the entry of pollutants such as nitrogen and phosphorus into rivers [12,13]. Population density, per capita GDP and landscape pattern also have important influences on water quality [14,15].
In particular, karst ecosystem is a fragile ecological type with small environmental capacity and low anti-interference ability. It is sensitive to changes in environmental factors, has poor ecological stability, and fluctuates greatly in biological composition and productivity, and is prone to succession in a direction unfavorable to human use [16,17,18]. The karst area in southwest China is located in the subtropical monsoon humid climate zone. Although the precipitation is abundant, the seasonal distribution is uneven. At the same time, the rock fissures and sinkholes make the precipitation leak rapidly, making it difficult to use water resources; In addition, the low content of insoluble matter in carbonate rock leads to slow soil formation rate of carbonate rock, shallow, barren and discontinuous soil layer; Vegetation growth is slow, biomass is low, and it is unable to effectively conserve water [16]. Therefore, it is of great significance to explore the influence of climate and human activities on water quality in karst areas.
River Basin is a river centered ecosystem, and its landscape pattern distribution is mostly affected by topographic factors [19]. The changes of topographic factors directly or indirectly change the mutual transformation of surface material and energy, thus affecting the water quality of the watershed, resulting in a certain regularity in different topographic relief areas [20]. At the same time, due to the mutual restriction, continuous change and complexity of the landscape pattern within the basin, it is difficult to analyze the landscape pattern [21]. Therefore, it is a new direction of ecological research to study the laws of watershed water quality in different topographic relief areas by using the distribution of landscape pattern in the watershed and combining with topographic factors. Scholars have done a lot of research work on the impact of terrain factors on landscape pattern, and achieved good results. Ahmed Suhail et al. [19] found that the middle section of the Dadu River basin has higher values of hypsometric integral, normalized stream length gradient, topographic relief, slope and channel steepness, which are greatly different from the upper and lower sections, leading to the adjustment of the landscape in the middle part of the Dadu River basin. Zhang et al. [22] discussed the relationship between terrain characteristics and landscape index and concluded that altitude and other terrain factors play an important role in landscape mosaics. However, in karst catchments, the influence of landscape on river water quality is driven by topography, meteorology and human activities. The sub-basins with different undulations show different characteristics. This is of great significance for the water environment protection of different relief sub-basins, but this difference has not been accurately obtained in the existing studies.
Chishui River Basin has a highly heterogeneous natural environment, with undulating terrain and complex and diverse landscapes. It is very difficult to study the impact of various factors on water quality. Previous studies have found that the correlation between landscape pattern indicators and water quality parameters at the sub-basin scale is stronger than that at the riparian scale [23,24]. Therefore, on the scale of the sub-basin, the study area is divided into the area with small topographic relief (STR) and the area with large topographic relief (LTR) according to the topographic factors. The main research content of this paper is to explore the relationship between landscape composition and water quality in different topographic relief areas; Different landscape patterns in different topographic relief regions have different explanatory power to water quality; And the impact of the interaction between temperature, precipitation, population density, per capita GDP and landscape on water quality in different topographic relief areas. The novelty of this study is to explore the difference between STR and LTR water quality factors and the impact of landscape on water quality under the influence of temperature, precipitation, population density and per capita GDP. The purpose of this study is (1) to explore the difference of the impact of surface landscape on water quality under the interaction of various influencing factors in sub-basin with different topographic relief (2) to put forward reasonable suggestions for water quality protection in different topographic relief areas. The research methods and results can provide reference for the characterization of main factors and comprehensive effects of non-point source pollution control in the Chishui River Basin.

2. Data and Methods

2.1. Study Area

Located in southwest China, the Chishui River is one of the most important tributaries of the upper Yangtze River. The total length of the main stream is about 444.5 km, and the total basin area is nearly 19,600 km2. The Chishui River originates in Yunnan Province, passes through northwestern Guizhou Province, and flows into the Yangtze River in Sichuan Province (Figure 1). Located at 104°44′ E to 106°59′ E and 27°14′ N to 28°50′ N, the entire study area has a subtropical monsoon climate. Winter in the watershed is cold and dry with an annual lowest temperature of −5 °C; and summer there is hot and wet with an annual highest temperature of 39 °C. The mean annual temperature ranges from 15 to 20 °C. The average annual precipitation of the basin ranges from 900 mm to 1500 mm. Chishui River Basin has its unique geographical environment. There is Yungui Plateau in the basin, with an elevation of 2237 m at the top and 205 m at the exit. There are also typical karst landforms, forming complex landforms such as mountains, hills and deep valleys. The topographic relief varies greatly in each sub-basin.
The economic development of the counties in the Chishui River Basin is related to its natural environment. The counties in the upper reaches have a relatively backward economy, with a vulnerable ecological environment and relatively lower forest coverage, and the agricultural production is developed. The middle reaches are the water source of two internationally famous Baijiu brands, which have strict requirements for good water quality. The ecological environment in the lower reaches is relatively better and the tourism industry is very developed. This basin is located in the Rare and Unique Fish National Nature Reserve in the upper Yangtze River [25]. Therefore, the protection of regional water quality is crucial.

2.2. Water Sample Collection and Water Quality Evaluation

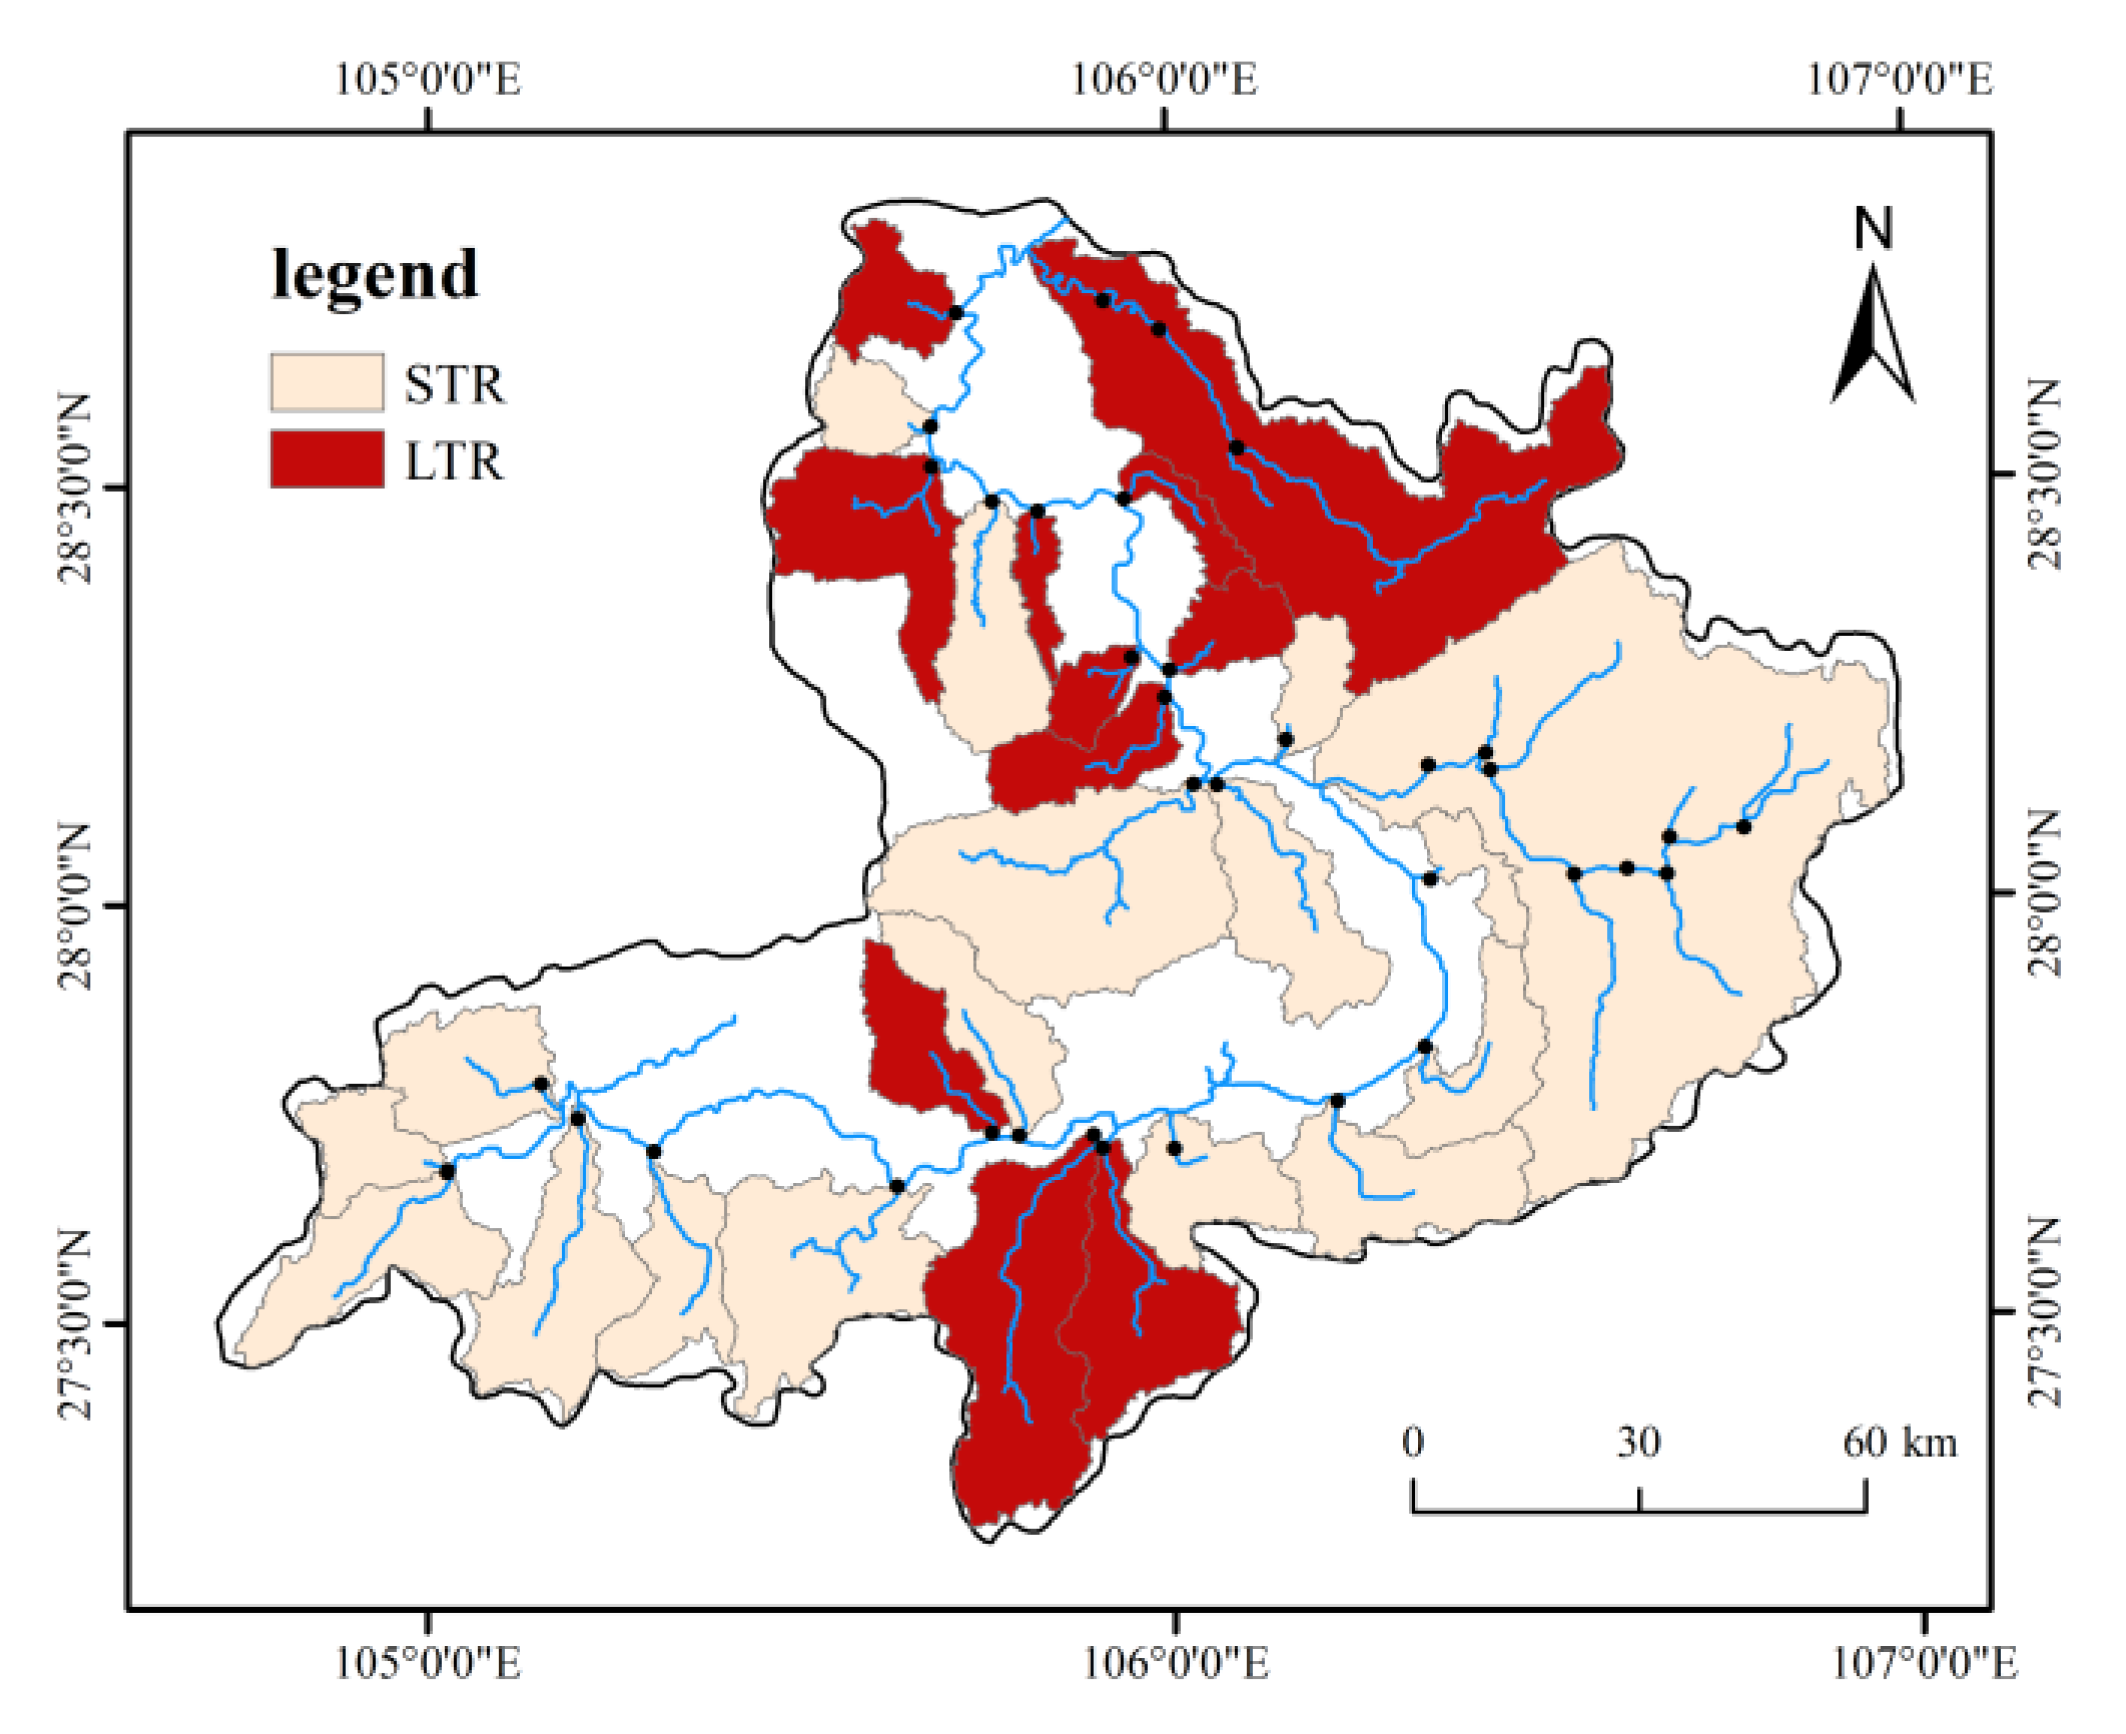
Four field surveys were conducted in 2017 dry season (January), 2017 wet season (August), 2021 wet season (August) and 2022 dry season (January) along the main stream and main tributaries of the Chishui River, and seasonal water samples were collected. The sampling point is located at the section before the confluence of 28 main tributaries of Chishui River (Figure 2). Two sampling campaigns were completed within one week and the samples were saved in a high-density polyethylene container and filtered using 0.45 μm Millipore nitrocellulose membrane filters within 24 h.
The water quality indicators selected in this study consisted of 5 water physic-chemical parameters, including water temperature (WT, °C), pH, electric conductivity (EC, μs cm−1), total phosphorus (TP, mg L−1), and total nitrogen (TN, mg L−1). The WT, pH and EC were measured in situ with a portable multi-parameter measuring instrument (WTW Multi 3630 IDS, Germany). TP and TN were measured in the laboratory. Storage, preservation and chemical analysis followed national standard methods of examining water and wastewater in China (GB3838-2002).
According to the time division of the wet season and dry season, the water quality data in August 2021 and August 2017 are taken as the wet season, and the water quality data in January 2022 and January 2017 are taken as the dry season to understand the water quality differences more clearly in different topographic relief areas, and obtain more universal experimental results.
The Nemerow Pollution Index selected in this study can not only highlight the most serious pollution factors, but also consider other factors with good water quality to a certain extent, avoiding the subjective influence of artificial weight given to each factor in the calculation process. The calculation formula is as follows:
I i = C i C o i
I ¯ = 1 n i = 1 n I i
I P = I i , m a x 2 + I ¯ 2 2
where, I i is the pollution index of evaluation factor i ; I ¯ is the average value of pollution index of n evaluation factors; I P is the Nemerow pollution index; I i , m a x 2 is the maximum value of pollution index among all pollution assessment factors; Ci is the measured value of the i th evaluation factor; C o i is the water quality standard value of the i th evaluation factor, and class III standard of environmental quality standard for surface water (GB 3838-2002) is selected in this study.

2.3. Data Sources

The basic data used in this paper mainly includes four types: (1) landscape data; (2) terrain data; (3) meteorological data (precipitation and temperature); (4) socioeconomic data.
(1) Landscape composition and landscape pattern index are based on land use data. Remote sensing monitoring data of land use status in 2015 and 2020 are provided by the Resource and Environmental Science Data Center of the Chinese Academy of Sciences (www.resdc.cn (accessed in 2015 and 2020)), based on Landsat TM/ETM images and interpreted manually.
Relevant studies have shown that paddy field and dry land have a huge difference in their contributions to source pollution [26], and forest land and shrubbery also have different contributions to the water quality in the basin [27]. Therefore, this study divides cultivated land into dry land and paddy fields, and total forest land into forest land and shrubbery. With reference to the current classification standard of land use status in China (GBT21010-2007) and in combination with the special geographical environment of the study area, the land use structure of the Chishui River Basin is divided into six categories: paddy field, dry land, forest land, shrubbery, grassland and construction land (Figure 3). Through field verification, the classification results are of high precision and small error, which meet the requirements of research and analysis. The percentage of rivers and unused land account for less than 2% of the total catchment area, so no further analysis of rivers and unused land has been conducted.
According to the Technical Regulations of Land Use Investigation formulated by the National Agricultural Zoning Committee and other relevant regulations, the slope is divided into three levels, with slope demarcation points of 6° and 25° respectively (Table 1). Based on the comprehensive research results of many scholars [25,28], and according to the previous research results of our research group [27,29], combined with the regional characteristics of the Chishui River Basin, this study selects the sub-basin scale (the whole watershed of a branch) to study the water quality of the Chishui River Basin (Figure 2).
FRAGSTATS software is commonly used to calculate various landscape indicators of landscape composition. In the study area, based on the landscape of each slope, FRAGSTATS 4.5 software is used to calculate the landscape index of the type level, and the landscape variables that have significant impact on river water quality proved by literature research are given priority [26,28,30,31]. The selected landscape indexes include percentage of land use (PL), patch density (PD), largest patch index (LPI), edge density (ED), landscape shape index (LSI), and mean patch size (MPS) (Table 2).
(2) For the terrain data, we used the Digital Elevation Model STRM DEM data from the Geospatial Data Cloud (http://www.gscloud.cn/ (accessed each year in 2017 and 2021)), at a spatial resolution of 30 m. DEM data is used to extract topographic data such as elevation, slope and topographic relief of sub-basin.
(3) For the meteorological data, the temperature and precipitation data are from the resource and environmental science and data center of the Chinese Academy of Sciences (https://www.resdc.cn/ (accessed each year in 2017 and 2021)).
(4) Furthermore, we have selected population density and the regional economic situation (assessed by Gross Domestic Product (GDP) value) of the catchment to explore the influences of human activities on river water quality. Mean population density and GDP values of sub-basin were extracted through ArcGIS 10.2 software (The data were obtained by consulting the statistical yearbooks of Yunnan, Guizhou and Sichuan provinces).

2.4. Geographic Factor Analysis

Based on DEM data, the topographic features of 28 independent sub-basins in Chishui River Basin were extracted, including mean elevation, standard deviation of elevation, mean topographic relief and topographic map relief standard deviation (Table 3).
Topographic relief represents the degree of topographic relief in the region, that is, the difference between the maximum elevation value and the minimum elevation value. Topographic relief is not only an important topographic factor to measure topographic relief changes, but also an important parameter that directly affects macro micro environmental stability, ecological balance and spatio-temporal variability of land use in natural processes.
Rd = max(H) − min(H)
where, Rd is topographic relief; max(H) and min(H) are the highest and lowest altitude in the area respectively, unit: m.
The relief amplitude is highly scale dependent, and thus calculating the relief amplitude has to take into consideration of spatial scales. First, the moving window method was applied to the DEM data to calculate the relief amplitudes at different window sizes (i.e., n × n) and the window sizes may vary from n = 2 to n = 40 (n = number of pixels of DEM data). The relief amplitude was obtained by calculating the elevation difference between the maximal elevation (i.e., maximal pixel) and the minimal elevation (i.e., minimal pixel) in every window and by assigning the elevation difference to the central pixel of the window. The average values of the calculated relief amplitude (i.e., average relief amplitudes) vary with the window area (i.e., window size) and display the characteristics of a logarithmic curve with the goodness of fit being as high as 0.96 [30]. The curve was first rather steep and then became quite gentle. The mean turning-point analysis was then employed to determine the exact turning point from the optimal statistical zone. The method, a statistics-based one, is to determine an abnormal point or an abrupt changing point in a data series. The method was reported to be most effective for data series with only one abrupt changing point. The statistical unit of the optimal analysis window in Chishui River Basin is 12 × 12. Therefore, the area of statistical unit of the best analysis window for relief of Chishui River Basin extracted based on DEM data with 30 m spatial resolution is 0.129 6 km2. Based on DEM and Landsat 8 data, the arcgis10.2 was used to calculate the average topographic relief. The elevation range of Chishui River Basin is about 192–2487 m. The average elevation of its sub-basin is 403.2–1585.1 m, and the standard deviation of elevation is 276.47; The topographic relief between the sub-basins is 70.5–206.7 m, and the standard deviation of topographic relief is 29.23. The above data show that the topography of the Chishui River Basin is complex and changeable, and the relief of topography varies greatly among sub-basins, which can not be ignored.
According to the topographic characteristics of 28 sub-basins (topographic relief, topographic relief standard deviation and elevation standard deviation), they are divided into two categories using K-means clustering method: areas with small topographic relief (STR) and areas with large topographic relief (LTR). The average topographic relief and standard deviation of the area with small topographic relief is 112.44 ± 49.53 m, and the average elevation standard deviation is 199.00 m; the two values are larger in the area with large topographic relief, respectively 141.69 ± 67.34 m and 271.50 m. Xu et al. [25] confirmed that there is a correlation between the average altitude, the standard deviation of altitude, topographic relief and other topographic factors and water quality indicators. The LTR has greater topographic relief and standard deviation and greater elevation standard deviation than the STR. Therefore, the sub-basin is divided into two regions according to the topographic factors, and the impact of various factors on the water quality of Chishui River Basin in different topographic relief areas can be analyzed in the wet season and dry season respectively (Figure 4).

2.5. Data Statistics and Processing

In this study, Kruskal–Wallis test [25] is used to determine the difference of water quality in different topographic relief areas. The correlation between landscape composition and water quality parameters is obtained through Person correlation analysis. The explanatory power of many landscape composition and landscape pattern index factors on water quality can be quantitatively analyzed by using the method of geographic detector, and the factors with greater explanatory power can be screened out. Then, the interactive detection of geographic detector was used to further explore the impact of landscape on the water quality of the basin under the influence of temperature, precipitation, population density and per capita GDP in different relief areas.
The relationship between influencing factors and watershed water quality, including individual effects and interactions, was quantified by geographic detector method. The geographic detector method proposed by Wang et al. [31] is a statistical method, including factor detection, interaction detection, ecological detection and risk detection. It has been widely used in many disciplines to detect the spatial differentiation of geographical phenomena and reveal their effects.
The geographical detector method was used to compare the spatial consistency of water quality versus the geographical layers (e.g., temperature, precipitation, terrain, Landscape composition, landscape pattern, etc.) in which potential influence factors exist. Each geographical factor was divided into different strata; different strata have different attribute values. If one factor dominates the cause of water quality, the water quality will exhibit a spatial distribution similar to that of the geographical factor [31] and the variance of water quality within the strata of the geographical factor is less than that between the strata, that is, spatially stratified heterogeneity exists. The q statistic in the geographic detector can explore the spatial stratification heterogeneity of watershed water quality, and detect the degree of spatial stratification heterogeneity of surface water quality explained by natural and human factors. As shown in Equation (5)
q = 1 h = 1 L N h σ h 2 N σ 2
where, the water quality of the basin is composed of N units, which are divided into h = 1, 2, …, L layers; Stratum h is composed of N h units; σ h 2 and σ h 2 represents the variance of population and stratum respectively. The value of q statistic is in the range of [0, 1]. When the value of q is close to 1, The value of σ h 2 is close to 0, which means that the factor has the same distribution as the water quality of the basin. The interactive detector in the geographic detector can be used to analyze the impact of the interaction of two or more factors on the water quality of the basin. Table 4 shows the interaction results of the two factors. The value of q(X1∩X2) represents the explanatory power of the interaction of X1 and X2 on the water quality of the basin. According to the relationship between q(X1∩X2) and q(X1), q (X2), the interaction between the two factors is divided into nonlinear weakening, weakening, binary enhancement, independent and nonlinear enhancement.
The water quality of the basin is affected by many factors, such as topography, climate, land use and human socio-economic activities. Considering the previous research and data availability, the following indicators are selected as the influencing factors of water quality in the Chishui River Basin [32,33]. Among them, natural factors including temperature and rainfall directly affect the water quality of the basin. As human social activities, population density, per capita GDP and landscape pattern factors indirectly become important factors affecting water quality in the basin. The selected influencing factor data are classified and discretized through ArcGIS 10.2 and SPSS, realizing the spatialization and quantification of influencing factors of each sub-basin in the basin.

3. Results

3.1. Characteristics and Variations of Water Physic-Chemical Parameters in Different Topographic Relief Areas

According to the limit value standard of water quality indicators detected in comparison with the Environmental Quality Standard for Surface Water (GB3838-2002) based on the sampling results of water quality in the two stages of the Chishui River Basin, the statistical values of water physical and chemical parameters in STR and LTR in the two stages are listed, including the maximum, minimum, average and standard deviation of each water quality indicator (Table 5).
In general, the pH value of river water during these two periods ranges from 7.4 to 8.5, which is slightly alkaline in general. The average water temperature in the wet season is 21 °C higher than 10 °C in the dry season. The TN content in the watershed is far higher than the Class III limit, and the nitrogen pollution is serious; TP content is lower than Class III limit, and phosphorus pollution is small. There are seasonal differences in the physical and chemical parameters of watershed water. TP, TN and EC are lower in the rainy season than in the dry season. The Nemerow pollution index is also smaller in the rainy season, and the water quality is better.
On this basis, through Kruskal-Wallis test, this study found that TP, TN and EC also have significant differences in LTR and STR. TP, TN and EC of STR in Chishui River Basin are higher than LTR, and Nemerow pollution index is smaller in LTR area.
The ion absorption capacity of the thin soil layer in the Chishui River Basin is weak, which easily leads to the loss of ions in the soil to the river. Compared with the three kinds of water quality standards, the exceeding standard rate of total nitrogen is much higher than that of total phosphorus, and the pollution of total nitrogen to water quality is more serious than that of total phosphorus; According to the calculated average Nemerow pollution index, the water quality of the two regions in the two periods from good to bad is LTR in wet season, STR in dry season, LTR in wet season and STR in dry season.

3.2. Relationship between Landscape and Water Quality in Different Topographic Relief Areas

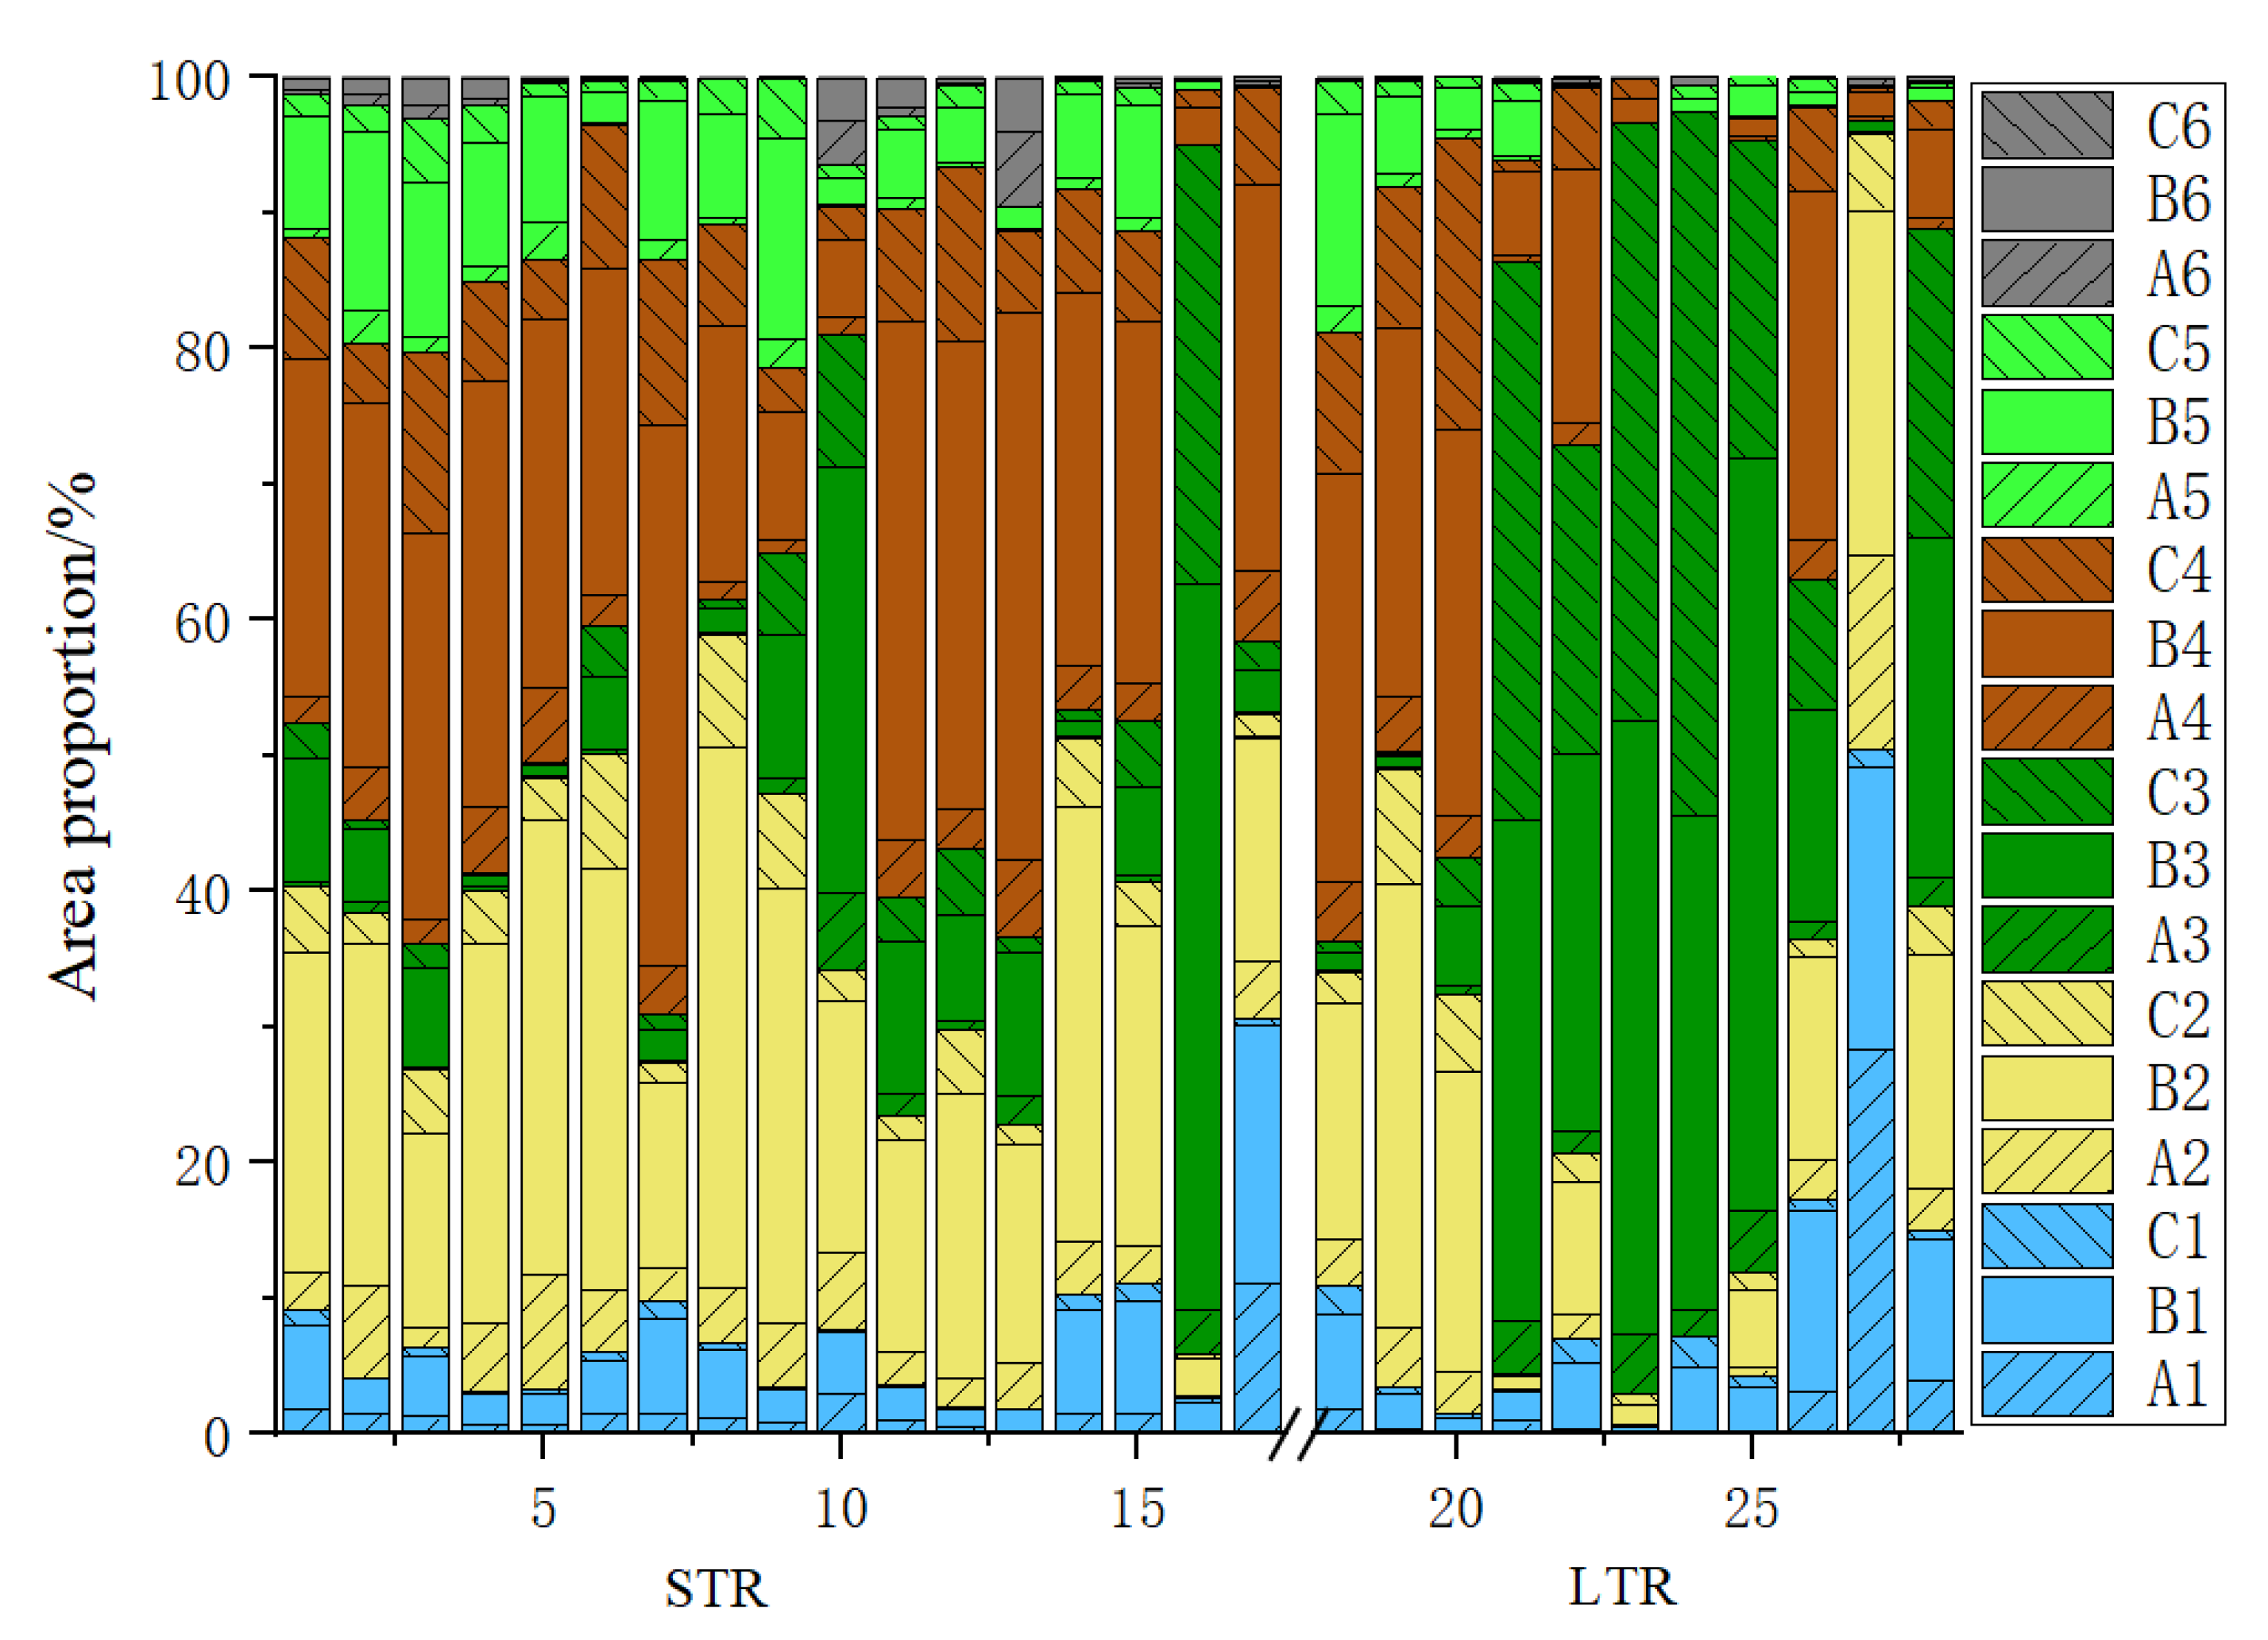
The landscape types are divided into 18 categories according to slope and land use type (Figure 3). In different terrain undulating areas, the landscape composition is significantly different. First, from STR to LTR, the area of dry land, shrubbery and construction land decreased, and the area of forest land increased significantly. Second, in STR, the proportion of dry land and shrubbery is the largest, with the sum of the two accounting for 63.5%. The construction land is concentrated in STR. In LTR, forest land is the main landscape, accounting for 42.2%. Forest land is the only landscape type that increases with the increase of fluctuation range, and it is mainly gentle slope forest land and steep slope forest land. STR is an area with frequent human activities, which is suitable for farming and construction and shows the deepest human conflict. In LTR, the impact of human activities is small, and the ecological environment is good. Pearson correlation analysis is conducted on the water quality indicators (EC, TP and TN) and landscape composition indicators of the Chishui River Basin (Figure 5). The results of correlation analysis show that the proportion of landscape types and water quality indicators are different in different water periods and different topographic relief areas. Dry land, shrubbery and construction land are positively correlated with water quality indicators, and are the main “source” landscapes that pollute river water quality; There is a significant negative correlation between forest land and water quality indicators, which is a “sink” landscape. Grassland was positively correlated with TN and EC, and negatively correlated with TP.
The study area is located in karst mountain area, with poor soil and high erosion risk. There is a lot of dry land agricultural activities. Due to excessive fertilization, pollutants such as chemical fertilizers and pesticides are easy to enter rivers through surface runoff, soil flow, shallow groundwater and other channels during the flood season, resulting in eutrophication of river water body and deterioration of water quality. In recent years, the implementation of the policy of “returning farmland to forests and grasslands” has increased the proportion of shrubbery and grassland. Due to the nitrogen and phosphorus residues caused by previous farming methods, the ability of shrubbery and grassland roots to intercept pollutants is weak, and the slope is inclined. With the help of gravity and terrain, the erosion ability of runoff is enhanced, making it easier for surface pollutants to migrate to rivers. The construction land is a densely populated area where people live and work. There are many ways of industrial point source pollution and rural urban non-point source pollution. The laying of impervious surface and the design of pipeline drainage led to the accumulation and discharge of pollutants, making the construction land become the main source of river water pollution. Forest land can intercept surface runoff, capture sediment and absorb pollutants, thus significantly reducing the pollutant load in runoff.
In general, the correlation between water quality indicators and landscape composition indicators in STR is small, and the correlation is more significant in LTR. It is specifically shown in the gentle slope dry land, slope dry land, gentle slope forest land, steep slope forest land, shrubbery and grassland. In comparison of water quality and landscape composition in rainy season and dry season, different topographic relief areas are different. The water quality indicators of flat dry land and gentle slope dry land are more significant in rainy season, while those of construction land and dry season are more significant. It is concluded that the landscape of different topographic relief areas has different effects on water quality.

3.3. Relationship between Landscape Pattern and Water Quality in Different Topographic Relief Areas

Six landscape pattern indexes, namely, percentage of land use (PL), patch density (PD), largest patch index (LPI), edge density (ED), landscape shape index (LSI), and mean patch size (MPS), and 108 slope landscape pattern indexes were obtained based on the six landscapes of paddy field, dry land, forested land, shrubbery, grassland, and construction land with three slope grades.
The spatial patterns of landscape also played a key role in mediating ecological processes (i.e., energy flows, hydrological process, and nutrient cycles). PD and ED indicators are often used to characterize the fragmentation degree and edge density of the landscape. LSI indicators are perimeter area ratio, which increases with the irregular shape. High PD, ED and LSI means that human activities are strong in the landscape in the region, and the spatial distribution of patches tends to disperse, which may increase surface runoff and soil erosion, making the risk of water quality deterioration in the basin high [34]. LPI and MPS indexes were used to characterize the maximum plaque proportion and average plaque area. Higher LPI and MPS means that the landscape patches in the region are relatively complete and fragmented. However, its impact on water quality depends on whether the patch belongs to “source” landscape or “sink” landscape.
According to the statistics of “source” and “sink” landscape indicators of STR and LTR (Table 6), it is found that they are significantly different in different topographic relief areas.
The “source” landscape includes dry land, bushes and construction land; The “sink” landscape is forest land.
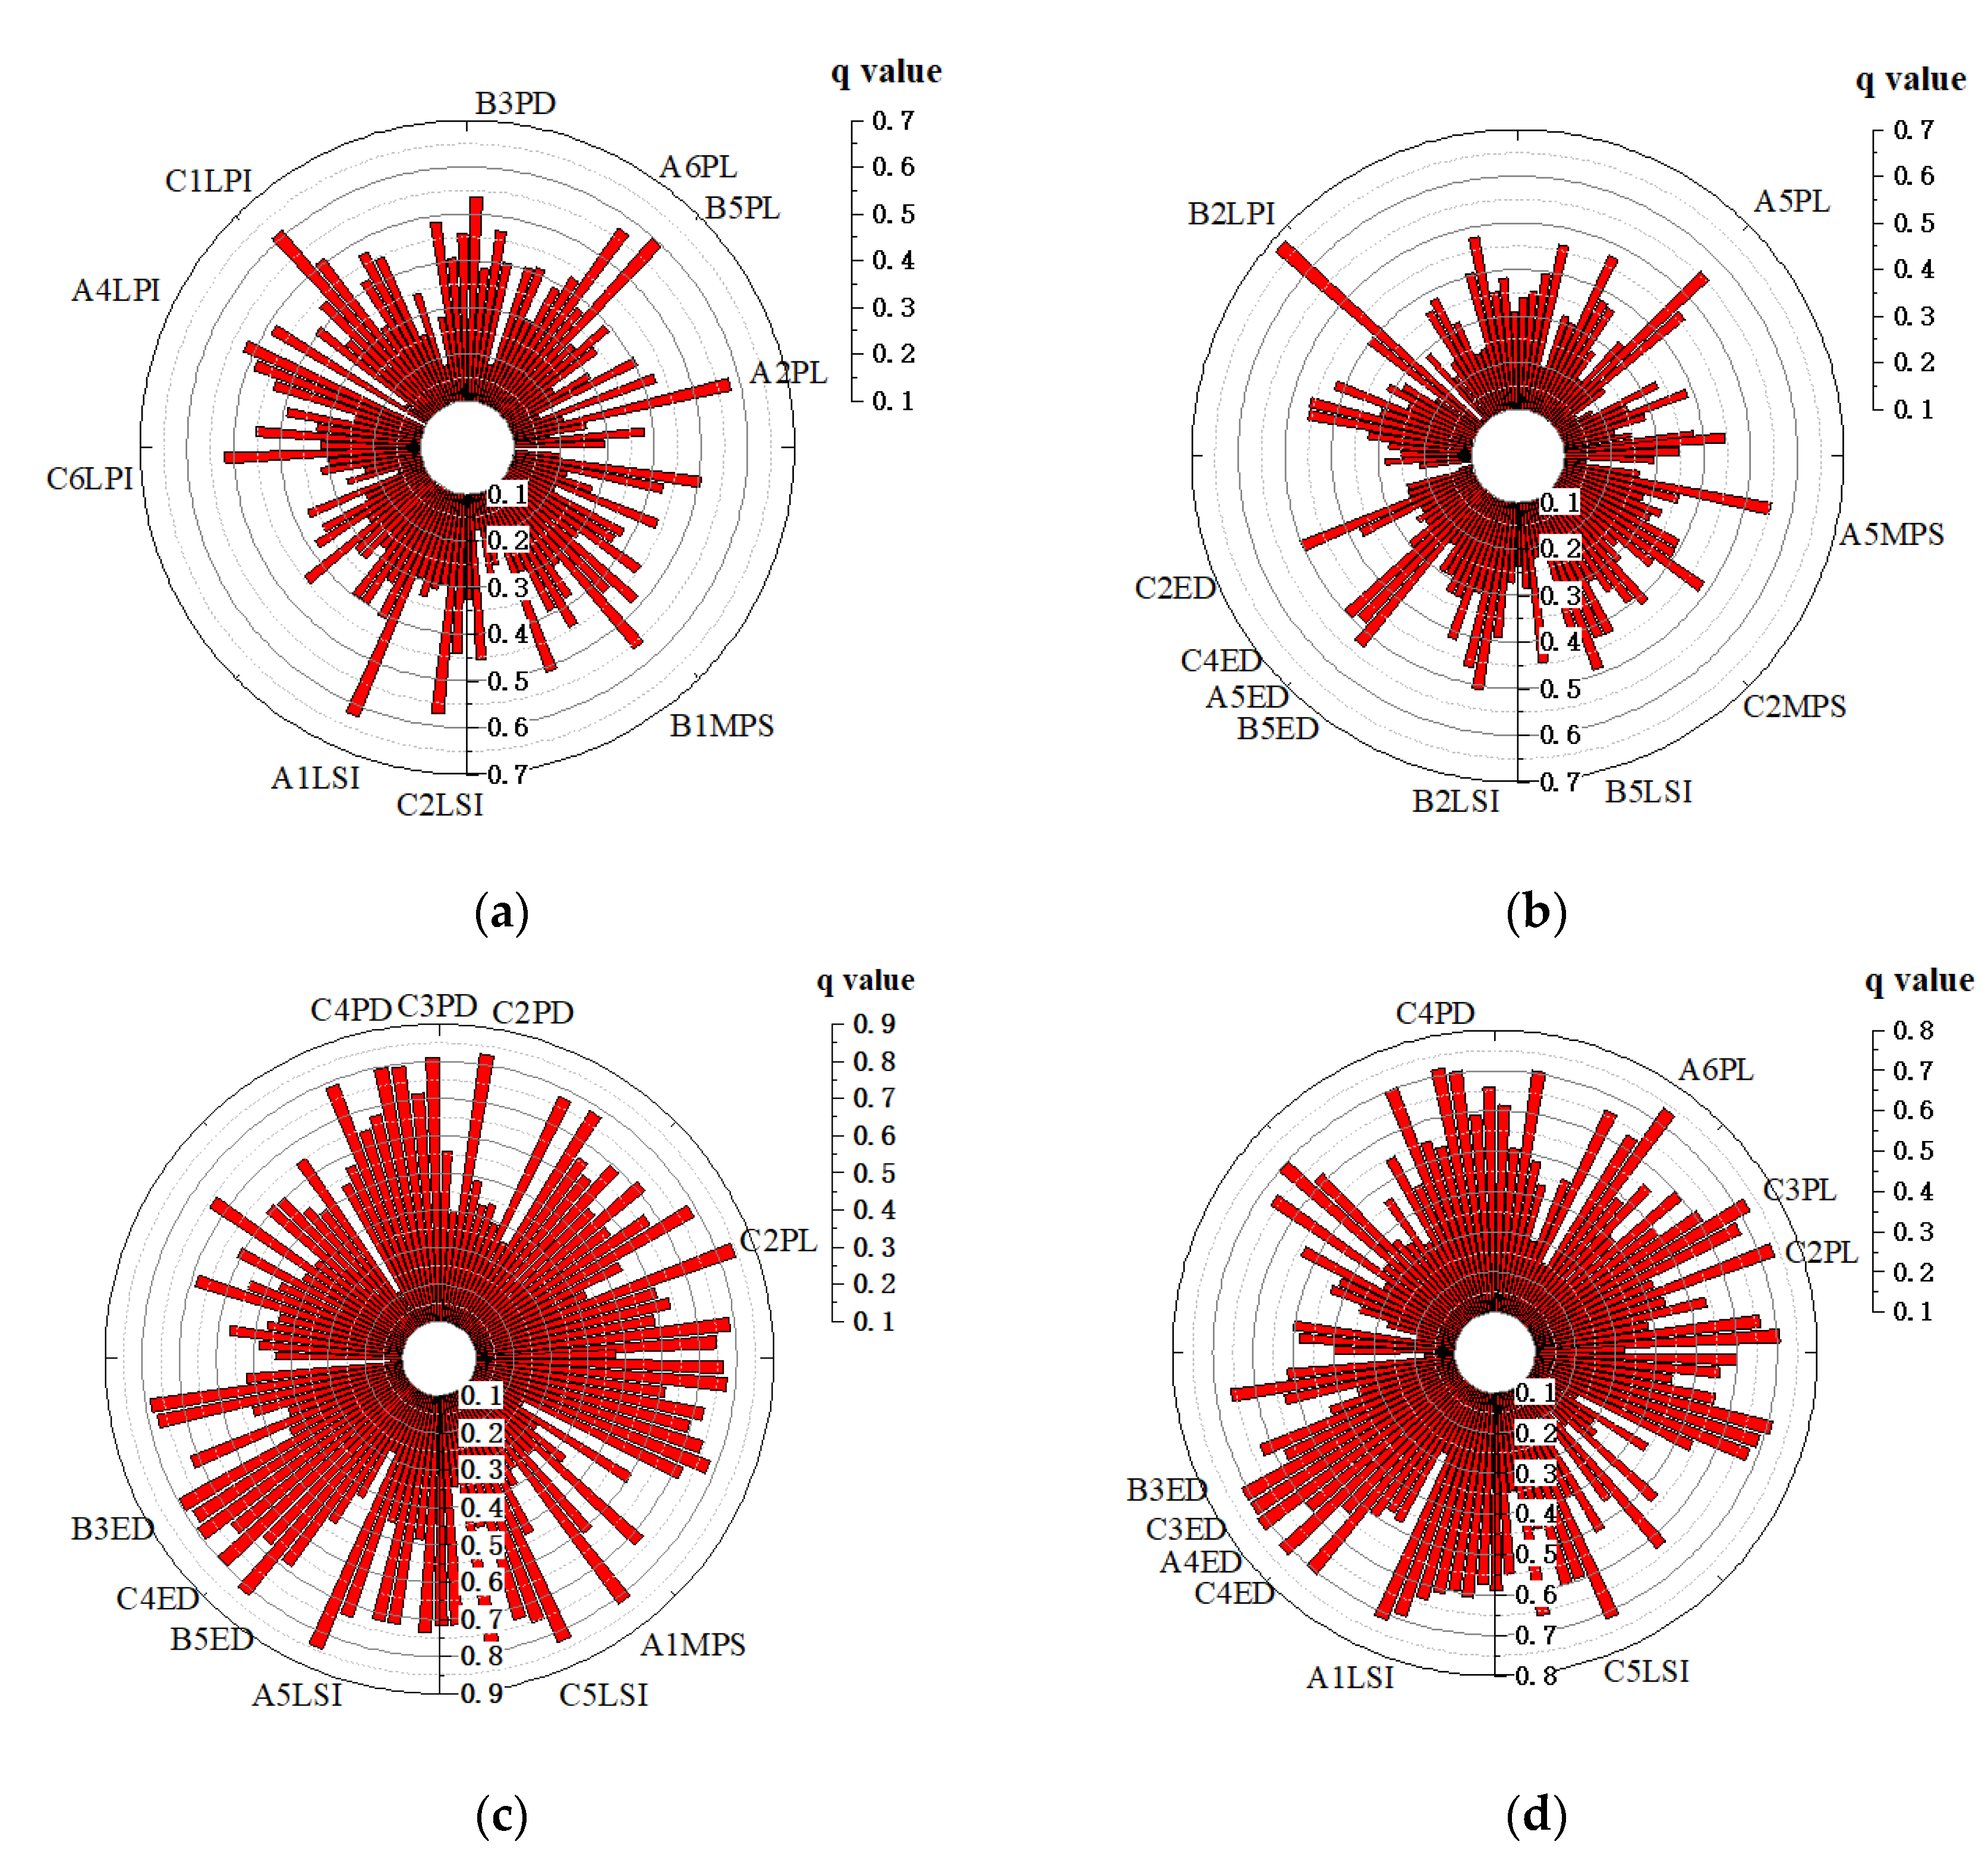
In STR, the PD, ED and LSI index of various slope “source” landscapes are greater than those in LTR, especially the gentle slope dry land and gentle slope irrigation area with small relief accounting for 21.9% and 24.3% of the total. It shows that the landscape fragmentation is more serious in STR, and the risk of water quality deterioration in the watershed is greater than that in LTR. And the results of single factor analysis experiment of landscape pattern index of geographical detector on water quality can be obtained (Figure 6). The gentle slope shrubbery PD (0.49), gentle slope shrubbery ED (0.45), steep slope dry land LSI (0.57) and gentle slope construction land LSI (0.44) have significant negative effects on water quality in the STR in the wet season, while the STR in the dry season is the gentle slope dry land PD (0.46), steep slope dry land ED (0.50) Mild slope shrubbery ED (0.53) and mild slope dry land LSI (0.51). In STR, the higher PD, Ed and LSI of woodland indicated that the degree of fragmentation of woodland landscape was high, and the proportion of woodland area was only 15.7%, which could not effectively alleviate the deterioration of water quality. The degree of landscape fragmentation is high, the “sink” landscape such as forest land is cut into smaller patches, the interception capacity of pollutants output from adjacent “source” patches is reduced, and the risk of water quality deterioration is increased. Therefore, forest land plays an important role in maintaining water quality and providing positive ecological feedback. Improving forest land and increasing its connectivity is an effective means to improve water quality.
In LTR, the LPI and MPS of gentle slope forest land (21.6%) and steep slope forest land (18.8%), which account for the largest proportion, are both high. A large number of connected forests are considered to be able to filter more pollutants to improve water quality [35]. And the results of single factor analysis can be obtained that LTR in the wet season, LPI (0.61) and MPS (0.72) of forest land on the steep slope have a greater impact on water quality. LTR in the dry season, LPI (0.43) of forest land on the gentle slope and MPS (0.54) of forest land on the steep slope. These landscape pattern indicators mean that forest land in LTR can effectively purify water quality.
The factor detection of geographical detectors was used to analyze the explanatory power of slope landscape pattern index to water quality in wet and dry seasons in STR and LTR. As shown in Figure 6, the height of the histogram represents the magnitude of Q explanatory power, and the 108 landscape pattern indexes 360 ° counterclockwise from the positive x-axis successively represent the PL, PD, LPI, ED, LSI and MPS of each slope landscape (A1, B1, C1, A2, B2, C2, A3, B3, C3, A4, B4, C4, A5, B5, C5, A6, B6 and C6).
The difference of the impact of slope landscape pattern index on water quality is not only reflected in the wet season and dry season, but also in STR and LTR. In general, the average explanatory power of slope landscape pattern index to water quality in LTR (0.36 in wet season and 0.33 in dry season) is much higher than that in STR (0.60 in wet season and 0.52 in dry season).
The landscape pattern index with the largest or smallest explanatory power to water quality is different in different topographic relief areas. In wet season of STR, the MPS (0.10) of flat construction land has the least explanatory power to water quality, and the first three landscape pattern indexes are flat paddy field LSI (0.62) > steep slope paddy field LPI (0.61) > gentle slope grassland PL (0.60); In dry season of STR, the gentle slope paddy field ED (0.09) has the least explanatory power for water quality, and the first three are gentle slope dry land LPI (0.68) > flat grassland PL (0.56) > flat grassland MPS (0.55). In wet season of LTR, MPS (0.13) of steep slope construction land has the least explanatory power for water quality, and the first three landscape pattern indexes are steep slope dry land PL (0.84) > flat paddy field LSI (0.84) > steep slope dry land PD (0.83); In dry season of LTR, MPS (0.17) of steep slope construction land also has the least explanatory power for water quality, and the first three are flat land construction land PL (0.74) > steep slope dry land PL (0.73) > steep slope forest land PL (0.72).
In STR, only a few slope land types have landscape pattern indexes with strong water quality explanatory power, such as A1LSI, C1LPI and B5PL in the wet season, and B2LPI, A5PL and A5MPS in the dry season. In LTR, a certain landscape pattern index has a great explanatory power on water quality in all slope fields, such as PL, PD, ED and LSI in both wet and dry seasons.

3.4. Quantitative Analysis of Water Quality Influencing Factors in Different Topographic Relief Areas

This study uses factor detection and interactive detection methods of geographic detectors to distinguish the impact of spatial difference drivers, and further discusses the impact of different factors in STR and LTR on water quality.
The selected factors include the landscape pattern index that has a significant impact on water quality and the factors that have a significant impact on water quality in previous studies, such as temperature, precipitation, population density and GDP per capita.
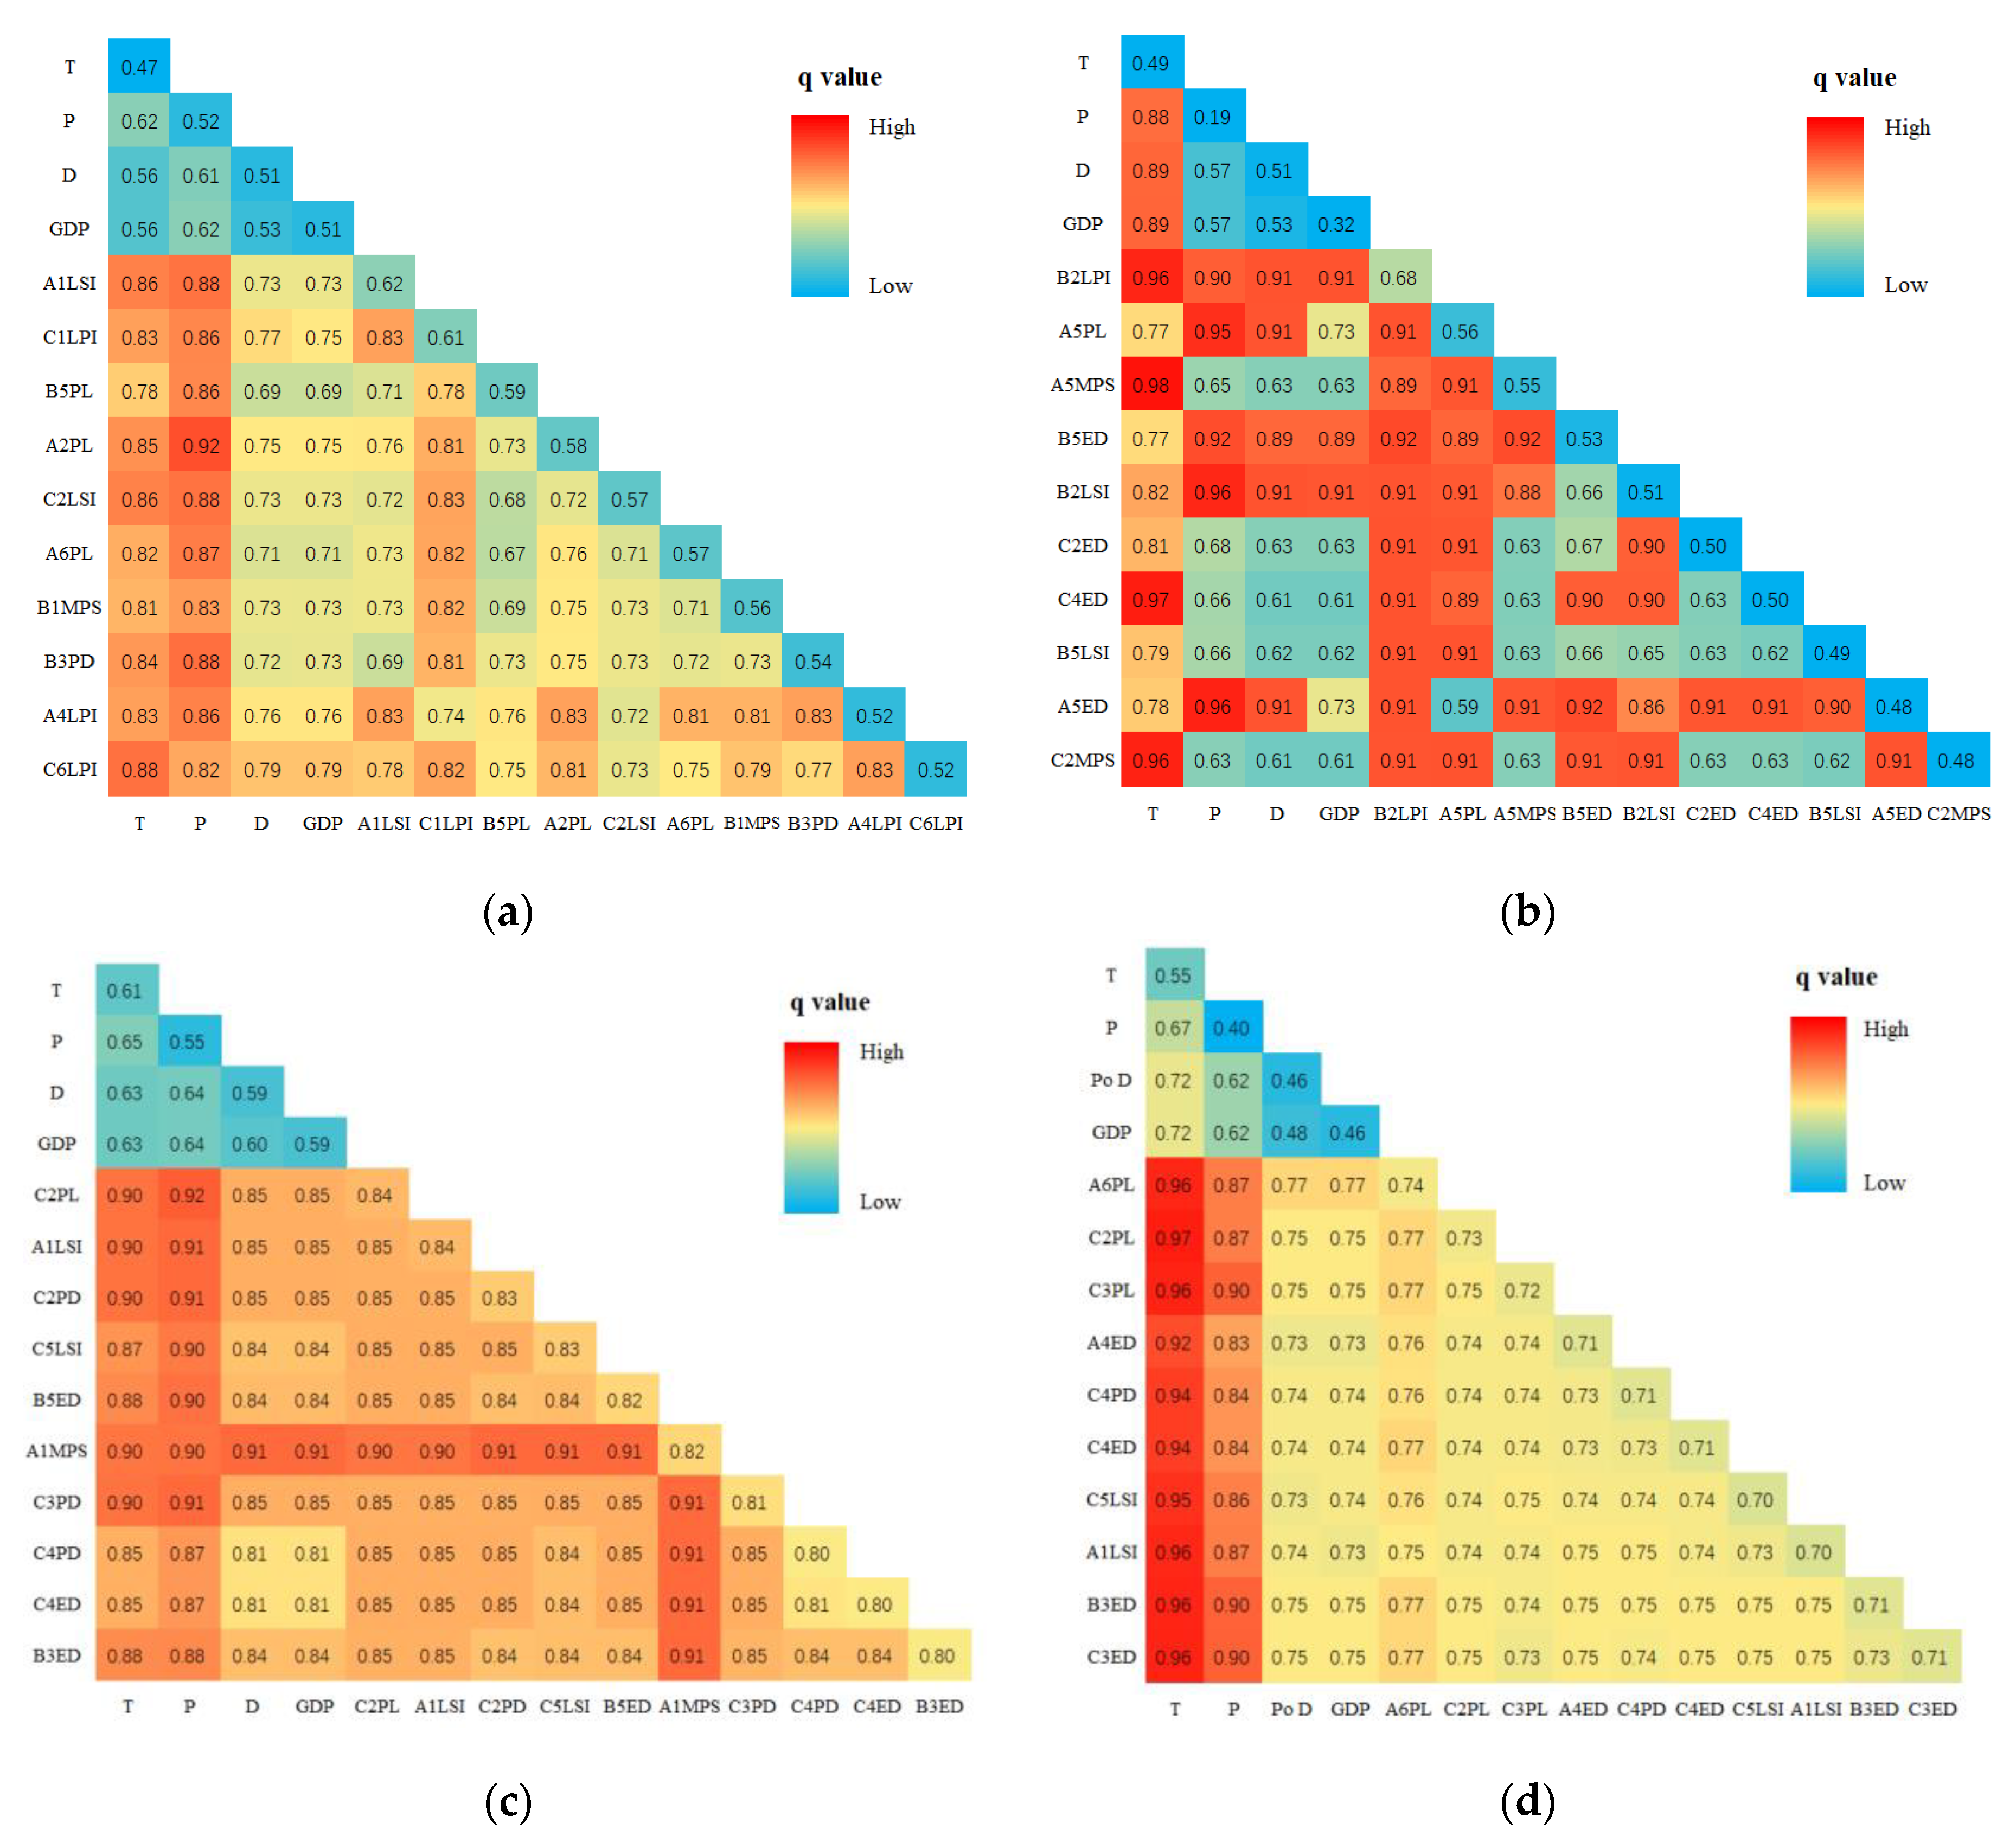
The quantitative analysis results of the explanatory power of individual and interaction of significant factors on water quality are shown in Figure 7. The explanatory power of individual factors on water quality is located at the hypotenuse of the triangle, and the explanatory power of interaction between factors on water quality is located at the intersection of the two in the triangle.
The result of factor detector analysis shows that the explanatory power of significant factors to water quality varies in different regions and seasons. The selected landscape pattern index has higher explanatory power to water quality than temperature, precipitation, population density and GDP per capita. The landscape pattern index factor in LTR has greater explanatory power to water quality than that in STR. In the area of small fluctuation in high water season, the LSI of flat paddy field, LPI of steep slope paddy field and PL of gentle slope grassland have the greatest explanatory power to water quality; In dry season of STR, LPI of gentle slope dry land, PL of flat grassland and MPS of flat grassland have the greatest explanatory power to water quality. In wet season of LTR, the most powerful explanatory factors for water quality are the steep slope dry land PL, the flat paddy field LSI and the steep slope dry land PD; In the area with great fluctuation in dry season, the flat construction land PL, the steep slope dry land PL and the steep slope forest land PL have the greatest impact on water quality.
The explanatory power of air temperature to water quality is greatly affected by the terrain. The explanatory power of air temperature to water quality in LTR (0.61 and 0.55) is higher than that in STR (0.47 and 0.49). However, the explanatory power of precipitation on water quality is more affected by seasons, which is significantly higher in the wet season (0.52 and 0.55) than in the dry season (0.19 and 0.40). This is because the Chishui River Basin is located in the transitional zone between the Yunnan Guizhou Plateau and Sichuan Basin. It is less affected by the ocean monsoon, and generally belongs to the temperate continental climate. The temperature is high in summer, and the rainfall is large. The winter is dry and cold, and the rainfall is small.
The results of the interaction detector experiment show that the interaction between the factors has greater influence on the water quality than that of each factor alone. The interaction results are binary enhancement.

4. Discussion

4.1. Analyze the Impact of Slope Landscape on Water Quality in Different Topographic Relief Areas by Combining Various Relevant Factors

The study found that the water quality in LTR is better than that in STR, because topographic relief is the controlling factor for spatial differentiation of STR and LTR landscape patterns [36]. It affects the material and energy redistribution of the terrestrial ecosystem by changing the site conditions, and affects the landscape pattern by regulating the frequency and intensity of natural processes and human activities, thus affecting the water quality of the basin [35].
In STR, all landscape types exist. Among them, gentle slope dry land (21.9%) and gentle slope shrubbery (24.3%) are the largest landscape types. It is worth mentioning that nine-tenths of the construction land is distributed in STR. This indicates the dominance of the human landscape in STR. Zhang et al. [36] also concluded that flat areas and small topographic relief areas are the conjunctions between natural and anthropogenic landscapes, exhibiting the most profound human-nature conflicting. Based on STR landscape pattern index, it is easy to find that the “source” landscape such as paddy field and dry land has a higher degree of fragmentation. The highest explanatory power for water quality in wet season was the landscape shape index of flat paddy field (A1LSI, 0.62), and largest patch index of gentle sloping dry land (B2LPI, 0.68) in dry season. This indicates that there are many small dryland and paddy fields in this region that need fertilization to change the poor soil. Under the influence of gravity and slope, surface pollutants are more likely to migrate into rivers, which increases the risk of water quality deterioration in the basin [35].
In LTR, compared with LTR, the proportion of landscape types except woodland decreased. Among them, gentle slope forest land (21.6%) and steep slope forest land (18.8%) are the dominant landscape. In this area, natural landscape takes the leading position instead of man-made landscape. And the larger LPI and MPS represent the higher degree of forest landscape aggregation, which is more conducive to achieving water purification. Bian et al. [37] also found that with the increase of elevation, slope and topographic relief in the basin, the dominant human factors turned to natural factors, and the landscape type became single, the landscape diversity decreased, and the degree of fragmentation weakened. In particular, the proportion of steep slope dry land (C2PL, 0.84) with the greatest explanatory power to water quality in wet season and the proportion of flat construction land (A6PL, 0.74) in dry season. In LTR, “source” landscapes such as steep slope dryland (2.6%) and flat construction land (0.1%) make up a relatively small proportion, but their impact on river water quality is amplified by topography. This because in LTR, small “source” landscapes, such as steep slope dry land and flat construction land, have a relatively high degree of aggregation due to the very small patch density (the two values are respectively 0.92 and 0.04) and edge density (the two values are respectively 0.31 and 0.04). Under the action of large slope and large topographic relief, the threat degree to the water quality of the basin increases significantly [35].
It should be pointed out that landscape patterns have different effects on river water quality under different promoting effects of temperature, precipitation, population density and per capita GDP [32,38]. Therefore, the independent use of landscape indices as the factors for evaluating their effects on river water quality is not sufficient. The comprehensive impact of other influencing factors and landscape pattern should be considered (Figure 7), which is consistent with the conclusion of Li et al. [28].
STR in wet season. The interaction of precipitation (P, 0.52) and the proportion of flat dry land (B1PL, 0.58) has the greatest explanatory power for water quality (P∩B1PL, 0.92). It shows that the pollution degree of dry land to water quality in the basin is further deepened under the effect of precipitation.
STR in dry season. When the air temperature (T, 0.49) interacted with the mean patch size of the flat grassland (A5MPS, 0.55), it had the greatest explanatory power for water quality (T∩A5MPS, 0.98). It shows that grassland has a stronger influence on water quality in the basin under the action of temperature. Population density and per capita GDP can represent the concentration of human activities, and human activities have significantly degraded the water quality in the basin. In STR, the interaction between population density/GDP per capita and landscape pattern has significantly increased the impact on the water quality of the basin, which is particularly obvious in the dry season (Figure 7b).
LTR in wet season. The interaction between precipitation (P, 0.55) and the proportion of steep slope dry land area (B3PL, 0.84) has the greatest explanatory power for water quality (P∩B3PL, 0.92). Abundant precipitation has caused serious soil erosion and increased pollutant content. Soil erosion also reflects the state of surface runoff, which brings agricultural pesticides and fertilizers into the river [32]. This makes the interaction between precipitation and other factors have a higher explanatory power to the basin water quality of LTR.
LTR in dry season. The interaction between air temperature (T, 0.55) and the proportion of steep slope dry land (B3PL, 0.73) has the greatest explanatory power for water quality (T∩B3PL, 0.97). In LTR, the interaction between the steep slope dry land and other influencing factors brings huge load to the water quality of the basin. Many scholars have conducted researches on sloping farmland, including soil erosion, effects of tillage measures on nutrient loss, factors affecting cultivated land quality, etc. [39,40], and explore the driving force of slope farmland change [41]. These research results can protect the water quality of LTR.
In different topographic relief areas, landscape pattern under the influence of temperature, precipitation, population density, per capita GDP and other factors on water quality is complex and changeable. However, the reasons for these results are only preliminarily explained in a superficial way in this study, and an in-depth study on this issue was not conducted in this paper. This will be further explored in future research to fully understand the interaction mechanisms between the different factors and how they influence the various hydrological variables through such interaction mechanisms.

4.2. Reasonable Suggestions for Water Quality Protection in Different Terrain Relief Areas

The study shows that there are significant differences in influencing factors of water quality in different topographic relief areas. Therefore, different management strategies should be adopted in different topographic relief areas.
For STR, landscape is the junction between natural landscape and man-made landscape, which is greatly affected by human activities. The focus should be on coordinating the relationship between natural landscape types and man-made landscape types [36]. We will promote land transfer and farmland improvement in the limited dam area, and scientifically and rationally build high standard farmland. We should strengthen land leveling, soil improvement, irrigation, drainage, farmland protection, farmland power transmission and distribution, scientific and technological services, post construction management and protection, and effectively improve the capacity and quality of cultivated land. Reasonably plan the structure and layout of shrubbery and grasslands. At the same time, attention should be paid to increasing the proportion of forests in the water source protection area to prevent buildings or farmland in the water source protection area from occupying the forest land. Ji et al. [42] pointed out that the degree of landscape fragmentation is high, the forest land is cut into smaller patches, the interception capacity of pollutant output of adjacent “source” patches is reduced, and the risk of water quality deterioration is increased. Therefore, forest land plays an important role in maintaining water quality and providing positive ecological feedback. Improving forest land and increasing its connectivity is an effective means to improve water quality.
For LTR, the risk of deterioration of water quality in steep slope farmland under the influence of temperature and precipitation is extremely high. Therefore, it is strictly prohibited to cultivate in places with a slope greater than 25 degrees, and the work of returning farmland to forests should be continued. As an important means of ecological restoration, the project of returning farmland to forest and grassland has a significant impact on land use change in mountainous areas of China, and can effectively control slope farmland with serious water and soil loss and low and unstable yield [43]. At the same time, increase the connectivity of the forest and continuously purify the water quality. Due to the limited human disturbance and good water quality, ecological tourism can be developed. The ecological benefits of moderate mitigation areas should be further expanded and fully utilized [36].

5. Conclusions

This study investigated the effects of landscape patterns on river water quality in the Chishui River Basin in southwest China. Landscape pattern has significant influence on water quality, which is related to different topographic relief and other influencing factors. The main conclusions of the study are as follows:
(1) The Kruskal–Wallis test showed that there were significant differences in water quality in different relief areas, and the Nemerow pollution index method showed that the water quality of LTR was better than that of STR.
(2) The main landscape types are different in different topographic relief areas. In STR, the proportion of “source” landscape composed of gentle slope dry land, gentle slope shrubbery and flat land construction land is the largest, which has a significant negative impact on water quality; In LTR, gentle slope forest land and steep slope forest land are the main landscapes, which can effectively protect water quality.
(3) The landscape pattern in different topographic relief areas has different explanatory power to water quality. In STR, the landscape fragmentation is high and the interpretation of water quality is weak; In LST, the landscape fragmentation is low and the interpretation of water quality is strong.
(4) Under the interaction of temperature, precipitation, population density and GDP per capita, the landscape pattern has further enhanced its interpretation of water quality.
In this study, we discussed the impact of landscape patterns in different topographic relief areas and their interaction with other water quality influencing factors on watershed water quality at the sub-basin. Understanding the influencing factors of water quality in different topographic relief areas can determine more targeted protection measures in different topographic relief areas to achieve the purpose of protecting water quality. However, this study still has some limitations. Due to the difficulty of field sampling, the sample size of water quality data is limited. And there are still many factors affecting water quality (such as the amount of nitrogen and phosphorus fertilizer, land use intensity, etc.) that are not included in the experiment. Subsequent studies can add these factors into a more comprehensive consideration of factors and the impact of their interactions on water quality.

Author Contributions

Methodology, X.Z. and H.C.; software, X.Z.; validation, X.Z. and H.C.; formal analysis, X.Z. and H.T.; investigation, X.Z. and H.C.; resources, H.C.; data curation, H.C.; writing—original draft preparation, X.Z.; writing—review and editing, X.Z. and H.C.; project administration, H.C.; funding acquisition, H.C. All authors have read and agreed to the published version of the manuscript.

Funding

This research was funded by National Natural Science Foundation of China, grant number 41901225.

Institutional Review Board Statement

Not applicable.

Informed Consent Statement

Not applicable.

Data Availability Statement

All the source data used in this study are publicly available and open access.

Conflicts of Interest

The authors declare no conflict of interest.

References

  1. Zhang, H.; Jin, G.; Yu, Y. Review of River Basin Water Resource Management in China. Water 2018, 10, 425. [Google Scholar] [CrossRef] [Green Version]
  2. Carpenter, S.R.; DeFries, R.; Dietz, T.; Mooney, H.A.; Polasky, S.; Reid, W.V.; Scholes, R.J. Ecology. Millennium ecosystem assessment: Research needs. Science 2006, 314, 257–258. [Google Scholar] [CrossRef] [PubMed]
  3. Liu, P.H.; Lue, S.B.; Han, Y.P.; Wang, F.Q.; Tang, L. Comprehensive evaluation on water resources carrying capacity based on water-economy-ecology concept framework and EFAST-cloud model: A case study of Henan Province, China. Ecol. Indic. 2022, 143, 16. [Google Scholar] [CrossRef]
  4. Tang, T.; Stevenson, R.J.; Grace, J.B. The importance of natural versus human factors for ecological conditions of streams and rivers. Sci. Total Environ. 2020, 704, 13. [Google Scholar] [CrossRef]
  5. Yu, H.; Liu, X.M.; Kong, B.; Li, R.P.; Wang, G.X. Landscape ecology development supported by geospatial technologies: A review. Ecol. Inform. 2019, 51, 185–192. [Google Scholar] [CrossRef]
  6. Ren, W.X.; Wu, X.D.; Ge, X.G.; Lin, G.Y.; Feng, L.; Ma, W.Q.; Xu, D. Study on the Water Quality Characteristics of the Baoan Lake Basin in China under Different Land Use and Landscape Pattern Distributions. Int. J. Environ. Res. Public Health 2022, 19, 15. [Google Scholar] [CrossRef]
  7. Shi, P.; Zhang, Y.; Li, Z.B.; Li, P.; Xu, G.C. Influence of land use and land cover patterns on seasonal water quality at multi-spatial scales. Catena 2017, 151, 182–190. [Google Scholar] [CrossRef]
  8. Brogna, D.; Dufrene, M.; Michez, A.; Lath, A.; Jacobs, S.; Vincke, C.; Dendoncker, N. Forest cover correlates with good biological water quality. Insights from a regional study (Wallonia, Belgium). J. Environ. Manag. 2018, 211, 9–21. [Google Scholar] [CrossRef] [Green Version]
  9. Zhang, Z.M.; Du, J.L.; Chen, D.C.; Zhang, F. Effects of land use and landscape pattern characteristics on seasonal surface water quality in typical reticulated river network area—A case study of Liyang City, Jiangsu Province. Lake Sci. 2022, 34, 1524–1540. [Google Scholar]
  10. Wang, X.S.; Li, Q.; Gao, J.F.; Huang, J.C. A preliminary analysis on response of river water quality to land use in Riparian Zone of Changzhou. Resour. Environ. Yangtze Basin 2021, 30, 2915–2924. [Google Scholar]
  11. Fan, Y.S.; Yu, W.Q.; Zhang, Q.; Li, X.; Li, X.Y. Response of water quality to landscape pattern change in the water source area of upper reaches of Lake Taihu: A case study in the upper reaches of Dongtiaoxi River. Lake Sci. 2021, 33, 1478–1489. [Google Scholar]
  12. Rickert, B.; van den Berg, H.; Bekure, K.; Girma, S.; Husman, A.M.D. Including aspects of climate change into water safety planning: Literature review of global experience and case studies from Ethiopian urban supplies. Int. J. Hyg. Environ. Health 2019, 222, 744–755. [Google Scholar] [CrossRef] [PubMed]
  13. McGregor, G.R. Climate and rivers. River Res. Appl. 2019, 35, 1119–1140. [Google Scholar] [CrossRef]
  14. Duan, M.Q.; Zhang, S.L.; Xu, M.X.; He, J.Y.; Li, X.R.; Zhang, J. Response of surface water quality characteristics to socioeconomic factors in Eastern-Central China. PLoS ONE 2022, 17, e0262064. [Google Scholar] [CrossRef] [PubMed]
  15. Liu, J.; Zhenyao, S.Y.; Yan, T.Z.; Yang, Y.C. Source identification and impact of landscape pattern on riverine nitrogen pollution in a typical urbanized watershed, Beijing, China. Sci. Total Environ. 2018, 628, 1296–1307. [Google Scholar] [CrossRef]
  16. Gao, J.B.; Zuo, L.Y.; Liu, W.L. Environmental determinants impacting the spatial heterogeneity of karst ecosystem services in Southwest China. Land Degrad. Dev. 2021, 32, 1718–1731. [Google Scholar] [CrossRef]
  17. Putro, B.; Kjeldsen, T.R.; Hutchins, M.G.; Miller, J. An empirical investigation of climate and land-use effects on water quantity and quality in two urbanising catchments in the southern United Kingdom. Sci. Total Environ. 2016, 548, 164–172. [Google Scholar] [CrossRef] [Green Version]
  18. Shen, Y.; Cao, H.M.; Tang, M.F.; Deng, H.B. The Human Threat to River Ecosystems at the Watershed Scale: An Ecological Security Assessment of the Songhua River Basin, Northeast China. Water 2017, 9, 14. [Google Scholar] [CrossRef] [Green Version]
  19. Suhail, H.A.; Yang, R.; Chen, H.L.; Rao, G. The impact of river capture on the landscape development of the Dadu River drainage basin, eastern Tibetan plateau. Asian Earth Sci. 2020, 198, 11. [Google Scholar] [CrossRef]
  20. Lin, Y.; Li, W.J.; Yu, J.; Wu, C.Z. Ecological Sensitivity Evaluation of Tourist Region Based on Remote Sensing Image—Taking Chaohu Lake Area as a Case Study. Int. Arch. Photogramm. Remote Sens. Spat. Inf. Sci. 2018, XLII-3, 1015–1021. [Google Scholar] [CrossRef] [Green Version]
  21. Estoque, R.C.; Murayama, Y.; Lasco, R.D.; Myint, S.W.; Pulhin, F.B.; Wang, C.Y.; Ooba, M.; Hijioka, Y. Changes in the landscape pattern of the La Mesa Watershed—The last ecological frontier of Metro Manila, Philippines. For. Ecol. Manag. 2018, 430, 280–290. [Google Scholar] [CrossRef]
  22. Zhang, Z.M.; Zinda, J.A.; Yang, Z.J.; Yin, M.; Ou, X.K.; Xu, Q.; Yu, Q.C. Effects of topographic attributes on landscape pattern metrics based on redundancy ordination gradient analysis. Landsc. Ecol. Eng. 2018, 14, 67–77. [Google Scholar] [CrossRef]
  23. de Mello, K.; Valente, R.A.; Randhir, T.O.; dos Santos, A.C.A.; Vettorazzi, C.A. Effects of land use and land cover on water quality of low-order streams in Southeastern Brazil: Watershed versus riparian zone. Catena 2018, 167, 130–138. [Google Scholar] [CrossRef]
  24. Zhang, J.; Li, S.Y.; Dong, R.Z.; Jiang, C.S.; Ni, M.F. Influences of land use metrics at multi-spatial scales on seasonal water quality: A case study of river systems in the Three Gorges Reservoir Area, China. J. Clean Prod. 2019, 206, 76–85. [Google Scholar] [CrossRef]
  25. Xu, S.; Li, S.L.; Zhong, J.; Li, C. Spatial scale effects of the variable relationships between landscape pattern and water quality: Example from an agricultural karst river basin, Southwestern China. Agric. Ecosyst. Environ. 2020, 300, 13. [Google Scholar] [CrossRef]
  26. Gao, B.; Xu, Y.P.; Wang, Q.; Yang, J.; Shen, S.Z.; Xu, X. Effects of land use changes on water quality of the plain area in Taihu basin. J. Agric. Resour. Environ. 2017, 36, 1186–1191. [Google Scholar]
  27. Kang, W.H.; Cai, H.; Lin, G.M.; Wu, Y.F.; Wang, Y.Y. Influences of landscape on river quality under different geomorphological conditions. Acta Ecol. Sin. 2020, 40, 1031–1043. [Google Scholar]
  28. Li, C.W.; Zhang, H.Y.; Hao, Y.H.; Zhang, M. Characterizing the heterogeneous correlations between the landscape patterns and seasonal variations of total nitrogen and total phosphorus in a peri-urban watershed. Environ. Sci. Pollut. Res. 2020, 27, 34067–34077. [Google Scholar] [CrossRef]
  29. Cai, H.; Lin, G.M.; Kang, W.H. The effects of sloping landscape features on water quality in the upper and middle reaches of the Chishui River Watershed. Geogr. Res. 2018, 37, 704–716. [Google Scholar]
  30. Tang, M.; Cai, H.; Yin, J.Y. Spatio-temporal changes of land use on sloping land in the Chishui River Basin based on topographic relief. J. Geomat. 2022, 1–6. [Google Scholar]
  31. Wang, J.F.; Xu, C.D. Geodetector: Principle and prospective. Acta Geogeraphica Sin. 2017, 72, 116–134. [Google Scholar]
  32. Wang, J.X.; Hu, M.G.; Zhang, F.S.; Gao, B.B. Influential factors detection for surface water quality with geographical detectors in China. Stoch. Environ. Res. Risk Assess. 2018, 32, 2633–2645. [Google Scholar] [CrossRef]
  33. Chen, Q.; Mei, K.; Dahlgren, R.A.; Wang, T.; Gong, J.; Zhang, M.H. Impacts of land use and population density on seasonal surface water quality using a modified geographically weighted regression. Sci. Total Environ. 2016, 572, 450–466. [Google Scholar] [CrossRef] [Green Version]
  34. Zhang, L.L.; Liu, R.; Zhang, J.; Xiao, Z.L.; Ji, Q. The inluence of sloping landscape features on riverine water quality in upper Yangte River. Acta Eologica Sin. 2022, 42, 6704–6717. [Google Scholar]
  35. Zhang, B.P.; Yao, Y.H. Implications of mass elevation effect for the altitudinal patterns of global ecology. J. Geogr. Sci. 2016, 26, 871–877. [Google Scholar] [CrossRef] [Green Version]
  36. Zhang, J.J.; Zhu, W.B.; Zhao, F.; Zhu, L.Q.; Li, M.J.; Zhu, M.; Zhang, X.D. Spatial variations of terrain and their impacts on landscape patterns in the transition zone from mountains to plains-A case study of Qihe River Basin in the Taihang Mountains. Sci. China-Earth Sci. 2018, 61, 450–461. [Google Scholar] [CrossRef]
  37. Bian, X.H.; Liu, Y.C.; Chen, M.; Jiao, K.Q.; Liu, Y.; Ding, Q.Q. Characteristics of terrain factors and their effects on landscape pattern in Zhangjiang River, Upper of Ganjiang River. Southwest China J. Agric. Sci. 2020, 33, 1263–1272. [Google Scholar]
  38. Hou, W.J.; Gao, J.B.; Wu, S.H. Quantitative Analysis of the Influencing Factors and Their Interactions in Runoff Generation in a Karst Basin of Southwestern China. Water 2020, 12, 16. [Google Scholar] [CrossRef]
  39. Lei, J.Y.; Lei, X.T.; Zhou, L.N.; He, J.Q.; Jia, A.P.; Yu, J.J.; Zhang, H.; Lu, F. Effects of tillage measures on soil nutrients distribution and fertilizer use efficiency on gentle slope farmland. Trans. Chin. Soc. Agric. Eng. 2020, 36, 127–134. [Google Scholar]
  40. Shi, D.M.; Jiang, N.; Jiang, G.Y.; Yang, J.; Ye, Q.; Zhang, J.L. Influencing factors and sensitivity analysis of cultivated-layer quality of purple soil slope farmland. Trans. Chin. Soc. Agric. Eng. 2020, 36, 135–143. [Google Scholar]
  41. Li, D.H.; Shi, D.M.; Xia, R.; Ni, S.H.; Zhang, J.L.; Wang, R.H. Evolution characteristics and driving mechanism for the spatiotemporal pattern of sloping farmland in Chongqing based on geodetector. Trans. Chin. Soc. Agric. Eng. 2022, 38, 280–290. [Google Scholar]
  42. Ji, D.Q.; Wen, Y.; Wei, J.B.; Wu, Z.F.; Lu, Q.; Cheng, J. Relationships between landscape spatial characteristics and surface water quality in the Lin Xi River watershed. Acta Ecol. Sin. 2015, 35, 246–253. [Google Scholar]
  43. Yang, W.S.; Dai, E.F.; Zheng, D.; Dong, Y.X.; Yin, L.; Ma, L.; Wang, J.X.; Pan, L.H.; Qin, S.P. Spatial simulation of “Grain to Green Program” implementation in a typical region based on agent-based model. Acta Geogr. Sin. 2020, 75, 1983–1995. [Google Scholar]
Figure 1. Introduction of the study area: (a) In China, (b) Geographic location and elevation of Chishui River Basin.
Sustainability 15 01476 g001
Figure 2. Types of land use and location of sampling points.
Sustainability 15 01476 g002
Figure 3. Area ratio of the different land-use types in STR and LTR. (ABC stand for slope grade, 1–6 stand for paddy field, dry land, forest land, shrubbery, grassland and construction land. For example, A1 refers to flat paddy field).
Sustainability 15 01476 g003
Figure 4. Areas with small topographic relief (STR) and areas with large topographic relief (LTR).
Sustainability 15 01476 g004
Figure 5. Correlation analysis between landscape composition and water quality index: (a) In STR; (b) In LTR (Red and blue correspond to the negative and positive correlation, respectively. Light color represents lower correlations while darker color represents higher correlations. * represents p < 0.05; ** represents p < 0.01. flat paddy field (A1), gentle slope paddy field (B1), steep slope paddy field (C1), flat dry land (A2), gentle slope dry land (B2), steep slope dry land (C2), flat forest land (A3), gentle slope forest land (B3), steep slope forest land (C3), flat shrubbery (A4), gentle slope shrubbery (B4), steep slope shrubbery (C4), flat grassland (A5), gentle slope grassland (B5), steep slope grassland (C5) Flat construction land (A6), gentle slope construction land (B6) and steep slope construction land (C6)).
Sustainability 15 01476 g005
Figure 6. q statistic of landscape pattern index to water quality evaluation index: (a) STR in wet season; (b) STR in dry season (c) LTR in wet season; (d) LTR in dry season. “A” stands for flat land, “B” stands for gentle slope, and “C” stands for steep slope; 1–6 stand for paddy field, dry land, forest land, shrubbery, grassland and construction land. For example, A1LSI refers to LSI of flat paddy field.
Sustainability 15 01476 g006
Figure 7. Explanatory power of significant factors alone and their interaction on water quality: (a) STR in wet season; (b) STR in dry season (c) LTR in wet season; (d) LTR in dry season. T, P, D and GDP respectively represent average temperature, average precipitation, population density and GDP per capita.
Sustainability 15 01476 g007
Table 1. Grading standard of slope.
CodeClassificationSlope /(°)Division Basis
Aflat land0~6there is no water and soil loss or slight soil erosion can occur
Bgentle slope land6~25Moderate to severe water and soil loss, and the soil erosion area increases with the increase of slope
Csteep slope land>25Reaching the critical slope of soil erosion, the reclamation of slope land is not strictly prohibited above 25 °
Table 2. The functions and roles of major indices describing landscape patterns.
IndexFormulaDescription
Percentage of land use (PL)PL = Ai/AArea percentage of land use for the corresponding land use type.
Patch density (PD)PD = ni/ANumber of patches per unit area of the corresponding land use type.
Largest patch index (LPI)LPI = amax/A*100Quantifies the percentage of total landscape area comprised by the largest patch at the class level.
Edge density (ED)ED = E/AReflects the degree of landscape fragmentation.
Landscape shape index (LSI)LSI = E/√AReflects the complexity of landscape patch shapes and provides a measure of class aggregation.
Mean Patch Size (MPS) MPS = Ai/niCalculate the horizontal patch area of the category, and the result is inversely proportional to the fragmentation degree of such landscape.
* A represents total landscape area (m2), Ai represents area (m2) of patch i, ni represents number of patches in the landscape of patch type (class) i. amax represents the maximum area (m2) of patch i, E represents total length (m) of edge in landscape.
Table 3. Topographic features of 28 sub-basins.
Sub-BasinMean Elevation (m)SD of Elevation (m)Mean RDLS (m)SD of RDLS (m)Regions
1151015612148areas with small topographic relief (SRA)
215851479140
3134814913349
4154920110352
514901758545
6131219112454
7119719411550
895018512247
999319611954
1010301979956
1195822210643
12107824613256
1311581938841
1499122011144
1595729011856
16109125715155
175041639253
18119919911560areas with large topographic relief (LRA)
19138030312061
20126527014166
21110938917274
2288729315472
23114427317668
24102127120774
25100124313962
2663125512361
274031497061
2897634214282
SD represents the standard deviation, RDLS represents Relief Degree of Land Surface.
Table 4. Definition of interaction between two factors.
DescriptionInteraction
q(X1∩X2) < Min(q(X1), q(X2))Weaken, nonlinear
Min(q(X1), q(X2)) < q(X1∩X2) < Max(q(X1), q(X2))Weaken, univariate
q(X1∩X2) > Max(q(X1), q(X2))Enhance, bivariate
q(X1∩X2) = q(X1) + q(X2)Independent
q(X1∩X2) > q(X1) + q(X2)Enhance, nonlinear
Table 5. Descriptive statistics of water quality characteristics.
TimeWater Physic-Chemical ParametersSTRLTRStandard IIIKruskal–Wallis
MinMaxMeanS.D.MinMaxMeanS.D.Hp-Value
Wet seasonWT (°C)16.70 27.50 21.49 2.63 20.40 24.10 21.28 1.32 -2.350.126
pH7.40 8.38 7.97 0.31 7.42 8.30 7.90 0.29 -0.220.638
EC (μs/cm)100 560 439 107 110 480 281 139 -7.990.005 **
TP (mg/L)0.01 0.87 0.07 0.21 0.01 0.04 0.01 0.01 ≤0.23.850.050 **
TN (mg/L)0.01 4.93 2.42 1.64 0.96 3.77 1.87 0.87 ≤1.05.150.023 **
Ip0.164.952.351.200.762.981.500.66
Dry seasonWT (°C)8.00 12.80 10.65 1.43 9.00 11.50 10.15 0.85-1.030.311
pH7.81 8.43 8.10 0.16 7.66 8.47 8.05 0.29 -0.140.706
EC (μs/cm)87 1115 503 213 98 485 294 146 -7.4460.006 **
TP (mg/L)0.03 0.26 0.07 0.06 0.02 0.08 0.05 0.02 ≤0.20.6410.670
TN (mg/L)1.44 10.45 4.04 2.01 1.55 4.08 2.27 0.85 ≤1.07.0640.008 **
Ip1.178.472.81.391.003.251.650.60
Electrical conductivity (EC), Total phosphorus (TP), Total nitrogen (TN), S.D. represents the standard deviation, Nemerow Pollution Index (Ip). ** represents p < 0.01.
Table 6. Landscape pattern index statistics based on source sink landscape.
RegionsSlopeLand Use TypeLandscape Indicators (Source-Sink Landscape)
PLPDLPIEDLSIMPS
STR0–6 (A)Dry land3.70 3.16 0.45 16.21 42.72 1.20
Shrubbery2.86 3.52 0.42 15.31 46.74 0.77
Construction land0.60 0.14 0.32 1.41 7.75 3.42
Forest land0.951.410.265.3925.000.69
6–25 (B)Dry land21.93 1.52 2.77 41.82 45.55 15.87
Shrubbery24.27 1.15 4.68 43.97 46.94 21.98
Construction land0.83 0.14 0.16 2.03 9.13 5.89
Forest land9.380.543.0417.2826.7417.73
>25 (C)Dry land3.67 1.49 0.32 11.73 31.45 2.44
Shrubbery7.10 1.59 0.57 18.31 35.58 4.50
Construction land0.03 0.03 0.01 0.14 3.27 0.79
Forest land4.330.580.519.1220.306.14
LTR0–6 (A)Dry land2.86 1.83 0.56 11.54 30.13 1.25
Shrubbery1.57 1.96 0.35 8.19 28.66 0.83
Construction land0.11 0.04 0.04 0.31 3.95 2.08
Forest land1.783.081.5110.5129.710.58
6–25 (B)Dry land12.50 1.33 1.42 26.57 33.75 8.81
Shrubbery12.59 0.89 1.84 25.58 31.24 13.68
Construction land0.11 0.04 0.03 0.30 4.27 4.35
Forest land21.581.275.4241.4434.5619.58
>25 ©Dry land2.65 0.92 0.31 8.11 22.71 3.22
Shrubbery5.07 0.89 0.75 11.98 22.42 3.88
Construction land0.01 0.01 0.01 0.02 1.02 0.54
Forest land18.80.913.9628.6024.2915.87
Disclaimer/Publisher’s Note: The statements, opinions and data contained in all publications are solely those of the individual author(s) and contributor(s) and not of MDPI and/or the editor(s). MDPI and/or the editor(s) disclaim responsibility for any injury to people or property resulting from any ideas, methods, instructions or products referred to in the content.