Article

Development and Application of EST-SSR Markers Related to Lead Stress Responses in Kenaf Based on Transcriptome Sequencing Data

Zhejiang Xiaoshan Institute of Cotton & Bast Fiber Crops, Zhejiang Institute of Landscape Plants and Flowers, Zhejiang Academy of Agricultural Sciences, Hangzhou 311251, China
*
Author to whom correspondence should be addressed.
Sustainability 2023, 15(2), 1514; https://doi.org/10.3390/su15021514
Submission received: 24 November 2022 / Revised: 26 December 2022 / Accepted: 6 January 2023 / Published: 12 January 2023
(This article belongs to the Special Issue Plant Cultivation on Polluted Soil)

Abstract

:
Kenaf is an important bast fiber crop. In order to diversify the available kenaf simple sequence repeat (SSR) molecular markers and generate markers potentially useful for kenaf breeding, we developed expression sequence tag simple sequence repeat (EST-SSR) molecular markers based on lead-stressed kenaf transcriptome sequencing data and spliced unigene sequences. Additionally, the distribution of the SSRs in the transcriptome and the potential functions of the SSR-containing genes were determined. Moreover, SSR markers in the differentially expressed genes (DEGs) of a protein–protein interaction (PPI) network were analyzed to screen for polymorphic markers, which were used to examine the genetic diversity and population structure of kenaf germplasm resources. The genetic diversity and population structure of 138 kenaf germplasm materials revealed that 22 EST-SSR markers could be used to distinguish the kenaf germplasms. The 22 EST-SSR markers enrich the kenaf molecular markers database and provide an important tool for future genetic improvement of kenaf resistance to lead stress.

1. Introduction

Kenaf (Hibiscus cannabinus L.) is an important bast fiber plant that is used as the raw material for hemp spinning and producing environmentally friendly natural fiber products [1]. Kenaf can accumulate heavy metals from the soil [2], making it important for the recovery of acidic soils contaminated with heavy metals [3]. Identifying lead-stress-responsive kenaf genes and developing molecular markers for these functional genes can accelerate the screening of heavy-metal-resistant kenaf materials and decrease the workload and time required for selecting suitable parents for breeding.
Simple sequence polymorphism (SSR) is one of the third generation markers after morphological markers and isoenzyme markers. SSR and SNP markers are the two most mainstream molecular marker technologies at present. Different from SNP markers’ second-class sites, which are easy to automate with high-throughput analysis, SSR markers are co-dominant markers like SNP, but their polymorphism is much higher than SNP. It is widely used in the fields of genetic diversity evaluation, population structure analysis, genetic relationship identification, and fingerprinting [4].
At present, the research and application of kenaf molecular markers have been carried out, which are mainly applied in the study of genetic diversity, the construction of genetic linkage map, and the mapping of QTLS for important agronomic traits. The molecular markers used include SRAP, RAPD, AFLP, ISSR, and SSR [5,6]. In general, the number of kenaf molecular markers is still very small; the current mainstream molecular marker technologies, SNP and SSR molecular markers, especially, are much behind compared with other crops. There is an urgent need to develop new molecular markers especially SSR and SNP for kenaf molecular breeding and accelerate the process of kenaf genetic improvement.
Kenaf molecular markers have been studied and applied [7]. The applied molecular markers are associated with random amplified polymorphism marker (RAPD) [8], single nucleotide polymorphism (SNP) [9], and simple sequence repeat (SSR) [10]. However, there are still relatively few molecular markers for kenaf, and the application of SSR molecular markers is currently much more extensive in flax [11,12], ramie [13], and okra [14]. The development of new molecular markers, especially SSR, will enhance the genetic improvement of kenaf. If a gene with such a marker controls important agronomic traits, the SSR sequence variation in the exon region may lead to a loss-of-function mutation that alters particular traits. Accordingly, the use of expression sequence tag simple sequence repeat (EST-SSR) markers may accelerate quantitative trait locus (QTL) mapping and the identification of candidate genes.
During the transcriptome-based development of molecular markers, the sampling methods used for specific experiments, including analyses of different biotic and abiotic stress responses, different growth and developmental stages, and different tissues and organs, will affect gene expression, which will further influence the identification of differentially expressed genes (DEGs). Using transcriptome sequencing technology to develop EST-SSR markers is still an effective way to rapidly increase the number of kenaf molecular markers. The number of molecular markers available for kenaf genetic breeding is still much lower than that of other crops. In order to further enrich the number of kenaf molecular markers, we used the reported unigene sequences derived from kenaf lead-stressed transcriptome sequencing data [3] to analyze the SSR features at the genome level and to clarify the potential functions of the unigenes containing SSR motifs.

2. Materials and Methods

2.1. Materials and SSR Marker Development

Kenaf cultivar H368 was obtained from Professor Defang Li (Institute of Bast Fiber Crops, Chinese Academy of Agricultural Sciences). When the plants grew to a height of nine cm, they were treated with a lead concentration of 4000 mg/kg (Pb(NO3)2 treatment solution).We re-applied 4000 mg/kg of Pb(NO3)2 in each pot at one time according to the matrix. The application method was to dissolve Pb(NO3)2 in 1000 mL ddH2O and then pour it into the potted soil. Control plants were treated with the same solution without Pb(NO3)2.The materials used for the transcriptome sequencing analysis were described in a recently published article [3]. The transcriptome data are available in the NCBI SRA (SRR9163842 to SRR9163845). The kenaf germplasm resources used in this study and their geographical sources are listed in Supplementary Table S1. Transcripts were de novo assembled using the default parameters of Trinity and then further clustered into unigenes using the Corset software [15]. SSR marker development was described in a recently published article [16]. The assembled unigenes were imported into the MISA software for the SSR analysis. The type and frequency distribution of the SSR motifs were recorded. The repetitive motifs of SSRs were analyzed according to the following criteria: number of repeating mononucleotides ≥ 10; number of repeating dinucleotides ≥ 6; and number of repeating trinucleotides, tetranucleotides, pentanucleotides, and hexanucleotides ≥ 5. Specific SSR primers were designed on the basis of the unigene sequences using Primer3. The technical route of this study was shown in Figure 1.

2.2. PCR Reaction System, Conditions, and Data Analysis

According to the primer sequence, fluorescent SSR primers were synthesized and FAM fluorescent groups were added to the 5 end of the primer. DNA Polymerase uses the Takara DNA polymerase (TransGen Phi29 DNA Polymerase, article number LP101-01). The total volume of PCR system was 20 μL, DNA template 2 μL, Buffer 2 μL, TransTaq 0.3 μL, dNTP 1.6 μL, ddH2O 12.1 μL, and positive and negative primers 1 μL each (concentration 2 μmol/μL). The PCR amplification program was set as predenaturation 94 °C 4 min, denaturation 94 °C 30 s→ annealing 56 °C 90 s→ extension 72 °C 1 min. These three stages were repeated 35 times, extension 72 °C 5 min, and preservation at 4 °C. After PCR amplification, 1 μL PCR product was taken and electrophoresis was carried out on ABI3730xl capillary electrophoresis apparatus. After electrophoresis, GeneMapper4.0 software was used to read and SSR genotyping information was derived.

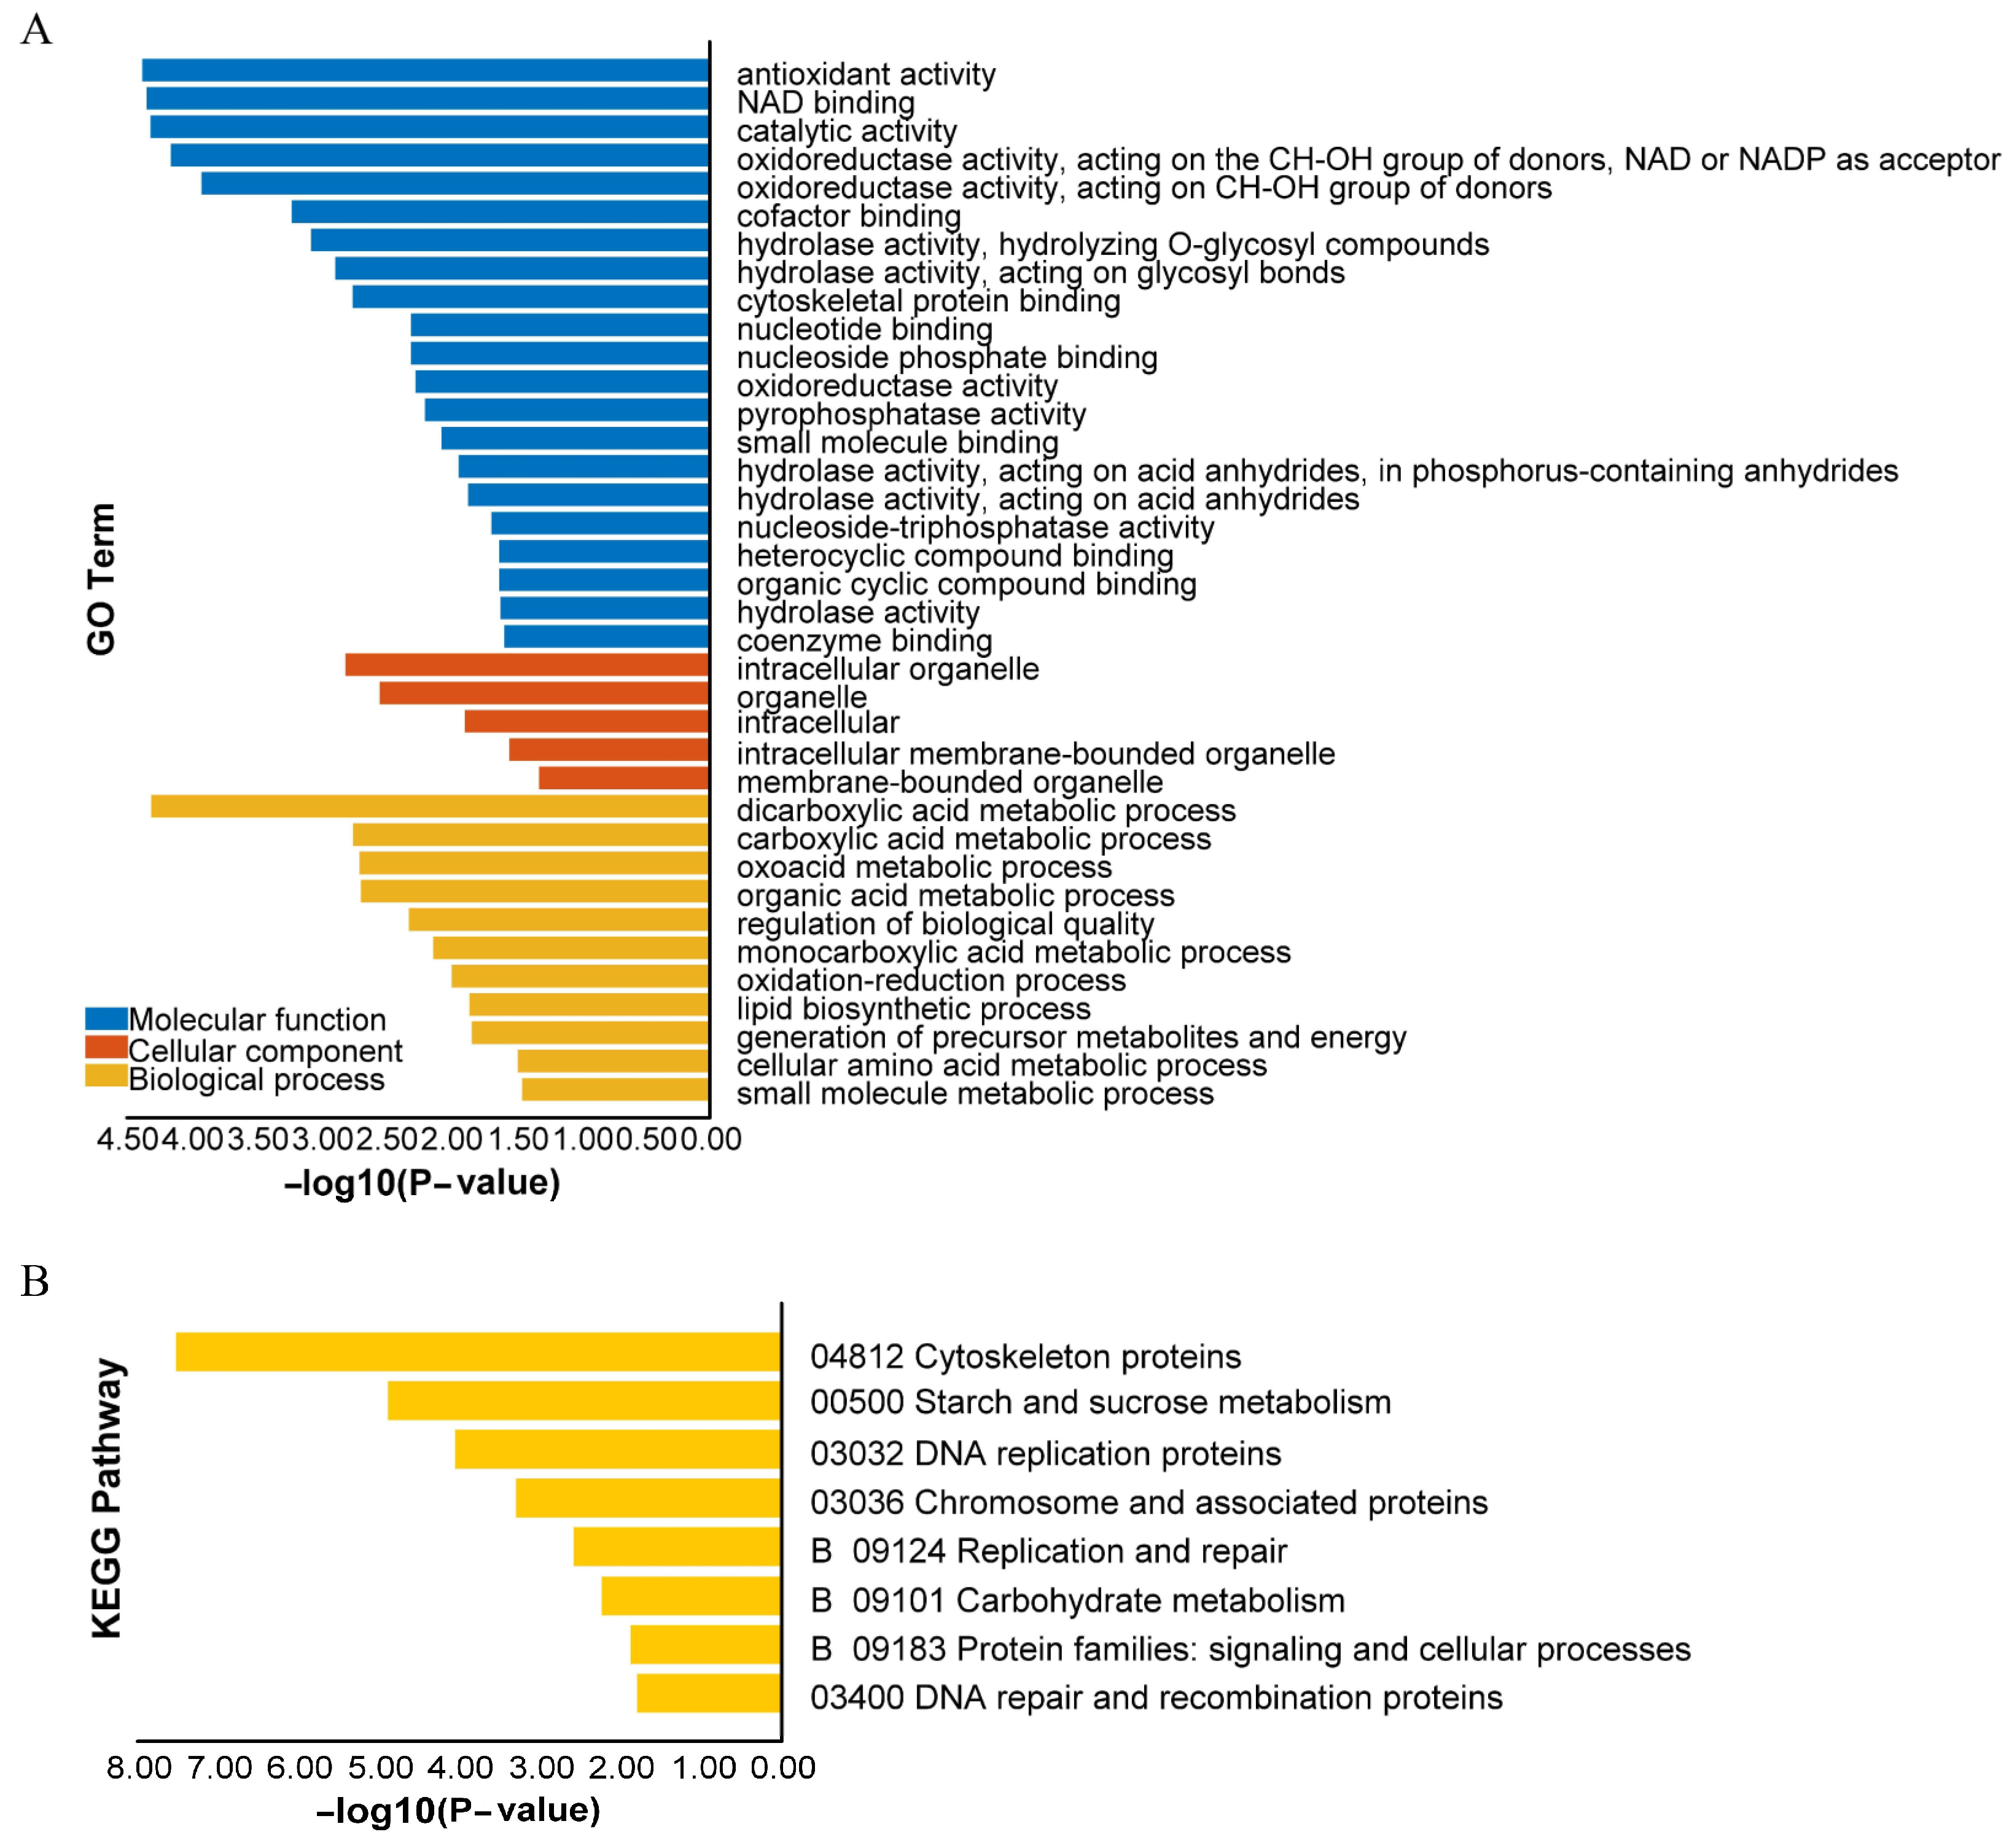
2.3. GO and KEGG Enrichment Analyses

The Enrichment function of TBTools software [17] was used for GO (level3) [18] and KEGG [19] enrichment analyses of the SSR-containing unigenes and SSR-containing DEGs [20] in the protein–protein interaction (PPI) network. It could help to identify and analyze the common genes of unigenes and PPI as well as the involved main biological processes, molecular functions, cell components, and metabolic pathways.

2.4. Analysis of the DEGs in the PPI Network

STRING (https://string-db.org/, accessed on 1 March 2018) was used to analyze the PPI networks containing DEGs, whereas the Cytoscape software [21] was used to visualize and edit the PPI networks.

2.5. Genetic Diversity and Structure Analysis

The SSR genotyping data were converted according to the requirements of each software format. The PowerMarker 3.25 software [22] was used to calculate the polymorphism information content (PIC) value for each locus. The NTSYSPC 2.10e software was used to calculate the Jaccard genetic similarity coefficient between sample pairs and for compiling the genetic similarity coefficient matrix [23].
Nei’s (1983) genetic distance based on the allele frequency was calculated using the PowerMarker 3.25 software. Moreover, a phylogenetic tree was constructed using the neighbor-joining method of the MEGA7.0 program. The SSR genotyping data were imported into the Structure 2.0 software and then analyzed. Specifically, K was set from 1 to 20 and the Markov Chain Monte Carlo method was completed with 10,000 iterations and a burn-in of 100,000 samples. Each K value was run three times. The Structure results were analyzed using the Structure Harvester online tool [24]. The ΔK value curve for the K values was drawn, and the best K value was determined based on the peak value. The indfile corresponding to the best K value for the three runs was downloaded and imported into the Clumpp 2.0 software. The three results were merged into a Q-value matrix [25], after which the Q plot was drawn using Structure 2.0. The genetic structure of the population was analyzed by comparing the neighbor-joining clustering model with the Structure analysis model.

3. Results and Discussion

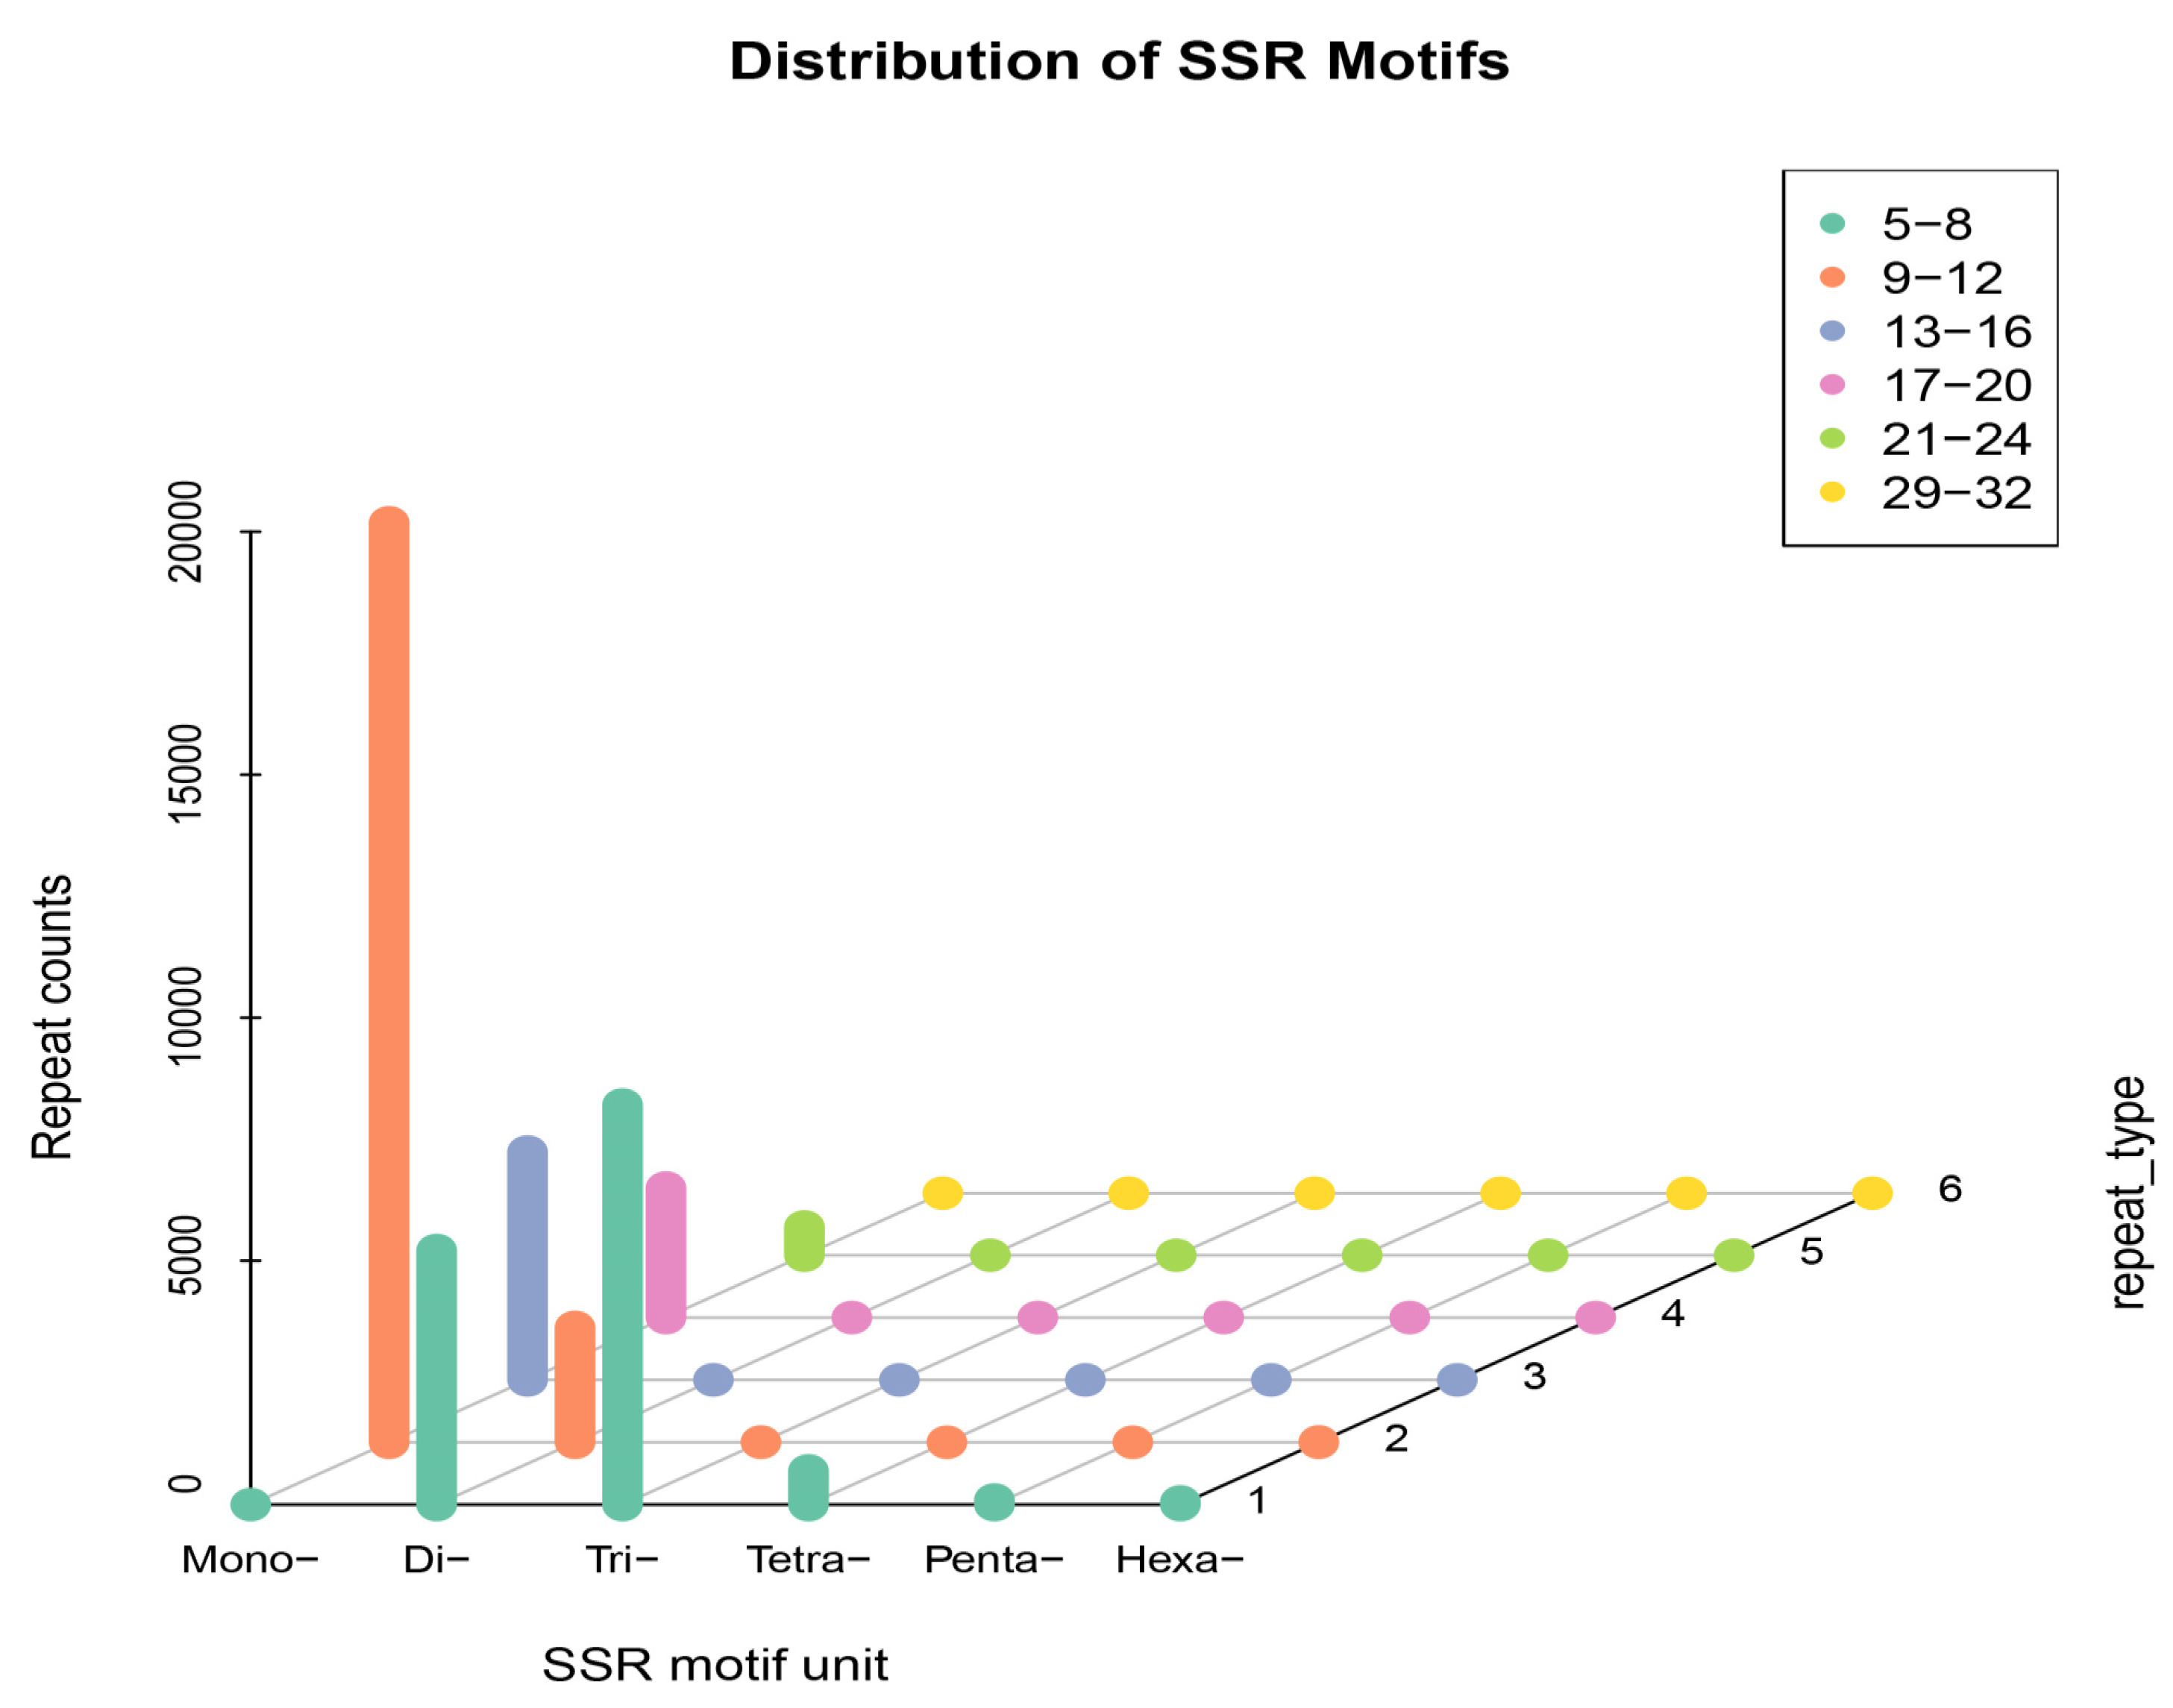
3.1. Analysis of SSR Characteristics

Based on the transcriptome sequencing data, we obtained 136,854 spliced unigenes comprising 151,754,502 bp. The results of the SSRs in the unigene sequences using MISA are presented in Table 1. A total of 43,457 SSRs were detected in all the unigenes. They were distributed in 34,180 sequences, accounting for 24.98% of all the unigenes. There was an average of 1.23 SSRs per sequence. Additionally, 7421 sequences had more than one SSR and 2321 SSRs were present in a compound formation. Of the unigenes containing SSRs, 749 genes were DEGs significantly responsive to lead stress, including 259 up-regulated genes and 454 down-regulated genes. EST-SSR can directly reflect the diversity of related genes and has good universality. In recent years, with the development of high-throughput transcriptome sequencing technology, EST-SSR marker has been widely studied in many crops [26,27,28,29]. The differentially expressed genes found in our study were significantly more than the differentially expressed genes found in okra [16].
Among the identified SSR motifs, the mononucleotide motifs were the most common, followed by the trinucleotide motifs and dinucleotide motifs (Figure 2). This result is consistent with earlier reports of okra research [16]. Regarding these SSR motifs, a total of 26,949 unigene primers (three primer pairs for each SSR locus) were generated to produce a marker library for screening polymorphic EST-SSR markers (Supplementary Table S2).
The SSR-containing unigenes were functionally characterized via GO and KEGG enrichment analyses (Supplementary Figures S1 and S2). The enriched molecular function GO terms of these unigenes included zinc ion binding, transcription regulator activity, and DNA-binding transcription factor activity. The enriched cellular component GO terms were mainly whole membrane, membrane-bounded organelle, and protein-containing complex. The main biological process GO terms were nucleobase-containing compound biosynthetic process, which regulated nitrogen compound metabolic process and gene expression. The main enriched KEGG pathways of the SSR-containing unigenes were folate biosynthesis (00790), transcription factors (03000), and photosynthesis proteins (00194). DNA-binding transcription factor activity and transcription factors (03000) were also reported in Abelmoschus esculentus [16].

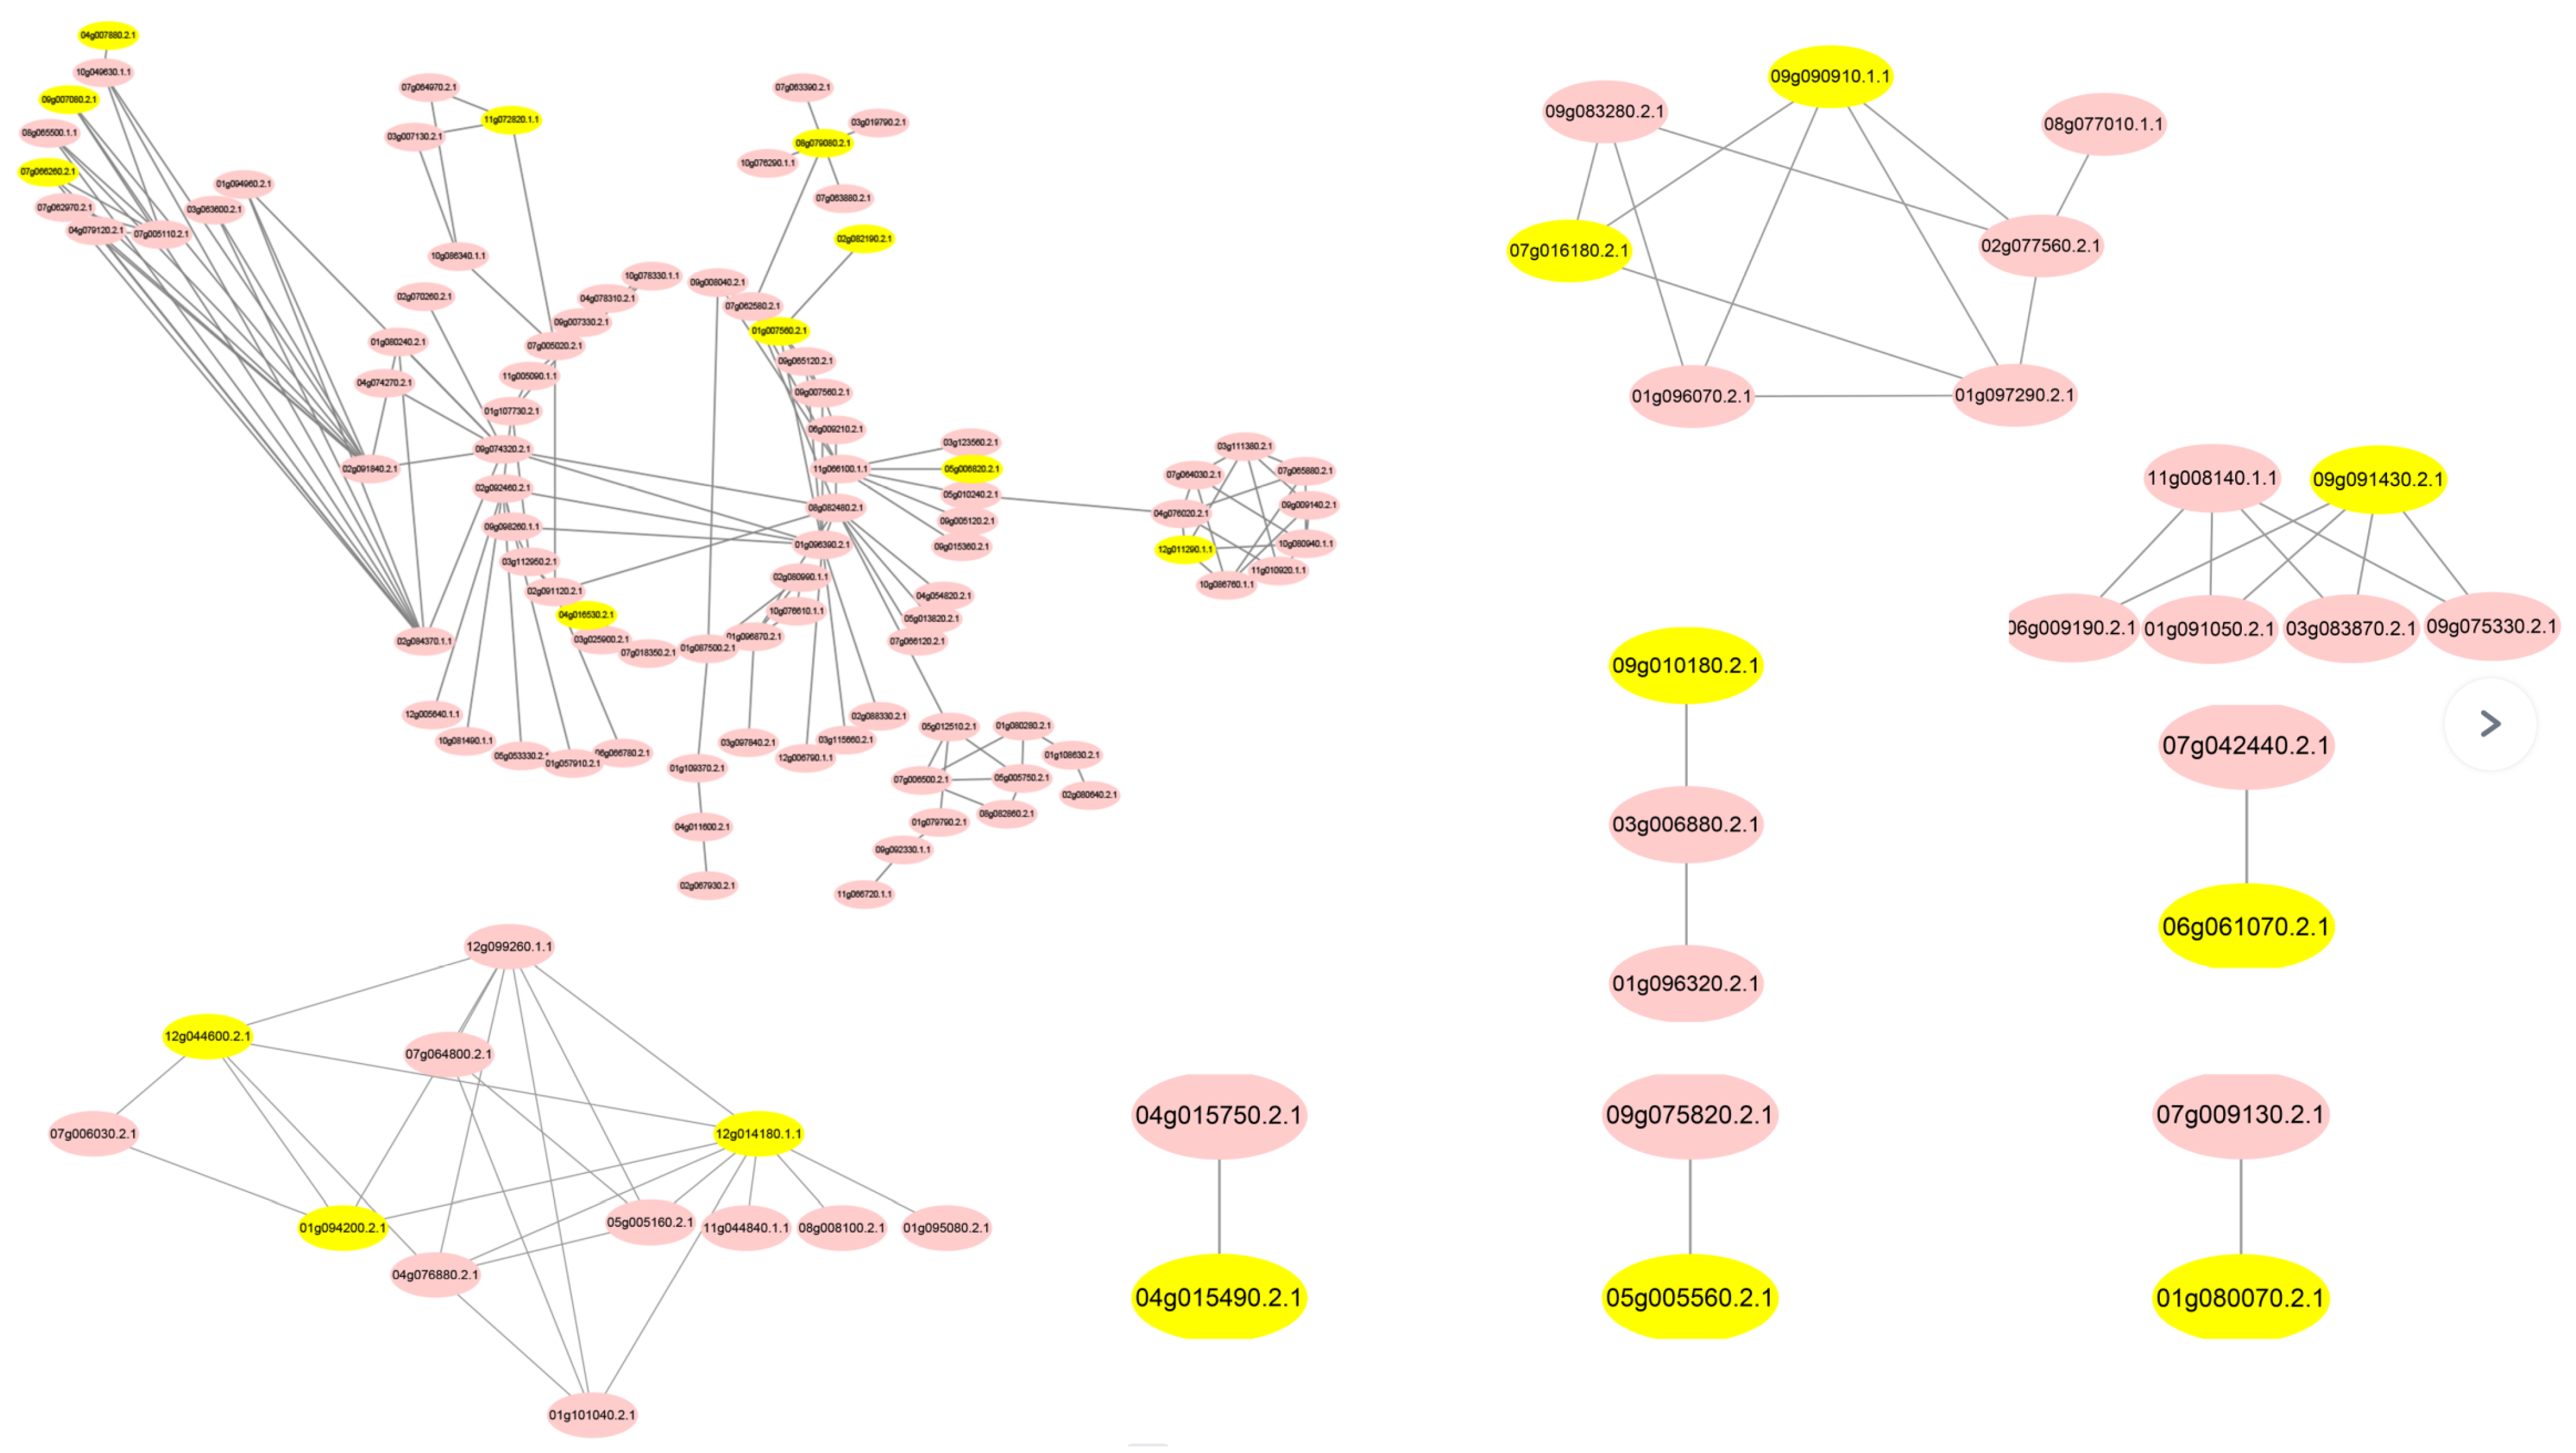
3.2. Analysis of DEGs in the PPI Network

We analyzed DEGs associated with the PPI network, as the associated genomes generally have similar functions [30]. Among the 1697 DEGs identified in the transcriptome, 232 DEGs (96 up-regulated and 136 down-regulated) may encode proteins that physically interact (Figure 3). Additionally, at least one SSR motif was detected in 95 gene sequences. Primers were designed for 57 DEGs. The largest PPI network consisted of 91 genes, which were enriched with biological process GO terms, including dicarboxylic acid metabolic process, carboxylic acid metabolic process, and oxoacid metabolic process (Figure 4A). These genes might be important for lead stress responses in kenaf. Oxoacid metabolic process was also reported in Abelmoschus esculentus [16]. The main enriched molecular function GO terms were antioxidant activity, NAD binding, and catalytic activity, whereas the enriched cellular component GO terms were intracellular organelle, organelle, and intracellular. The enriched KEGG pathways among these PPI network genes included cytoskeleton proteins, starch and sucrose metabolism, and DNA replication proteins (Figure 4B).

3.3. Validation of EST-SSR Molecular Markers

To validate the developed SSR markers and screen for polymorphisms, we synthesized 52 primer pairs for SSR-containing genes in the PPI network. Genomic DNA from 30 representative kenaf varieties/lines were used to screen and verify the polymorphism of the markers. First, using ordinary primers, DNA from one of eight random samples was used as the template for a PCR amplification. The amplified fragments were analyzed by 1% agarose gel electrophoresis. Of the 52 primer pairs, 33 primer pairs were highly specific and produced PCR fragments and were detected as clear bands in agarose gels. The remaining 19 primer pairs did not amplify a fragment with the expected size (100–400 bp) or they amplified sequences non-specifically. Thus, 33 SSR primer pairs with the FAM fluorescent group were synthesized for a PCR amplification. We illustrated the fragment analysis results of one SSR marker and one sample (Figure 5). The resulting fragments were analyzed using the ABI 3730xl system. A total of 25 polymorphic SSR markers, four non-polymorphic markers, and four PCR products with no specific markers were obtained. The preliminarily verified genetic diversity of 30 samples with 25 markers are presented in Supplementary Table S3. The average number of alleles was 7.12, ranging from 3 to 14; the average number of effective alleles was 3.23, ranging from 1.07 to 7.14; the average PIC value was 0.57, ranging from 0.06 to 0.85; and the average Shannon diversity index was 0.61, ranging from 0.07 to 0.86. These results indicate that the 25 SSR markers are highly polymorphic and are broadly applicable for analyzing genetic diversity, population structures, and genetic relationships as well as for DNA fingerprinting [31]. After analyzing the genotyping success rate of these 25 EST-SSR markers, we eliminated three markers with the lowest success rate (KSSR32, KSSR42, and KSSR46), and the remaining 22 high-quality EST-SSR markers were retained for investigations of the genetic diversity and population structure of a large number of samples. The genetic locations of these 22 EST-SSR markers are presented in Figure 3. Ten of the markers were located in genes in the largest PPI network, whereas the remaining 12 markers were present in genes in eight smaller PPI networks. To further verify the utility of the 22 new molecular markers, we conducted SSR genotyping analyses involving 108 kenaf germplasm materials.

3.4. Genetic Diversity of a Single Locus

We evaluated the genetic diversity of kenaf germplasm resources using the newly developed EST-SSR markers (Table 2). A table containing the SSR locus, allele size, melting temperature, and the sequence of the SSR primers was shown in Table 3. Among the 138 kenaf genotypes, the average number of alleles was 15.64, ranging from 6 to 28; the average number of effective alleles was 3.42, ranging from 1.43 to 5.88; the average major allele frequency was 0.50, ranging from 0.25 to 0.83; the average observed heterozygosity was 0.27, ranging from 0 to 0.57; the expected heterozygosity was 0.66, ranging from 0.30 to 0.83; the average PIC value was 0.63, ranging from 0.30 to 0.81; and the average Shannon diversity index was 1.58, ranging from 0.81 to 2.22. Additionally, the average genetic similarity coefficient of the kenaf germplasms was 0.23. The genetic similarity coefficient was lowest (i.e., 0) for S43, S85, S68, and S85, reflecting the most distant relationship. In contrast, the genetic similarity coefficient for S32 and S54 was 0.78. These results indicated the kenaf germplasms were genetically diverse and were distantly related. As such, they may be useful for selecting suitable parents for future kenaf breeding experiments.

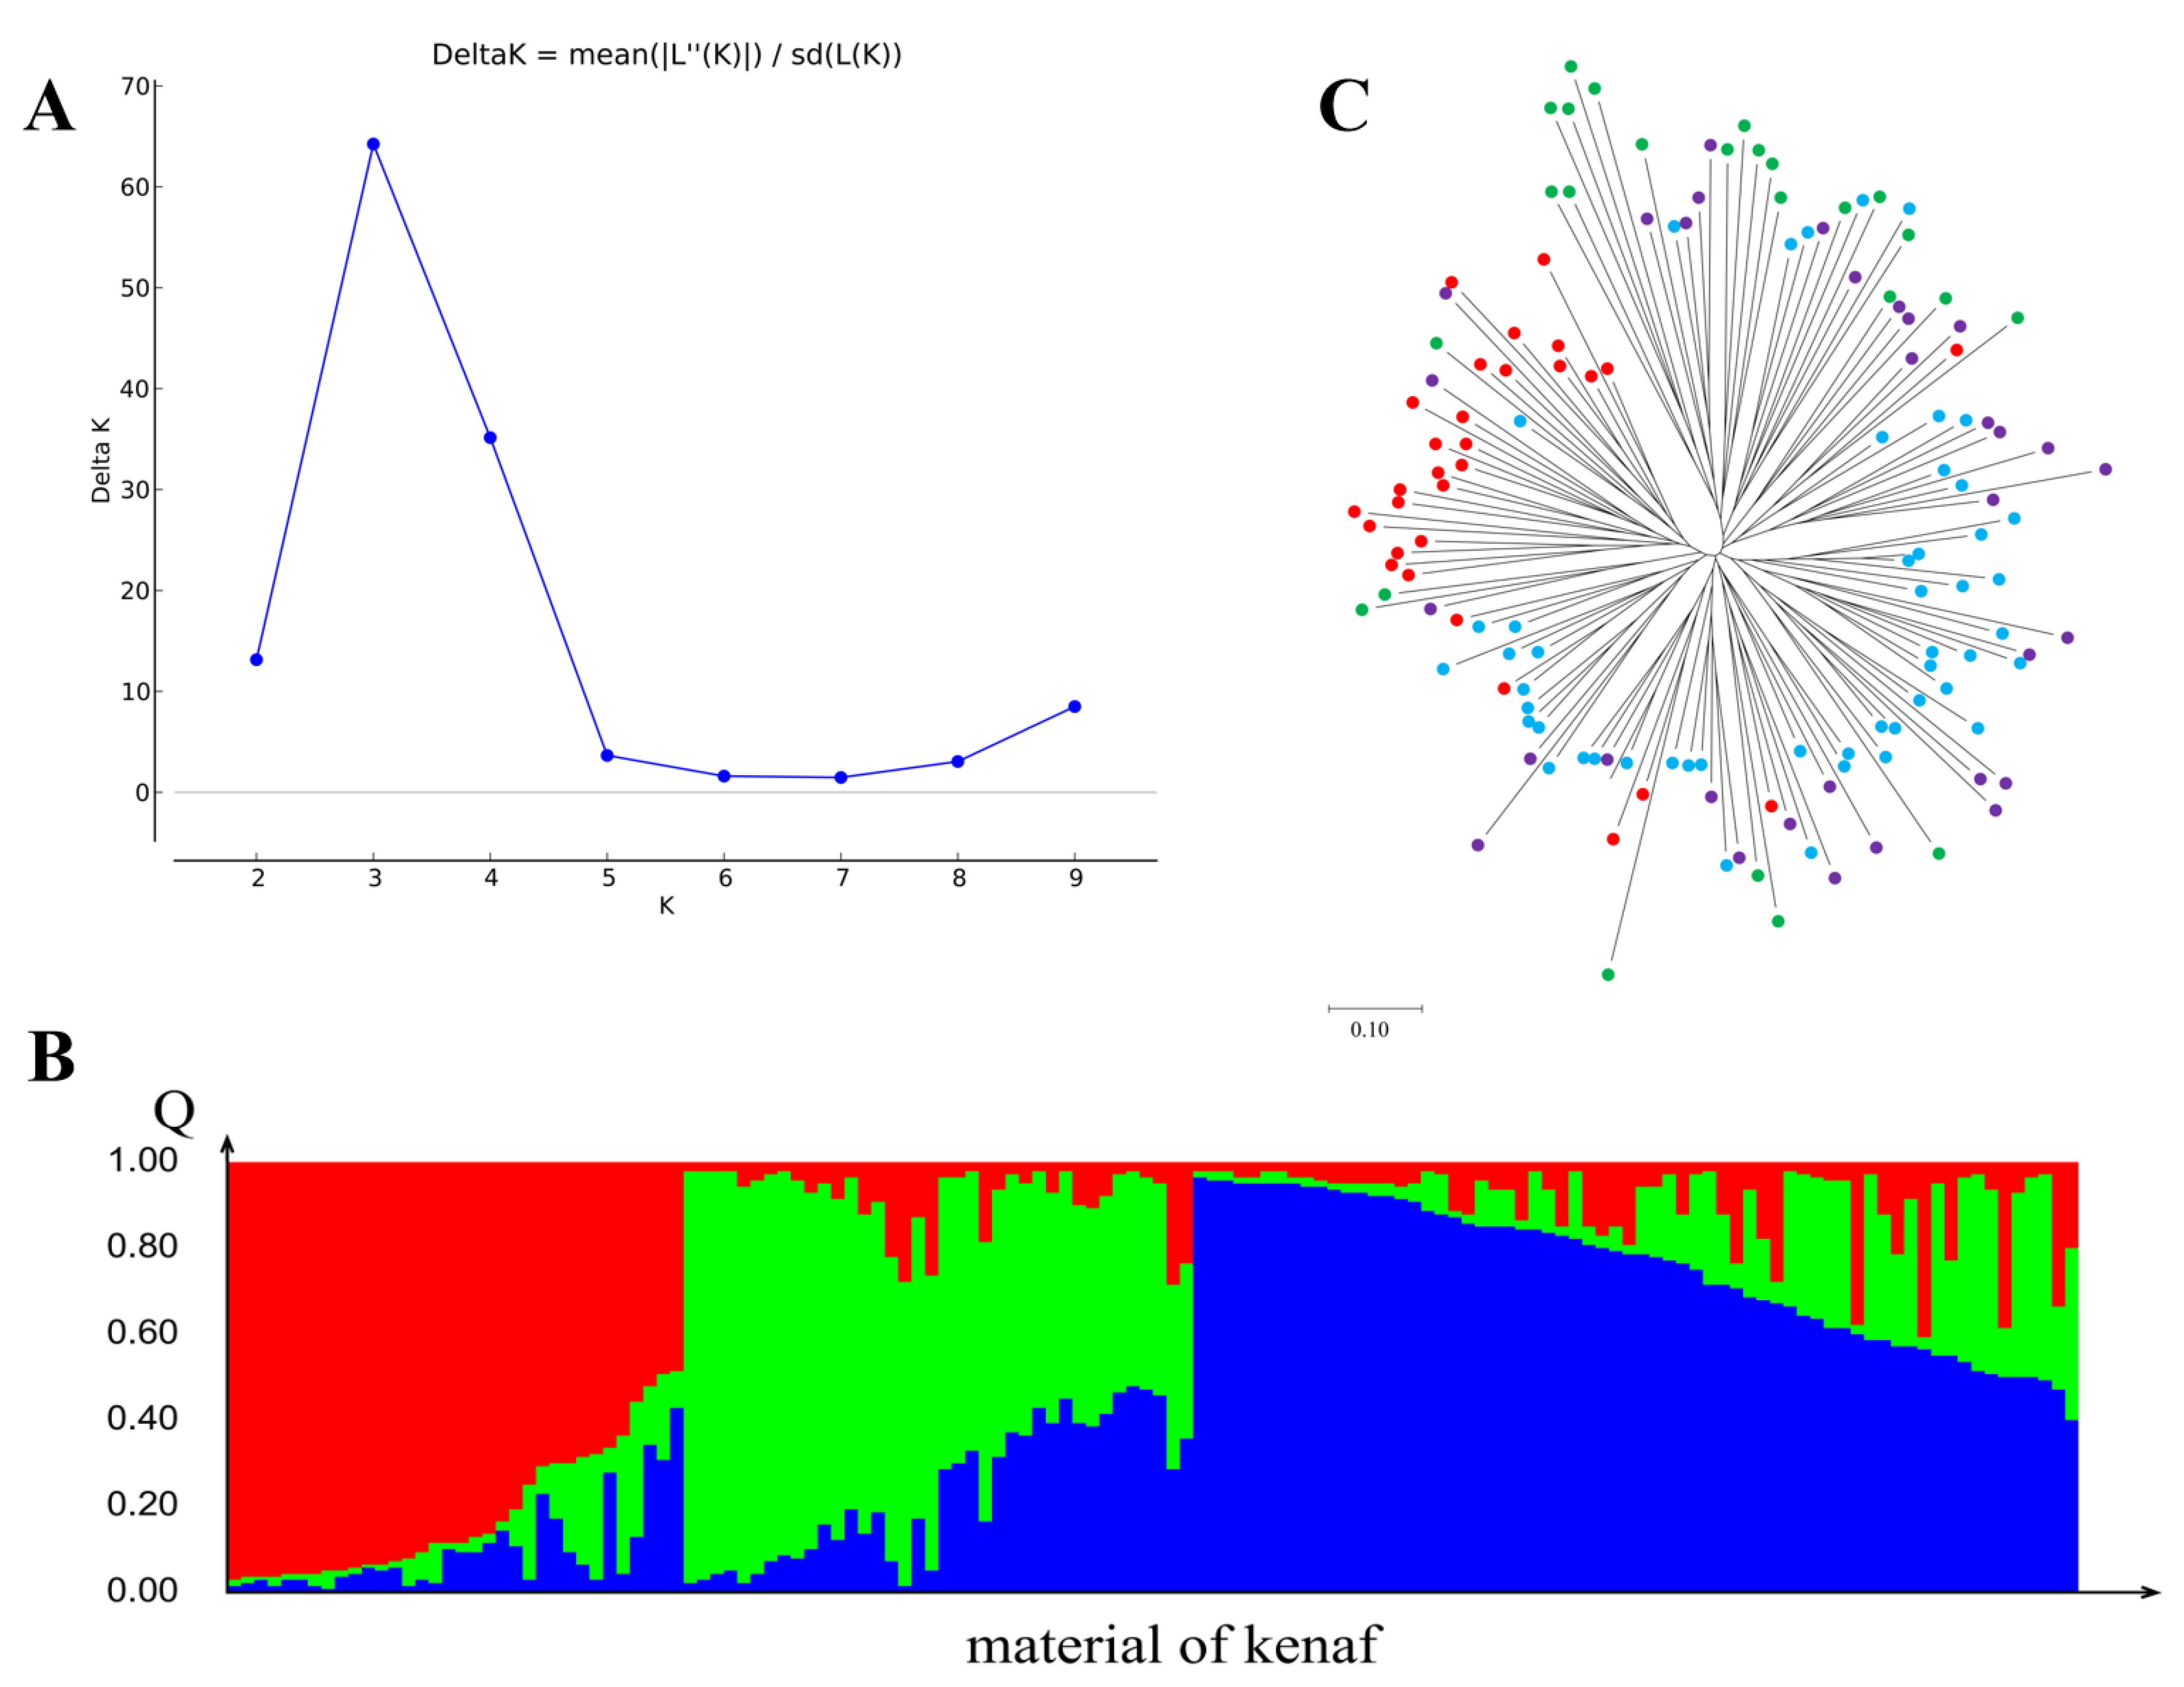
3.5. Genetic Structure Analysis

On the basis of the genotyping data for 22 SSR loci, we analyzed the population structure of 138 kenaf materials. The model produced by the Structure software indicates the probability that each material is divided into specific subgroups, and the results were imported into Structure Harvester. The ΔK value curve for the K values was analyzed (Figure 6A). The ΔK value was highest when K = 3, indicating the optimal number of subgroups for the 138 materials was three. We used the Clumpp 2.0 software to merge the three repeated Q matrices corresponding to the best K value to draw the Q plot (Figure 6B). The samples with a Q value exceeding 0.6 were classified into specific clusters, whereas those with a Q value less than 0.6 were classified into mixed clusters. The 138 materials were divided into three clusters comprising 30, 25, and 50 materials. Additionally, 33 materials were included in the mixed cluster.
To further analyze the population structure, we used the PowerMarker software to calculate Nei’s genetic distance based on the allele frequency. Moreover, the neighbor-joining method was used to construct a phylogenetic tree (Figure 6C). The clustering of the neighbor-joining tree was similar to that based on the Structure analysis. Specifically, the kenaf genotypes in the same cluster of the Structure model were clustered on the same branch of the neighbor-joining tree. The genotypes in the mixed cluster were distributed in each branch. Therefore, these 138 kenaf germplasm materials can be divided into three clusters. This clustering result will be useful for future investigations of kenaf genetics and for identifying and optimizing the application of kenaf germplasm resources.
In this study, SSR molecular markers were developed based on kenaf lead-stressed transcriptome sequencing data. The SSR characteristics of the lead-stress-response-related genes in the whole genome were also analyzed. Moreover, we examined the SSRs of the unigenes identified from the kenaf lead-stressed transcriptome sequencing data. We identified more unigenes and a higher proportion of SSR-containing unigenes than reported by Li et al. [7]. The distribution of the SSR motifs also differed between the studies. More specifically, mononucleotide motifs were the most common SSRs in our study, whereas they represented only 0.3% of the SSRs reported by Li et al. [7]. This discrepancy may have resulted from the differences in the gene expression levels in diverse transcriptome sequencing experiments.
The SSR markers developed based on transcriptome data have obvious characteristics. The SSR distribution and the potential functions of the SSR-containing unigenes were significantly related to the lead stress tolerance of the kenaf germplasm resources included in this study. The functional enrichment analyses revealed that the SSR-containing unigenes were related to important plant physiological processes, including the scavenging of reactive oxygen species and photosynthesis. Therefore, the EST-SSR markers developed in this study may be useful for evaluating the genetic diversity of populations and reflecting the diversity among the lead-stress-response-related genes of the kenaf germplasm resources. Accordingly, these molecular markers can be used for elucidating population genetic diversity and identifying excellent breeding materials.
Genes encoding proteins in the same PPI network and regulated by the same signaling pathway often have correlated expression patterns and form a group of functional genes. The molecular markers developed based on these genes reflect the functional variations in a group of genes and the linkage or strong linkage disequilibrium in the marker itself and its vicinity as well as the broader genome-wide functional network. Therefore, we selected DEGs in a PPI network and subsequently screened and verified the SSR markers in these DEGs [16]. We ultimately obtained 22 polymorphic EST-SSR markers with a high detection rate, and used them to evaluate kenaf germplasm resources.
To verify the practical utility of these 22 EST-SSR markers, we analyzed the genetic diversity and population structure of 138 kenaf germplasms. We found that the 22 EST-SSR loci were genetically diverse. The significant differences in the number of alleles and the number of effective alleles implied that each allele was unevenly distributed in the population and that the alleles were specific to particular subgroups. The neighbor-joining tree based on Nei’s genetic distance confirmed that the 138 kenaf materials could be distinguished by these 22 EST-SSR markers. The results of the Structure and neighbor-joining cluster analyses were consistent. The kenaf germplasm resources were divided into three subgroups and one mixed subgroup. We also examined the potential correlation between the subgroups and the geographical origins of the germplasms, but no relationships were detected. These results imply that the 22 newly developed EST-SSR molecular markers are genetically diverse and applicable for distinguishing kenaf germplasms and evaluating population structures. However, they cannot reflect the differences in the geographical origins of the germplasms. These findings indicate the polymorphism of the kenaf genes associated with lead stress tolerance. Additionally, the evaluated population structure might influence the lead tolerance of kenaf germplasms, and this possibility needs to be experimentally verified via QTL mapping, association analyses, and the annotation of gene functions. Although we herein report the genetic diversity and population structure of kenaf germplasms, we cannot compare our results with those of previous related studies because of the diversity in the investigated germplasm resources [32,33,34].
The corresponding genes of KSSR18 and KSSR31 are plant-hormone-related genes. In Pb polluted soil, leaf spraying of plant hormone can increase plant height, root length, and dry weight of aboveground and underground parts of Zea mays, and promote Pb uptake by individual plants [35]. HADI et al. believed that this phenomenon was related to root elongation and biomass increase of maize [35]. In polluted soil containing 1.0 mg·kg−1 Cd(NO3)2, leaf spraying with plant hormone could significantly increase the biomass of Nightshade; the aboveground Cd content increased by 16%, and plant Cd uptake increased by 124% [36]. The increase of plant hormones in a heavy metal enrichment capacity may be the result of the combined effect of increasing root development (root biomass) and providing more storage sites (aboveground biomass). On the one hand, a more developed root system means an increase in the volume of soil available for nutrient absorption, which helps plants absorb more nutrients or heavy metals. On the other hand, higher aboveground biomass will provide more storage places for heavy metals to avoid excessive accumulation of heavy metals, thus reducing the load on plant physiological and biochemical processes [37].

4. Conclusions

In conclusion, we developed a set of EST-SSR markers based on kenaf lead-stressed transcriptome sequencing data. Additionally, we designed EST-SSR primers for DEGs in a PPI network to screen, validate, and apply the generated markers. Finally, 22 EST-SSR markers with a high detection rate and substantial polymorphism were obtained. These markers were able to distinguish 138 kenaf germplasms, which were divided into three subgroups (clusters). Our findings suggest that the 22 EST-SSR primer pairs are suitable for evaluating the genetic diversity and population structure of kenaf germplasm resources. Moreover, the specificity of the EST-SSR markers for particular genes may reflect the considerable differences in the lead tolerance of kenaf germplasm resources. Therefore, these markers may be important for identifying lead-tolerant kenaf materials and screening future molecular-marker-assisted breeding of new, more stress-tolerant varieties. The 22 EST-SSR markers reported herein can also be used for the QTL linkage mapping and association mapping of lead-stress-related traits to further verify the correlation between molecular markers and kenaf lead tolerance.

Supplementary Materials

The following supporting information can be downloaded at: https://www.mdpi.com/article/10.3390/su15021514/s1, Figure S1: GO term enrichment analysis of unigenes containing SSRs; Figure S2: KEGG pathway enrichment analysis of unigenes containing SSRs; Table S1: Number, name, and origin of 138 kenaf germplasms; Table S2: EST-SSR primer database for kenaf; Table S3: Genetic diversity analysis of 25 EST-SSR markers in 30 kenaf samples.

Author Contributions

Conceptualization, X.A.; methodology, X.A.; software, W.L.; validation, X.A., W.L. and T.L.; formal analysis, X.A.; investigation, X.L.; resources, X.A.; data curation, X.A.; writing—original draft preparation, X.A. and L.Z.; writing—review and editing, X.A.; visualization, X.A.; supervision, X.A.; project administration, X.A.; funding acquisition, X.A. All authors have read and agreed to the published version of the manuscript.

Funding

This research was funded by the National Key R&D Program and Key Special Project of International Science and Technology Innovation Cooperation between Governments (2017YFE0195300), National Natural Science Foundation of China (31801406; 32202506), Basic Public Welfare Research Program of Zhejiang Province (LGN20C150007), China Agriculture Research System of MOF and MARA, China Agriculture Research System for Bast and Leaf Fiber Crops (CARS-16-S05), and International Cooperation Fund of ZAAS (2022).

Institutional Review Board Statement

Not applicable.

Informed Consent Statement

Not applicable.

Data Availability Statement

Not applicable.

Conflicts of Interest

The authors declare that the research was conducted in the absence of any commercial or financial relationships that could be construed as a potential conflict of interest.

References

  1. An, X.; Jin, G.; Zhang, J.; Luo, X.; Chen, C.; Li, W.; Ma, G.; Jin, L.; Dai, L.; Shi, X.; et al. Protein responses in kenaf plants exposed to drought conditions determined using iTRAQ technology. FEBS Open Bio 2018, 8, 1572–1583. [Google Scholar] [CrossRef] [PubMed]
  2. Chen, P.; Chen, T.; Li, Z.; Jia, R.; Luo, D.; Tang, M.; Lu, H.; Hu, Y.; Yue, J.; Huang, Z. Transcriptome Analysis Revealed Key Genes and Pathways Related to Cadmium-Stress Tolerance in Kenaf (Hibiscus cannabinus L.). Ind. Crops Prod. 2020, 158, 112970. [Google Scholar] [CrossRef]
  3. An, X.; Chen, J.; Jin, G. Transcriptome profiling of kenaf (Hibiscus cannabinus L.) under plumbic stress conditions implies the involvement of NAC transcription factors regulating reactive oxygen species-dependent programmed cell death. PeerJ 2020, 8, e8733. [Google Scholar] [CrossRef] [PubMed] [Green Version]
  4. Wang, B.; Guo, X.; Zhao, P.; Ruan, M.; Yu, X.; Zou, L.; Yang, Y.; Li, X.; Deng, D.; Xiao, J.; et al. Molecular Diversity Analysis, Drought Related Marker-Traits Association Mapping and Discovery of Excellent Alleles for 100-Day Old Plants by Est-Ssrs in Cassava Germplasms (Manihot esculenta Cranz). PLoS ONE 2017, 12, e0177456. [Google Scholar] [CrossRef] [Green Version]
  5. Cheng, Z.; Lu, B.R.; Baldwin, B.S.; Sameshima, K.; Chen, J.K. Comparative Studies of Genetic Diversity in Kenaf (Hibiscus cannabinus L.) Varieties Based on Analysis of Agronomic and Rapd Data. Hereditas 2002, 136, 231–239. [Google Scholar] [CrossRef]
  6. Zhang, L.; Xu, Y.; Zhang, X.; Ma, X.; Zhang, L.; Liao, Z.; Zhang, Q.; Wan, X.; Cheng, Y.; Zhang, J.; et al. The Genome of Kenaf (Hibiscus cannabinus L.) Provides Insights into Bast Fibre and Leaf Shape Biogenesis. Plant Biotechnol. J. 2020, 18, 1796–1809. [Google Scholar] [CrossRef] [Green Version]
  7. Li, H.; Li, D.; Chen, A.; Tang, H.; Li, J.; Huang, S. Characterization of the Kenaf (Hibiscus cannabinus) Global Transcriptome Using Illumina Paired-End Sequencing and Development of EST-SSR Markers. PLoS ONE 2016, 11, e0150548. [Google Scholar] [CrossRef]
  8. Chowdhury, T.; Mandal, A.; Roy, S.C.; De Sarker, D. Diversity of the Genus Ocimum (Lamiaceae) through Morpho-Molecular (Rapd) and Chemical (Gc-Ms) Analysis. J. Genet. Eng. Biotechnol. 2017, 15, 275–286. [Google Scholar] [CrossRef]
  9. Frascaroli, E.; Schrag, T.A.; Melchinger, A.E. Genetic diversity analysis of elite European maize (Zea mays L.) inbred lines using AFLP, SSR, and SNP markers reveals ascertainment bias for a subset of SNPs. Theor. Appl. Genet. 2013, 126, 133–141. [Google Scholar] [CrossRef] [PubMed]
  10. Aitken, K.S.; Jackson, P.A.; McIntyre, C.L. A combination of AFLP and SSR markers provides extensive map coverage and identification of homo(eo)logous linkage groups in a sugarcane cultivar. Theor. Appl. Genet. 2005, 110, 789–801. [Google Scholar] [CrossRef]
  11. Choudhary, S.B.; Sharma, H.K.; Kumar, A.A.; Maruthi, R.T.; Mitra, J.; Chowdhury, I.; Singh, B.K.; Karmakar, P.G. Ssr and Morphological Trait Based Population Structure Analysis of 130 Diverse Flax (Linum usitatissimum L.) Accessions. C. R. Biol. 2017, 340, 65–75. [Google Scholar] [CrossRef]
  12. Wu, J.; Zhao, Q.; Wu, G.; Zhang, S.; Jiang, T. Development of Novel Ssr Markers for Flax (Linum usitatissimum L.) Using Reduced-Representation Genome Sequencing. Front. Plant Sci. 2016, 7, 2018. [Google Scholar] [CrossRef] [Green Version]
  13. Luan, M.B.; Zou, Z.Z.; Zhu, J.J.; Wang, X.F.; Xu, Y.; Ma, Q.H.; Sun, Z.M.; Chen, J.H. Development of a core collection for ramie by heuristic search based on SSR markers. Biotechnol. Biotechnol. Equip. 2014, 28, 798–804. [Google Scholar] [CrossRef] [PubMed]
  14. Yuan, C.Y.; Zhang, C.; Wang, P.; Hu, S.; Chang, H.P.; Xiao, W.J.; Lu, X.T.; Jiang, S.B.; Ye, J.Z.; Guo, X.H. Genetic diversity analysis of okra (Abelmoschus esculentus L.) by inter-simple sequence repeat (ISSR) markers. Genet. Mol. Res. 2014, 13, 3165–3175. [Google Scholar] [CrossRef]
  15. Davidson, N.M.; Oshlack, A. Corset: Enabling differential gene expression analysis for de novo assembled transcriptomes. Genome Biol. 2014, 15, 410. [Google Scholar] [CrossRef] [PubMed] [Green Version]
  16. An, X.; Luo, X.; Liu, T.; Li, W.; Zou, L. Development and Application of Fruit Color-Related Expressed Sequence Tag-Simple Sequence Repeat Markers in Abelmoschus esculentus on the Basis of Transcriptome Sequencing. Front. Plant Sci. 2022, 13, 907895. [Google Scholar] [CrossRef] [PubMed]
  17. Chen, C.; Chen, H.; Zhang, Y.; Thomas, H.R.; Frank, M.H.; He, Y.; Xia, R. Tbtools: An Integrative Toolkit Developed for Interactive Analyses of Big Biological Data. Mol. Plant 2020, 13, 1194–1202. [Google Scholar] [CrossRef]
  18. Young, M.D.; Wakefield, M.J.; Smyth, G.K.; Oshlack, A. Gene ontology analysis for RNA-seq: Accounting for selection bias. Genome Biol. 2010, 11, R14. [Google Scholar] [CrossRef] [Green Version]
  19. Mao, X.; Cai, T.; Olyarchuk, J.G.; Wei, L. Automated genome annotation and pathway identification using the KEGG Orthology (KO) as a controlled vocabulary. Bioinformatics 2005, 21, 3787–3793. [Google Scholar] [CrossRef]
  20. Wang, L.; Feng, Z.; Wang, X.; Wang, X.; Zhang, X. DEGseq: An R package for identifying differentially expressed genes from RNA-seq data. Bioinformatics 2010, 26, 136–138. [Google Scholar] [CrossRef] [Green Version]
  21. Shannon, P.; Markiel, A.; Ozier, O.; Baliga, N.S.; Wang, J.T.; Ramage, D.; Amin, N.; Schwikowski, B.; Ideker, T. Cytoscape: A software environment for integrated models of biomolecular interaction networks. Genome Res. 2003, 13, 2498–2504. [Google Scholar] [CrossRef]
  22. Liu, K.; Muse, S.V. PowerMarker: An integrated analysis environment for genetic marker analysis. Bioinformatics 2005, 21, 2128–2129. [Google Scholar] [CrossRef] [Green Version]
  23. Adams, D.C.; Rohlf, F.J. Ecological character displacement in Plethodon: Biomechanical differences found from a geometric morphometric study. Proc. Natl. Acad. Sci. USA 2000, 97, 4106–4111. [Google Scholar] [CrossRef] [Green Version]
  24. Earl, D.A.; von Holdt, B.M. STRUCTURE HARVESTER: A website and program for visualizing STRUCTURE output and implementing the Evanno method. Conserv. Genet. Resour. 2011, 4, 359–361. [Google Scholar] [CrossRef]
  25. Jakobsson, M.; Rosenberg, N.A. CLUMPP: A cluster matching and permutation program for dealing with label switching and multimodality in analysis of population structure. Bioinformatics 2007, 23, 1801–1806. [Google Scholar] [CrossRef] [Green Version]
  26. Zhou, Q.; Zhou, P.Y.; Zou, W.T.; Li, Y.G. Est-Ssr Marker Development Based on Transcriptome Sequencing and Genetic Analyses of Phoebe Bournei (Lauraceae). Mol. Biol. Rep. 2021, 48, 2201–2208. [Google Scholar] [CrossRef]
  27. Wei, Z.; Sun, Z.; Cui, B.; Zhang, Q.; Xiong, M.; Wang, X.; Zhou, D. Transcriptome Analysis of Colored Calla Lily (Zantedeschia rehmannii Engl.) by Illumina Sequencing: De Novo Assembly, Annotation and Est-Ssr Marker Development. PeerJ. 2016, 4, e2378. [Google Scholar] [CrossRef] [Green Version]
  28. Li, X.; Liu, X.; Wei, J.; Li, Y.; Tigabu, M.; Zhao, X. Development and Transferability of Est-Ssr Markers for Pinus koraiensis from Cold-Stressed Transcriptome through Illumina Sequencing. Genes 2020, 11, 500. [Google Scholar] [CrossRef]
  29. Yang, Z.J.; Peng, Z.S.; Yang, H. Identification of Novel and Useful Est-Ssr Markers from De Novo Transcriptome Sequence of Wheat (Triticum aestivum L.). Genet. Mol. Res. 2016, 15, 15017509. [Google Scholar] [CrossRef] [PubMed]
  30. Cao, F.; Cheng, Y.S.; Yu, L.; Xu, Y.Y.; Wang, Y. Bioinformatics Analysis of Differentially Expressed Genes and Protein-Protein Interaction Networks Associated with Functional Pathways in Ulcerative Colitis. Med. Sci. Monit. 2021, 27, e927917. [Google Scholar] [CrossRef]
  31. Liu, C.; Yuan, D.; Lin, Z. Construction of an EST-SSR-based interspecific transcriptome linkage map of fibre development in cotton. J. Genet. 2014, 93, 689–697. [Google Scholar] [CrossRef] [PubMed]
  32. Gailing, O.; Bodénès, C.; Finkeldey, R.; Kremer, A.; Plomion, C. Genetic Mapping of Est-Derived Simple Sequence Repeats (Est-Ssrs) to Identify Qtl for Leaf Morphological Characters in a Quercus Robur Full-Sib Family. Tree Genet. Genomes 2013, 9, 1361–1367. [Google Scholar] [CrossRef]
  33. Xiang, C.; Duan, Y.; Li, H.; Ma, W.; Huang, S.; Sui, X.; Zhang, Z.; Wang, C. A High-Density Est-Ssr-Based Genetic Map and Qtl Analysis of Dwarf Trait in Cucurbita pepo L. Int. J. Mol. Sci. 2018, 19, 3140. [Google Scholar] [CrossRef] [PubMed] [Green Version]
  34. Gupta, D.; Taylor, P.W.J.; Inder, P.; Phan, H.T.T.; Ellwood, S.R.; Mathur, P.N.; Sarker, A.; Ford, R. Integration of Est-Ssr Markers of Medicago Truncatula into Intraspecific Linkage Map of Lentil and Identification of Qtl Conferring Resistance to Ascochyta Blight at Seedling and Pod Stages. Mol. Breed. 2011, 30, 429–439. [Google Scholar] [CrossRef] [Green Version]
  35. Hadi, F.; Bano, A.; Fuller, M.P. Augmented Phytoextraction of Lead (Pb2+)-Polluted Soils: A Comparative Study of the Effectiveness of Plant Growth Regulators, EDTA, and Plant Growth–Promoting Rhizobacteria. Bioremediat. J. 2013, 17, 124–130. [Google Scholar] [CrossRef]
  36. Ji, P.; Tang, X.; Jiang, Y.; Tong, Y.; Gao, P.; Han, W. Potential of Gibberellic Acid 3 (Ga3) for Enhancing the Phytoremediation Efficiency of Solanum nigrum L. Bull. Environ. Contam. Toxicol. 2015, 95, 810–814. [Google Scholar] [CrossRef]
  37. Hadi, F.; Bano, A.; Fuller, M.P. The improved phytoextraction of lead (Pb) and the growth of maize (Zea mays L.): The role of plant growth regulators (GA3 and IAA) and EDTA alone and in combinations. Chemosphere 2010, 80, 457–462. [Google Scholar] [CrossRef]
Figure 1. The technical route of this study.
Sustainability 15 01514 g001
Figure 2. Distribution of SSR motifs in unigenes.
Sustainability 15 01514 g002
Figure 3. Genes and PPI networks associated with the newly developed EST-SSR markers. The yellow nodes represent 22 genes with EST-SSR markers. The pink nodes represent node genes that interact with their proteins.
Sustainability 15 01514 g003
Figure 4. Enrichment analysis of the differentially expressed genes (DEGs) associated with PPI networks. (A) GO enrichment analysis of the PPI network-associated DEGs; (B) KEGG enrichment analysis of the PPI-network-associated DEGs.
Sustainability 15 01514 g004
Figure 5. Sample KSSR01 labeled ABI3730xl capillary electrophoresis fragment analysis. X axis is fragment size, unit is bp; the ordinate is signal intensity, peak height ht; ar is the peak area; sz is the fragment size. At the time of analysis, sz was an allele.
Sustainability 15 01514 g005
Figure 6. Analysis of the population structure of kenaf germplasm resources. (A): ΔK changes with the value of K. When K = 3, ΔK had a peak inflection point, so the optimal population number of kenaf germplasm was 3. (B): Q plot. Y axis is Q value, which is the probability of the corresponding material divided into a specific cluster. The abscissa is kenaf germplasm material number. Red, blue, and green represent three clusters, respectively. (C). NJ clustering tree based on Nei’s genetic distance. Red represents cluster1, green represents cluster2, blue represents cluster3, and purple represents Mixed.
Sustainability 15 01514 g006
Table 1. Overview of unigenes containing SSRs.
ContentNumber
Total number of sequences examined136,854
Total size of examined sequences (bp)151,754,502
Total number of identified SSRs43,457
Number of SSR-containing sequences34,180
Number of sequences containing more than 1 SSR7421
Number of SSRs present in compound formation2321
Table 2. Analysis of the genetic diversity of 22 new EST-SSR markers in 138 kenaf germplasm resources.
MarkerMajor.Allele.FrquencyNaNeHeterozygosityExp_HetPICI
KSSR010.38 175.08 0.57 0.81 0.79 2.05
KSSR030.66 152.19 0.20 0.55 0.52 1.35
KSSR050.60 62.45 0.30 0.60 0.55 1.19
KSSR110.38 143.67 0.49 0.73 0.68 1.61
KSSR120.33 155.24 0.50 0.81 0.79 2.00
KSSR150.41 284.83 0.37 0.80 0.78 2.22
KSSR160.40 203.42 0.20 0.71 0.66 1.64
KSSR170.53 153.04 0.08 0.67 0.64 1.58
KSSR180.74 91.77 0.21 0.44 0.42 1.02
KSSR220.39 214.57 0.50 0.78 0.76 1.98
KSSR240.46 132.88 0.46 0.65 0.59 1.40
KSSR250.68 61.85 0.07 0.46 0.39 0.81
KSSR260.83 161.43 0.16 0.30 0.30 0.85
KSSR280.47 183.71 0.33 0.73 0.71 1.86
KSSR310.25 185.88 0.41 0.83 0.81 2.08
KSSR370.45 193.93 0.41 0.75 0.72 1.88
KSSR380.49 173.45 0.16 0.71 0.69 1.80
KSSR400.64 182.31 0.10 0.57 0.54 1.42
KSSR410.78 141.61 0.09 0.38 0.37 0.99
KSSR430.26 85.31 0.00 0.81 0.79 1.79
KSSR440.46 173.22 0.14 0.69 0.65 1.59
KSSR490.39 203.40 0.16 0.71 0.66 1.72
Mean0.50 15.64 3.42 0.27 0.66 0.63 1.58
Na = Observed number of alleles; Ne = Effective number of alleles [Kimura and Crow (1964)]; I = Shannon’s Information index [Lewontin (1972)]; Expected heterozygosity were computed using Levene (1949); PIC, polymorphic information content.
Table 3. A table containing the SSR locus, allele size, melting temperature, and the sequence of the SSR primers.
SSR IDGene IDSSR MotifForward Primer (5′–3′)Tm (°C)Size (bp)Reverse Primer (5′–3′)Tm (°C)Size (bp)Product Size (bp)
KSSR01Cluster-5711.2645(A)10GTCGACCGGGTCTACGAATC59.97120TCAACTACGGTAGGGCAGGA59.9620113–133
KSSR03Cluster-5711.55898(GCA)7CCTCCGTTCTTACCACCACC60.03720TCCCAAAGGAATGCCCAACA59.8120144–161
KSSR05Cluster-5711.54607(A)10AGAAAAGGCCATTCCTGATCCA59.68722ATTGGTGGACTGCAGTACGG60.03620158–163
KSSR11Cluster-5711.64891(A)10TGTAACCCACGGTGGCTTTT60.10720CACATTACAAATCTAAACCTTCCCTGA59.60727174–187
KSSR12Cluster-5711.75272(T)10CGTCGAATCAGTCATGCTGC59.720TGCTCATTGCTCAATAGATCAAGA58.32224171–189
KSSR15Cluster-5711.57149(TCT)5CTCTTCCAACGCAGCCAAAC60.0420AATGGGTTTTCCGACACCGA59.89120174–228
KSSR16Cluster-5711.67236(A)11ACGGCCGACTTTCAGAATGT59.96520TCCAGGCTCCAGCTATCTCA59.73720193–219
KSSR17Cluster-5711.53839(ACC)5AGGCTTTCGTTGCTCACCAT60.25120TTTGGAGGCACGGGAGATTC60.03520198–214
KSSR18Cluster-5711.66135(A)11TTCCGGTGCAGATAGGGAGA60.03320ACAAGGAAACAGAGGCAGCA59.81720201–209
KSSR22Cluster-5711.46957(TGG)5CCACCGTATTCTCATCGGCA59.89620CTCCAATCCATCGGAGCCTC59.96520188–222
KSSR24Cluster-5711.73527(CCA)5CACATCCCATTTGACCCCCA59.95920TCTGTGCCAATGGAAGAGCA59.59920207–222
KSSR25Cluster-5711.63058(A)10CCCGTCTCAAATTCTCAGCCA60.33921CGAAATGCCAGCGTTGTTCA60.04120213–224
KSSR26Cluster-5711.44096(CAGGCA)6ACCTCTCTCTGTGTTTCCGC59.68120CCAGTCACCAGCACGTACTT59.96620209–234
KSSR28Cluster-5711.58049(A)14CATTGCCTGCCAGACCAAAC60.03820GGTGTCCACATGGTATTCGGT60.06621216–235
KSSR31Cluster-5711.40164(A)11TGAGGCCCTCTGAGGCTAAT60.03120CGACGACTCTAACAAGCGGT60.1120203–245
KSSR37Cluster-5711.78093(T)12GCAGACTGCAGAAGACCCTT59.96420TCTTTCTCACCACAGTTGACA57.09521230–249
KSSR38Cluster-5711.5810(CT)6AAACGATGTCAGGCGTCAGT59.96620CACTGTGTGGCGTGTTTCAG59.97220229–250
KSSR40Cluster-3733.0(C)11TGTGCTCTGTACTGGCAAGT59.24120GCATGAACTCAACTCCCCGA60.03620242–262
KSSR41Cluster-5711.54732(A)14GCAGGGGTGGGGTTGTTATT60.25220ACAGGAGAGTGTGGGGAGAA59.80920246–261
KSSR43Cluster-5711.50385(A)10TGTTGGCAGCCTATGAAGCA59.96220CGGTTTGGGGGAGCAAAGTA60.25120120–127
KSSR44Cluster-5711.47108(T)10CAACCAGTACTCTACCGGCC59.82520GAACAGTTGGGAGGACTGCA59.89120247–267
KSSR49Cluster-5711.50393(A)10TGTTGGCAGCCTATGAAGCA59.96220CGGTTTGGGGGAGCAAAGTA60.25120252–276
Disclaimer/Publisher’s Note: The statements, opinions and data contained in all publications are solely those of the individual author(s) and contributor(s) and not of MDPI and/or the editor(s). MDPI and/or the editor(s) disclaim responsibility for any injury to people or property resulting from any ideas, methods, instructions or products referred to in the content.

