1. Introduction
Currently, the building industry, construction, and operation phase together with other phases of a structure life cycle, such as refurbishment, disposal, waste processing and landfilling, contribute to significant environmental degradation on Earth [
1,
2,
3]. According to reports, building operations account for approximately 28% of total CO
2 emissions each year. The actual construction process, known as the embodied carbon of a building, accounts for about 11% of CO
2 emissions, while transport accounts for 22% of global carbon emissions and industry is responsible for 30% of CO
2 emissions annually [
4]. The aim is to minimize emissions from buildings throughout their entire life cycle [
5]. In both economic policy and research, the emphasis is mainly on minimizing emissions and bad effects on the environment, especially in the phase of building use [
6,
7,
8,
9,
10], since this is where the highest percentage of emissions is produced. There are only few specific studies on reducing the negative impacts in other phases of the building life cycle [
11,
12,
13]. However, in total, these emissions will also reduce the unfavorable result of the production of emissions. In environmental assessment of buildings, such as LEED and BREEAM, the best assessments can be obtained if stages with a smaller number of credits, including the construction phase, are also well rated [
14]. Otherwise, it is not possible to obtain gold and platinum grades, or excellent and outstanding assessments, at BREEAM. For example, within the overall assessment of building by the Common European Sustainable Building Assessment (CESBA) methodology, it is possible to obtain 200 points for a high-quality construction planning process [
15]. Therefore, the analysis and comparison of the environmental impacts of all phases of the life cycle is crucial when optimizing the energy use and emissions of the building’s life cycle [
16,
17,
18]. Slovakia still remains one of the most energy-intensive economies in the European Union. The environmental strategy Envirostrategy 2030 has recommended that the future public resources in construction should be to a greater extent directed to cost-effective areas of energy efficiency of buildings, construction, and housing [
19]. Construction efficiency can also be defined as the reduction of the construction phase and, as a result, the time spent on the construction site and the duration of any unfavorable impact of the construction process on the site surroundings. This is also why a new approach to ensuring sustainability in the entire construction sector, and thus also in the construction phase, has been a trend for a long time. However, the current social, economic, and environmental trends are still not sustainable enough [
20]. According to Hans Bruyninckx, EEA Executive Director [
21], Europe’s environment is currently at a tipping point. For the next decade, we have only limited opportunities to step up action to protect nature, mitigate the effects of climate change, and radically reduce our consumption of natural resources. “Europe will not achieve its 2030 goals without urgent action during the next 10 years to address the alarming rate of biodiversity loss, increasing impacts of climate change and the overconsumption of natural resources. The European Environment Agency’s (EEA) latest ‘State of the Environment’ report states that Europe faces environmental challenges of unprecedented scale and urgency.” [
21]. Climate change, air pollution, and exposure to excessive noise continue to raise concerns about human health. The effect of fine solid particles is responsible for approximately 400,000 premature deaths in Europe annually, while the countries of Central and Eastern Europe, including Slovakia, have been affected by a disproportionately higher number. The air pollution from construction activities (CO
2 eqv.), dust (fine solid particles), chemicals, excessive noise, vibration, and waste are undesirable secondary products arising throughout the life cycle of structures. Contractors should be able to assess the risks of carbon dioxide emissions that arise during the construction and use of the structures. In this way, it is possible to ensure change and achieve a reduction in CO
2 emissions. “The ongoing effort of the Slovak Green Building Council is to significantly reduce the share of buildings in the total consumption of resources and the generation of negative impacts. The report of the Intergovernmental Panel on Climate Change (IPCC) has encouraged the society to more ambitious goals than those ratified by the Paris Agreement in 2015.” [
22,
23].
The transparent international certification rating systems for sustainable buildings that are used in Slovakia, such as Leadership in Energy and Environmental Design (LEED) and the Building Research Establishment Environmental Assessment Method (BREEAM), apply evaluating criteria for energy consumption, impact on the atmosphere, water management and, last but not least, the quality of the indoor environment. Toward certification, the rating systems provide flexibility for earning points by initially crediting in several categories; one of these is “Sustainable sites”. In the English BREEAM certification system, in the Management section, a building can earn credits for “Responsible construction practices” and “Construction site impact”. The essence consists of demonstrable improvement in sustainable properties of the building, starting with its design, implementation, and use, including demolition. Lee and Skorski [
24] analyzed LEED-certified retail stores, where sustainability of the construction site during the construction phase was one of six LEED assessment categories. Project managers can affect at least 14 of the 22 credits in the Management category, which includes construction site operations. For the effects of the construction site, five credits are awarded.
Kang proposed and implemented a rule-based LEED evaluation method with Building Information Modeling (BIM) [
25]. Plebankiewicz et al. [
26] analyzed and discussed the trends related to green certification of office buildings. With reference to Taemthong and Chaisaard [
27], to adopt gold and platinum levels of certification in LEED, it is necessary to focus on reducing the construction costs, including the costs of temporary construction site facilities, which can also be ensured by shortening the time of the site operation.
“More than fifty buildings here in Slovakia that have gained a sustainability certificate are an evidence that the share of energy-efficient buildings providing users with a healthy indoor environment, increasing employee productivity, and reducing morbidity is on the rise here. These buildings have also gained credits for a sustainable construction site.” [
21]. According to the executive director of the Slovak Green Building Council (SGBC), almost all newly built office buildings in Bratislava have gained a sustainability certificate. In order to achieve the best possible ratings, it is also necessary to focus on sustainable construction on the construction site. Based on the statement of the SGBD, regulations exist but their application in practice is rather low. The Civic Association “Buildings for the Future” has reported that 11% of newly built family houses in 2017 did not meet the minimum legal requirements for buildings in the area of energy efficiency [
21]. Such buildings have not even met the demands for construction site sustainability. In order to help achieve the goal of limiting global warming to 1.5 °C, the Slovak Green Building Council has been focusing on various activities to support compliance with existing legal standards, to support innovation, to ensure sustainability, and to encourage local governments when renovating the buildings [
21,
22,
23].
The World Green Building Council (WGBC) and the International Energy Agency (IEA) have estimated that to limit global warming below 2 °C it is necessary to reduce the carbon footprint of the urban environment by 86 billion tons. In built-up areas, CO
2 emissions must be reduced by 80% and all newly constructed buildings must achieve zero CO
2 emissions by 2050. In order to achieve these goals, changes are necessary in the actual construction and renovation of buildings, as well as in their financing, valuation, procurement, and management [
28,
29].
The construction contractors are responsible for planning construction site operations. The construction site layout plays a decisive role in the energy consumption during construction and in compliance with the principles of sustainability [
30]. Project managers should strive for the optimal layouts of temporary construction site facilities, such as storage areas, production areas, and other equipment [
31]. Prefabrication can be useful in ensuring a shorter time of the construction site operation and thus a shorter time of the adverse impact of construction works on the surroundings of the site. The concept of off-site or prefabricated construction has been considered to be an effective alternative to traditional on-site construction. Over recent decades, it has gained a growing amount of attention as a way to advance sustainable construction [
32]. To ensure sustainability and reduce emissions in the construction industry, various technologies and materials that would reduce the adverse effects of construction on the environment have emerged or been rediscovered. On-site construction methods are being replaced by off-site construction technologies [
33,
34]. The international standard ISO 21930:2017 provides the requirements to develop an environmental product declaration (EPD) for construction products and services, construction elements, and integrated technical systems used in any type of construction works [
35]. According to the Intergovernmental Panel on Climate Change (IPPC), it is important to provide scientific guidance for strategies to enclose climate action about how to optimize choices that maximize benefits for multiple dimensions of sustainable development [
23]. To ensure maximal energy efficiency and minimal impact on the environment, it is important to consider sustainability in the pre-project phase of investment process [
36,
37]. In the design phase, it is possible to influence the time of construction site operation by adopting industrialization and prefabrication [
38,
39].
The presented study deals with the implementation phase of buildings on site, as one of the building life cycle phases, which is generally responsible for around 11% of CO2 eqv. Specifically, it is concerned with the analysis of construction site operation, with the aim of minimizing the construction time, thereby achieving the greatest possible reduction in the time of the negative effects of the construction process and the construction site on the environment. There is also a proposed set of steps that are intended to assist a contractor and a construction project manager in the pursuit of technologically and organizationally possible shortening of construction site operations while the project is still in the pre-project phase of construction. This should help in estimating the reduced time of construction site operation for both investors and the construction contractor. Each shortening of construction site operation time can contribute to achieving the sustainability pillars (social, economic, and environmental) that are necessary to meet the environmental and political goals by 2030, presented by the European Environmental Agency to the European Commission.
In the current phase of the research, the impacts on sustainability have not yet been measured by any specific values. However, we have covered the context and general dependencies that the reduction of construction site operation time indisputably leads to in terms of the sustainability of the construction. This sustainability has three pillars—economic, environmental, and social.
Regarding the economic pillar, if the time of construction site operation is shortened, the total construction costs will be reduced (e.g., the costs of construction machine rental will be reduced due to a smaller number of renting days; the same applies to the costs of renting social and administrative unimo cells, the costs of renting a scaffolding system and fences, etc.).
Regarding the environmental pillar, if the time of construction site operation is shortened, the environment will be saved for longer (e.g., air pollution by CO2 emissions eqv. from the operation of construction machinery will exist for a shorter time). The social pillar is about maintaining or improving people’s well-being. Regarding the social pillar, if construction site operation time is reduced, people living near the construction site will experience fewer dusty days and fewer noisy days due to vibrations from construction site operations. Construction site operations also entail various traffic restrictions or full road closures (e.g., changes in traffic organization due to construction). Since living in the vicinity of a construction site in which the construction process lasts for several years is not enjoyable (due to the above reasons), an optimal shortening of construction site operation time is more than welcome.
2. Materials and Methods
The aim of the research is to formulate the relationship between time of construction site operation and the size of the building constructed on the site. Using the relationship obtained in this way, it will be possible to easily determine the time of construction site operation, without the need for time-consuming construction time planning/scheduling in the pre-project planning phase. This construction time should be included in the work contract. The core of the research was executed based on the following methodology: the function of estimating the construction site operation time with the relevant confidence intervals was defined and, then, steps to optimize the time of construction site operation were proposed in the spirit of the sustainability pillars. Within this methodology, the following scientific methods were applied: theoretical analysis of issues related to construction planning and implementation, data survey of construction companies, comparison of given data, correlation and regression analysis, data synthesis, and generalization of the effects of the proposed steps I–XI.
The subject of the research is represented by buildings that were constructed in Slovakia. Data on the duration of construction site operation were taken from construction contractors and were obtained by surveying the construction market. Specifically, the segment of residential buildings is included in the study (
Table 1). The Real Site Operation Time (RSOT) was compared with the Theoretical Site Operation Time (TSOT), which was determined using Contec
® software [
40]. This Czech software is an automated system for pre-project planning and management of construction projects. The system was the only software awarded with an honorable mention at the Grand Prix competition of the exhibition For Arch 2000. The system was also the only software that received an honorable mention in the competition for the Innovation of the Year 2004 award in the Czech Republic.
Contec® works similarly to the most popular project management software, Microsoft Project (MS Project). However, MS Project is used to create schedules, project plans, and manage resources in any industry, not only in construction (e.g., business projects, military projects, etc.). Contec® is intended exclusively for the construction industry. The software incorporates standardized network diagrams, which were obtained by averaging and generalizing the most recurring similar features of scheduling the different types of construction projects. Due to the above-mentioned database, when creating a schedule with the help of Contec®, it is possible to use a standardized network diagram and modify and model it according to any requirements and boundary conditions. The standardized network diagrams are computer files containing the whole construction process of individual types of buildings, links between construction works, and volumes of the most important construction works that usually occur when constructing a building of individual type. There are more than 50 types of such diagrams in Contec® and, to create a construction schedule, the diagrams are easily modifiable according to the spatial structure of a specific building and according to its size (building volume in m3).
The automated process of time scheduling uses network diagrams developed to model construction implementation; this is based on the modular network planning method and uses node-defined network diagrams. Using the input of time links between construction processes, the standardized (partially repeatable) network diagrams were developed. The software was developed in the Czech Republic. Regarding the geopolitical situation in the past, until 1993, Slovakia was part of Czechoslovakia. Due to globalization, the construction methods and construction processes in both Slovak Republic and Czech Republic, as well as in neighboring countries, are almost identical. There are large-scale international construction companies operating in the European construction market, e.g., Metrostav, Strabag, and Takenaka. These companies apply Contec® software to develop construction schedules for public procurement needs, where project schedules are required even in the pre-implementation phase of construction projects.
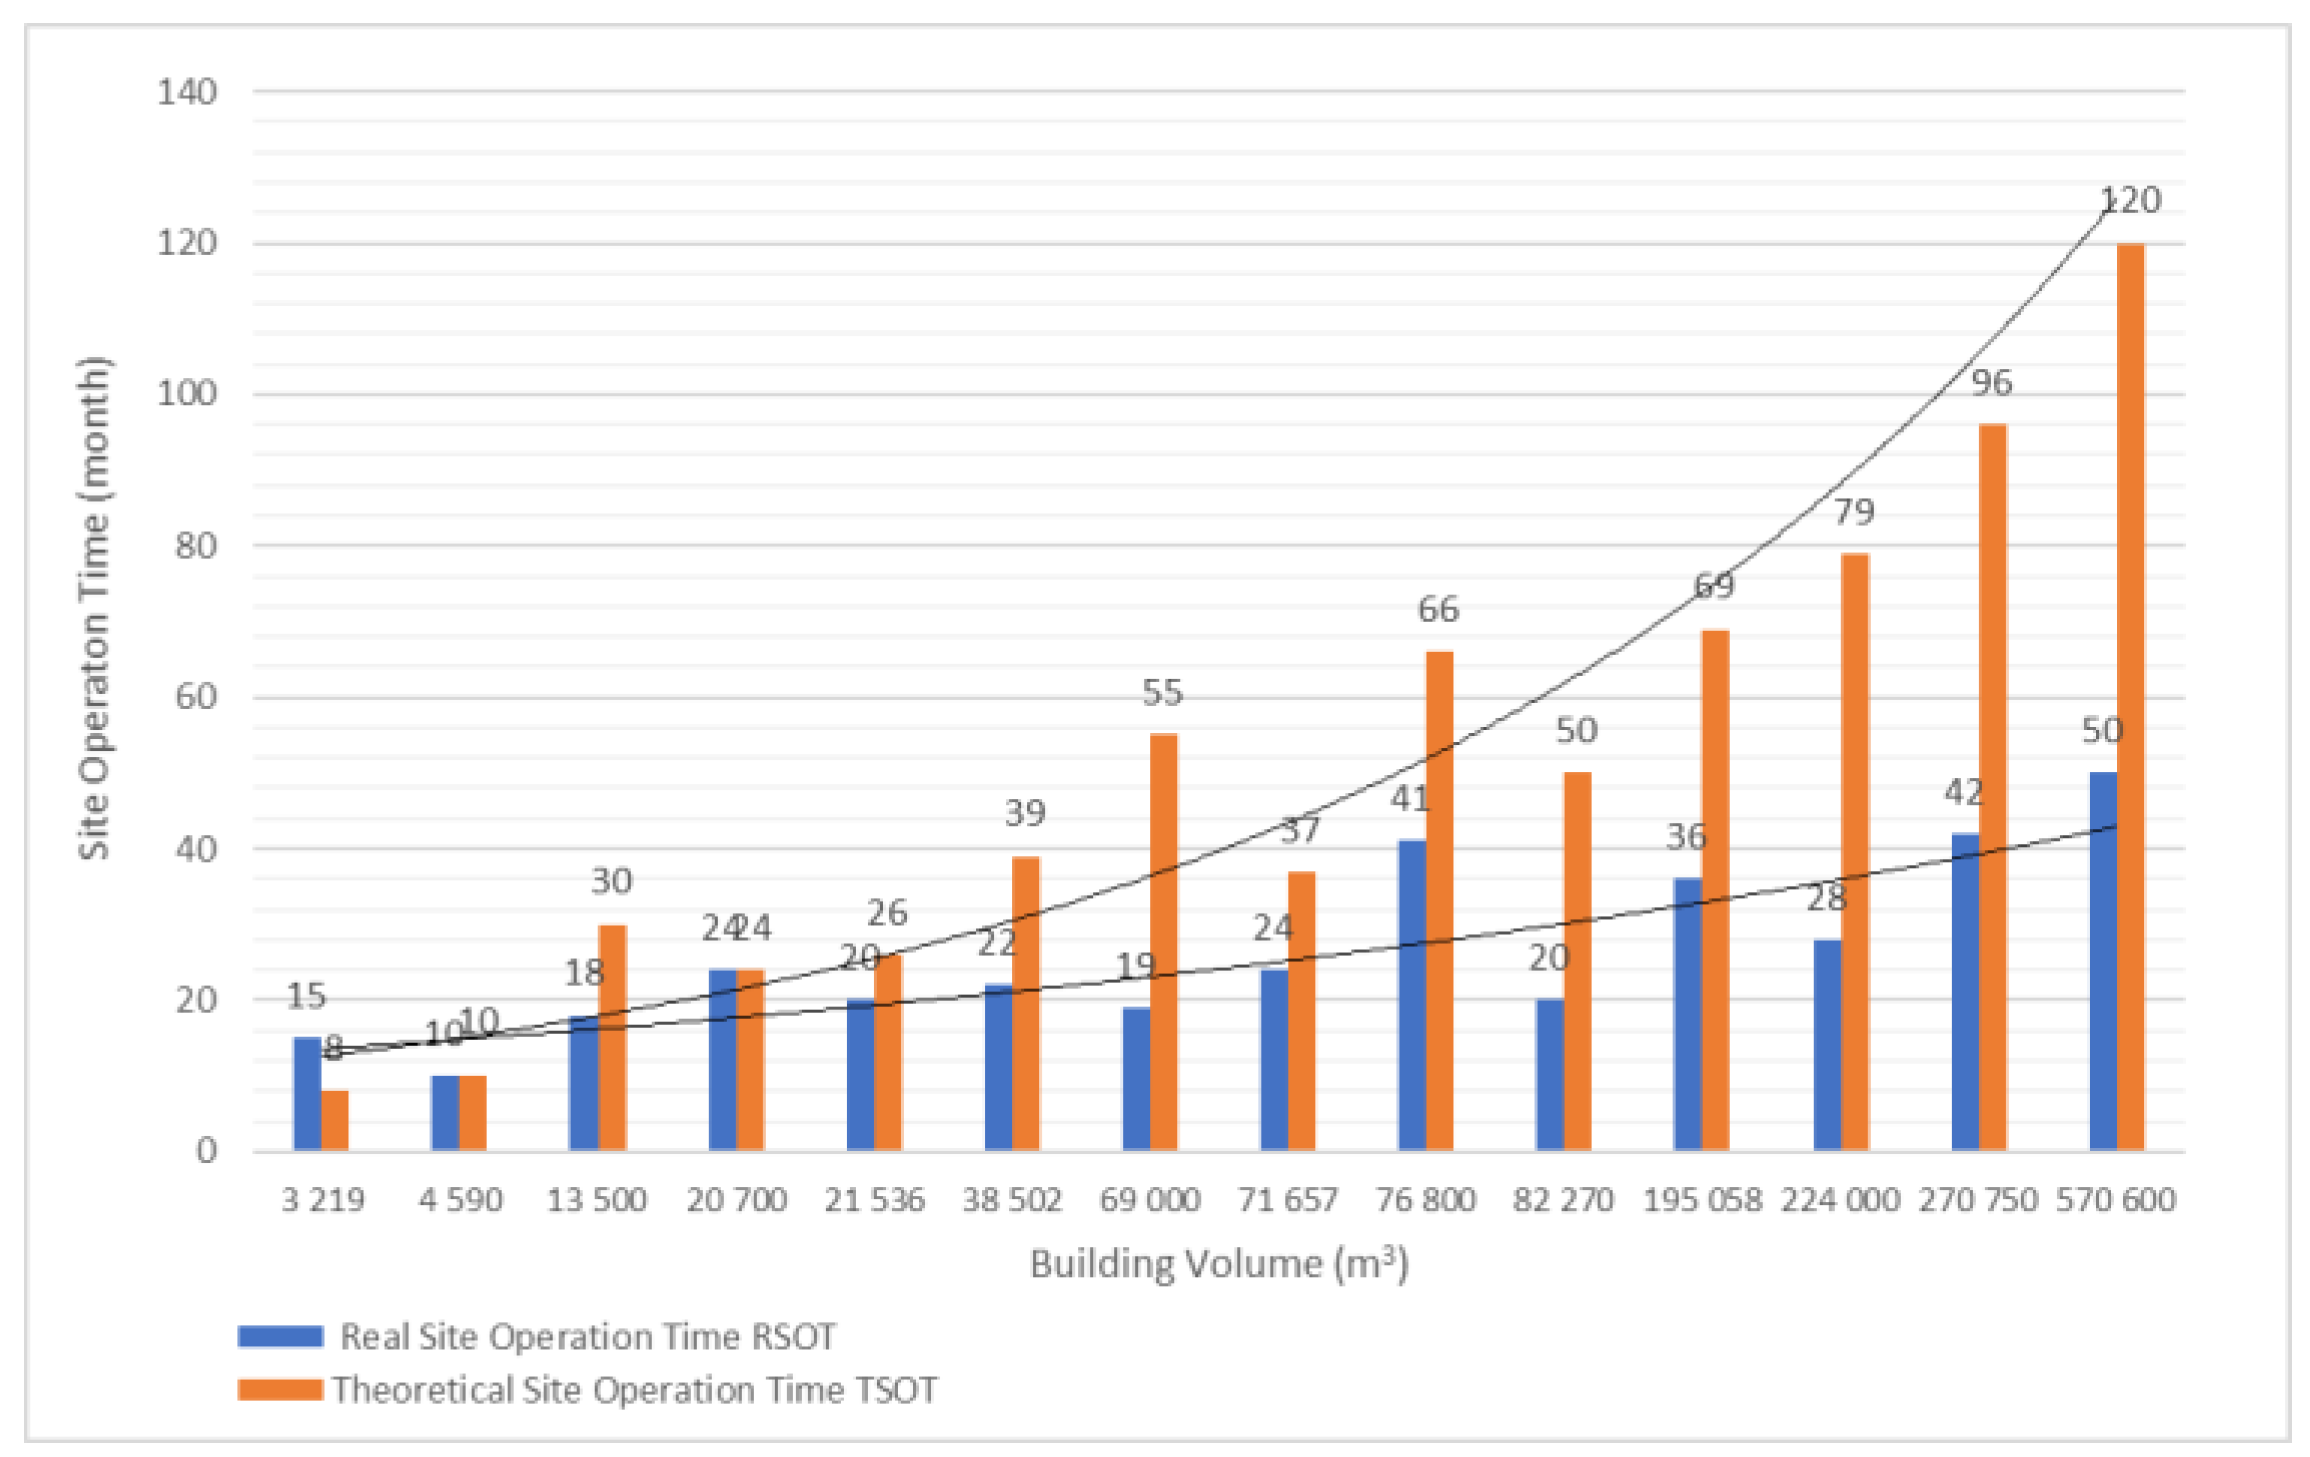
To estimate the TSOT, standardized network diagrams from the software database are applied. The TSOT was estimated for each building from the examined sample of buildings. The main goal of this research is to analyze the RSOT of construction projects in Slovakia in the context of construction sustainability aspects. It is necessary to provide an opportunity to both the contractor and the client to obtain high ratings in environmental certification systems (e.g., LEED or BREEAM) through minimizing construction site operation time. Each construction site definitely affects its surrounding environment (e.g., noise, dust, and vibrations), so it is good to minimize the time of construction site operation to the greatest extent possible. The construction of residential buildings in Slovakia is analyzed in the presented study. The research sample included fourteen buildings from the mentioned segment of buildings. The segment is suitable for expert modeling of construction schedules. Based on the change in technological, human, and time resources, the updated construction time is calculated through standardized network diagrams available in the Contec® software. The TSOT is the construction time that is determined based on the standardized network diagrams.
Figure 1 presents the residential buildings with the values of their building volume, the theoretical site operation time, and the real site operation that was actually achieved in practice when constructing the included residential buildings.
2.1. The Dependence of Theoretical Site Operation Time and the Buidling Volume
First, we examined whether there is a dependence between the building volume and the theoretical site operation time. The existence of the dependence of the two variables was studied using the statistical LOGEST function. The LOGEST function is based on the formula:
where: x
TSOT—theoretical site operation time, y
BV—building volume, m and b—searched constants of the regression function
The statistical characteristics matrix for the LOGEST function is as follows (
Table 2):
The dependence between the building volume and the TSOT, found using the formula proposed by us, will make it possible to determine the theoretical site operation time.
The degree of mutual relationships was quantified with the examined value of the coefficient of determination r2 (the value is presented in the results). To detect this dependence, the F-test was applied. The following hypotheses were proposed:
Hypothesis H0. There is no relationship between TSOT and BV.
Hypothesis H1. There is a relationship between TSOT and BV.
The test: if F > Fdist, then H0 is rejected.
Fdist—the designation of Fischer’s test if statistical functions in MS Excel are used [
43].
Afterwards, the confidence intervals of the residential buildings segment curve are determined. In the regression Equation (2), the vertical deviation of the curve is provided by the parameter b. Therefore, it is necessary to calculate the value of parameter b1, providing the lower limit of the confidence interval for the regression curve, the value of parameter b2, providing the upper limit of the confidence interval for the regression curve, the value of parameter b3, providing the lower limit of the confidence interval around the regression curve, and the value of parameter b4, providing the upper limit of the confidence interval around the regression curve.
To calculate the confidence intervals, the first step is the transformation of the exponential Equation (1) into a linear Equation (2) based on Formula (3).
Subsequently, the confidence intervals of the curve were determined using the following equations:
The deviation
P for the regression curve:
where
n represents the number of buildings in the sample, s =
,
–this value is taken from the Student’s t-Distribution Table.
By subtracting the deviation P (4) from the value b′ we obtain the value b1 and after adding the deviation P (4) we obtain the value b2.
By back-transforming the linear equations into exponential equations, we obtain Formulas (7) and (8).
To draw a confidence interval, we selected several values of x and calculated y following Equations (7) and (8). By connecting these points, we obtain the lower and upper limits.
The deviation
O around the regression curve:
By subtracting the deviation
O (9) from the value b′ we obtain the value b3 and by adding the deviation O (9) we obtain the value b4.
By back-transforming the linear equations into exponential equations, we obtain Formulas (12) and (13).
To draw a confidence interval, we selected several values of x and calculated y following Equations (12) and (13). By connecting these points, we obtained the lower and upper limits.
Both clients and contractors can read the theoretical value of the needed time of site operation in the graph drawn in this way. Thus, in the preparatory phase of construction, they can decide what measures should be applied to minimize the time of site operation. If the construction site operation time is within the confidence intervals, it can be changed and optimized to be shorter by applying some steps.
2.2. Steps to Reduce the Construction Site Operation Time
In order to reduce the theoretical site operation time and, thus, also the impact of the construction site on its surroundings, several steps were proposed, e.g., increase in labor resources, increase in labor pool hours, and their combinations (
Table 3).
The impact of the proposed steps on the TSOT was modeled through Contec® software. Following the changes in technological, human and time resources, the updated time of construction site operation was calculated through standardized network diagrams, according to the proposed steps.
The steps were not applied to the RSOT due to the fact that it is the right time of construction site operation, which had already been achieved by the contractor in practice. In the Contec® software database, the average number of workers in the work crew is given for individual professions. For each structure, according to its complexity, an indicative number of workers is given, determined on the basis of experience from past constructions of residential buildings. For example, a base crew for the masonry of perimeter walls involves 15 workers; a base crew for waterproofing works involves 2 workers. The step “adding two more workers to the work crew” means 2 workers on average, e.g., it is necessary to add 4 workers to some structures, to some other structures only 2 additional workers, and to some other structure no one is added (i.e., 4 + 2 + 0 = 6/3 = 2 workers on average, if only three structures are considered).
3. Results
The results of the study, the aim of which was to determine the mathematical relationship between the theoretical site operation time and the volume of the building, are presented in the following part of the paper. These results can be useful in estimating the theoretical site operation time of future construction projects. Thus, the participants of the construction project can, in the preparatory phase of construction, decide on the need for measures to shorten the construction time and, thus, also the time of construction site operation. Such shortening will directly ensure a reduction in the adverse impact of construction (dust, emissions, noise, and vibration on the environment. It is advantageous to minimize construction site operation time as much as possible, while adhering to all technological principles of the construction process. The aim of this effort is to find out this construction site operation time in advance and to decide on its shortening through the aforementioned steps I-XI even before the start of construction. By minimizing the impacts of construction site operation on the environment, it is possible to achieve a better rating of the building within the certification systems (LEED, BREEAM, etc.).
3.1. The Discovered Dependence of Theoretical Site Operation Time and the Buidling Volume
The discovered dependence between the volume of the building and the time required for the operation construction site (the proposed formula) allows determination of the time of a construction site operation. Based on the studied sample of buildings from the segment of residential construction projects, the following was found:
The coefficient of determination r
2 = 0.880 (
Table 4) signifies a high degree of mutual dependence. The result of the F-test that was applied to detect the dependence:
The value F = 88.25 (
Table 4). The value Fdist(v1,v2) is taken from mathematical tables of critical values Fm, of normal distribution at α = 0.05. The calculation of v1 and v2 is as follows: v1 = n – df -1 = 14 – 12 – 1 = 1; v2 = df = 12, where n = 14 (number of buildings in the sample under study), df = 12 (degrees of freedom,
Table 4); then, Fdist(v1,v2) = Fdist(1, 12) = 4.75, which is the value taken from the mathematical tables of critical values Fm, of normal distribution at α = 0.05. Thus: if F > Fdist(v1,v2), H
o is rejected
since 88.25 > 4.75 – H
0 is rejected, thus there is a relationship between TSOT and BV.
Based on the above, the regression function is as follows:
After adjustment and substitution of constants from
Table 4, the function of the regression curve (14) for the estimation of x
TSOT for the segment of residential buildings is expressed in the form as follows:
Note: xTSOT—theoretical site operation time, yBV—building volume, m and b—searched constants of the regression function
To estimate the theoretical time of construction site operation in the pre-project phase of residential buildings construction, the dependence Formula (15) can be applied (
Table 4). Such informative data on construction site operation time can be appreciated by both the clients and contractors of the planned construction projects.
Subsequently, the confidence intervals for the regression curve and the confidence intervals around regression curve were calculated.
The values from
Table 5 and
Table 6 are presented in the graph of the dependence of site operation time on building volume (
Figure 2). Both the equation and the graph can be used to estimate the construction site operation time based on the specified size of the planned building (expressed by the building volume).
All buildings are the same in that they are residential. The extensive range of building sizes, represented by the building volume (in m3), points to a very important fact; that is, in the case of buildings of a similar size, the construction times are almost identical. Hence, the relationship between construction time and building volume appears to be linear. Only in the case of a wide range of building volumes is the relationship exponential. This means that contractors are able to build almost any large residential building in about two years. The parameter “Number of floors” will only be used when developing an individually based time schedule, e.g., through MS Project software. Similarly, the construction method (i.e., gradual, takt-time, or parallel construction method) is not directly considered in the current relationship, although the construction method also affects the construction time and thus the time of construction site operation. In the Contec® software applied in the current study, the segment of residential buildings was selected. The software defines the spatial analysis of high-rise buildings, and thus the takt-time method of construction is assumed. Thus, these parameters are automatically and indirectly included in the current study.
The graph can also partially indicate how long the construction burdens the surrounding environment. In contracts for work, contractors undertake to comply with a certain construction time and, thus, a certain time of construction site operation, indicated as RSOT in the presented study. The question is how they can achieve such a time if the TSOT is always much longer, as evident from the study. The TSOTs in the segment of residential buildings are taken from the Contec® software, where, with the help of standardized network diagrams, it is possible to determine the time of construction site operation depending on the building volume. The construction site operation time obtained in this way is called the reference construction site operation time. Furthermore, the steps to achieve a reduced time of construction site operation were proposed.
3.2. The Impact of the Proposed Steps on Changes in TSOT
In this section, the article deals with the application of the steps (mentioned in
Section 2.2) to the model for reducing construction site operation time.
The impact of the proposed steps to reduce the TSOT was analyzed with the help of standardized network diagrams using Contec
® software. All of the eleven steps were applied to the construction projects under study. The eleven proposed steps for reducing the TSOT were applied to ten selected construction projects from the projects introduced in
Table 1. The four remaining buildings were used to verify the results of the discovered relation between the TSOT and BV. The resulting times of construction site operation are presented in
Table 7 and
Figure 3.
Table 7 shows the resulting values of the construction site operation time after applying the steps I-XI. For all the buildings, the construction site operation reduction is presented in months and in percentages. The required reduction due to compliance with the construction contract time is the number of months by which the TSOT must be reduced compared to the RSOT. This is also presented in months and in percentages. For better clarity, the data from
Table 7 are graphically displayed in a bar chart (
Figure 3); for example, a 17% reduction in construction site operation time by applying “Step I” in the construction of the Residential house in Dunajska Kosice. The 17% reduction is calculated based on the number of months by which the time is reduced, which was 11 months. The TSOT was 66 months. After applying “Step I”, the time was reduced by 11 months to the resulting 55 months.
In the case of the smallest (as for the BV) of these constructions, “Multi-Purpose House Poprad”, the necessary shortening of the TSOT was already achieved after the application of step “III” (seven-day working week), even with a reserve of one month. By applying the other steps “IV”-”XI” it was possible to reduce the construction site operation time by a final 62%. In the cases of constructions with a BV up to approximately 75,000 m3, it was possible to achieve the RSOT (based on the real construction time) through application of the steps “IV”, “VI”, “VIII”, “IX”, “X”, and “XI”.
The application of the proposed steps demonstrated a reduction in construction site operation time with varying intensity. As a result, it can be stated that the given steps can ensure the minimization of construction site operation time to the necessary extent, which may be determined in the early project planning phase. This will ensure the reduction in adverse effects (noise, dust, emissions, production of CO2 eqv., etc.) on the environment in the immediate vicinity of the construction site. At the same time, construction contractors will be able to ensure the achievement of a high score within the framework of environmental certification systems (LEED, BREEAM, etc.) for a sustainable construction site due to minimizing the duration of negative effects (noise, dust, emissions, production of CO2 eqv., etc.), and the reduction in the construction site operation cost.
The results of the analysis of the application of individual steps to shorten the TSOT are as follows:
By adopting step “I” in this segment of construction, it is possible to achieve an average reduction in construction time by 17%, as evident in the graph (
Figure 4).
By adopting step “II” in this segment of construction, it is possible to achieve an average reduction in construction time by 15%, as evident in the graph (
Figure 4).
By adopting measure “III” in this segment of construction, it is possible to achieve an average reduction in construction time by 26%, as evident in the graph (
Figure 4).
By adopting measure “IX” in this segment of construction, it is possible to achieve an average reduction in construction time by 56%, as evident in the graph (
Figure 4).
Generally, in
Figure 4, the average reduction in construction time of 17% after applying “Step I” represents the average reduction in construction time after applying “Step I” in all the residential buildings.
The effects of the adopted measures are similar within the segment of residential buildings; therefore, the calculated values are presented as average values. The effects of the measures are in the range of 15–65% in this segment.
3.3. The Model Situations
In the segment of residential buildings, by applying the proposed steps in the model, three model situations also occurred: A—the theoretical time of construction site operation became shorter than the real time of construction site operation; B—the theoretical time of construction site operation became identical to the real time of construction site operation; or C—the theoretical time of construction site operation became closer to the real construction site operation time.
Situation no 1:
In the case of the construction of “Multipurpose house Poprad”, the reduction in the TSOT was achieved by applying step “III”, which reduced the TSOT from 20 to 19 months. By applying other steps, the TSOT was reduced to 10 months (
Figure 5).
Situation no 2:
In the case of the construction of “Residence Tower” (
Figure 6), the TSOT was 79 months and the RSOT was 28 months. The required reduction was 51 months, which was achieved using measure “XI”, when the TSOT became identical to the RSOT, i.e., the above-mentioned 28 months.
Situation no 3:
In the case of the construction of Lake Side park 01 Bratislava (
Figure 7), taking any step failed to achieve the RSOT, as the TSOT was 120 months. The biggest reduction was caused by measure “XI”, which was a reduction of 84 months (
Figure 7). In this model situation, some other steps must be proposed to successfully achieve construction time reduction.
4. Discussion and Conclusions
The aim of the research was to find out whether there is a dependence between the size of a building and theoretical time of construction site operation. If such a dependency exists, the investors and construction contractors will be able to predict the time of construction site operation, even in the early stages of pre-project planning. In the early pre-project planning phase, only information about the building volume is available. The study dealt with the construction of residential buildings.
Currently, it is necessary to undertaken the construction of buildings in accordance with the principles of sustainable construction. Sustainability includes several sub-topics, such as thermal performance, passive solar design and natural ventilation, energy efficiency, lighting, and sustainable construction on site [
36,
44]. Based on the results of the presented study, it can also be concluded that one of the conditions of sustainability in the implementation phase is that the construction time is planned to be only as long as is really necessary. By minimizing the time of construction site operation, the negative impact of the construction (dust, noise, vibrations, etc.) on its surroundings is minimized.
The presented study emphasizes the reduction in construction site operation time. Minimizing the adverse effects on the surrounding environment is also related to this. From a life cycle point of view, Sundanayake et al. [
37,
45] found in their research that emissions in the construction process stage are often neglected due to their low values compared to the high emissions in the use stage of buildings. However, these construction process impacts can be significant at national and local levels. Similar to our study, they also developed their own calculation tool to make better decisions in the pre-project phase when planning resources such as human resources, machines, or material. In this way, construction cost, construction site operation time, adverse effects of construction site operation, and other demands of the construction process are optimized. The presented study provides an insight into the time of construction site operation in the segment of residential buildings in Slovakia and the current possibilities to minimize the time of construction site operation.
As Girmscheid, G. [
46] demonstrated in his research, in addition to the measures proposed by us to reduce the construction time, it is necessary to pay attention to selection of appropriate technological methods, to have a sufficient amount of qualified labor available, to think about good logistics, and to ensure sufficient material resources. His study proved how an effective contract can reduce execution costs and times, allowing the contractors to reduce their own costs, gain significant competitive advantages, and actually achieve or even exceed targeted results. Furthermore, when employees can concentrate on their own work performance rather than being preoccupied with other issues, they are more motivated. Similar to the presented study, other authors [
47,
48,
49,
50] have also concluded that the methodology of the LEED rating system should consider issues related to the construction process, and should include a scoring based on the duration of the construction process and, thus, the time of construction site operation. The construction industry also greatly affects the environment through the exploitation of natural resources. An efficient use of resources is important from a sustainability point of view [
51]. The presented study claims that construction site operation causes adverse effects on the surrounding built environment.
Reduction in construction time and, thus, the construction site operation time, can also be achieved by adoption of robotization in the construction process. For example, the Robotic Hot Wire Cutter (RHWC) technology is proposed for construction of concrete structures, and fully corresponds to the aspects of the Industry 4.0 concept [
52]. In our future research, robotization can be introduced as one of the next steps to reduce the construction time and, thus, the time of construction site operation.
In order to ensure the trend of sustainability, it is necessary to implement all partial steps precisely. Only then will an entire project be a success and will a truly sustainable solution be able to be provided.
The main objective of this research was to analyze the construction time of residential buildings in Slovakia with regard to the partial parameter of construction sustainability, which is the sustainability of the construction site. The construction time has a direct effect on the duration of the construction site’s negative impact on its surrounding environment; therefore, it is advisable to minimize it as much as possible. The implementation phase of the construction project, including the time of construction, is one of the evaluation areas when obtaining credits in environmental evaluation systems (such as LEED, BREEAM, and DGNB). Due to the impact of construction on the environment, the effect of shortening the construction time by adopting several technological steps was analyzed. The results can be a good basis for a tool to plan a sustainable construction site that affects its environment only during the necessary construction time.
Figure 2 also partially indicates how a long construction process burdens the surrounding environment. In construction contracts, the contractors undertake to comply with the RSOT. As demonstrated in the presented study, theoretical construction times are much longer. Therefore, it is questionable how they can achieve construction times that are confirmed in construction contracts. The theoretical construction times were estimated with the help of the Contec
® software, where standardized networks diagrams can be applied to estimate the construction time based on the building volume. Then, the steps were proposed to ensure the reduction in construction time. In this way, contractors can ensure the shortening of construction site operation times. Based on the time of construction site operation, the time during which adverse effects are caused by the construction site on its environment (dust, noise, vibrations, etc.) will be reduced. Thus, the contractor can contribute to obtaining a higher scoring of the building within environmental rating systems, such as LEED or BREEAM.
In order to reduce the construction time and, thus, shorten the construction site operation time, it is beneficial to adopt modular construction as one of modern methods of construction. Unfortunately, clients in Slovakia do not show much interest in this construction method. In Slovakia, modular construction is encountered mainly in constructions of a temporary nature to cover a short period of time. Although this mainly depends on the will of investors, the mindset of investors can change over time.
The aim of the research was to formulate the dependence between the construction site operation times and the sizes of the residential buildings. Using this relationship, the time of construction site operation can be easily estimated, without individual processing of the schedule, which is unnecessarily time-consuming in the pre-project planning phase. The time, estimated in this way, should be included in the work contract between the contractor and client. The core of the research was performed with the following methodology: the function for estimating the time of construction site operation with the relevant confidence intervals was defined and steps were proposed to optimize the time of construction site operation in the spirit of the sustainability pillars. Within this methodology, the following scientific methods were used: theoretical analysis of the issue of construction planning and implementation, data research in construction companies, comparison of given data, correlation and regression analysis, data synthesis, and generalization of the effects of the proposed steps I–XI.
As a country of the European Union, Slovakia shares its eastern border with Ukraine, which is currently at war with Russia. Unfortunately, many buildings, including residential buildings, have already been destroyed. After the end of the conflict, it is assumed that Slovak construction companies will be involved in the renewal of the housing stock in Ukraine. In these construction projects, there will also be an opportunity to apply the dependency formula determined in the current research, which is useful for fast and simple estimation of construction site operation time. The construction times estimated in this way should be covered in construction contracts. Slovakia is also a member of the V4 group. Due to globalization, within the V4 countries and the EU countries, the same construction methods, machinery, etc., are used. This enables the use of the dependency formula determined in the current research even beyond the borders of Slovakia.


