Article

Experimental and Numerical Investigation of the Anti-Overturning Theory of Single-Column Pier Bridges

1
Heilongjiang Transportation Investment Engineering Construction Co., Ltd., Harbin 150040, China
2
School of Transportation Science and Engineering, Harbin Institute of Technology, Harbin 150090, China
3
Northwest Branch of China Construction Eighth Engineering Bureau Co., Ltd., Xi’an 710075, China
*
Author to whom correspondence should be addressed.
Sustainability 2023, 15(2), 1545; https://doi.org/10.3390/su15021545
Submission received: 3 December 2022 / Revised: 8 January 2023 / Accepted: 10 January 2023 / Published: 13 January 2023
(This article belongs to the Special Issue Structural Health Monitoring in Civil Infrastructure)

Abstract

:
In recent years, overturning accidents at single-pier bridges have occurred frequently, resulting in significant property losses and safety accidents. Overturning accidents show that there are still many hidden dangers in the design, operation, and management of existing single-pier bridges. Therefore, this paper takes the K503 + 647.4 separated overpass of the Hegang–Dalian Expressway as the research object and carries out an onsite anti-overturning stability test of a single-column pier bridge. Through loading under various working conditions, the displacement changes of each support are measured, and the reaction changes of the supports are calculated. In the process of simulating the field test using the finite element program ANSYS, a rigid model based on ideal support and an elastic model considering beam deformation are established, and the accuracy of the elastic model is verified by comparison with the field-measured data. Furthermore, a series of parameters, such as the bridge side-span ratio, bridge span number, bearing spacing, loading position, and torsional rigidity, are varied, and finite element simulation is carried out on the basis of the elastic model. Through comparison of the results, a relationship between the parameters of the single-pier bridge and the anti-overturning ability is obtained, which provides a theoretical basis for anti-overturning design research and the effective reinforcement of single-pier bridges.

1. Introduction

In recent years, with increasing urbanization, the requirements of cities regarding infrastructure construction have increased, and the number of cars, as well as the resulting traffic pressure, has continually increased. Therefore, considering the shortage of urban land, a large number of single-column pier-type urban viaducts and overpasses have been widely used. Compared with traditional bridges, single-column pier bridges have the advantages of a low construction cost, a small floor area in the substructure, low requirements with regard to the substructure on the terrain environment, good adaptability to all kinds of topography, smooth linearity, and overall beauty, in addition to other unique advantages.
However, the disadvantages of single-column pier bridges are also prominent. The anti-overturning capacity of the single-column pier bridge is relatively poor, especially for the curved beam bridge. The bending–torsion coupling effect has a significant impact on structural stability, which causes the reaction force of the bearings on both sides to be unevenly distributed and can even lead to the separation of the inner bearings in severe cases. Eccentric loads associated with overloaded vehicles further increase the possibility of capsizing curved girder bridges.
According to incomplete statistics, since 2000, there have been 85 bridge collapse accidents caused by non-seismic factors [1], among which, typical single-column pier bridge collapse accidents in recent years are shown in Table 1 and Figure 1.
Although these bridge-overturning accidents are caused by excessive vehicle overloads and partial loads to a certain extent, they have led bridge designers to reflect on the design of single-column pier structures to improve the original theory and realize the importance of the lateral overturning stability of single-column pier curved beam bridges. In fact, designers have focused on vehicle loads on the bridge because studies of the bearing spacing, bridge span distribution, and other bridge design parameters for the impact of overturning stability are relatively scarce. Different parameters also affect the spatial dynamic response of these bridges, mediating the bridge-overturning stability. Consequently, it is very important to examine the lateral overturning stability of existing beam bridges, deeply study the cause of single-column pier bridge collapses, and evaluate the associated bridge safety.
In recent years, scholars worldwide have conducted collapse analyses, finite element (FE) modeling, and the simulation of single-column pier bridges. McManus P [2] and others developed the pure torsion theory with circular members as the research object in the early stage; however, there are significant limitations when this theory is directly applied to the calculation and analysis of bridge torsion. Research on the stability of girder bridges against overturning can be traced back to 1891, and Prandtl and Michel published research results on the causes of the lateral overturning of bridges [3]. German scholars W. Streit and R. Mang studied the buckling behavior, torsion, and overturning of bridges and first provided the concept of the overturning stability safety factor [4]. Edmund C Hambly [5] obtained the safety factor of compressible ground by studying rigid structures on rigid supports. With the popularization and application of computers and FEs, George T. Michaltos [6] and others proposed a theoretical method to analyze the problems of bridge overturning and displacement during earthquakes. Nicola Scattarreggia [7] used fiber-based finite element models (FB-FEM) to model RC circular hollow-section bridge piers, which is valuable for analyzing the impact of earthquake responses. Zhen Xu [8] simulated the complete progressive-collapse process of stone arch bridges using the general-purpose FE program MSC Marc, which adopted a three-dimensional (3D) FE model and enabled a nonlinear analysis using the contact algorithm in conjunction with the element-deactivation technique. Nicola Scattarreggia [9] adopted AEM-based models to carry out the explicit modeling of the torsional–flexural–shear failure of a bridge deck accounting for the damage propagation during a collapse, and a frame-by-frame verification of the numerical modeling was compared with footage of the observed collapse. Pennington et al. focused on the cause of the overturning of the Buxi railway bridge and summarized and proposed relevant engineering measures based on the process and accident data [10]. Pennington [11] analyzed the collapse of bridges in Colombia on the basis of previous accident studies and noted that design defects should be eliminated to reduce the probability of structural failure. To determine the overturning probability of a bridge under the ultimate load state, Chen Y studied the overturning stability of a single-column pier of a continuous steel-concrete composite beam bridge under overturning loads [12].
Regarding work in China, Peng W. B et al. [13,14] simulated an actual bridge collapse process through FE analysis and the dynamic analysis of several cases of actual single-column piers overturning. Two key states (side-end support debonding state and an overturning stability limit state) were considered before the box girder was overturned. The box girder overturning was divided into a stable stage, a transition stage, and an overturning stage according to the two key states. According to the accident site pictures and data, the overturning of the pier for a column was detailed when it collapsed, and the overturning of a single-column pier bridge was summarized into four damage modes. On this basis, two overturning calculation models, a practical numerical solution, and a simple optimization operation, as well as the principle of strong tilting and weak bending, were proposed. To verify the accuracy of the calculation theory, Peng Weibing used ABAQUS to conduct FE simulations on several overturning cases of single-pillar piers, including Chunhui Bridge in Zhejiang and Yangmingtan Bridge in Harbin. Geometric nonlinearity and contact nonlinearity were considered in the simulation process. In terms of research methods, the innovative introduction of surveillance video images provided rigorous evidence for characterizing the overturning process of the Zhejiang Chunhui Bridge. Xiong W et al. [15] analyzed the Yangmingtan Bridge overturning case by establishing an ANSYS-refined FE model. The change curves of the bearing reaction force and structure turning angle were derived by continuously scaling up the loads in the actual accident in equal proportions until the ultimate overturning damage state of the bridge structure occurred. Four critical overturning states were quantitatively proposed based on the bearing dehiscence and the size of the turning angle, and the complete process of the limit state and failure was simulated. Shi X. F. et al. [16,17] proposed a calculation method regarding the overturning stability by considering second-order effects (considering the changes in the vehicle and girder centers of gravity and the changes in the rotation axis positions), compared it with the calculation results when second-order effects were not considered, found that the calculation results considering second-order effects were more realistic, and concluded that the overturning capacity of the bridge was greatly underestimated by taking the bearing accommodation as the basis for overturning. Dong F.H. et al. [18] proposed a calculation method for the safety factor of lateral overturning stability based on reliability theory for curved bridges with single-pillar piers under asymmetric eccentric loads and established a calculation method from the target reliability index to the safety factor of the lateral overturning stability. Ge L.F. et al. [19] proposed the method of early warning and situation feedback for sudden bridge collapse with the help of WIMs and added an overturning risk calculation model from the perspective of preventing the overturning of single-pier bridges. The capsize-monitoring and early warning system software includes three subsystems: a moving load identification system, a capsizing predefection and feedback system, and an investigation and research system.
The existing research on curved single-column pier bridges worldwide is relatively incomplete, with the best studies incorporating accident bridge data, model tests, and refined analysis. In the research process, a single model pair is often used to carry out lateral overturning stability analysis. In the calculation of the anti-overturning stability coefficient in the current regulations, it is assumed that the main girder and bridge piers have sufficient rigidity and strength and that the supports are supported by ideal points. Such calculation results are not sufficiently accurate. In addition, when calculating the critical overturning coefficient under actual conditions, this value is greater than the specification value of 2.5 [20]. Therefore, this paper combines experiments to study the overturning resistance of a bridge with a single-column pier based on a rigid model and an elastic model under different working conditions. In this paper, first, static load tests are conducted. Second, single-column pier models based on a rigid body and an elastomer are established, and the test data are compared with the theoretical data. Finally, on the basis of the elastomeric model, the key influencing factors affecting the overturning performance of single-column pier bridges are discussed, providing a theoretical basis for the overturning problem of single-column pier bridges.

2. Field Test

2.1. Project Overview

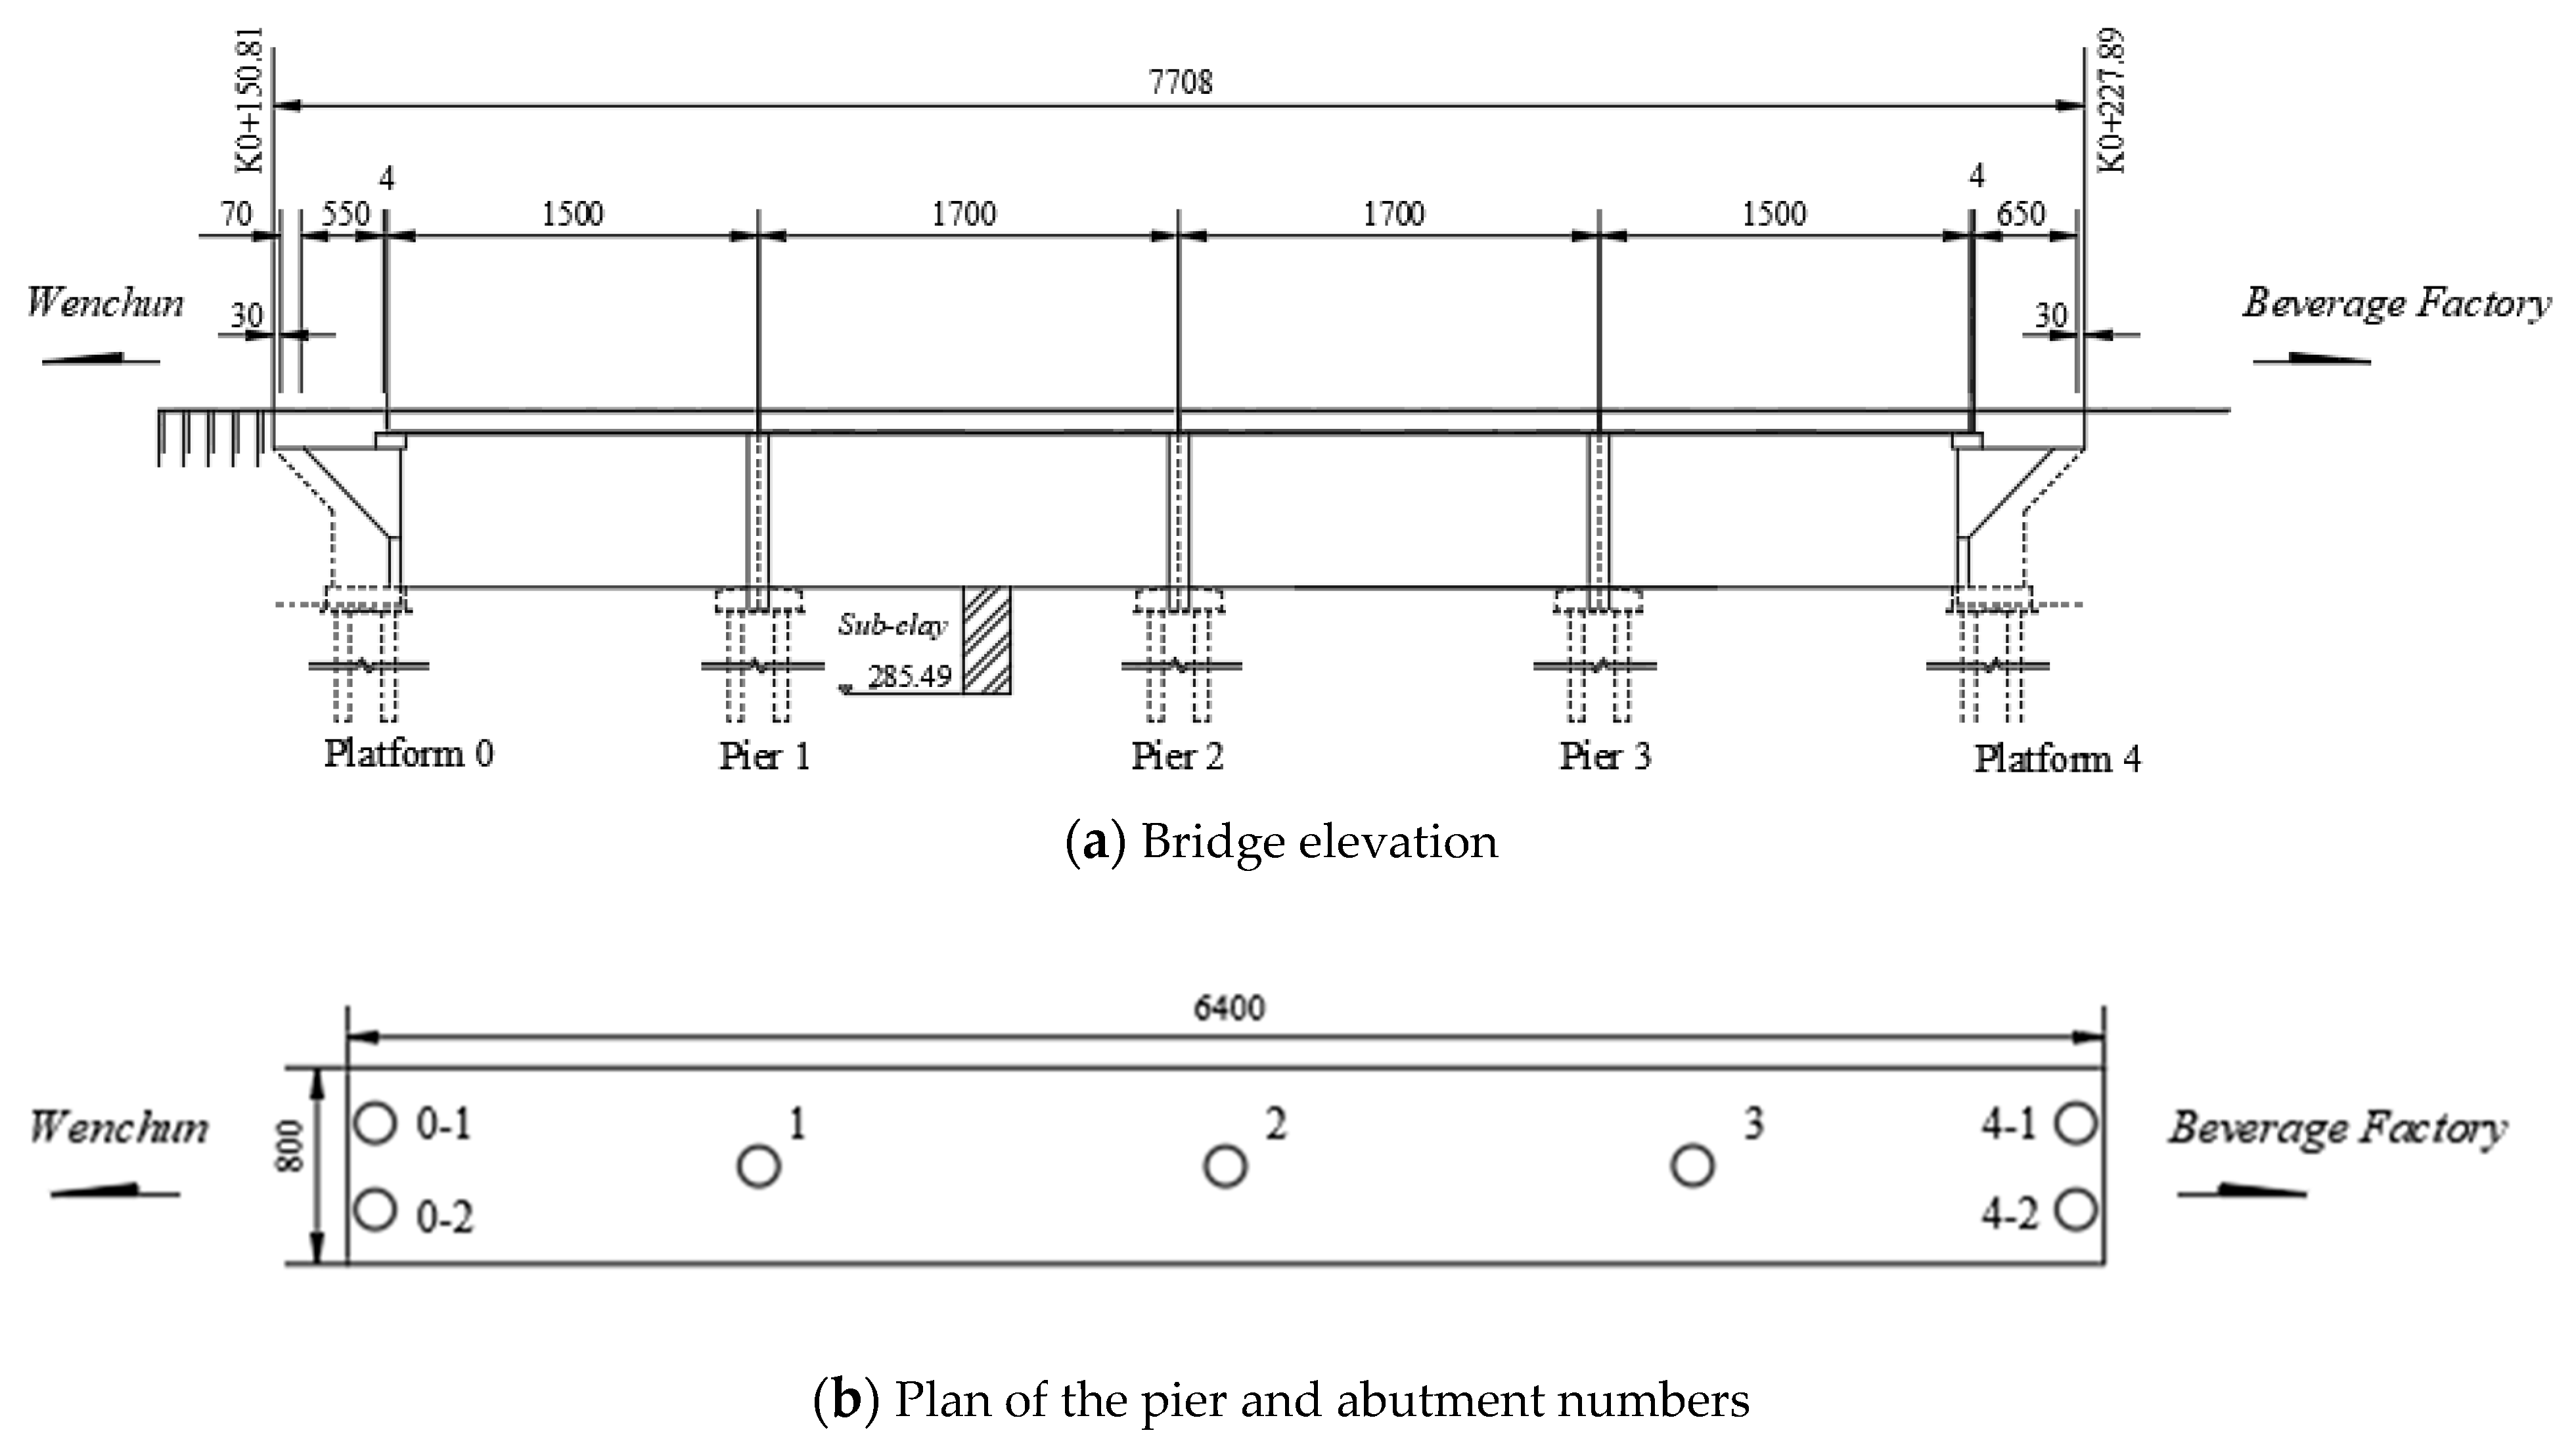
To study the overturning stability and calculation theory of a single-column pier girder bridge, all the bridge parameters are statistically categorized according to the test results of a single-column pier girder bridge in the expansion project of the Mudanjiang–Ning’an section of the Hegang–Dalian Expressway, and the most representative type of bridge is selected for modeling analysis in this paper. The specific example of this project is the K503 + 647.4 separated overpass of the Hegang–Dalian Expressway, a concrete continuous box girder bridge with double supports at both ends; all other spans adopt a single-column pier type Among them, the box girder is 8 m wide, its torsional inertia is 1.26 m4, and its bending inertia is 0.42 m4. The cross-sectional area is 3.10 m2. The site plan, elevation, and naming method of the pier and abutment are shown in Figure 2 and Figure 3, where 0-1, 0-2, 4-1, and 4-2 represent the end abutment bearing numbers and 1, 2, and 3 represent the sole column pier bearing numbers.

2.2. Typical Vehicle Identification

Regarding the actual analysis of the single-column pier girder bridge with a standard heavy vehicle as a typical vehicle, the load-carrying capacity limit state is studied by loading the most unfavorable load position; that is, the structural overturning stability coefficient is not less than the specification requirements, and the inner support is not relied upon under the approximate maximum load of a single vehicle on the bridge.
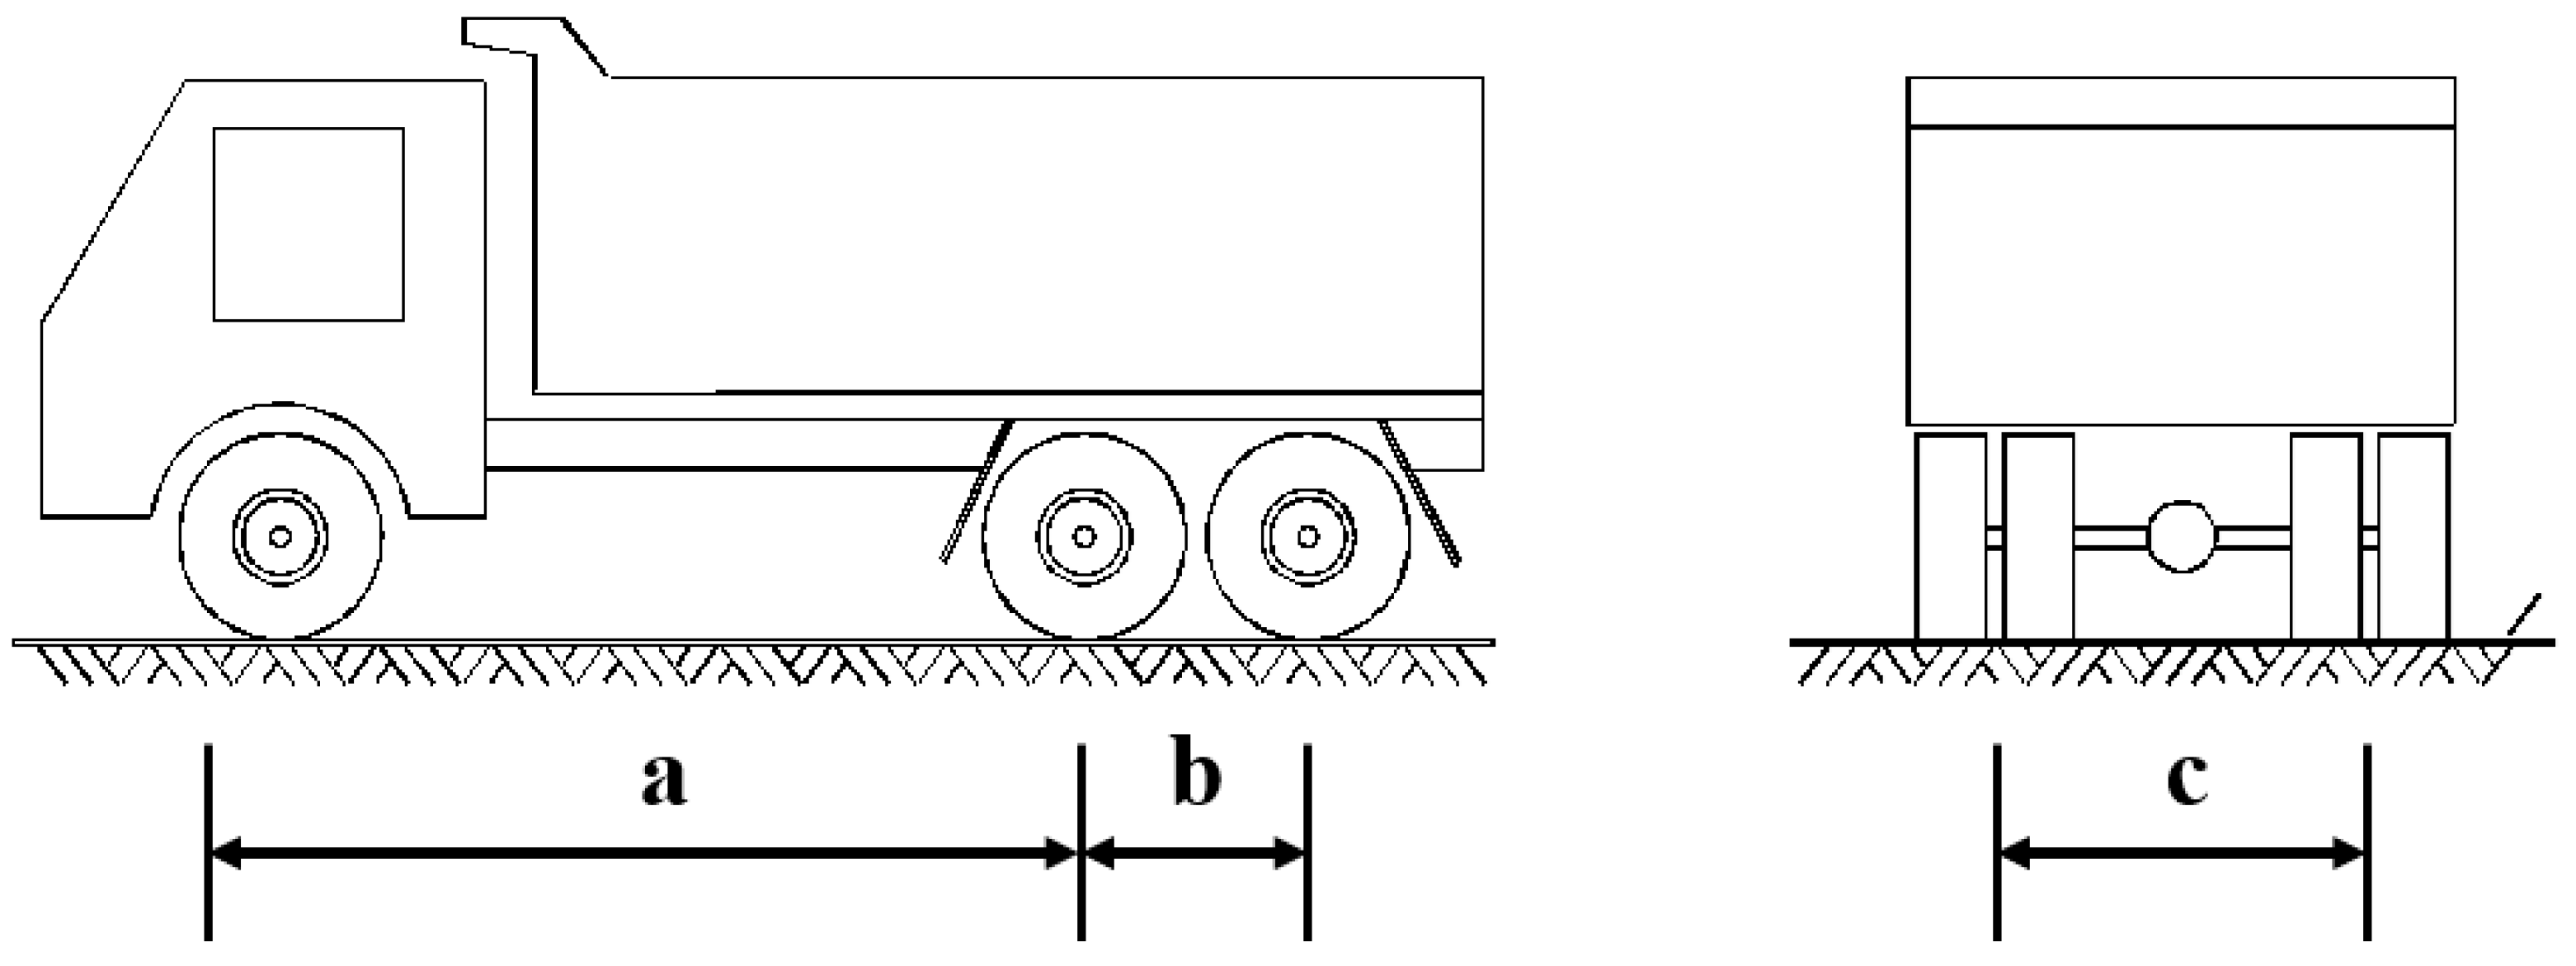
The overturning of a single-column pier girder bridge is, in most cases, caused by the passage of multiple large, heavy vehicles forming a dense queue on one side of the curve. In this paper, a single, fully loaded gross weight of 400 kN (with a front axle weight of 80 kN and a middle and rear axle weight of 160 kN) is selected as a typical single vehicle crossing the limit of a single-column pier curve girder bridge, as shown in Figure 4. The vehicle type’s axle weight and wheelbase are shown in Table 2. The test involves weighing the loaded truck and strictly controlling its total weight.
As a typical vehicle, this type of vehicle has the following characteristics:
(1)
The vehicle type has a long body and a large load; the total weight of the body included in the load is 3 to 4 times the weight of the empty vehicle. This weight is even higher when loaded.
(2)
Most vehicles in this category travel at night, and it is often the case that multiple vehicles travel in the same direction.
(3)
Such vehicles tend to be spaced closely in multivehicle forward situations.
(4)
These vehicles are safer than the five-axle trailer that is used for testing.
In summary, multiple heavy vehicles tend to travel in close proximity in the same direction, which poses a great threat to the overturning resistance of bridge structures, especially single-pillar pier girder bridges. Thus, such vehicles are used in this study as typical vehicles for single-vehicle overload limit research of a single-pillar pier girder bridge.

2.3. Typical Vehicle Load Loading

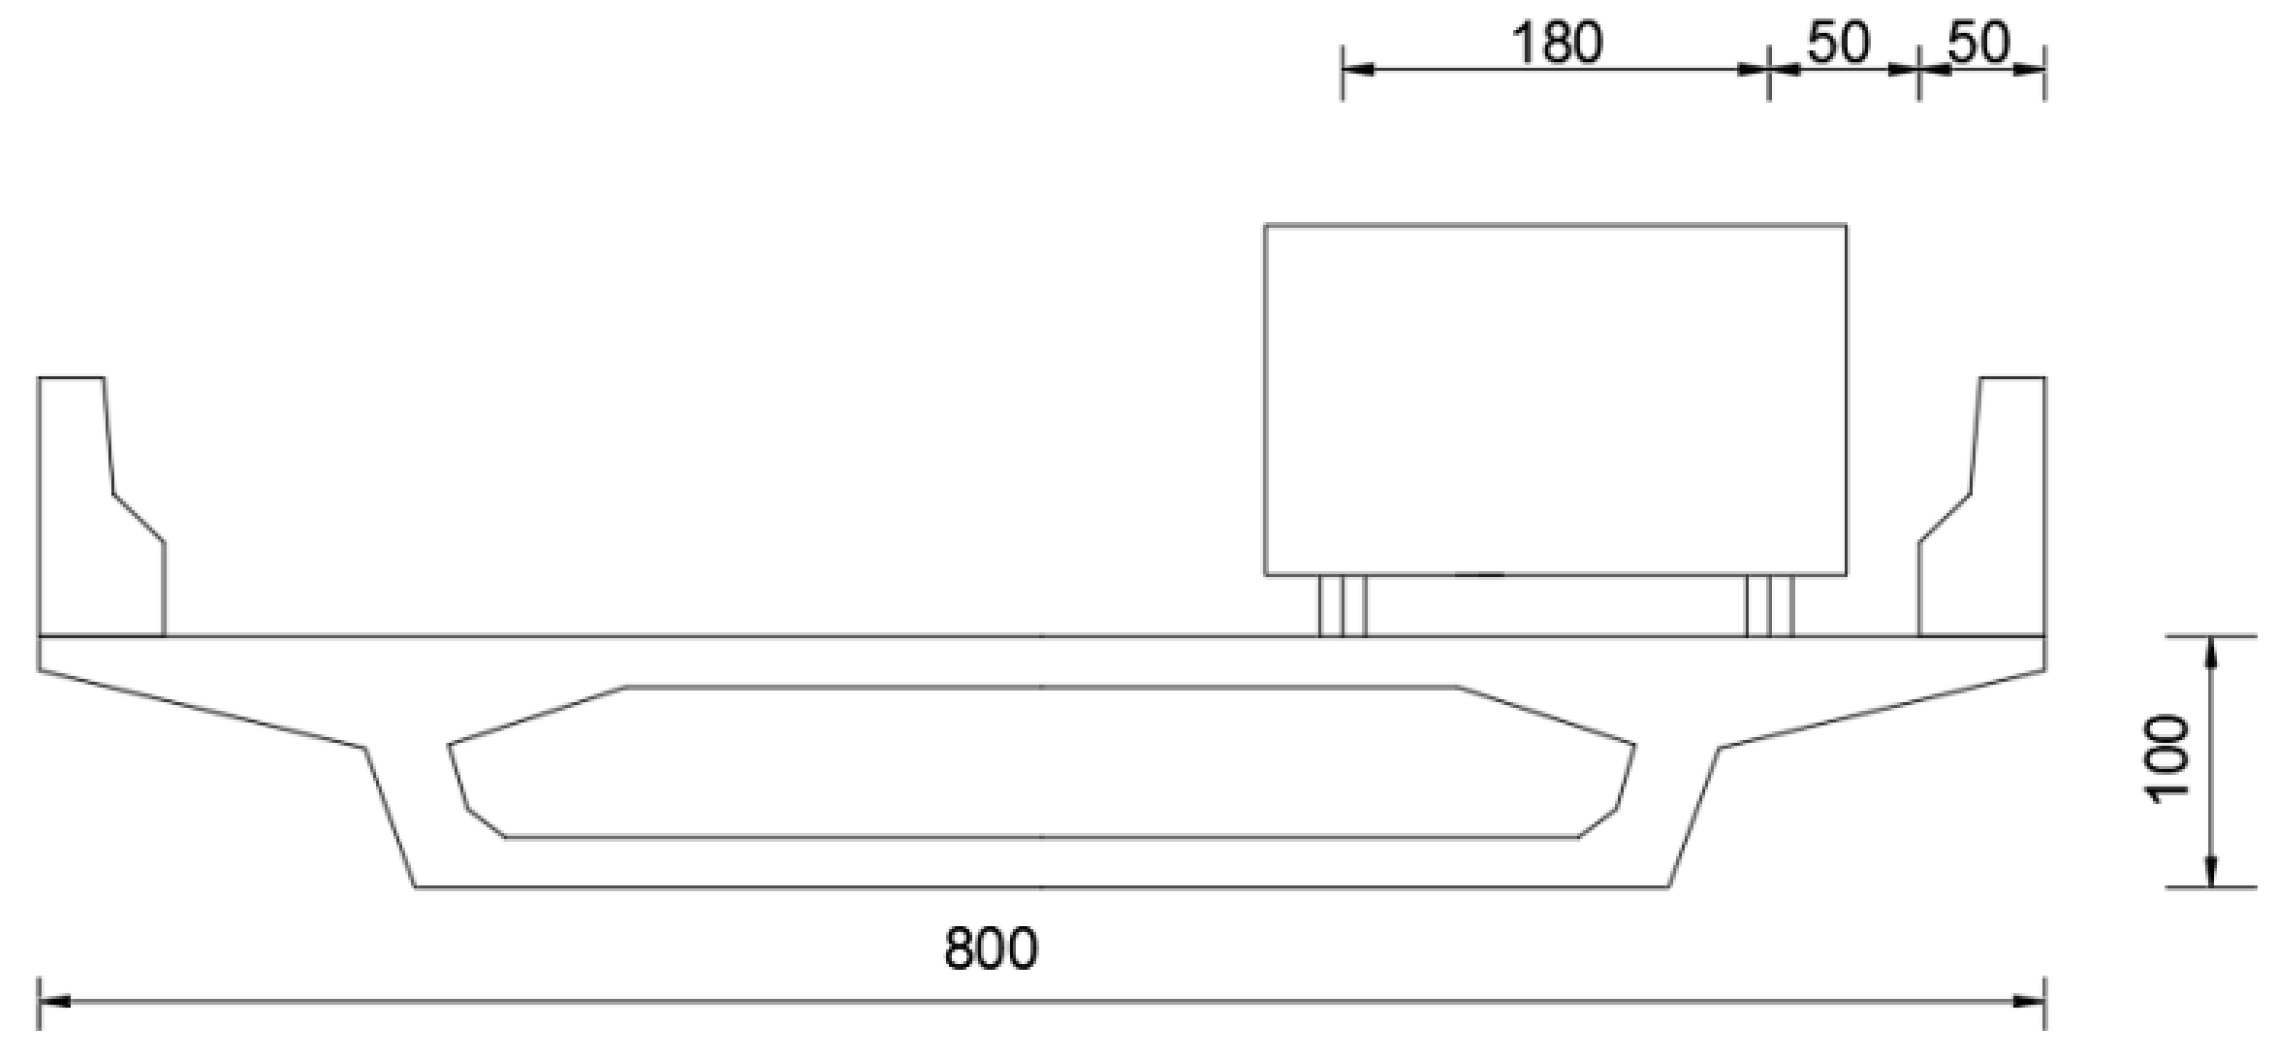
In general, the distance between the front axle and the front of a heavy three-axle truck is 1 m, and the distance between the rear axle and the rear end of the vehicle is 2.5 m. Moreover, heavy vehicles in a fleet are individually separated by 2 m. Through the study of previous bridge overturning cases, it can be found that safety accidents are mostly due to multiple overloaded vehicles acting in conjunction throughout the bridge. To simplify the test and consider the most unfavorable traffic load, the test is loaded with a 400 kN typical vehicle load in the most unfavorable loading mode, when the distance between the vehicle and the curb is 0.5 m according to the General Specifications for the Design of Highway Bridges and Culverts (JTG D60-2015) [21]. The lateral loading mode pattern is shown in Figure 5. Three different working conditions are set: a longitudinal single vehicle over the bridge, a longitudinal double vehicle over the bridge, and a longitudinal triple vehicle over the bridge. Through calculation, the influence line of the No. 0–1 support reaction force at the lateral loading position is obtained, as shown in Figure 6. The most unfavorable longitudinal layout of the vehicle is evaluated according to this influence line, as shown in Table 3.

2.4. Displacement Measurement Point Arrangement

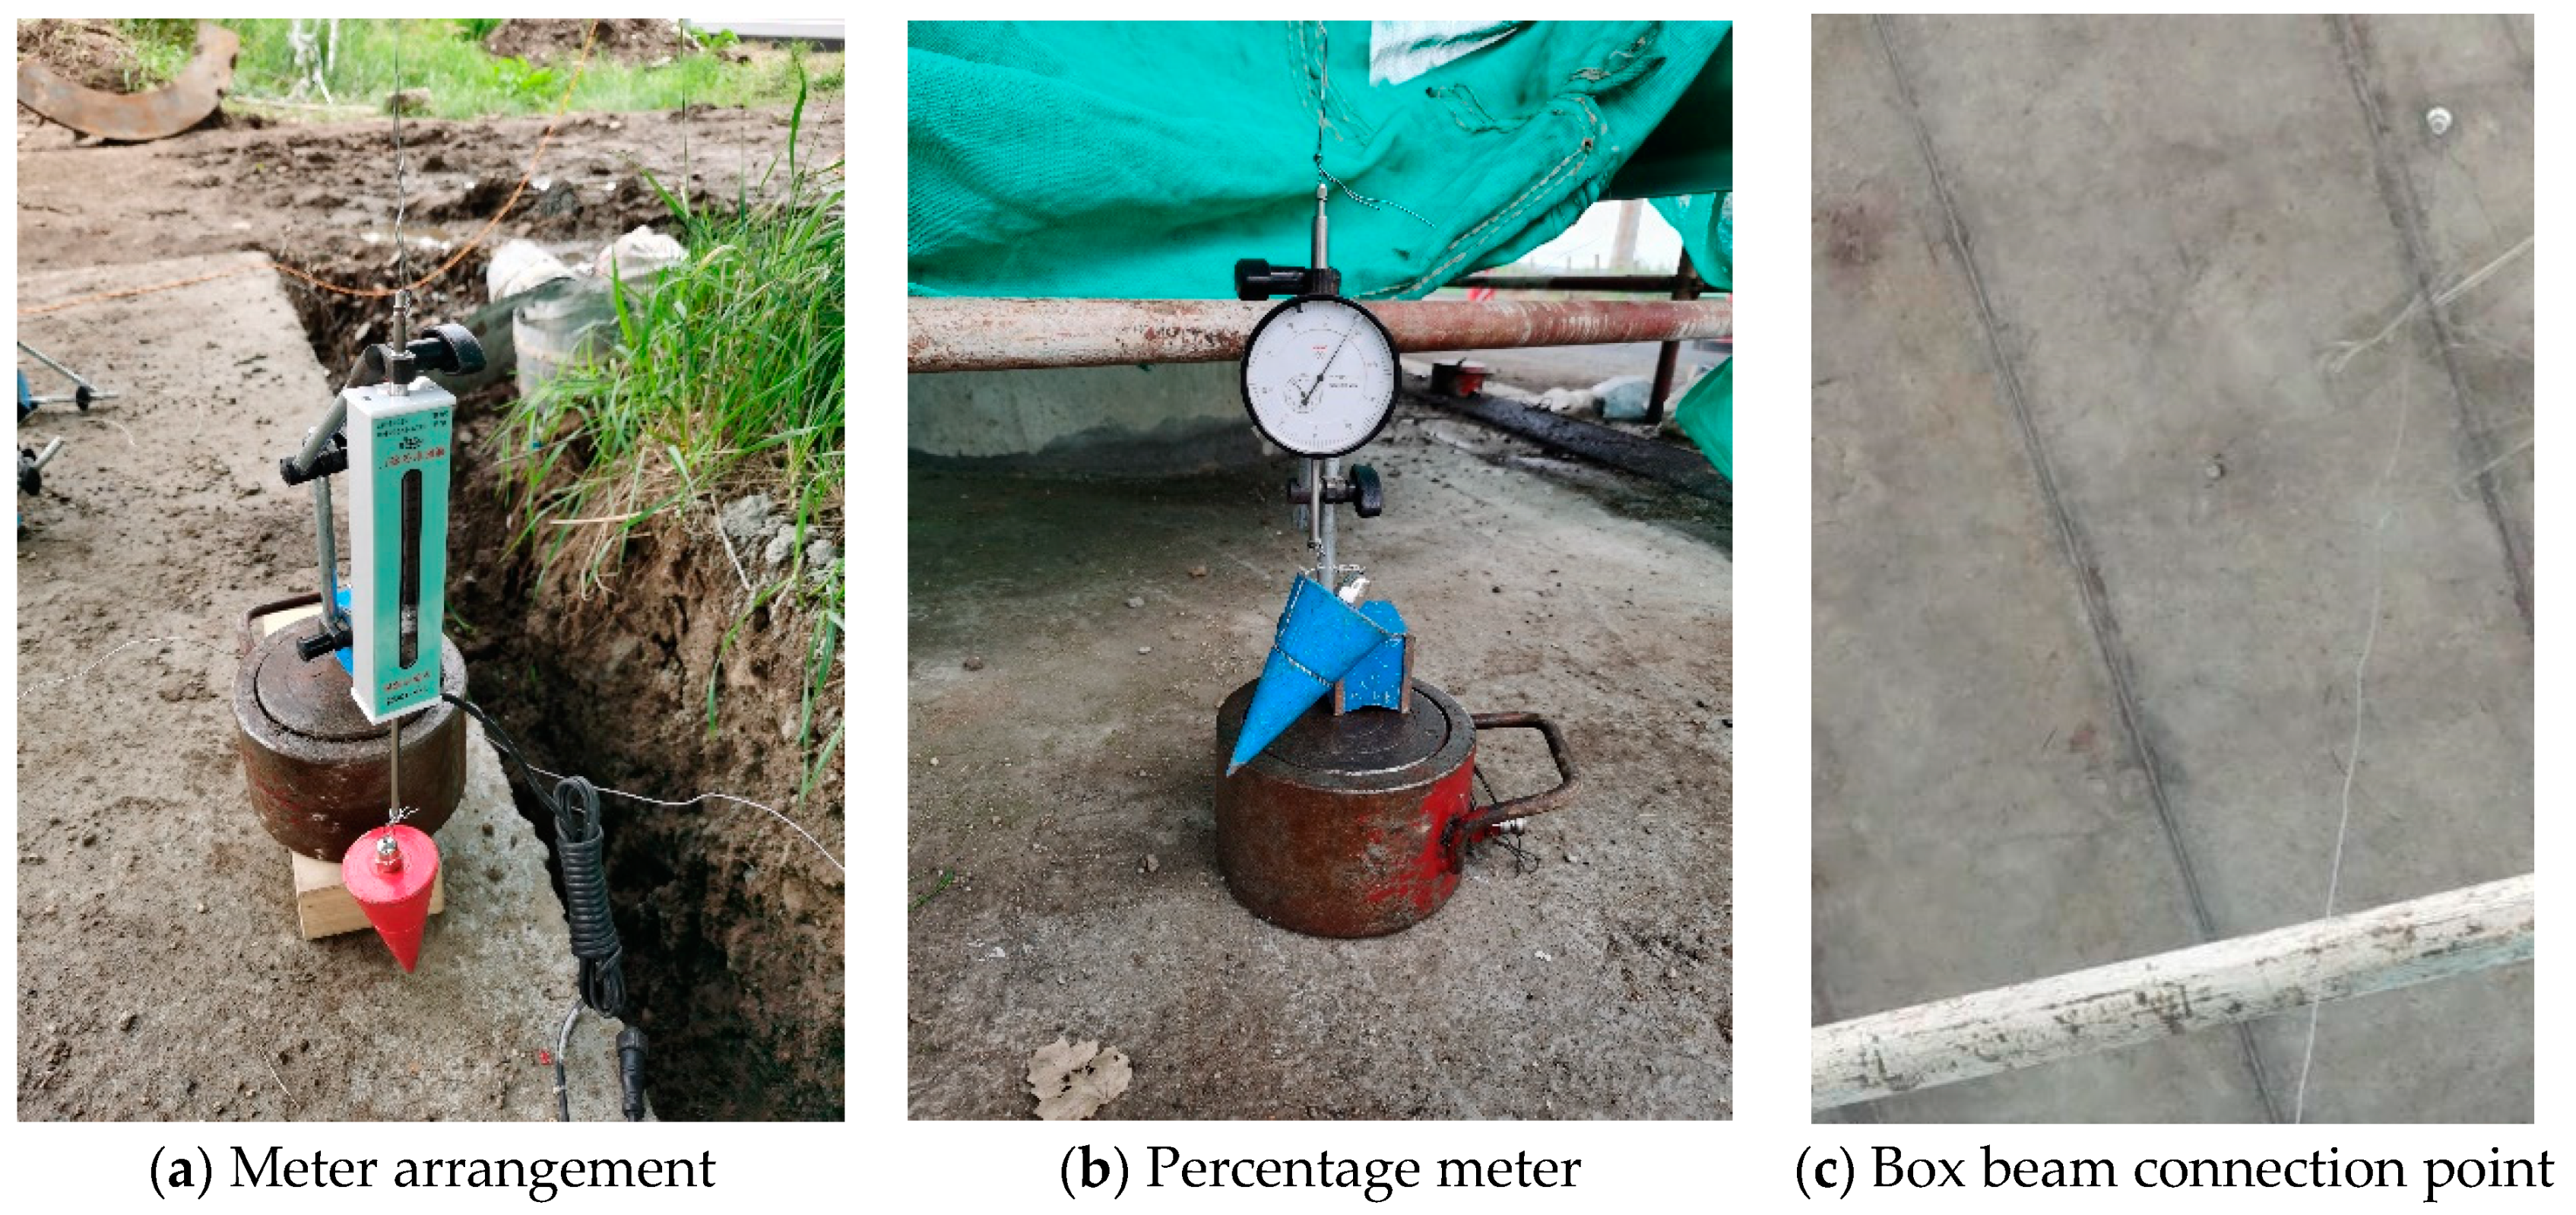
The displacement test is divided into the midspan displacement test and the displacement test at the support. Between them, the midspan displacement test measures the overall deformation of the box girder during the loading process, the displacement test at the support measures the displacement of the support, and the displacement measurement points are arranged symmetrically. Two percentage meters are used to measure the vertical displacement at Pier 1, Pier 2, and Abutment 0, and electronic displacement meters are used to measure the displacement at Pier 3 and Abutment 1. A metal wire is pasted and connected at the measuring point, naturally vertical, and fixed at the end of the displacement meter and percentage, and the displacement meter and percentage meter are inverted and fixed on the flat opposite side using a magnetic meter holder. During the loading process, the girder on the side where no eccentric load is applied produces an upward displacement, and the metal wire is pasted on the bottom of the beam, which will pull up the displacement gauge and dial gauge. The lower ends of the displacement gauge and the dial indicator are connected with a conical plumb weight so they are not lifted directly, and the change in the displacement of the support is reflected by the reading changes of the displacement gauge and the dial indicator. The displacement measurement points are shown in Figure 7.

2.5. Strain Measurement Point Arrangement

The strain test is performed through an external strain test. In terms of the characteristics of the bridge structure, the external strain test location should include the box girder bottom plate and web, and the strain measuring points should also be symmetrically arranged. To accurately test the displacement at each point of the control section, vertical and lateral strain gauges are also arranged at the control section of the single-column pier. The upper edge of the beam is patched with a grinder to smooth the concrete surface and then wiped with alcohol. The strain gauges are attached with 502 Glue at the locations of the measurement points, and attention is paid to the quality of the paste. To prevent temperature-related errors, such as a difference between the surface temperature and the internal temperature of the measured member, a temperature difference between the patch position and the non-patch position, a temperature difference between the local patch and the overall patch, and a temperature difference between the patch and the compensation patch are recorded; a time period with relatively stable temperature changes is selected for the test, and the temperature compensation at the test site is also taken into consideration. The strain gauge arrangement is shown in Figure 8.

2.6. Data Acquisition and Reading

This test uses a DH data acquisition box and a computer. The computer is connected with wires. A DH3815 unit is used to read the data. The wires are connected in a Wheatstone bridge configuration, the displacement measuring points are measured based on a half-bridge connection, and the strain measuring points are measured based on a quarter-bridge connection. Figure 9 shows the connection mode. During the loading process, with an increasing number of loading trucks, the displacement change in the main girder also increases. Taking side support 0-1 of the eccentric truck load as an example, the displacement of the beam bottom is 5.88 × 10⁻⁵ under a single truck load, 2.88 × 10⁻⁴ under a double truck load, and 3.58 × 10⁻⁴ under a three-truck load. Considering the safety of onsite loading, the eccentric truck load is not increased.

3. Numerical Analysis

3.1. Theoretical Calculation Method of Overturning Resistance

To facilitate the calculation of the anti-overturning performance of single-column pier bridges, the American Highway Bridge Code [22] is used to control the lateral stability of the structure through the stress state of the current bearing. In any limit state, necessary measures should be taken to restrain a bearing that is prone to voids. A special design should be made for the bearing when the bearing reaction force is less than 20% of the bearing capacity. Because the United States has strictly controlled the overloading of single-column pier bridges, its specifications stipulate the bearing capacity conceptually only and do not provide specific calculation formulas.
Regarding domestic norms, the General Specifications for Highways in China (JTG D62-2004) [23] describes only the prohibition of support dismounting.
The draft of the Specifications for China Highway Concrete Code (JTG D62-2012) [24] stipulates that the stability coefficient of the bridge shall be clearly used to check and evaluate the stability of the beam bridge against collapse. For small- and medium-span beam bridges with integral sections, the superstructure of the bridge shall be checked to see if it can maintain stability. The present work is the first to propose an analysis method for the anti-overturning stability of bridges and the first to propose the concept of an “anti-overturning stability coefficient” in highway specifications. The anti-overturning stability of beam bridges is checked and evaluated by using the overturning axis, that is, based on the rigid model.
According to the specifications, the anti-overturning stability coefficient of a single-column pier bridge should meet the conditions of Formula (1):
K q f = S b k S s k 2.5
where K q f is the coefficient representing the collapse and overturning resistance, S b k is the standard effect of the representative load on the bridge that collapses the structure, and S s k is the standard combination of effects that stabilizes superstructures.
The current specification for highway bridges and culverts, namely, JTG3362-2018 [20], issued in 2018, omits a calculation method of the overturning axis and adopts a theoretical calculation method based on the effect of a deformable body, that is, an elastic model, and proposes the concepts of an effective bearing and an ineffective bearing. It maintains that each pier must have an effective bearing. The stability effect and failure effect are calculated by the reaction moment from the failed bearing to the effective bearing. The structure is checked according to two characteristic states; that is, Characteristic State 1 requires that the support cannot be void. The formula for calculating the stability coefficient is given in Characteristic State 2; that is, when the action standard value is combined, the action effect of the bridge should conform to the following formula:
S b k , i S s k , i k q f S b k , i = R G k i l i S s k , i = R Q k i l i
where k q f is a coefficient normally representing the collapse and overturning resistance of 2.5, S b k , i is the ability effect design value, S s k , i is the design value of the instability effect, R G k i is the force value of the failed support at the I -th pier under permanent action, and R Q k i is the reaction force value of the failed support at the i pier under variable action. Moreover, the automobile load is calculated according to the most unfavorable position corresponding to each failed support, and the impact coefficient is considered.
To calculate the destabilizing effect of bridges, the new code proposes a new calculation method and defines the corresponding action moment of the stability effect and the instability effect in the design so that the anti-overturning stability coefficient of the structure can be obtained to evaluate the anti-overturning stability performance of the bridge [25,26].
Considering the complex stress state of the bending and torsional shear of the girder in the overturning process, the overturning effect on the structure is reflected in the reaction force of each support. Moreover, it is assumed that the bridge has a small rotation deformation, and the overturning process is divided in detail. Under the action of a partial load, the nonpartial load side supports are gradually unloaded, and the double supports do not support a load; that is, the last nonpartial load side supports are unloaded. At this time, the bridge reaches the critical state of overturning. Therefore, it is believed that the overturning resistance of the single-column pier girder bridge is mainly composed of the reaction force of the end support and the overturning resistance of the superstructure caused by the movement of the rotating shaft. Some scholars have offered a more comprehensive method [12,13,14,27,28].
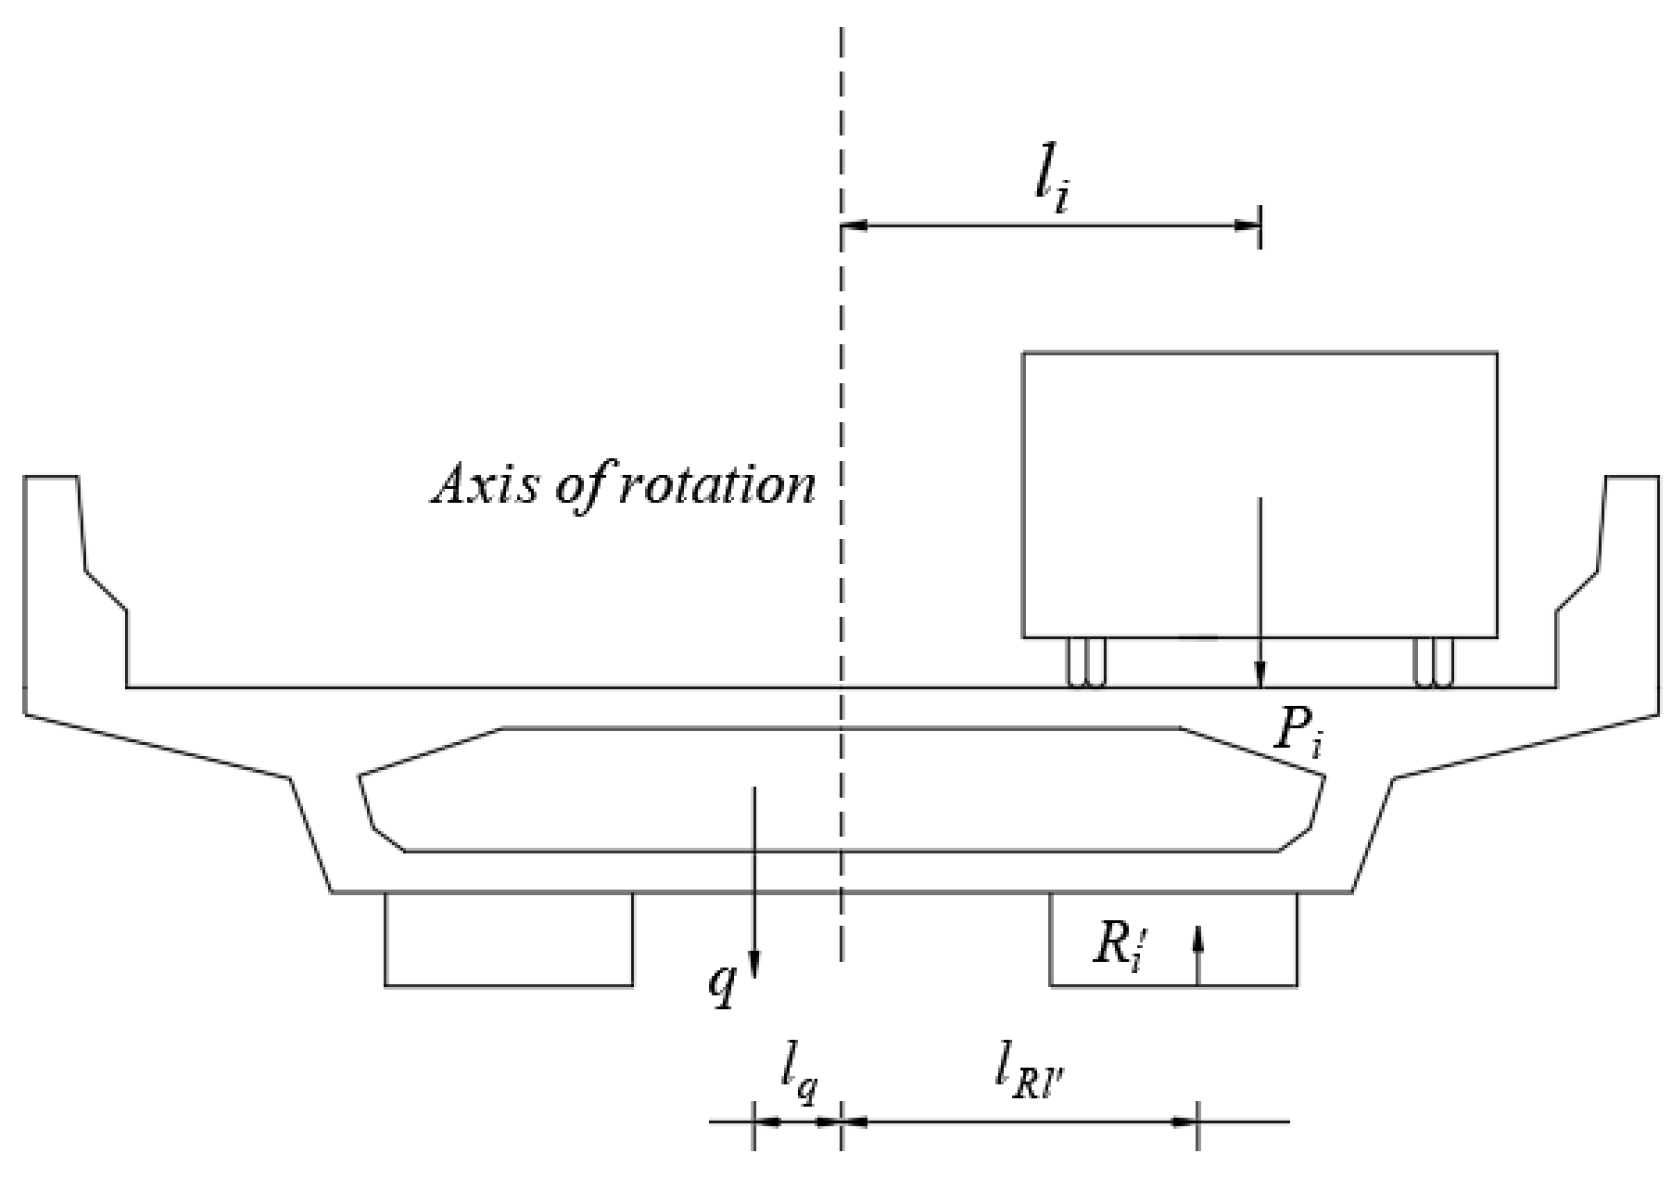
When the superstructure of the bridge is subjected to an eccentric load, an overturning moment arises, at which time, the axis of rotation moves from the center of the support to the side subjected to an eccentric load. At this point, the eccentric load and deadweight produce an overturning moment and an anti-overturning moment, respectively. In the transverse direction of the bridge, the reaction force of the pier in the bridge coincides with the position of the rotation axis. Therefore, the cross-section at the side pier is selected to analyze the overturning calculation method [26,27,28,29]. The calculation diagram is shown in Figure 10, and the overturning moment of the bridge superstructure is shown in Formulas (3) and (4):
M 1 = R i l R i + q l q
M 2 = P i l i
where R i is the bearing reaction force, i is the number of end bearings, l R i is the distance from the reaction point of the bearing to the axis of rotation, q is the weight of the box girder line, l q is the distance from the dead weight point of the box girder to the axis of rotation, P i is the test vehicle load, i is the number of vehicles, and l i is the distance from the action point of P i to the axis of rotation.
When the bridge collapse and overturning moment caused by the eccentric load generated by vehicles is greater than the anti-overturning moment of the bridge structure itself, the girder rotates. Furthermore, when the critical load value is reached, the bearing separation of the abutment without an eccentric load occurs. In this case, the bridge is in a dangerous state, although it does not overturn immediately. In this process, the reaction force of the end bearing on the side without an eccentric load continuously decreases until the reaction force of the bearing is zero (corresponding to the state of the hollow bearing). Therefore, by establishing the bridge structure simulation model and calculating the reaction force of the bearing, the state change of the bearing can be intuitively reflected.

3.2. Finite Element Model

In this paper, a numerical simulation method is adopted to establish an FE model and perform an overturning stability analysis of the K503 + 647.4 separation interchange of the Hegang–Dalian Expressway. By changing the parameters of the FE model, the bridge superstructure is considered a rigid model and an elastic model for numerical simulation to analyze the bridge stresses under different loads. The changes in the bearing reaction force before and after the loading of the rigid model and the elastomeric FE model are extracted and compared with the data measured in the field test to compare the rationality of the two numerical simulation ideas.
The numerical simulation is carried out by using the general FE program ANSYS [26,29], and the full-bridge model is established as a three-dimensional solid element. The superstructure of the bridge is a four-span, single-column pier, variable cross-section concrete continuous beam, and the section form is a single box and a single room.
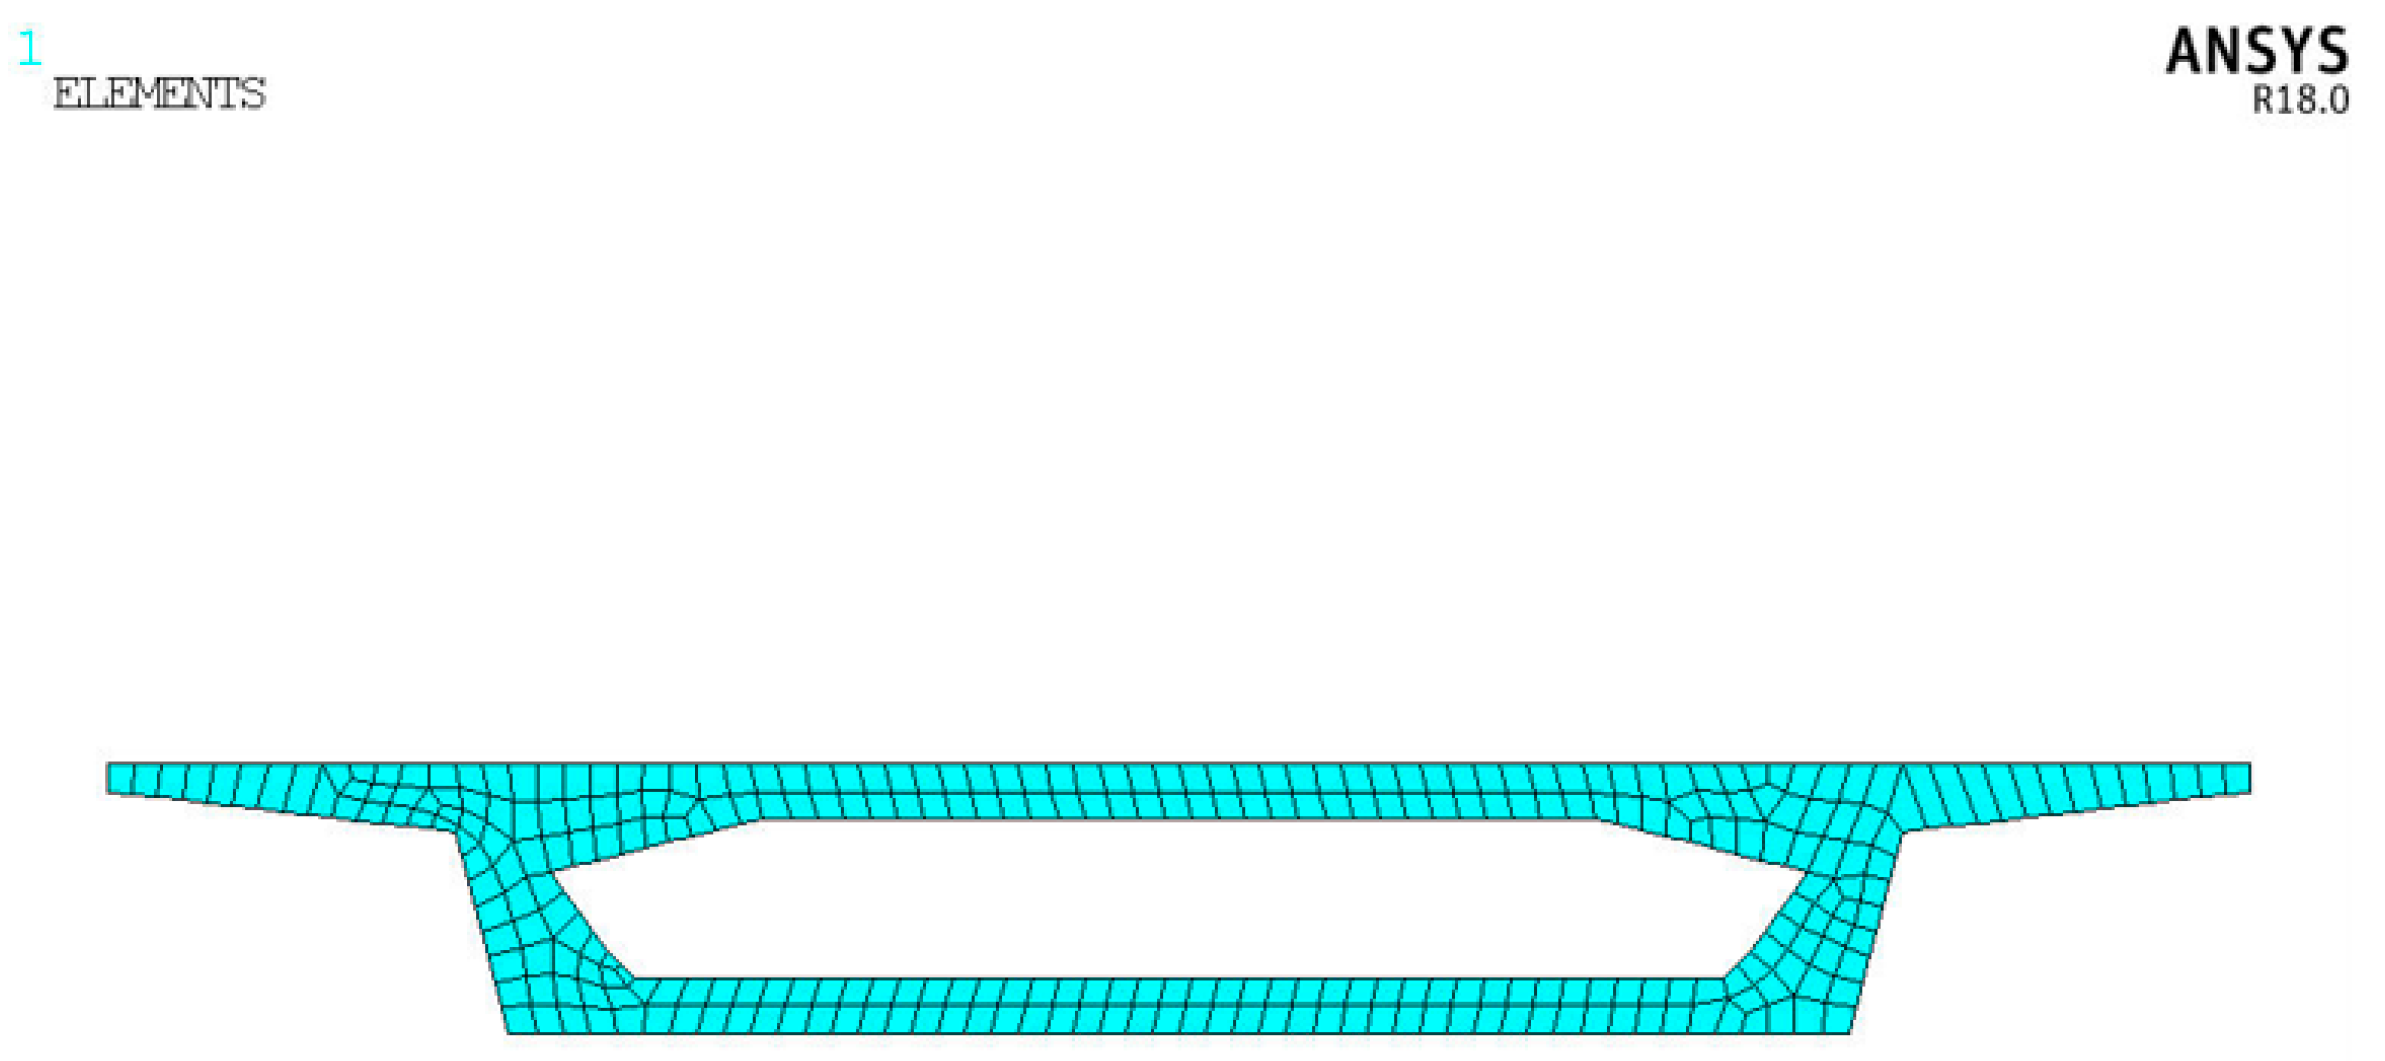
We take the box girder bridge as the research object, in which the box girder is C50 concrete, the elastic modulus is 3.45 × 10 kN /m3, Poisson’s ratio is 0.2, the section area is 3.10 m2, the bending inertia is 0.42 m4, the torsional inertia is 1.26 m4, the standard value of the axial compressive strength is 32.4 MPa, the standard value of the axial tensile strength is 2.65 MPa, and the weight is 25 kN m−3. The three-dimensional solid element solid65, which is divided into 6528 units, is used for the simulation [30,31]. Double supports are set at the abutment, and single bearings are set at the piers. The cross-section of the box girder is shown in Figure 11.
The abutment is provided with double bearings, and the pier is provided with single bearings. The model uses a GPZ2 pot-type rubber bearing and GPZ10 pot-type rubber bearing, for which the compression modulus is 400 MPa. Each bearing has a diameter of 600 mm and a thickness of 150 mm. APDL parameterization in ANSYS is used to establish the FE model of a simply supported box girder. The girder is simulated by the three-dimensional solid element solid185, a nonlinear element that can simulate the full tensile and compressive behavior of concrete. The deck pavement is simulated by the Shell 181 shell element, which is suitable for the nonlinear analysis of larger rotations and larger strains. For the contact of the bridge girder and bearing, the contact surface elements (Targe170, Conta174) are selected to simulate the contact behavior, and the support is simplified to a cylinder in the model. In the vertical direction, the support is divided into 4 layers, and each layer is divided into 112 units [32]. The full-bridge model is shown in Figure 12. Under the action of bridge gravity, the reaction force of each bearing is shown in Table 4.
The vehicle load is consistent with the vehicle used in the field test [18,25], and the detailed data of the vehicle are shown in Table 2. Working Conditions 1–3 represent single-vehicle loading, double-vehicle loading, and three-vehicle loading, respectively, and the loading positions of the different working conditions are shown in Figure 6.

3.3. Data Comparison and Analysis

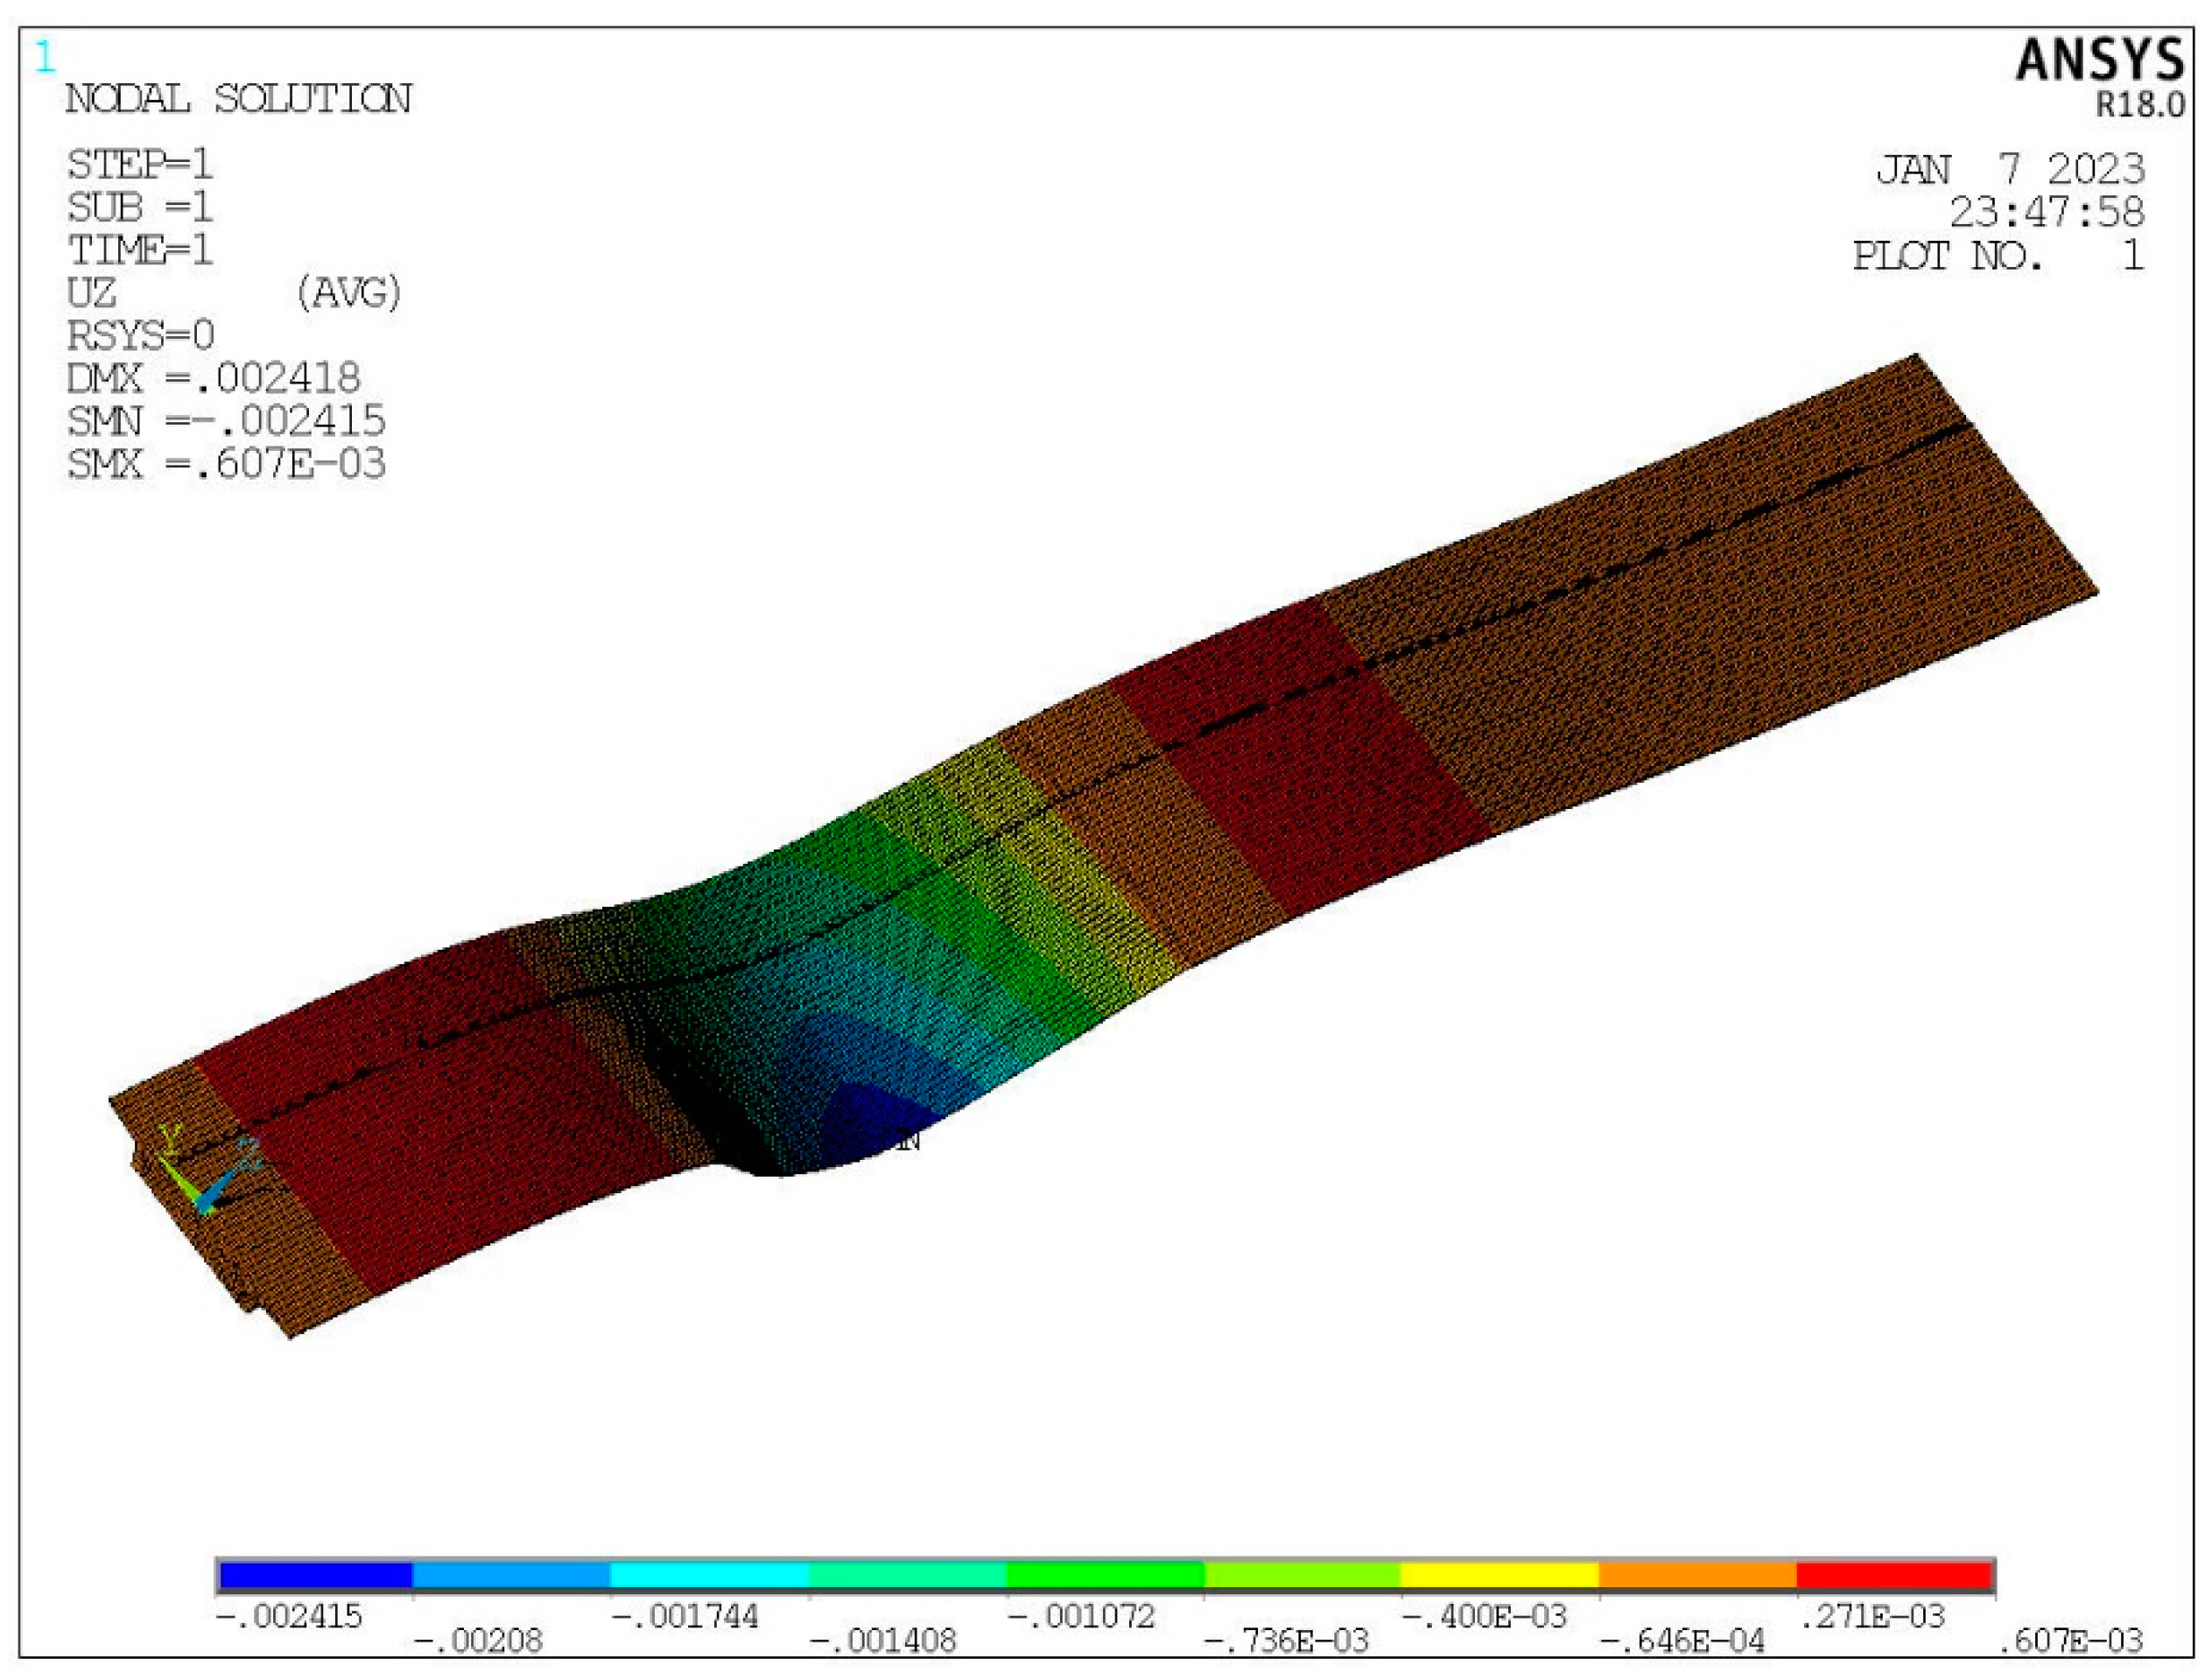
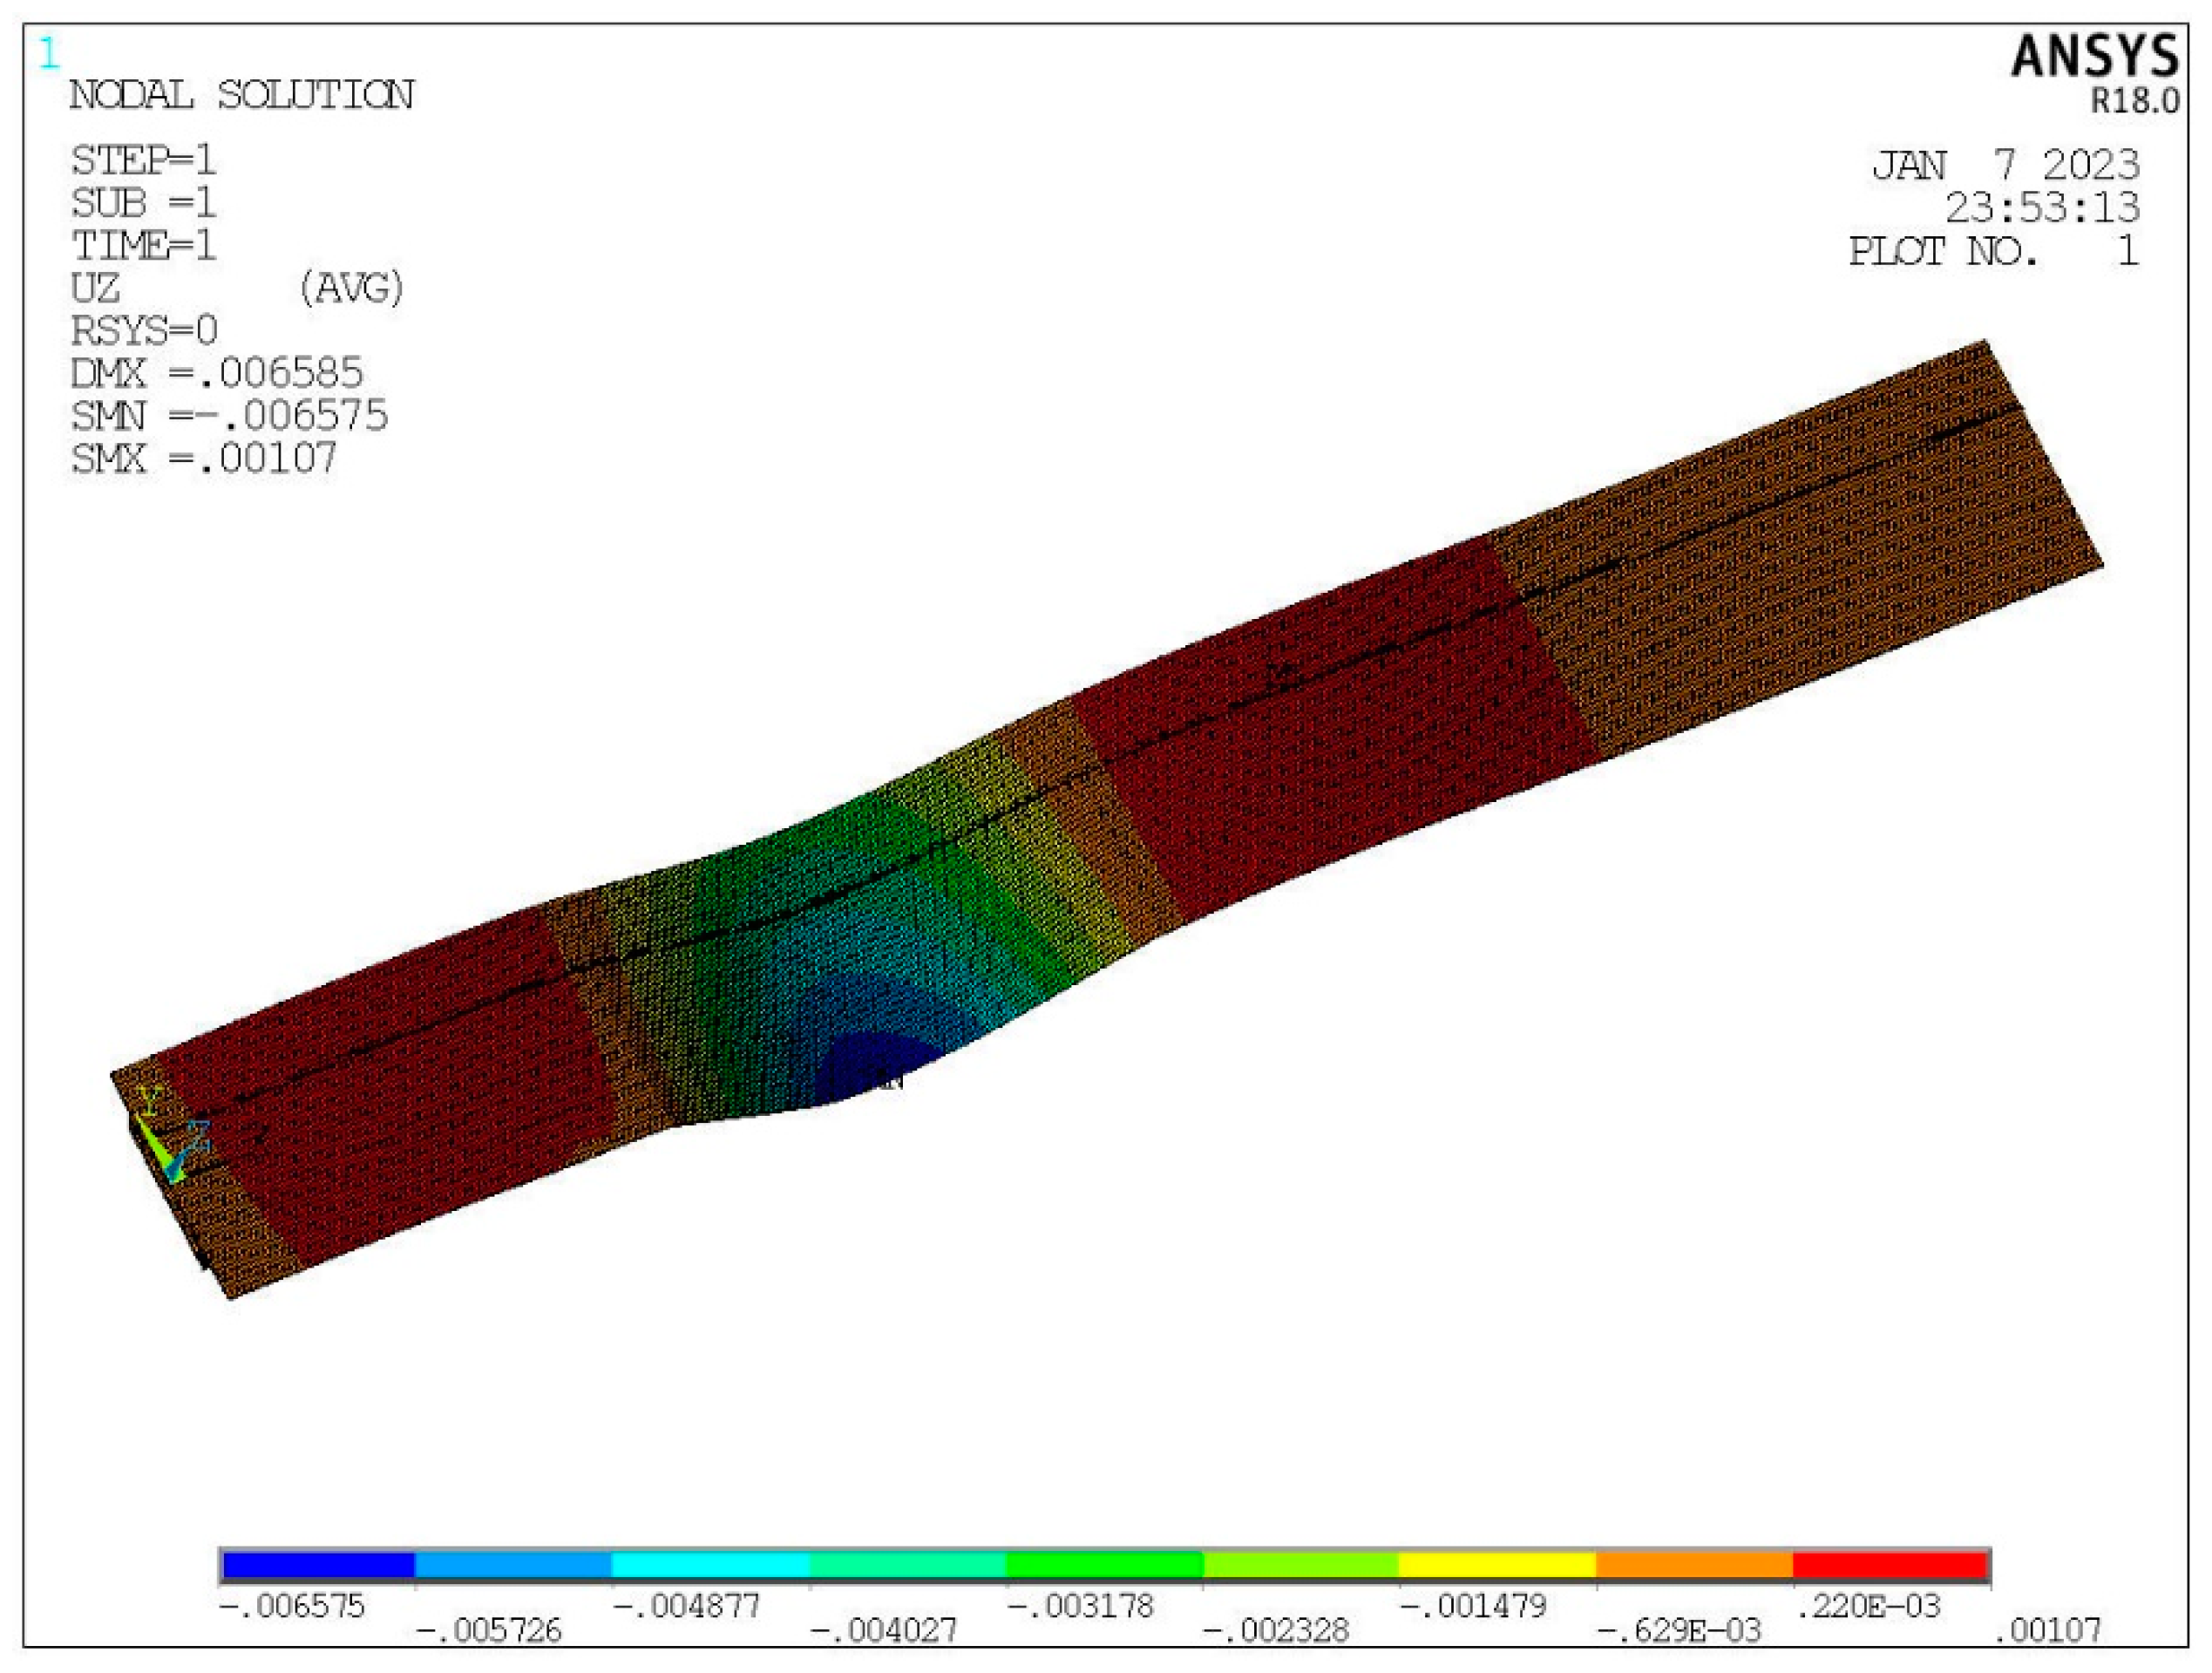
According to the loading scheme of the field test, ANSYS is used to simulate the bearing displacement changes under different working conditions, and the results are shown in Figure 13, Figure 14 and Figure 15.
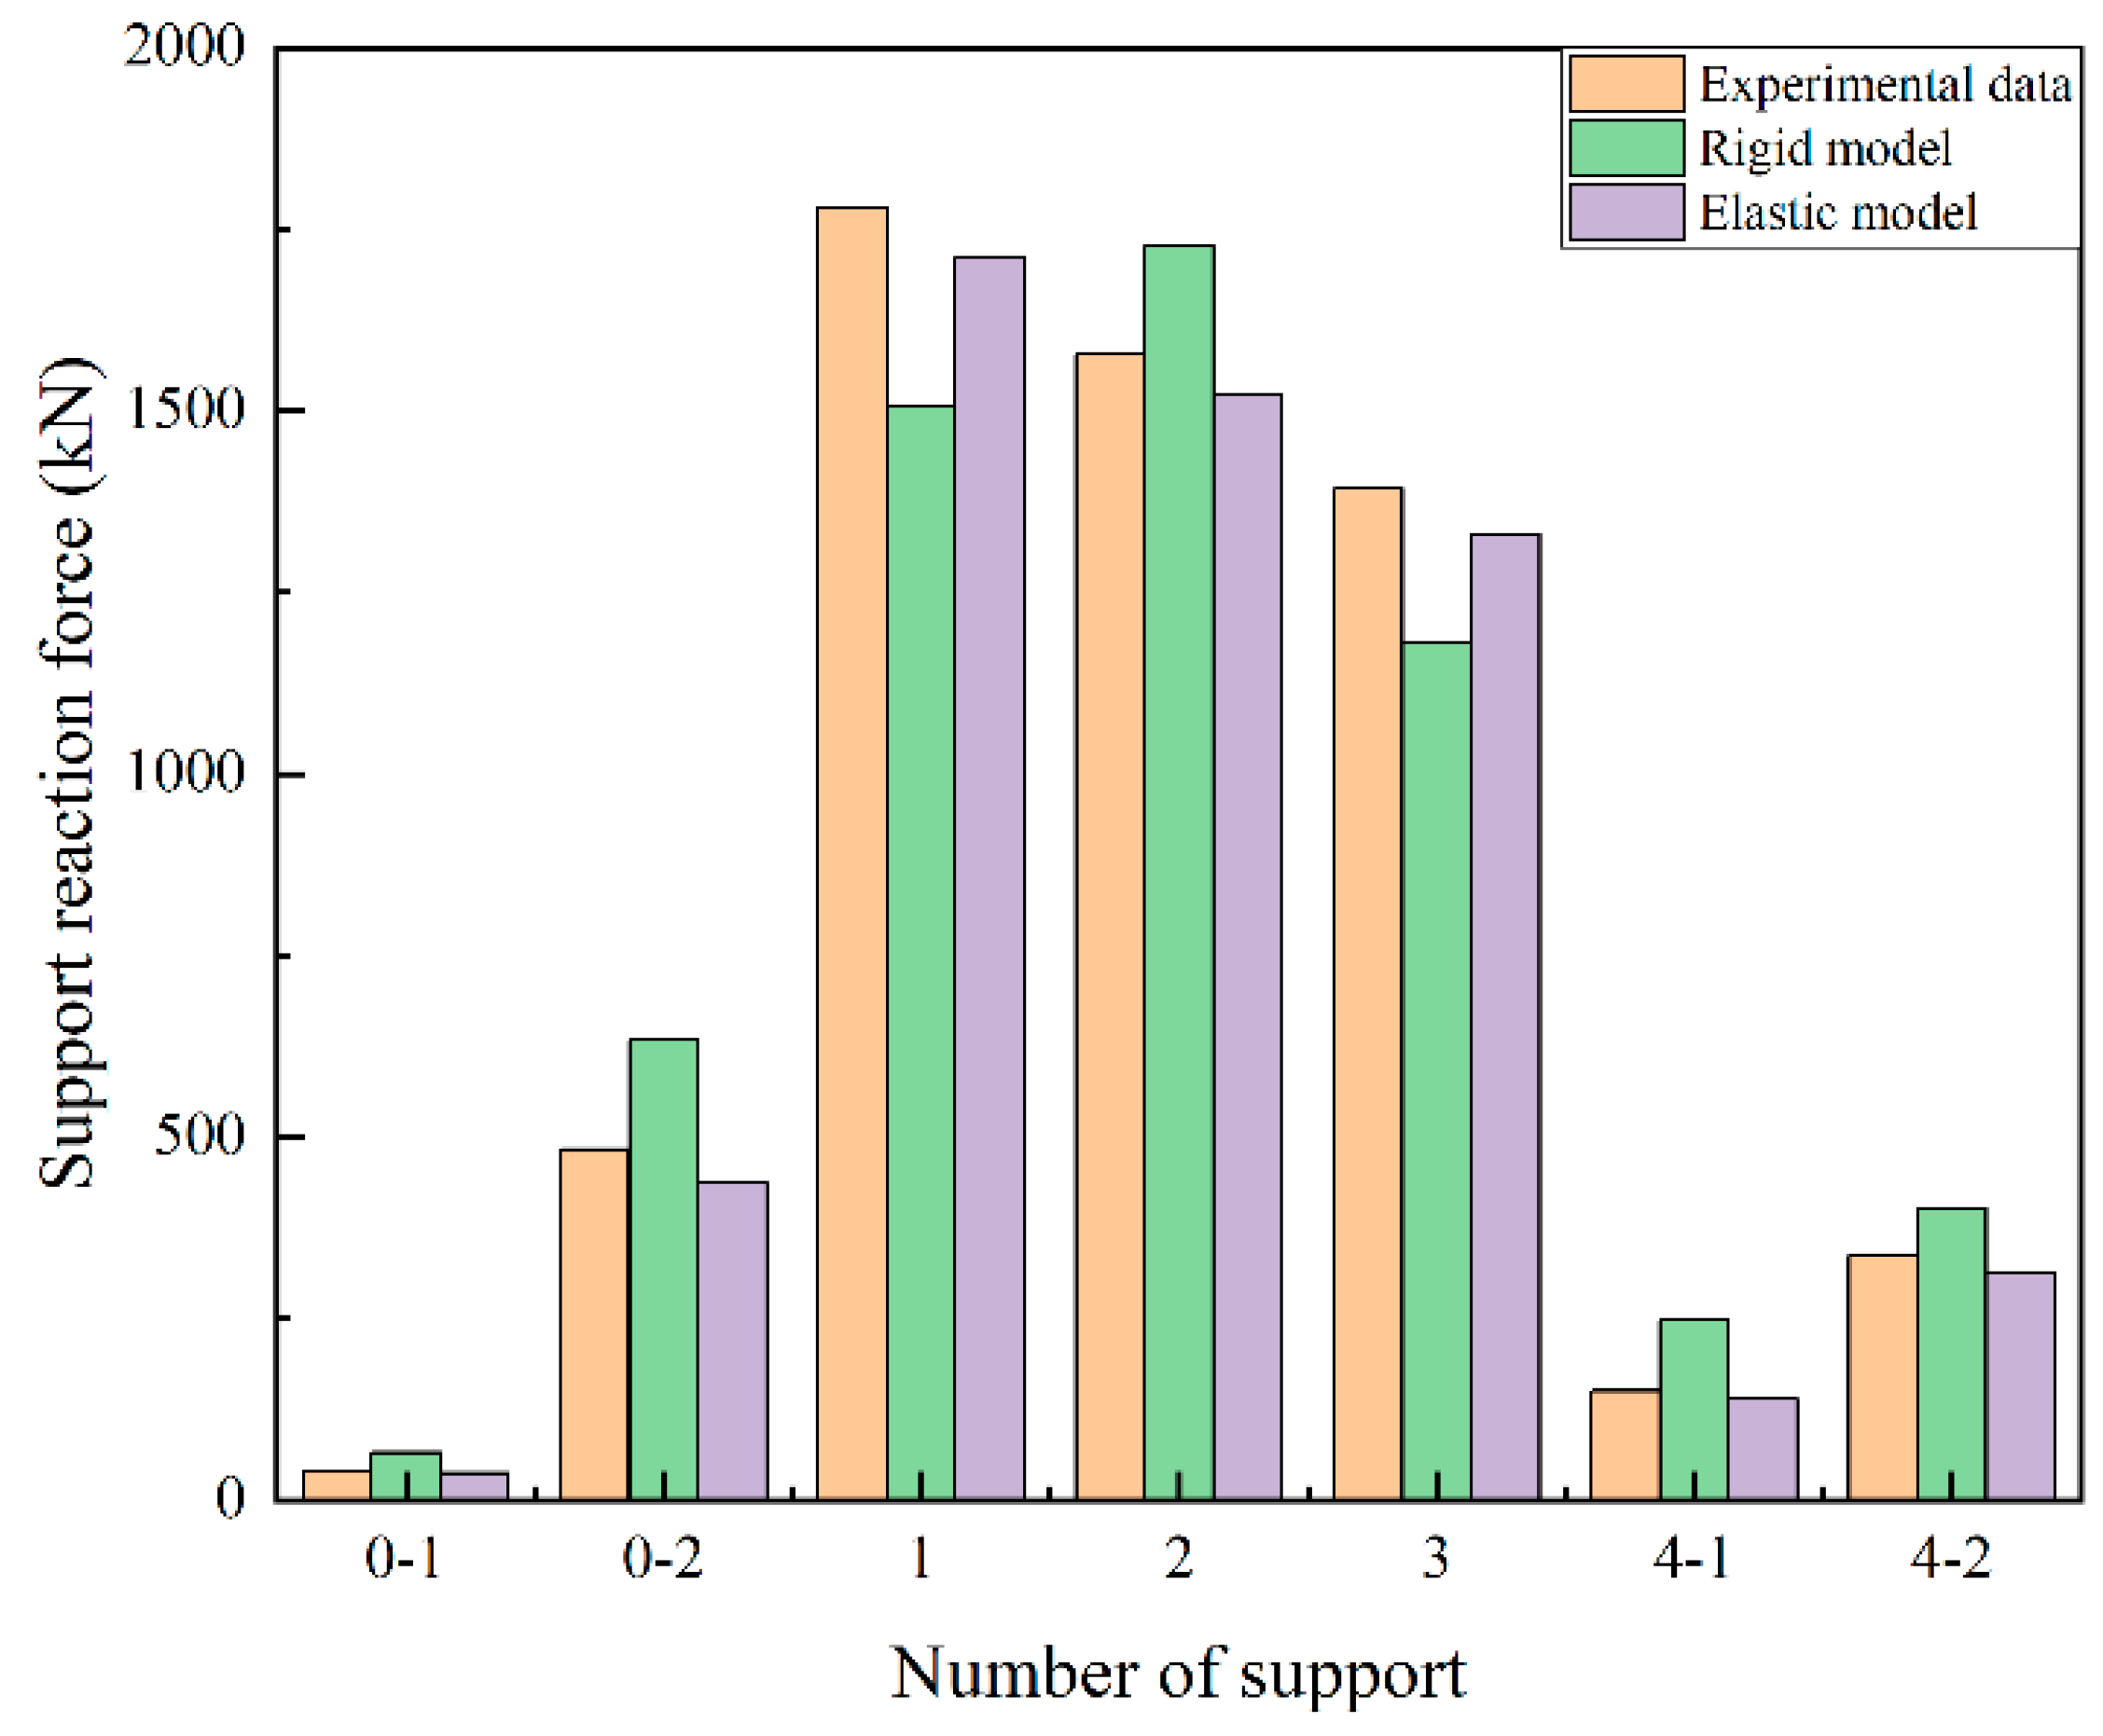
The strain of each bearing under different working conditions is measured in the field test, the corresponding compression elastic modulus of each bearing type is found, and the change in the reaction force of each bearing under different working conditions is calculated. The comparison results of the bearing reaction between the rigid model and the elastic model established in ANSYS are shown in Figure 16, Figure 17 and Figure 18.
In Figure 19, Figure 20 and Figure 21, Serial Numbers 0-1, 0-2, 4-1, and 4-2 are end supports, in which Serial Numbers 0-1 and 4-1 are side-end supports without an eccentric load, and Serial Numbers 1, 2, and 3 are middle supports. Two conclusions can be drawn from the graph:
(1)
With increasing eccentric load, the reaction force of the side-end support without an eccentric load gradually decreases, which is in line with the capsizing mechanism of the single-column pier mentioned above.
(2)
Under the three different working conditions of single-truck loading, double-vehicle loading, and triple-vehicle loading, the calculation results of the bearing reaction of the elastomer FE model are closer to the field test data. At supports 0-1 and 4-1, the bearing reaction force calculated by the rigid model is larger than that calculated from the field test data, and the elastic model calculates that the bearing reaction force is less than that calculated from the field test data. Therefore, in the FE simulation, it is more practical and safer to consider the superstructure of the bridge as an elastic model.
By observing Figure 12, Figure 13 and Figure 14, it is still impossible to visually compare the error ratio between the rigid model, elastic model, and field data. The rationality of the rigid model and the elastic model can be further compared by calculating the error percentage of the reaction force of each support.
The error percentage can be calculated by using the following special formula:
E r r o r   P e r c e n t a g e = | R R | R × 100 %
where R is the force representing the bearing measured by the field test, and R is the force representing the bearing calculated by the FE model.
Figure 19, Figure 20 and Figure 21 clearly show that the numerical simulation effect of the elastic FE model is far superior to that of the rigid FE model. Under the three loading modes, the error percentage of the elastic model is always less than 10%, while the maximum error percentage of the rigid model exceeds 60%. For the 0-1 and 4-1 bearings, the error percentage of the rigid model is much larger than that of the elastic model, and the 0-1 and 4-1 bearings are the ones that are most prone to bearing voids. Therefore, it is not reliable to use a rigid FE model to analyze the overturning stability of a single-column pier bridge. There is a certain amount of error between the elastic FE model and the field test data, which is mainly due to the long service life of the actual bridge and damage to some concrete. The actual stiffness and strength of the concrete box girder are less than the material stiffness and strength defined in the FE model. In addition, the material stress-strain curve defined in ANSYS is not exactly the same as that of the actual material.

4. Parameter Analysis of the Anti-Overturning Stability of a Single-Column Pier Bridge

After comparison with the field data and the verification of the reliability of the elastic FE model, the factors influencing the stability of single-column pier bridges are further explored. In this section, six influencing parameters of the anti-overturning stability of single-column pier bridges are selected, namely, the side-to-main span ratio, the bridge span parameters, the bearing spacing, the eccentric distance, the line weight, and the torsional rigidity. Using the general FE program ANSYS, numerical simulations are carried out many times on the basis of the elastic FE model by changing the above parameters to explore their influences on the overturning stability of single-column pier bridges. According to the simulation results of the elastic model, the end bearing is the most prone to bearing voids. Therefore, when analyzing the factors influencing the collapse resistance stability of single-pier bridges, selecting 0-1, 0-2, 4-1, and 4-2 bearing reaction forces can more representatively reflect the overturning state of single-pier bridges.

4.1. Influence of the Side-to-Main Span Ratio on the Overturning Resistance of a Single-Column Pier

In the parameter analysis of the side-to-main span ratio shown in Figure 22, the side-to-main span ratios are 1, 0.91, 0.88 (the actual side-to-middle span ratio of the bridge), 0.83, 0.77, 0.71, and 0.67. The counterforces of bearings 0-1, 0-2, 4-1, and 4-2 are arranged with the change in the side-to-side-span ratio, as shown in Figure 18. The reaction forces of bearings 0-1, 0-2, 4-1, and 4-2 clearly decrease with a decreasing side-to-main span ratio. Special attention is given to the 0-1 and 4-1 bearings. When the ratio of the side-to-main span is 0.67, the bearing reaction is negative; that is, the bearing becomes empty. This shows that suitably increasing the ratio of the side span to the main span of the bridge is conducive to improving the overturning resistance of the single-column pier bridge.

4.2. Influence of Bridge Span Parameters on the Overturning Resistance of a Single-Column Pier

In the quantitative parameter analysis of the bridge spans shown in Figure 23, FE models of two-span, three-span, four-span, and five-span bridges are established by maintaining a constant total bridge length. To eliminate the influence of the side-to-main span ratio on the overturning resistance of a single-column pier, the span of each bridge span should be kept consistent in the same model. The counterforces of bearings 0-1, 0-2, 4-1, and 4-2 are arranged with the number of bridge spans, as shown in Figure 19. With increasing bridge lengths, the reaction forces of bearings 0-1, 0-2, 4-1, and 4-2 decrease. The results show that under the condition of a constant total bridge length, reducing the span division can effectively improve the collapse resistance of single-column pier bridges.

4.3. Influence of the Bearing Spacing on the Overturning Resistance of a Single-Column Pier

In the parameter analysis of the bearing spacings shown in Figure 24, the bearing spacings are 1 m, 2 m, 3 m, and 4 m (the actual bridge bearing spacing). The counterforces of bearings 0-1, 0-2, 4-1, and 4-2 are arranged as shown in Figure 24. The 0-1 bearing and 4-1 bearing are located on the other side of the eccentric load, so there is a great risk of overturning. Figure 24 clearly shows that with increasing bearing spacing, the bearing reaction force of the 0-1 bearing and 4-1 bearing increases. When the bearing spacing is 1 m and 2 m, the bearing reaction of the 0-1 bearing and 4-1 bearing is negative. When the bearing spacing is 3 m and 4 m, all bearing reaction forces are positive. The results show that the stability of the single-column pier bridges and the overall anti-overturning capacity can be improved by properly adjusting and increasing the bearing spacing of the bridge in the actual project.

4.4. Influence of Eccentric Distance on the Overturning Resistance of a Single-Column Pier

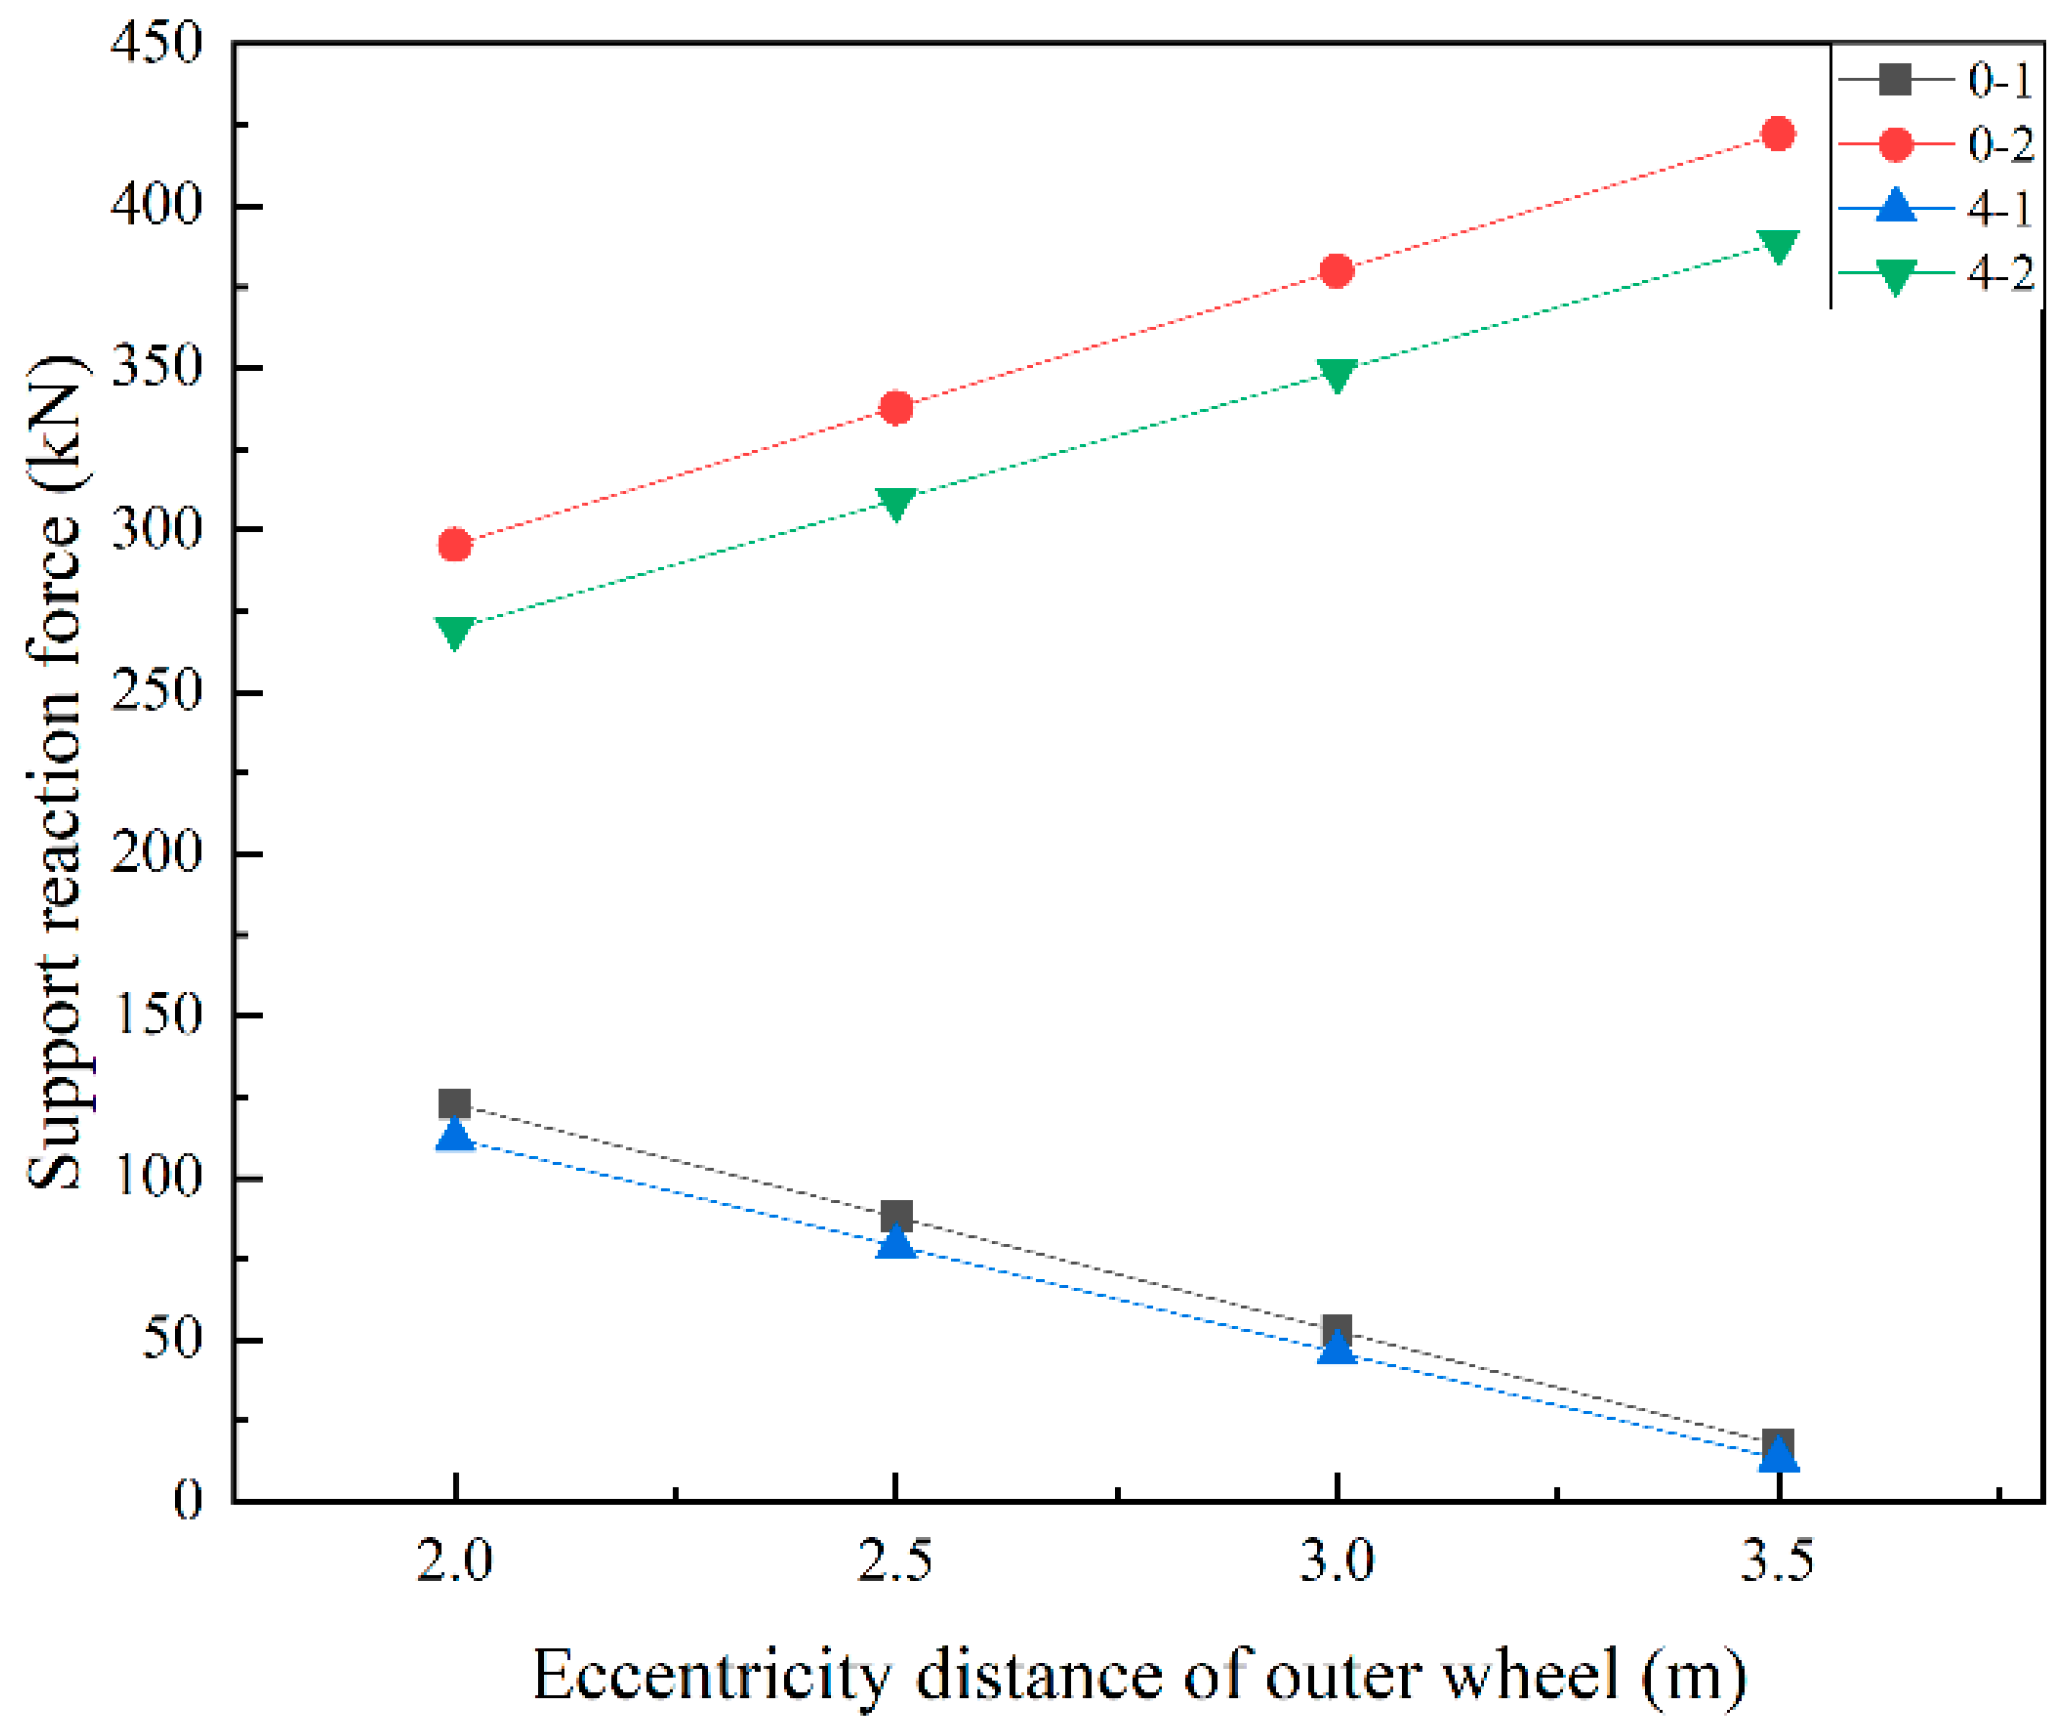
In the loading position parameter analysis shown in Figure 25, the eccentric distances of the outer wheel of the loading vehicle are 2 m, 2.5 m, 3 m, and 3.5 m. The reaction forces of the 0-1, 0-2, 4-1, and 4-2 supports are arranged with the changes in the vehicle loading positions, as shown in Figure 21. The reaction force of the 0-1 and 4-1 supports decreases as the loading position shifts outwards. This shows that when the eccentric loading distance of the vehicle is too large, the bridge bearing easily separates, and there is even the risk of overturning. Therefore, in traffic management, it is essential to control the driving position of some heavy vehicles.

4.5. Influence of Line Weight on the Overturning Resistance of a Single-Column Pier

In the concrete weight parameter analysis shown in Figure 26, the concrete weights are 25 kN/m3, 26 kN/m3, 27 kN/m3, 28 kN/m3, 29 kN/m3, and 30 kN/m3. In fact, here, we include the second stage load as a part of the concrete weight to simplify the change in the G2 load and consider the impact of the change in superimposed nonstructural loads (G2) on the structure. The counterforces of bearings 0-1, 0-2, 4-1, and 4-2 are arranged with the changes in the concrete weights, as shown in Figure 22. With increasing concrete weight, the reaction forces of the 0-1, 0-2, 4-1, and 4-2 supports increase. This shows that increasing the concrete weight of the bridge can effectively improve the overturning moment of single-column pier bridges, thus improving the overturning resistance.

4.6. Influence of Torsional Rigidity on the Overturning Resistance of a Single-Column Pier

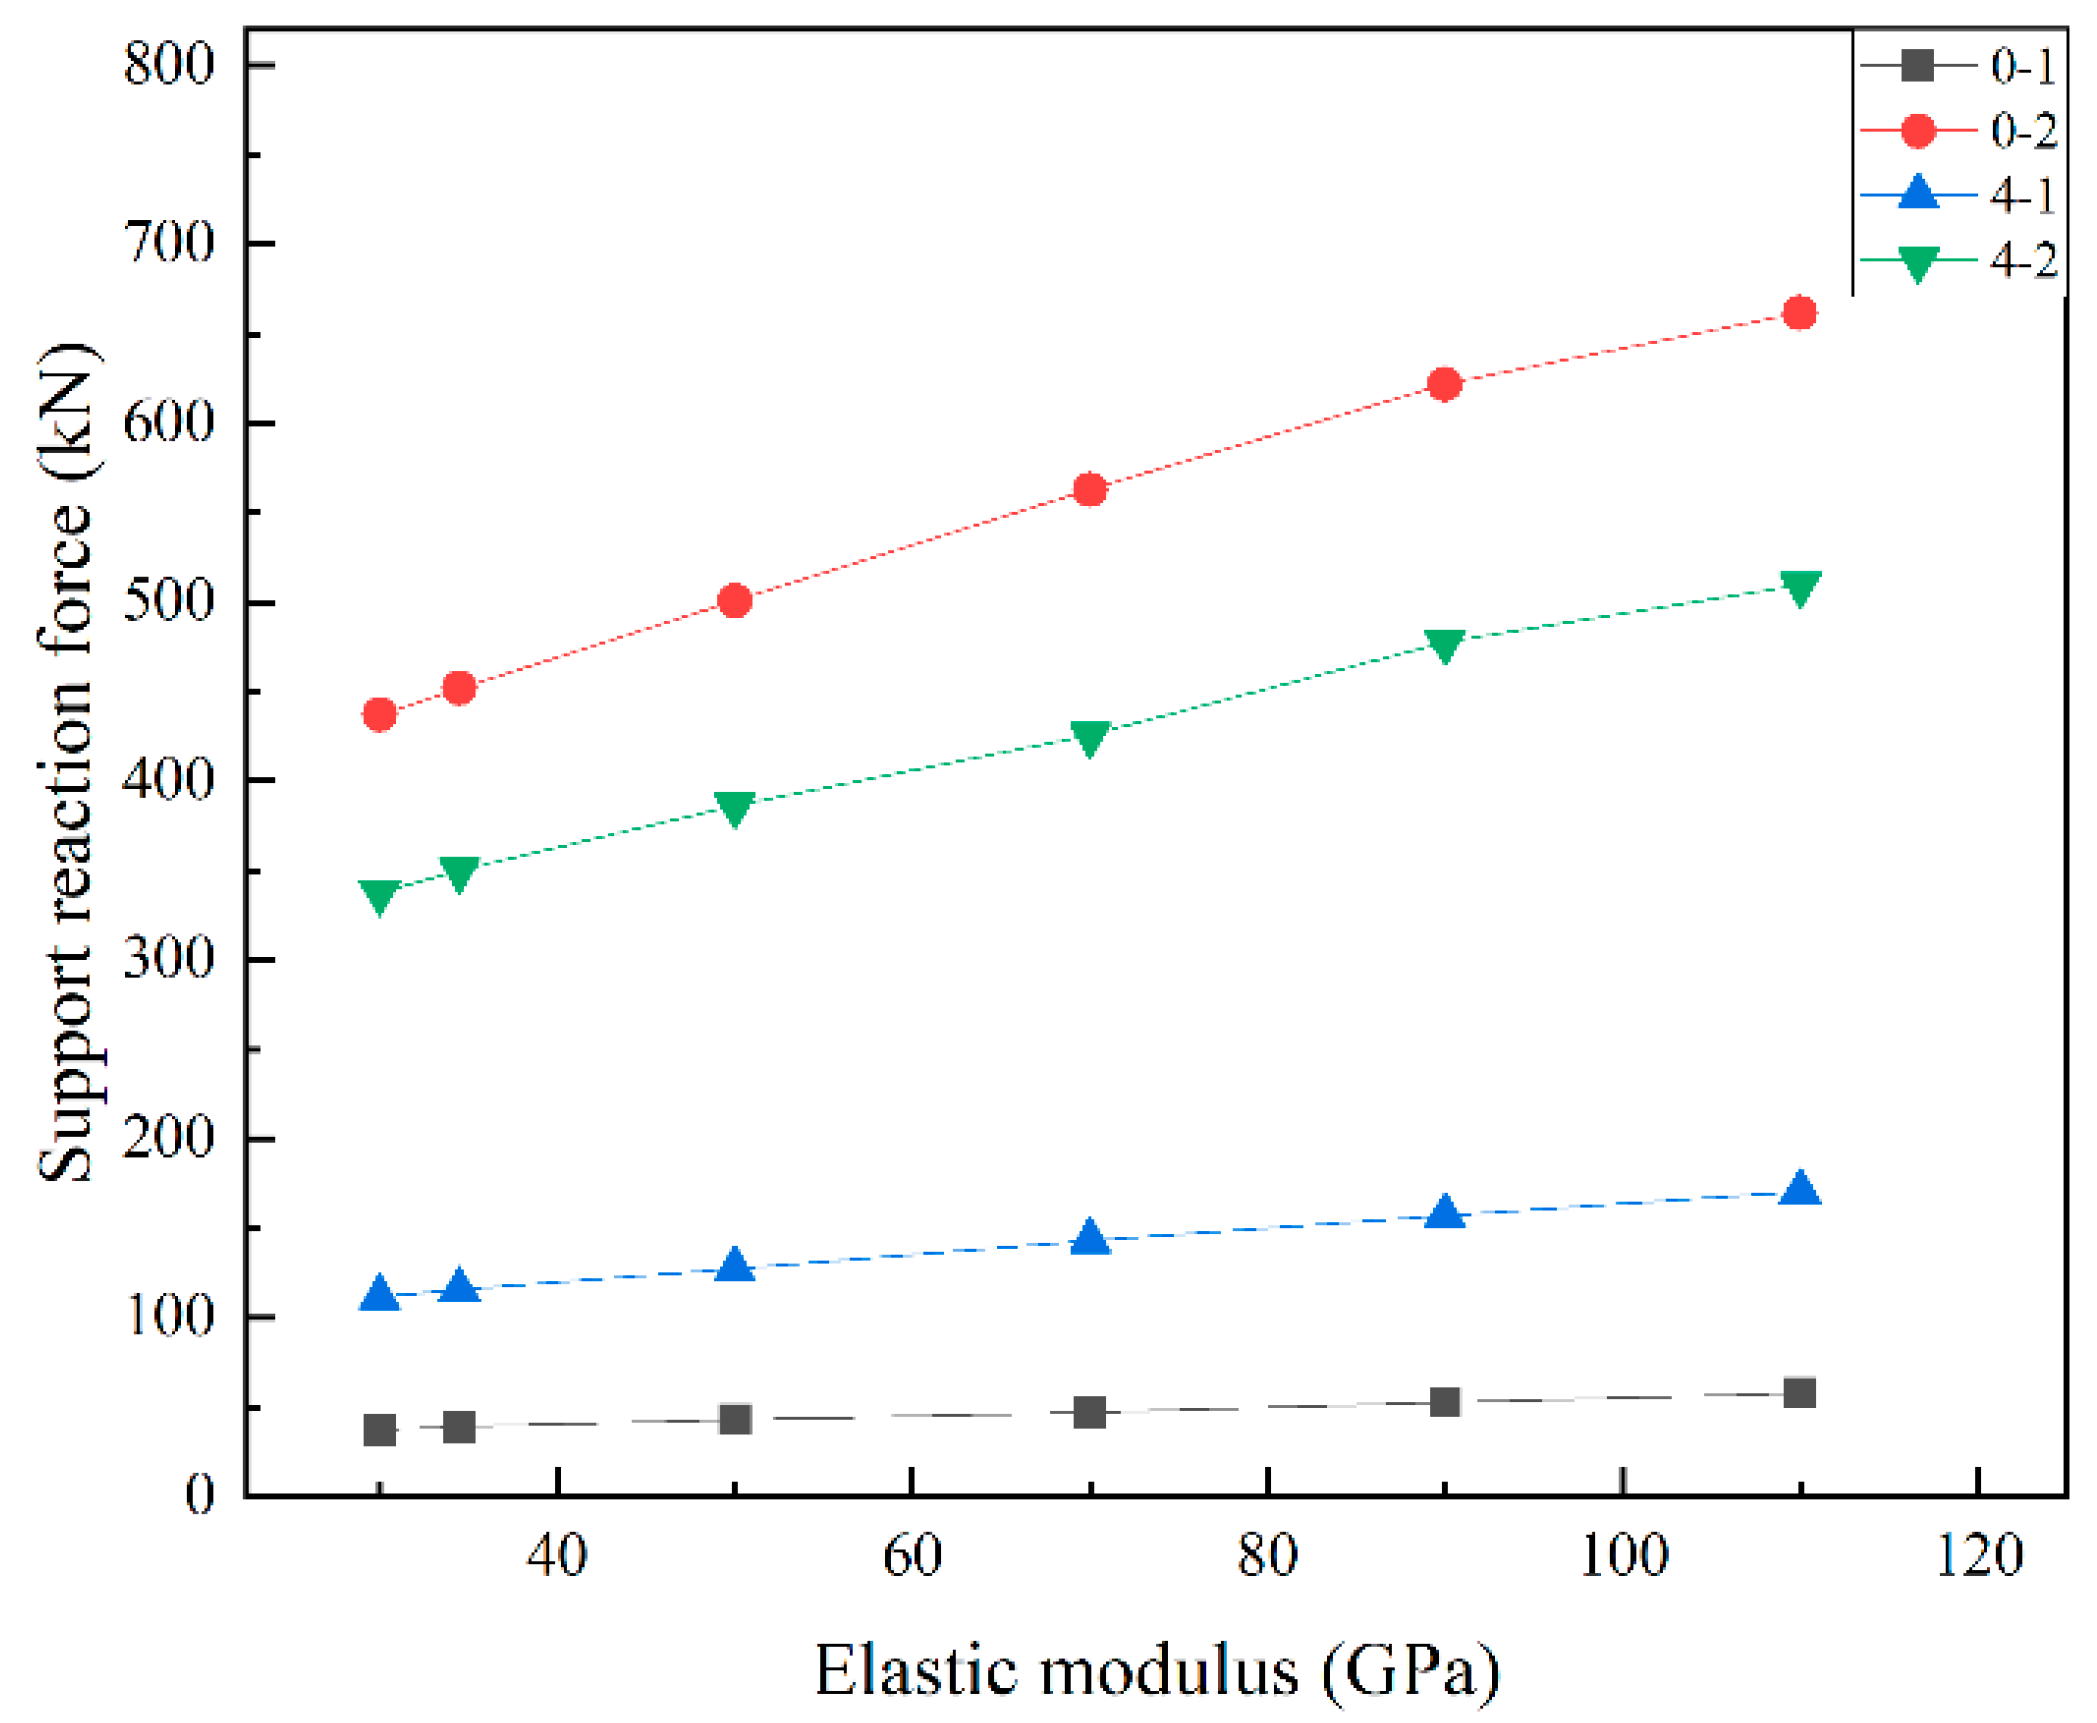
In the torsional stiffness parameter analysis shown in Figure 27, the elastic moduli of the bridge superstructure are 30 GPa, 34.5 GPa (the actual elastic modulus of the bridge superstructure), 50 GPa, 70 GPa, 90 GPa, and 110 GPa. The reaction forces of supports 0-1, 0-2, 4-1, and 4-2 are shown in Figure 20. With increasing torsional stiffness, the reaction forces of bearings 0-1, 0-2, 4-1, and 4-2 also increase. The results show that, in practical engineering, by improving the torsional stiffness of the bridge, the stability and overall overturning resistance of the single-pier bridge can be improved.

5. Conclusions

In this paper, the K503 + 647.4 separation overpass of the Hegang–Dalian Expressway is taken as the engineering background, and an experimental study on the anti-overturning stability of single-column pier bridges is carried out onsite. Through the general FE program ANSYS, a field test is simulated, and the following conclusions are obtained:
(1)
By establishing a rigid model and an elastic model, the support reaction force calculated by the two FE models is compared with the support reaction force obtained in the field, which shows that it is more reliable and safer to consider the elastic model of the girder.
(2)
The rotational and overturning ultimate loads of the single-column pier girder bridge are related to the ratio of the side to the main span of the bridge, the number of spans, the bearing spacing, the loading position, the concrete weight, and the torsional rigidity. When the edge-to-medium span ratio gradually decreases, the bearing reaction force at the end bearing decreases until it fails. As the bridge span increases, the bearing reaction force decreases. As the bearing spacing increases, the bearing reaction force at the end bearing increases. As the eccentric loading distance of the vehicle increases, the bearing reaction force gradually decreases. As the concrete weight increases, the bearing reaction force at the end bearing increases. Finally, when the torsional stiffness of the bridge increases, the bearing reaction force at the end bearing also increases.
(3)
In the overturning reinforcement of the single-column pier, it is beneficial to increase the bridge edge-to-span ratio and consider increasing the bearing spacing to improve the overturning stability of the single-column pier bridge. At the same time, under the condition that the total length of the bridge remains unchanged, reducing the span of the bridge can also effectively enhance the overturning performance of a bridge that has one column pier. In addition, the bridge self-weight provides an overturning moment during the overturning process, so the influence of this self-weight needs to be considered during the design calculation. In the operation of the single-column pier, large heavy vehicles are restricted to taking the middle lane to prevent the bearing from failing.
(4)
For bridges with single-column piers that need to be reinforced, the replacement of supports with large lateral dimensions and low heights should be considered; for bridges with single-column piers with double-support systems, the distance between supports can be increased. For bridges with single-column piers that are not easy to replace or where the pier beam is consolidated, diagonal braces can be installed at the pier, or limit devices at the joints of the pier beam can be set to reduce the risk of overturning.
(5)
Previous research on single-column piers lacked practicality. In this paper, the calculation theory and FE simulation method of a single-column pier are verified by carrying out a real bridge test, which provides valuable data for the study of the anti-overturning stability of a single-column pier. In the future, we plan to focus on the study of the anti-overturning stability of curved girder bridges and steel box girder bridges with single-column support structures from the perspectives of structure and material.

Author Contributions

Conceptualization, H.X. and Q.G.; methodology, H.X. and Q.G.; software, Q.L., D.L. and H.J.; validation, Q.L., D.L. and T.W.; formal analysis, H.X., Q.L. and D.L.; investigation, H.X. and D.L.; writing—original draft preparation, H.X., Q.L. and H.J.; writing—review and editing, D.L. and Q.G.; supervision, Q.G.; funding acquisition, H.X. and Q.G. All authors have read and agreed to the published version of the manuscript.

Funding

This study is supported by the Key Research and Development Program of the Shandong Province of China (Grant No: 2019JZZY010427), the Key Research and Development Program of the Heilongjiang Province of China (Grant No: GY2021ZB0063), and the National Natural Science Foundation of China (Grant No: 52078164).

Institutional Review Board Statement

Not applicable.

Informed Consent Statement

Not applicable.

Data Availability Statement

Not applicable.

Conflicts of Interest

The authors declare that they have no known competing financial interests or personal relationships that could have appeared to influence the work reported in this paper.

References

  1. Wan, S.C.; Huang, Q. A review of overturning stability of continuous girder bridge with single column pier under deflection load. J. China Foreign Highw. 2015, 35, 156–161. [Google Scholar]
  2. McManus, P.; Nasir, G. Horizontally Curved Girders-State of the Art. J. Struct. Div. 1969, 20, 34–56. [Google Scholar] [CrossRef]
  3. Li, G.H. Structural Stability and Vibration of Bridges; China Railway Press: Beijing, China, 1992; pp. 154–196. [Google Scholar]
  4. Streit, W.; Mang, R. Uberschlagiger Kippsicherheitsnachweis fir Stahlbeton-und Spannbetonbinder. Bauingenieur 1984, 59, 433–439. [Google Scholar]
  5. Hamblye, C. Overturing instability. J. Geotech. Eng. 1990, 116, 704–709. [Google Scholar] [CrossRef]
  6. Michaltsos, G.T.; Raftoyiannis, I.G. A mathematical model for the rocking, overtuming andshifting problems in bridges. Eng. Struct. 2008, 30, 3587–3594. [Google Scholar] [CrossRef]
  7. Scattarreggia, N.; Qiao, T.Y. Earthquake Response Modeling of Corroded Reinforced Concrete Hollow-Section Piers via Simplified Fiber-Based FE Analysis. Sustainability 2021, 13, 9342. [Google Scholar] [CrossRef]
  8. Xu, Z.; Lu, X.Z. Progressive-Collapse Simulation and Critical Region Identification of a Stone Arch Bridge. J. Perform. Constr. Facil. 2013, 27, 43–52. [Google Scholar] [CrossRef] [Green Version]
  9. Scattarreggia, N.; Galik, W. Analytical and numerical analysis of the torsional response of the multi-cell deck of a collapsed cable-stayed bridge. Eng. Struct. 2022, 265, 114412. [Google Scholar] [CrossRef]
  10. Pennington, S.M. The Bussey railroad bridge collapse. In Proceedings of the 5th Forensic Engineering Congress, Washington, DC, USA, 10–15 November 2009; pp. 415–428. [Google Scholar]
  11. Pen, N.T.; Steven, M. Single-Pier Bridge Lateral Stability Analysis in Dynamic Load Conditions. In Proceedings of the Fourth International Conference on Transportation Engineering, Chengdu, China, 19–20 October 2013; pp. 753–772. [Google Scholar]
  12. Chen, Y.; Xin, G.; Li, Y. Anti-overturning stability study of a continuous steel-concrete composite girder bridge with single column piers. Chall. Adv. Sustain. Transp. Syst. 2014, 1, 571–579. [Google Scholar]
  13. Peng, W.B.; Dai, F. Research on Mechanism of Overturning Failure for Single-column Pier Bridge. Comput. Civ. Build. Eng. 2014, 2, 1747. [Google Scholar]
  14. Peng, W.B.; Zhao, H.; Dai, F.; Taciroglu, E. Analytical Method for Overturning Limit Analysis of Single-Column Pier Bridges. J. Perform. Constr. Facil. 2017, 31, 04017007. [Google Scholar] [CrossRef]
  15. Xiong, W.; Cai, C.S.; Kong, B.; Ye, J.S. Overturning-Collapse Modeling and Safety Assessment for Bridges Supported by Single-Column Piers. J. Bridge Eng. 2018, 22, 04017084. [Google Scholar] [CrossRef]
  16. Shi, X.F.; Zhou, Z.J.; Ruan, X. Failure Analysis of a Girder Bridge Collapse under Eccentric Heavy Vehicles. J. Bridge Eng. 2016, 21, 05016009. [Google Scholar] [CrossRef]
  17. Shi, X.F.; Cao, Z.; Ma, H.Y.; Ruan, X. Failure Analysis on a Curved Girder Bridge Collapse under Eccentric Heavy Vehicles Using Explicit Finite Element Method: Case Study. J. Bridge Eng. 2018, 22, 05018001. [Google Scholar] [CrossRef]
  18. Dong, F.H.; Zhang, H.H. Probabilistic Safety Factor Calculation of the Lateral Overturning Stability of a Single-Column Pier Curved Bridge under Asymmetric Eccentric Load. Symmetry 2022, 14, 1534. [Google Scholar] [CrossRef]
  19. Ge, L.F.; Dan, D.H.; Yan, X.F.; Zhang, K.L. Real time monitoring and evaluation of overturning risk of single-column-pier box-girder bridges based on identification of spatial distribution of moving loads. Eng. Struct. 2020, 210, 110383. [Google Scholar] [CrossRef]
  20. JTG/T 3362-2018; Specifications for Design of Highway Reinforced Concrete and Prestressed Concrete Bridges and Culverts. Standards Press: Beijing, China, 2018.
  21. JTG D60-2015; General Specifications for Design of Highway Bridges and Culverts. Standards Press: Beijing, China, 2015.
  22. AASHTO. AASHTO LRFD Bridge Design Specifications. Standard Specifications for Highway Bridges; AASHTO: Washington, DC, USA, 2002. [Google Scholar]
  23. JTG D62-2004; General Code for Desigh of Highway Bridges and Culverts. Standards Press: Beijing, China, 2004.
  24. JTG D62-2012; Specifications for Design of Highway Reinforced Concrete and Prestressed Concrete Bridges and Culverts. Standards Press: Beijing, China, 2012.
  25. Li, L.; Zhang, L. Safety assessment of anti-overturning of single pier of bridge. In Proceedings of the International Conference on Smart Transportation and City Engineering, Chongqing, China, 6–8 August 2021; Volume 12050, p. 120502N. [Google Scholar]
  26. Zhuang, D.L.; Xiao, R.C. Failure analysis for overall stability against sliding and overturning of a girder bridge. Eng. Fail. Anal. 2019, 109, 104271. [Google Scholar] [CrossRef]
  27. Cheng, B. Theoretical Study on the Calculation of Anti-Overturning Capacity of Single Column Pier Curved Bridge. Master’s Thesis, Zhejiang University of Technology, Hangzhou, China, 2016. [Google Scholar]
  28. Pan, R.D. Research on Calculation Theory and Method of Anti-Overturning of Straight Single-Column Bridge. Master’s Thesis, Zhejiang University of Technology, Hangzhou, China, 2016. [Google Scholar]
  29. Song, G.H.; Che, D.L. Overturning Axis Selection in Curved Box-Girder Bridges with Single-Column Piers. Math. Probl. Eng. 2018, 2018, 9206138. [Google Scholar] [CrossRef] [Green Version]
  30. Chen, L.; Wu, H. Full-Scale Experimental Study of a Reinforced Concrete Bridge Pier under Truck Collision. J. Bridge Eng. 2021, 26, 05021008. [Google Scholar] [CrossRef]
  31. Fang, C.; Yosef, T.Y. Residual Axial Capacity Estimates for Bridge Columns Subjected to Combined Vehicle Collision and Air Blast. J. Bridge Eng. 2021, 26, 7. [Google Scholar] [CrossRef]
  32. Zhao, M.H.; Deng, Y.S.; Liu, J.H. Finite element analysis of displacements of double pile-column bridge piers at steep slope. J. Cent. South Univ. 2013, 20, 3683–3688. [Google Scholar] [CrossRef]
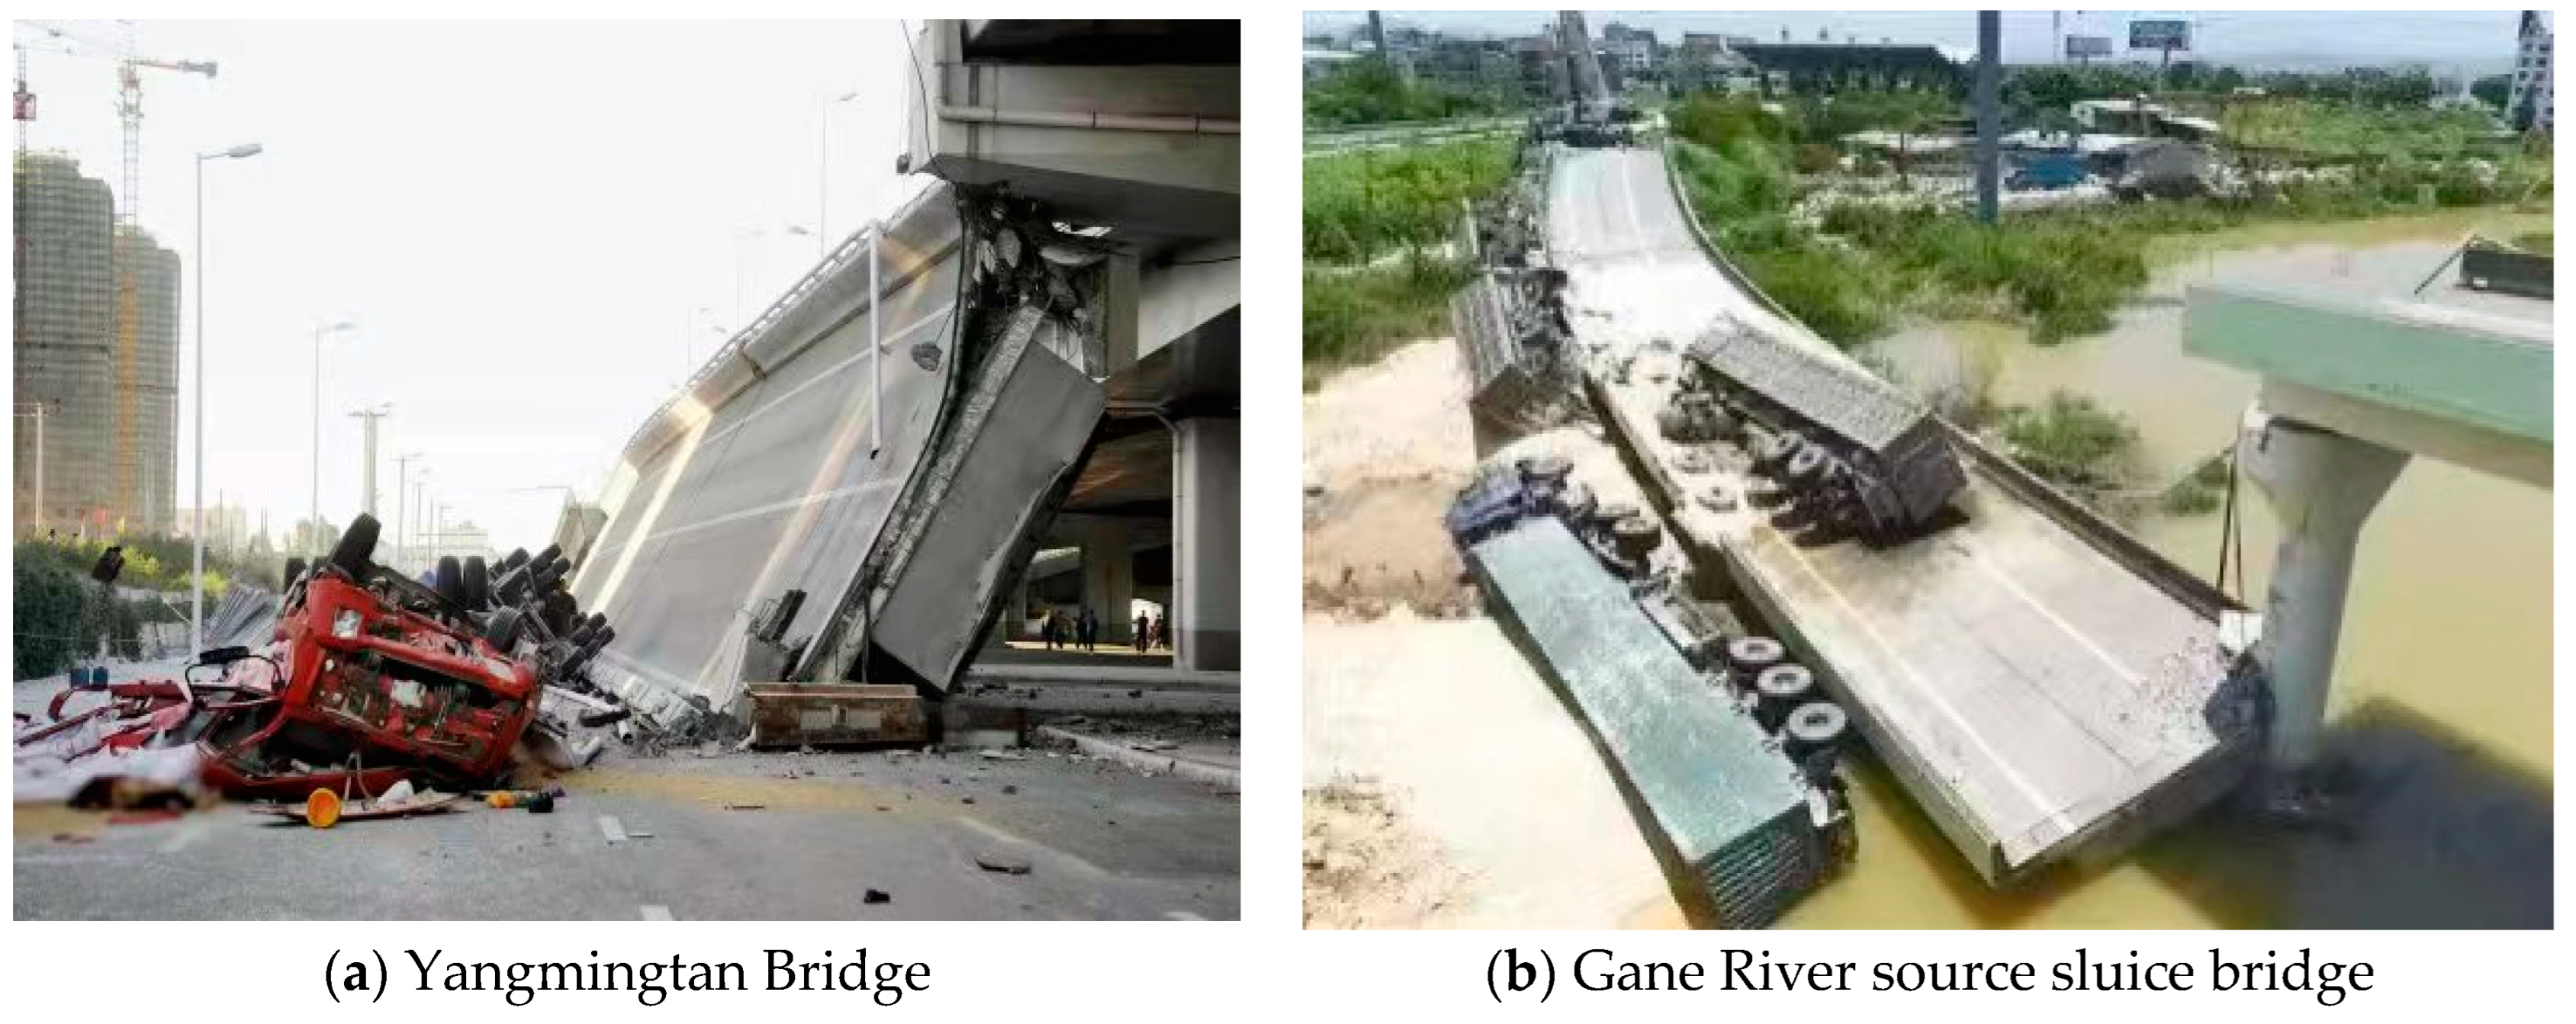
Figure 1. Diagram of a partial overturning accident of a bridge in service.
Sustainability 15 01545 g001
Figure 2. The real picture of separated overpass of the Hegang–Dalian Expressway.
Sustainability 15 01545 g002
Figure 3. Bridge layout diagram (unit: cm).
Sustainability 15 01545 g003
Figure 4. Schematic diagram of a loaded truck.( In the figure, “a” refers to the wheel front axle and the center axle wheelbase, “b” refers to the center axle and the rear wheelbase, “c” refers to the left wheel and right wheelbase of the truck.)
Sustainability 15 01545 g004
Figure 5. Layout of the most unfavorable location of the lane load (unit: cm).
Sustainability 15 01545 g005
Figure 6. Influence line of the No. 0–2 support reaction force.
Sustainability 15 01545 g006
Figure 7. Field displacement measurement.
Sustainability 15 01545 g007
Figure 8. Strain measurement point arrangement.
Sustainability 15 01545 g008
Figure 9. Data observation and reading.
Sustainability 15 01545 g009
Figure 10. Calculation diagram.
Sustainability 15 01545 g010
Figure 11. Finite element model diagram of the box girder.
Sustainability 15 01545 g011
Figure 12. Full-bridge finite element model.
Sustainability 15 01545 g012
Figure 13. Displacement variation diagram of the support (single truck).
Sustainability 15 01545 g013
Figure 14. Displacement variation diagram of the support (double truck).
Sustainability 15 01545 g014
Figure 15. Displacement variation diagram of the support (three trucks).
Sustainability 15 01545 g015
Figure 16. Comparison diagram of the loading reaction of a single truck.
Sustainability 15 01545 g016
Figure 17. Comparison diagram of the loading reaction of two trucks.
Sustainability 15 01545 g017
Figure 18. Comparison diagram of the loading reaction of three trucks.
Sustainability 15 01545 g018
Figure 19. Single-truck loading error percentage.
Sustainability 15 01545 g019
Figure 20. Double-truck loading error percentage.
Sustainability 15 01545 g020
Figure 21. Triple truck loading error percentage.
Sustainability 15 01545 g021
Figure 22. Influence of the side-span ratio on the bearing reaction force.
Sustainability 15 01545 g022
Figure 23. Influence of bridge span parameters on the bearing reaction force.
Sustainability 15 01545 g023
Figure 24. Influence of bearing spacing on the bearing reaction force.
Sustainability 15 01545 g024
Figure 25. Influence of eccentric distance on the bearing reaction force.
Sustainability 15 01545 g025
Figure 26. Influence of line weight on the bearing reaction force.
Sustainability 15 01545 g026
Figure 27. Influence of torsional rigidity on the change in the bearing reaction force.
Sustainability 15 01545 g027
Table 1. Statistics of bridge-overturning accidents on single-column piers.
TimesSitesAftermath
23 October 2007Inner Mongolia Viaduct4 injured
15 July 2009Zinjin Expressway Gate Road Bridge6 dead, 4 injured
21 February 2011Zhejiang Chunhui Bridge3 injured
24 August 2012Harbin Yangmingtan Bridge3 dead, 5 injured
19 June 2015Gan-E Expressway Heyuan Gate Road Bridge1 dead, 4 injured
10 October 2019Wuxi City Viaduct3 dead, 2 injured
18 December 2021Huayu Expressway Huawu Interchange Gate Road Bridge4 dead, 8 injured
Table 2. Technical parameters of the loaded vehicles.
Serial NumberAxis Distance (cm)Rear Axle Wheelbase of c (cm)Front Axle Weight (kN)Total Weight of Middle and Rear Axle (kN)Total Weight (kN)
Front Center Wheelbase of aMiddle and Rear Wheel of b
140014018080320400
Table 3. Vehicle longitudinal loading position (unit: m).
ConditionWheel Loading Position
Vehicle 1Vehicle 2Vehicle 3
Rear AxleMiddle AxleFront AxleRear AxleMiddle axleFront AxleRear AxleMiddle AxleFront Axle
Single vehicle16.61822------
Double vehicle10.411.815.820.321.725.7---
Triple vehicle7.79.113.117.619.023.027.528.932.9
Table 4. Bearing reaction force under bridge gravity (unit: kN).
Bearing Number0-10-21234-14-2
Reaction force242.1242.11414.91362.01414.9242.1242.1
Disclaimer/Publisher’s Note: The statements, opinions and data contained in all publications are solely those of the individual author(s) and contributor(s) and not of MDPI and/or the editor(s). MDPI and/or the editor(s) disclaim responsibility for any injury to people or property resulting from any ideas, methods, instructions or products referred to in the content.