Article

Digital Financial Inclusion, Cultivated Land Transfer and Cultivated Land Green Utilization Efficiency: An Empirical Study from China

1
Faculty of Economics, School of Public Management, Liaoning University, Shenyang 100136, China
2
Faculty of Economics, Sunwah International Business School, Liaoning University, Shenyang 100136, China
*
Author to whom correspondence should be addressed.
Sustainability 2023, 15(2), 1569; https://doi.org/10.3390/su15021569
Submission received: 23 November 2022 / Revised: 1 January 2023 / Accepted: 9 January 2023 / Published: 13 January 2023
(This article belongs to the Special Issue Sustainable Land Use and Management)

Abstract

:
Digital financial inclusion (DFI), characterized by digitalization and inclusiveness, has generally been recognized as a significant promoter of efficiency, effectiveness, and sustainability of agricultural production. Simultaneously, cultivated land green utilization efficiency (CLGUE), which is the significant guarantees of food security, social stability and environmental protection, has attracted increasing attention in the recent decades. In practice, DFI seems to be a vital antecedent of the improvement of CLGUE. However, in the academic field, research on whether and how DFI can affect CLGUE is scarce. In this case, based on triple bottom line theory, this paper theoretically and empirically investigates whether and how DFI can reinforce CLGUE through the mediator of cultivated land transfer (CLT). Using Chinese provincial panel data from 2011 to 2020 and structural equation modelling (SEM) analysis in STATA 16.0, this paper identified the following: (1) DFI can directly facilitate CLGUE; (2) DFI can indirectly improve CLGUE through CLT. (3) DFI has regional heterogeneity in the improvement of CLGUE. Compared to the central and western areas, the positive relationship between DFI and CLGUE in the eastern areas is more obvious; (4) compared with main grain producing and main grain producing and marketing balance areas, the positive relationship in the main grain marketing areas is more obvious. Our research is one of the first to explore the mediating mechanism between DFI and CLGUE from the perspective of CLT.

1. Introduction

Cultivated land occupies 10.20% of the global land surface area, and cultivated land is the main source of grain manufacture and plays a significant role in ensuring ecological security and sustainable development [1,2]. With the rapid growth of the human population, the process of urbanization and industrialization, the shortage of cultivated land and food is steady deterioration in some regions in the world [3,4,5,6]. Since the reform and opening-up in 1978, China has undergone rapid urbanization [7]. As the National Bureau of Statistics of China (2021) reported, China’s urbanization rate increased from 17.92% in 1978 to 63.89% in 2020. In comparison, from only 2013 to 2015, there was an annual decrease of 354,700 hm2 of cultivated land due to the construction occupation [8]. Furthermore, one other issue of concern for China is ecological environment issues, resulting in predatory exploitation and irrational utilization of cultivated land. As the National Soil Pollution survey bulletin (2014) reported, the over-standard rate of soil points in China’s cultivated land is 19.4%, and sewage irrigation and irrational use of fertilizers, pesticides, etc., are the leading reasons for soil pollution of cultivated land [9]. In the context of ecology civilization construction, China’s cultivated land utilization is facing the pressures of transformation from the “extensional” development mode of high-intensity to “connotative” development path of high quality, high efficiency and low pollution.
As a scientific development concept and development method, green development was raised in the Fifth Plenary Session of the 18th CPC Central Committee. Green development’s goal is sustainable development, and the basic condition is resource environmental bearing capacity [10]. China’s national conditions are large population and less land [11], the per household average cultivated area is merely 0.38 ha, which is lower than the world’s average [12]. China’s challenge is to feed 20% global population with less than 10% world’s cultivated land [13]. Considering both the traditional output of economy and grain, and the positive and negative externalities brought by cultivated land utilization, the transition of cultivated land use to green and efficient is necessary in China [14]. Consequently, the comprehensive analysis on CLGUE and exploring its influence mechanism have some valuable significance in theory and practice for improving the level of ecological civilization construction, and providing more ecological welfare for the people [15,16].
In the present literature, the scientific intension, evaluation index and methods, and the affecting factors of CLGUE have raised attention. Regarding to the concept of CLGUE, there is still no consensus in academia. Scholars have explained it from different perspectives. Lu et al. [14] hold that the goal of cultivated land green utilization was to obtain the maximized economic and social output with the minimized environmental pollution. According to Xie et al. [17], the least costly cost of using cultivated land is combined with the largest economic and ecological impacts by CLGUE. How do we evaluate CLGUE? The existing studies usually measure CLGUE comprehensively; furthermore, the evaluation indexes were selected from “input”, “desirable output”, and “undesirable outputs” [11,18,19], the methods adopted mostly involve the super-efficient SBM model [11,18,19], non-radial directional distance function (NDDF) approach [17], super-efficiency EBM model [20], etc. Empirical studies have indicated that CLT, cultivated land management scale [11], urbanization rate, GDP per capita, per capita fixed-asset investment in rural areas, the industrial structure [18], agricultural insurance, agricultural subsidies, cultivated land fragmentation [20], farmers’ dependence on cultivated land and agricultural added value, farmers’ occupational differentiation, agricultural machinery density, and agricultural disaster rate [21] are contributing factors.
Capital is a significance factor of production for farmers’ cultivated utilization [22]. The financing problems faced by farmers are crucial during land lease [23]. In order to alleviate the financing constraints of cultivated land operators, a series of promoting DFI policies have been enacted in China. According to the “China Inclusive Financial Indicators Analysis Report of the PBC (2018)”, the number of mobile banking households in rural areas reached 670 million in 2018. In addition, digitally inclusive financial products and services in rural areas have been continuously enriched, such as “Huinong E Pay”, “Nongfa loan”, “Yinong loan”, “Wing Long loan”, etc. The development of DFI would expand the coverage of traditional finance, promote the financial accessibility of remote areas and vulnerable groups effectively, make financial services more geographically penetrating, and alleviate the difficulty and high cost of financing for farmers effectively [24].
The performance of DFI on cultivated land utilization attacked attention of the scholars. The burgeoning trend of DFI in China renders a novel thinking for the upward trajectory of agricultural mechanization to leap out of the foregoing vicious hoop [25]. Digital finance is a significance path to promote agricultural mechanization [26]. Empirical study indicated that that DFI significantly increased farmers’ willingness to adopt agricultural technology [27]. Cheng et al. [24] tested the effects of DFI on carbon emissions from cultivated land utilization empirically. The result showed that DFI reduced the intensity of carbon emission [24]. In addition, the study of Zhang [28] showed that DFI could improve the availability of financial credit for rural households, improve the speed and duration of CLT, and accelerate the process of cultivated land utilization to large-scale and intensive.
The change of farmers’ willingness in CLT brought by DFI changes resource configuration [28]; however, few studies have paid attention on how this change influences CLGUE. Additionally, CLT can probably solve the land fragmentation problems in China, while this legal arrangement made to prevent land fragmentation has evolved to restrict the use and yield of agricultural lands in some developed countries, for instance, Turkey [29]. Accordingly, whether CLT can further promote CLGUE is uncertain and controversial. Previous studies provide some valuable ideas for the present study, but the mechanism of the influence of DFI on CLGUE has not been revealed. In addition, there are few studies concerning the effects of DFI on CLGUE and heterogeneity. Under the context of rapid development of DFI and large-scale CLT in China, it is of great significance to reveal the influence of DFI on CLGUE and its mechanism. We tried to explore the effects of the development of DFI on CLGUE using the Peking University Digital Financial Inclusion Index and provincial panel data from 2011 to 2020. Furthermore, we intended to demonstrate that the DFI’s development could significantly increase CLGUE and that a high level of CLT could significantly improve the positive influence of DFI on CLGUE. The present study elucidates the relationship between DFI and CLGUE and provides new policy references. The structure of this paper is as follows: in the second section, the theoretical basis and proposed hypotheses are introduced. In the third section, methodology is discussed. Then, we report our results and analysis in the fourth section. Finally, we demonstrate our conclusions, contributions, and directions for future research.

2. Theoretical Background and Hypotheses Development

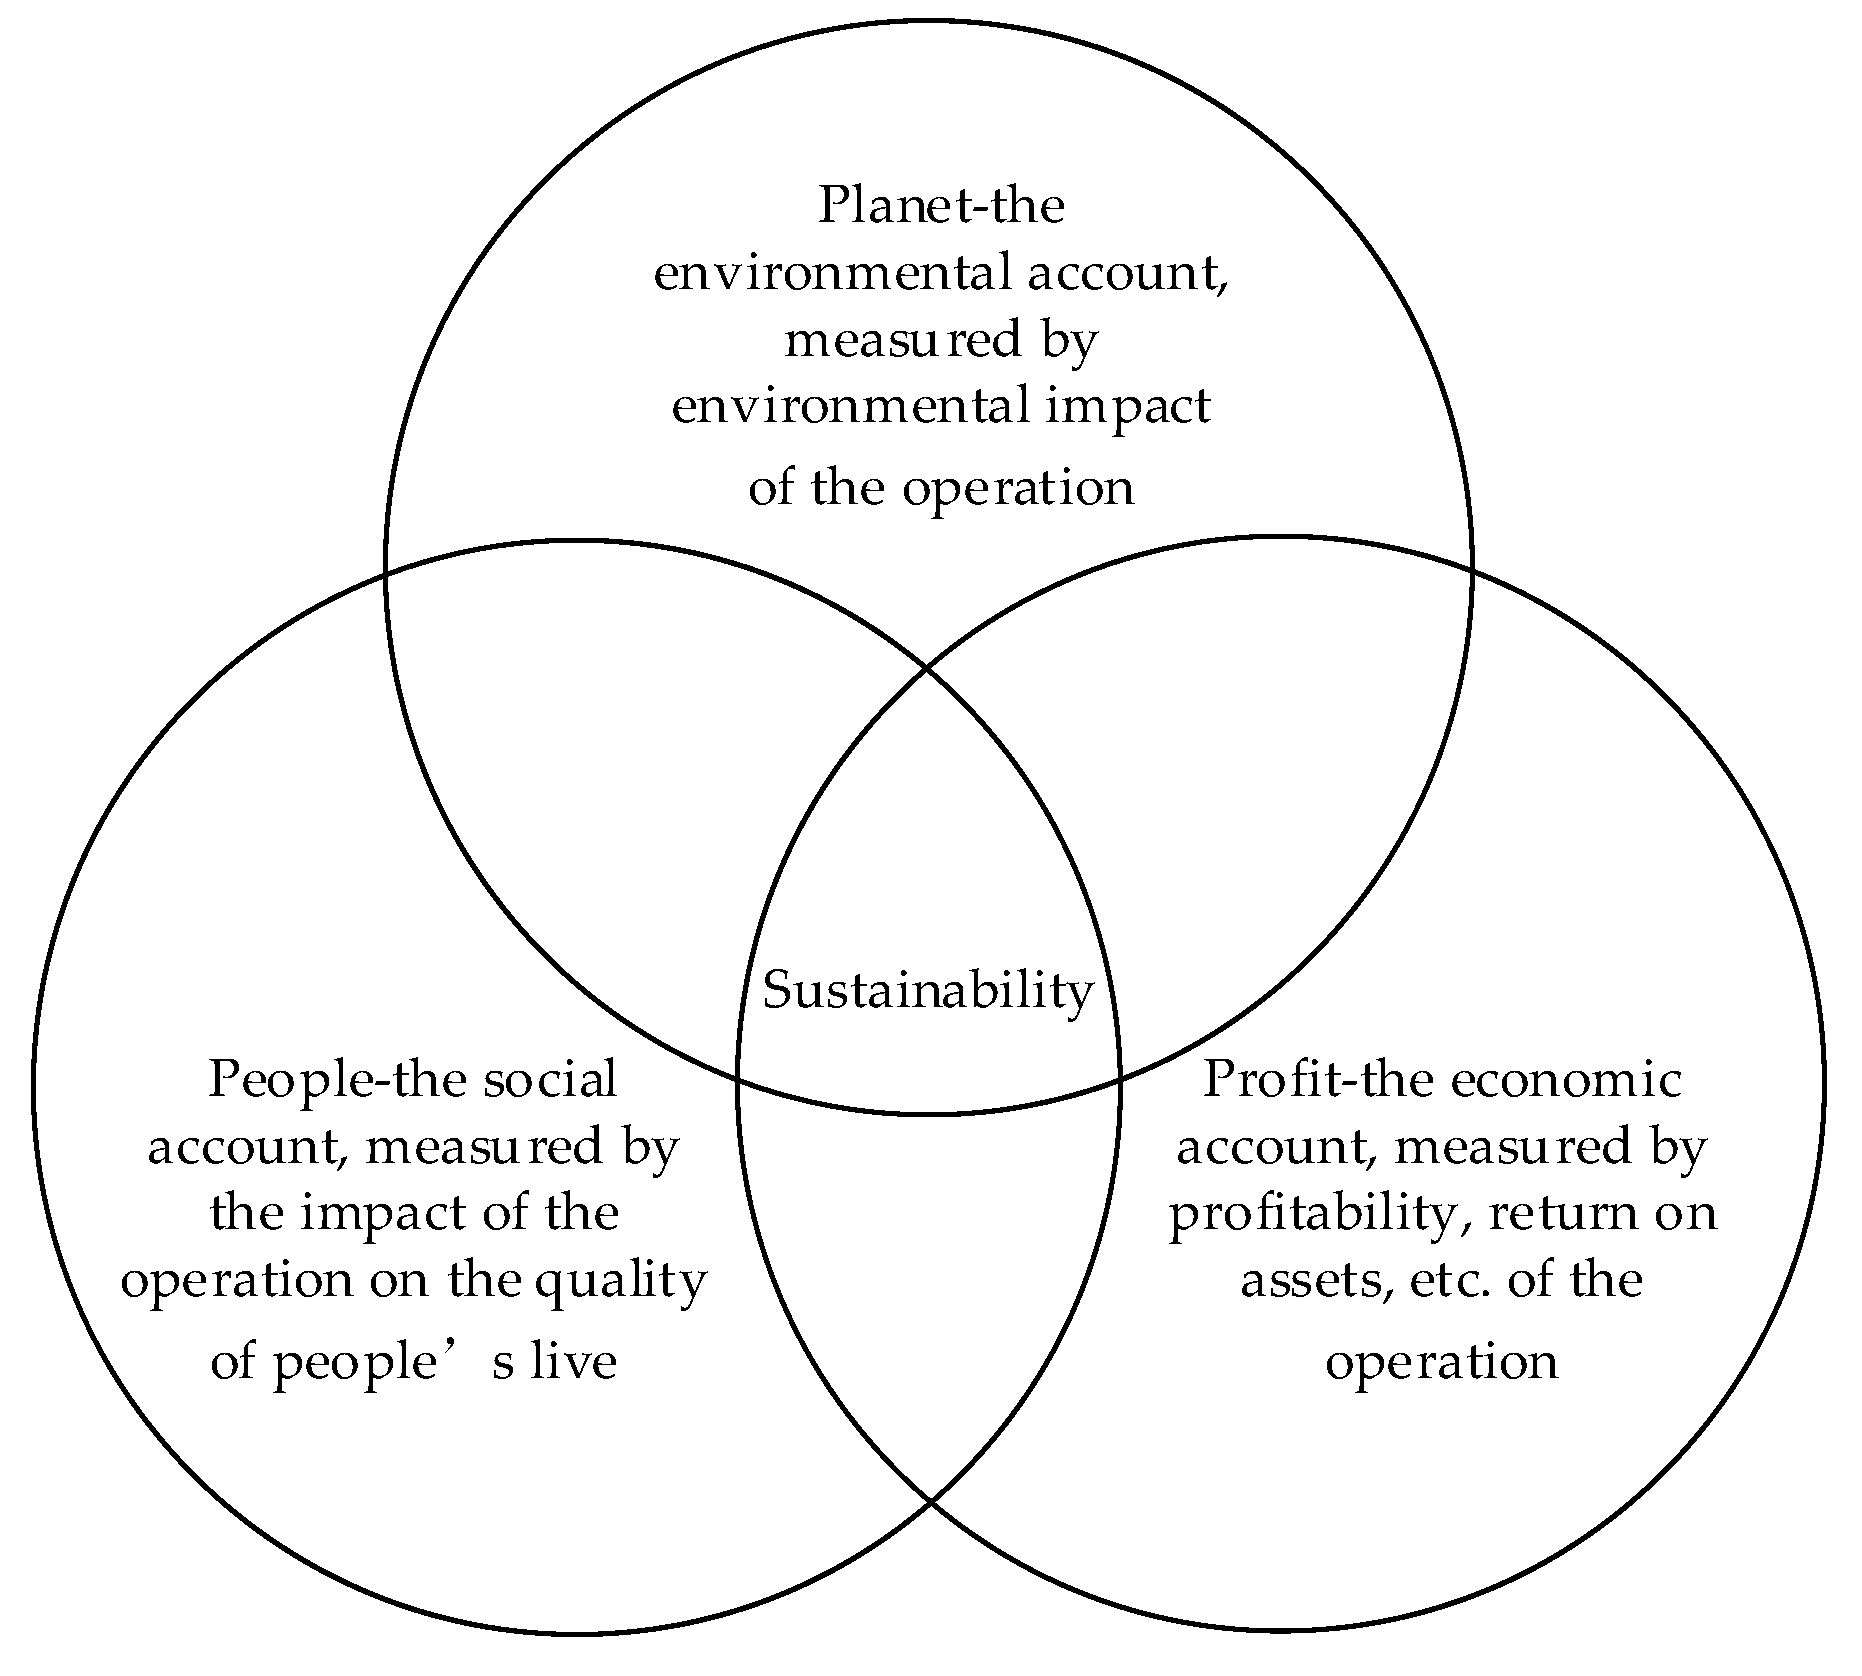
2.1. Triple Bottom Line Theory

This paper regards triple bottom line (TBL) as a convincing framework for integrating distinguishing CLGUE dimensions and identifying the relationships with its antecedents DFI and CLT. The TBL theory can be traced back to accounting and corporate responsibility to orientate firms towards social and environmental protection issues in their operations. The theory consists of three associated components, that is, “profit, planet, people” [30]. The specific contents involved in the theory are presented in Figure 1. The theory points out that the influence operations have on society and the ecological impacts on the environment deserve serious consideration when organizations self-evaluate. With the expansion of the theory, the “sustainability” idea has gradually been introduced in agricultural production [31]. A sustainable agricultural production creates acceptable outputs for its operators but minimizes the environmental damage and adverse impacts on other people [32].
Accordingly, TBL theory is a significant paradigm for studying the relationship among DFI, CLT, and CLGUE. Specifically, on the one hand, TBL theory is valuable for scholars to measure the expected output parts of CLGUE. Operators should focus on balance of economic, environmental, and societal interests when managing cultivated land. On the other hand, economic, social, and environmental benefits are closely linked [33]. The operators of cultivated land paying attention to social and environmental benefits is conducive to the promotion of economic outputs of cultivated land. The assumption underlying the TBL theory is that a sustainable operation is more likely to stay successful in the long-term than one that focuses on economic goals alone [29]. Simultaneously, economic development can promote the achievement of social and environmental benefits. With the development of DFI, which is the typical product of economic development, operators of cultivated land are more likely to protect the environment and create value for society.

2.2. Hypotheses Development

2.2.1. Digital Financial Inclusion and Cultivated Land Green Utilization Efficiency

On a basis of triple bottom line theory, the rapidly expanding field of DFI, which is the promoter and also the production of economic development, is conductive to the promotion of environmental protection of and value creation for society. To be more specific, in the agricultural production, DFI can efficiently facilitate CLGUE in the following aspects. First, DFI can efficiently control the emission of pollutants (e.g., carbon contamination, pesticide pollution etc.) and the consumption of energy through high-quality financing services, which consequently promote CLGUE. The prior literature has proposed that impediments to technological development caused by high financing costs probably lead to increased energy expenditure and carbon emissions [34,35]. DFI with the lower financing constrains and financing costs can efficiently control the energy expenditure and carbon emissions and subsequently improve CLGUE. Compared with traditional finance, DFI is characterized by digitalization and inclusiveness [36]. In terms of digitalization, scientific analysis of various data generated and processed by digital technology is conducive to achieving green detection [37,38]. For instance, digital technology can be effectively implemented in the field of calculating pesticide and fertilizer application; thus, farmers can accurately calculate the input number of pesticides and fertilizers, so as to avoid pollution caused by excessive input. Consequently, carbon and pollutant emissions can be efficiently controlled and CLGUE will be further improved. [39]. In terms of inclusiveness, convenience of financial service is improved in rural areas, subsequently decreasing the risk and increasing farmers’ the quality of investment and credit [40]. Additionally, the rise of green finance from environmental conservation dramatically enhances the green characteristics of finance, which efficiently promotes an increase in energy utilization efficiency and a reduction in carbon emissions [41,42,43].
Second, DFI can improve the outputs of cultivated land, and subsequently facilitate CLGUE. The extant literature has confirmed that financing constraints have always been obstructive factors that restrict agricultural investments and outputs [44,45]. Thanks to the development of digital technology, DFI provides more efficient financing channels for agricultural production through improving the permeability and enlarging the special scale of financial services [27]. According to the empirical results presented in Zhou et al. (2022) [25], DFI will accelerate farmers’ willingness to adopt agricultural technology in China. The more money farmers have at their disposal, the more they are willing to use agricultural technologies to achieve large-scale industrialization [46]; therefore, the overall yield of farmland and green efficiency would increase dramatically [47].
Third, efficient control of inputs is another benefit arising from DFI, which further promotes CLGUE. Changes in factor endowments encourage farmers to choose cheap production factors to replace expensive ones [48]. With the development of DFI, a large number of young workers to nonagricultural sectors and subsequently the supply of rural labor may be insufficient [49]. In this case, farmers adjust the input structure of production factors, using cheap and relatively rich elements, for instance, agricultural machinery to replace labor. Consequently, the cultivated land’s green efficiency is efficiently improved though the decrease of inputs.
According to the above analysis, the following hypothesis is proposed:
Hypothesis 1. 
Digital financial inclusion is positively correlated with cultivated land green utilization efficiency.

2.2.2. Digital Financial Inclusion and Cultivated Land Transfer

DFI is a significant antecedent of CLT. First, DFI, as a carrier of information dissemination, can facilitate CLT by reducing transaction costs and information asymmetry [50]. Thanks to the development of digital technologies such as big data technology and cloud computing technology, the speed and efficiency of information dissemination can be improved [25]. Efficient information dissemination and convenient communication can promote cultivated land transfer. Specifically, the essence of CLT is a process of reaching a contract on the cultivated land utilization assets between land transferors and land transferees [51]. There is empirical evidence indicating that low efficiency of information dissemination in rural areas dramatically reduces farmers’ cognition of land transfer, increases the transaction costs of land transfer, and consequently restricts the improvement of the CLT system [52]. The development of DFI enables more efficient and accurate access to farmers’ property information, land information, and credit records, which relieves the information imbalance between the supply and demand entities of cultivated land [53]. Hence, it reduces the economic costs of land transactions and subsequently facilitates the marketization of CLT.
Second, the development of DFI has brought more nonagricultural entrepreneurial and employment opportunities [54], which further promotes CLT. Specifically, DFI makes it possible to obtain online credit or loans without collateral assets and simultaneously offer financial services with a reasonable interest rate [55]; consequently, it efficiently promotes farmers’ entrepreneurial activities. In addition, the expansion of DFI can dramatically accelerate economic growth, especially promoting the development of small and medium firms; thus, small and medium firms can provide more employment opportunities [56,57]. With a large number of farmers employed in nonagricultural sectors, the transfer and contract activities of cultivated land are promoted.
Third, DFI can facilitate CLT through enhancing agricultural mechanization. Traditional finance has great difficulties in supporting the development of agricultural mechanization [58]. When borrowing funds from traditional financial institutions, farmers face a series of challenges such as remote residence, complex terrain, backward transportation, and a lack of collateral and guarantees. DFI greatly expands the scope of financial services, effectively relieves the financial constraints of farmers and accurately identifies the needs of farmers, consequently promoting the application of mechanization in cultivated land [27]. Actively using agricultural machinery to replace labor is conductive to promoting CLT.
Accordingly, we propose the following hypothesis:
Hypothesis 2. 
Digital financial inclusion is positively correlated with cultivated land transfer.

2.2.3. Cultivated Land Transfer and Cultivated Land Green Utilization Efficiency

CLT is related to transferring cultivated land management rights from some individual farmers to professional farmers or economic organizations. It means the transfer of managing rights of cultivated land from low-productivity operators to high-productivity operators, which mitigates cultivated land resource misallocation and effectively promotes the development of CLGUE [59]. First of all, operation entities with higher productivity usually have more technological and cultural advantages. Professional operators improve the efficiency of fertilizer and pesticide utilization, thereby reducing the emissions of carbon and other sources of pollution [60]. Simultaneously, the formal signing of CLT contract is conducive to stabilizing long-term cultivated land management rights, thus helping CLT households to alleviate the concerns of the instability of the cultivated land management right and increase the belief in protecting the cultivated land [61], which contributes to the rational use of chemical fertilizers by CLT households. Therefore, on the whole, farmland transfer can promote CLGUE through transferring management rights to more professional operators.
In addition, CLT policies have a certain impact on grain planting structure. The fertilizer and pesticide usage of food crops is significantly lower than that of other cash crops. Hence, CLT can facilitate CLGUE through adjusting grain planting structure. On the one hand, guaranteeing grain security is an important goal of CLT [62]. It is required to ensure the agricultural use of cultivated land and give priority to grain production, which contributes to increasing the proportion of grain crops, realize the adjustment of planting structure and reduce land pollution [63]. On the other hand, there are significant differences between food crops and nonfood crops in terms of production characteristics, planting management difficulty, and labor demand. Compared with non-food crops, agricultural scale promoted by CLT is more suitable for the production of food crops, which adjusts the planting structure and promotes the sustainable use of cultivated land [64].
In addition, cultivated land transfer can greatly improve cultivated land green utilization through large-scale agricultural modernization. Chen et al. [65] pointed that CLT is an effective path to resolve a contradiction between the farmland fragmentation and the large-scale agricultural modernization. The adoption of agricultural green technology has certain requirements on the scale of operation [66]. For instance, the application of soil testing formula balanced fertilization technology is quite difficult for small-scale farmers for the reason that the technology is time-consuming, high costs, and high technical requirements. Apart from this, the government has strict requirements on the use of chemical fertilizers and pesticides by large-scale farmers. Scale operation can facilitate government and public welfare departments to provide training and guidance on agricultural green technology [67], consequently improving CLGUE.
Accordingly, we assume that:
Hypothesis 3. 
Cultivated land transfer is positively correlated with cultivated land green utilization efficiency.
Hypothesis 4. 
Cultivated land transfer mediates the relationship between digital financial inclusion and cultivated land green utilization efficiency.

3. Materials and Methods

3.1. Model Construction

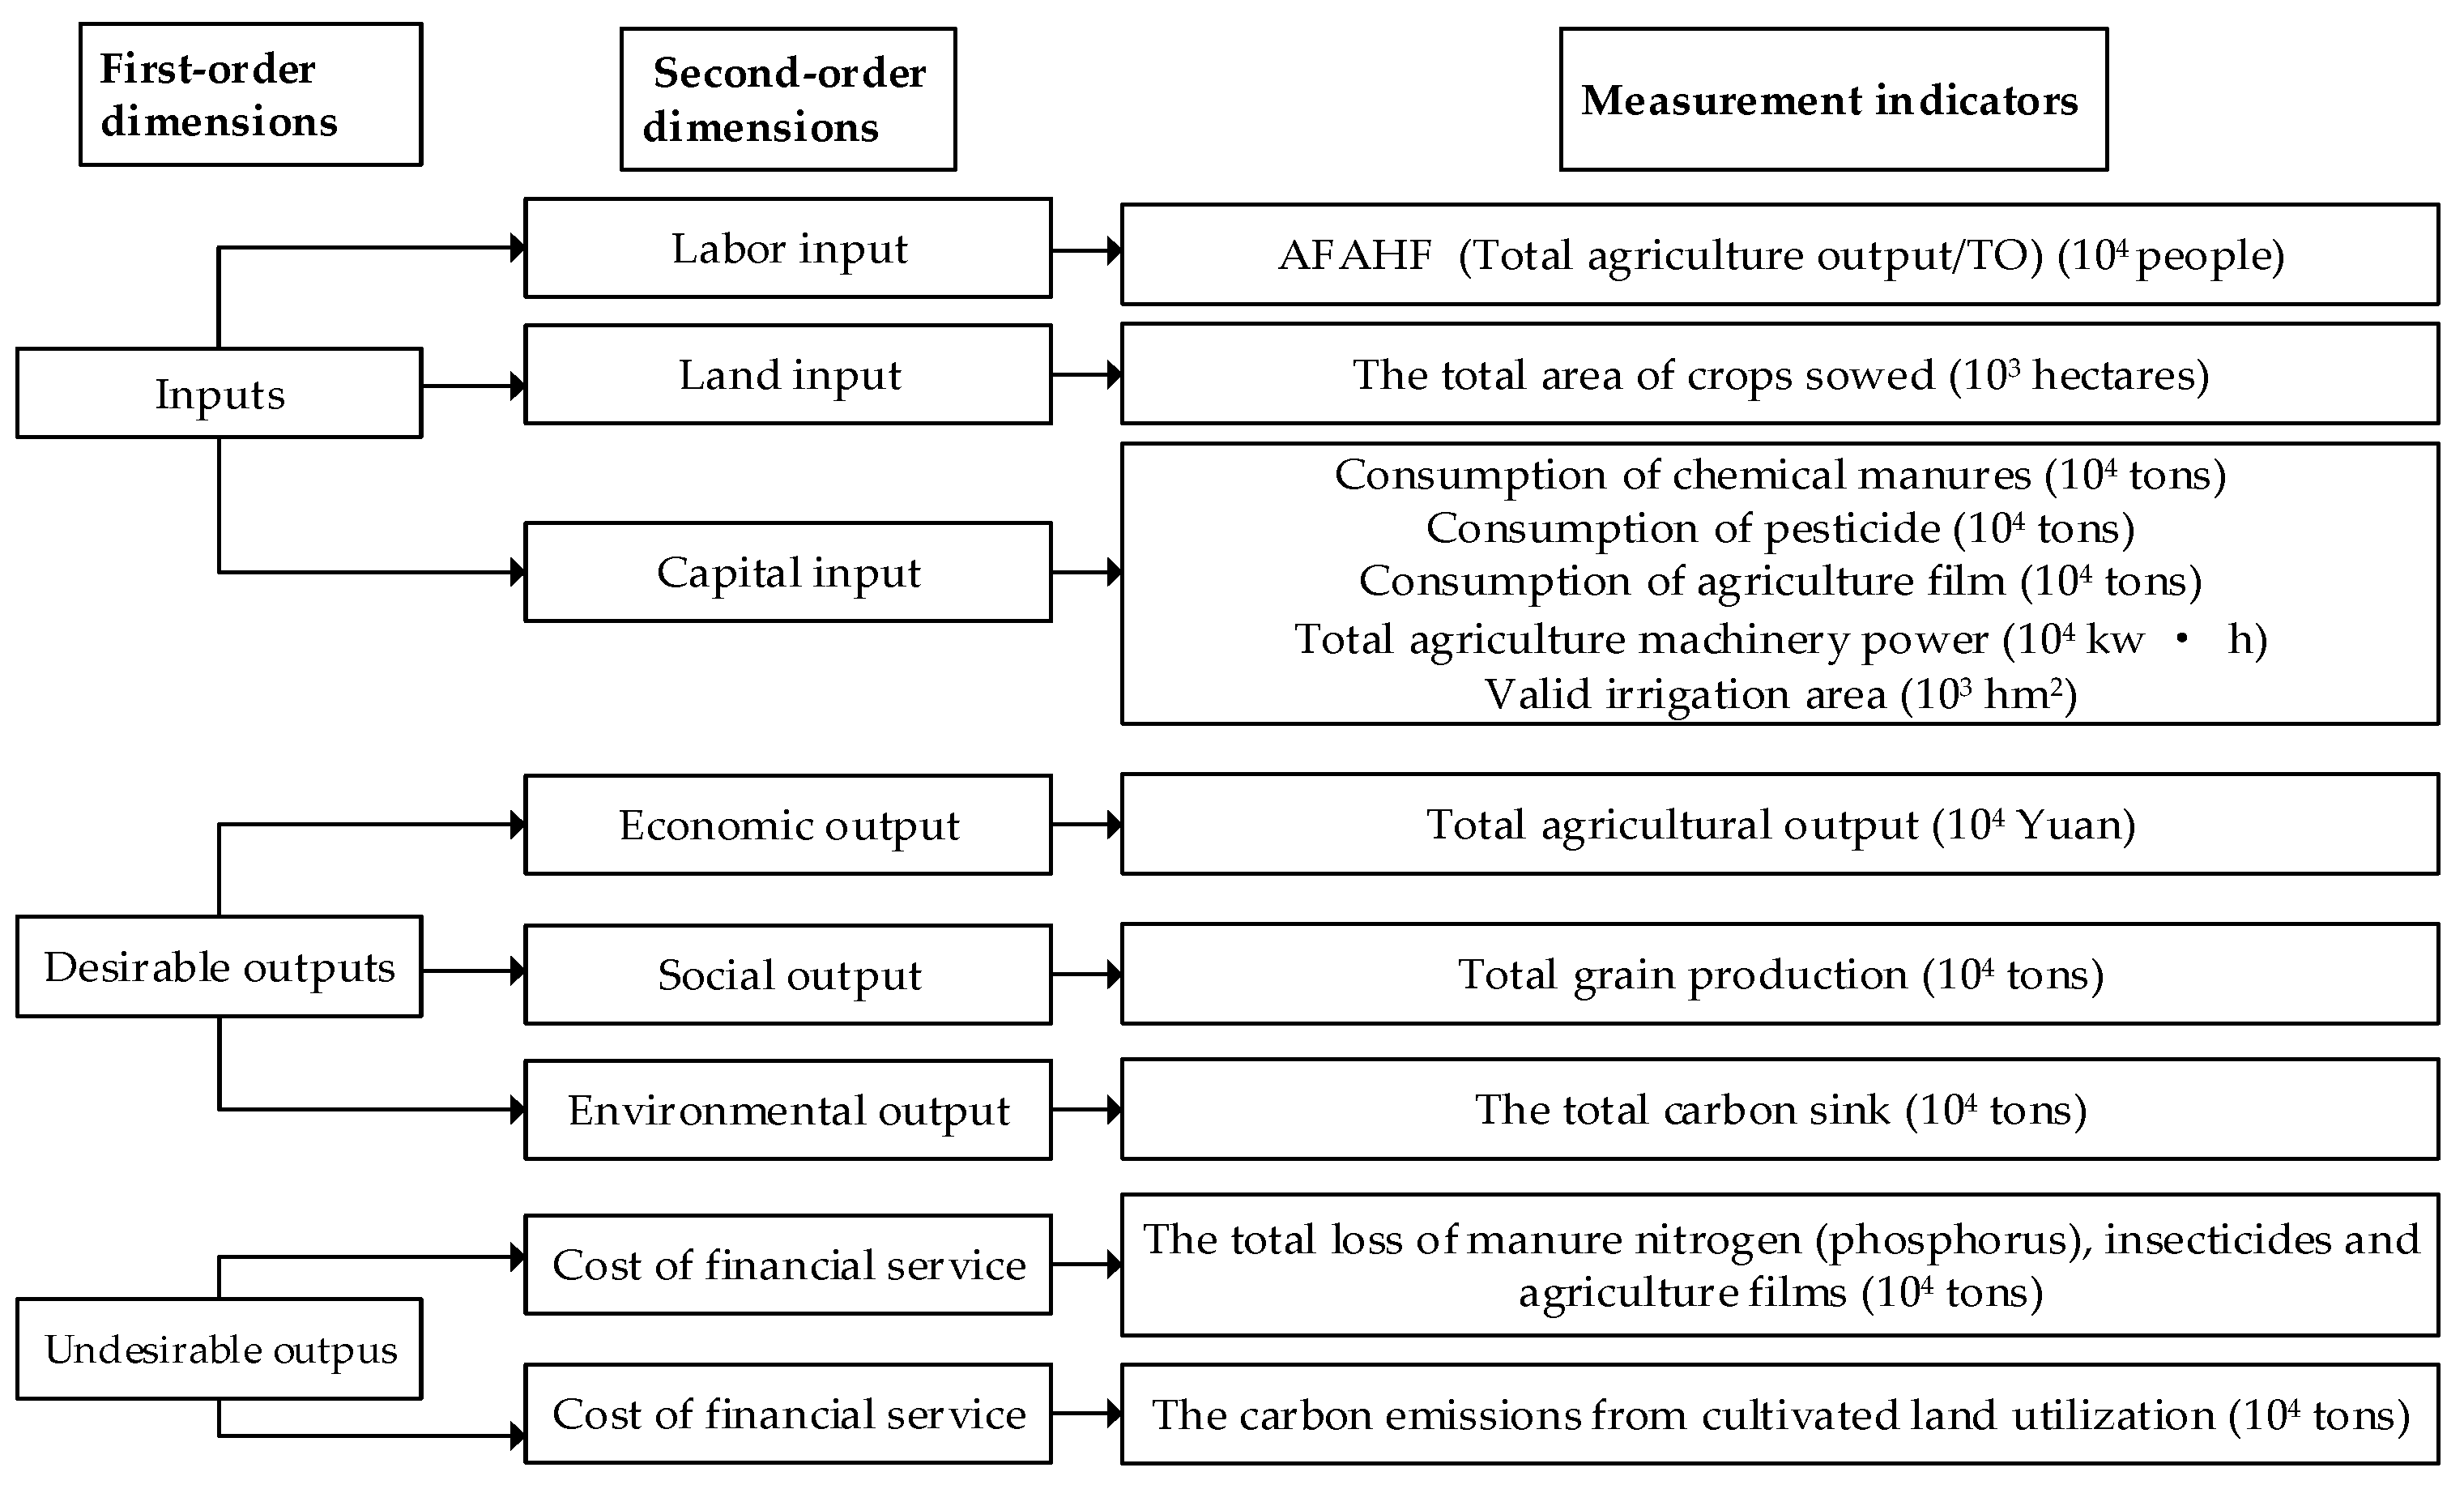
3.1.1. Measurement of CLGUE

Data envelopment analysis (DEA) is a mathematical programming method for evaluating the relative efficiency of decision-making units (DMUs) with multiple inputs and multiple outputs [68]. The idea of single-input, single-output engineering efficiency was generalized to a multiple-input, multiple-output relative efficiency evaluation [69]. Banker et al. [70] proposed to evaluate the relative efficiency of DMUs by using the variable returns to scale as a criterion, which is the DEA-BCC model. However, neither of the two models could measure the full range of slack variables [71]. To improve the method and eliminate the variation, Tone [72] developed a non-radial and non-angular slack-based measure (SBM) model. The SBM model adds the relaxation variables of the input and output factors to the objective function. Nevertheless, the SBM model cannot measure the efficiency of DMUs with undesirable outputs. Tone [73] took these undesirable outputs into consideration and proposed an SBM model. The SBM-Undesirable-VRS model is set as follows [74]:
ρ * = min 1 1 m i = 1 m s i x i 0 1 + 1 s 1 + s 2 ( r = 1 s 1 s r δ y r 0 δ + r = 1 s 2 s r b y r 0 b ) s . t . { x 0 = X λ + s y 0 δ = Y δ λ S δ y 0 b = Y b λ + s b λ 0 , s 0 , s δ 0 , s b 0
where s , s δ , and s b correspond to the vectors of relaxation for the inputs, desired, and unwanted, respectively. λ represents the weight vector, and the objective function. ρ * is the index of CLGUE, which objective value ranges from (0, 1].

3.1.2. Models of Main Effects

Structural equation model (SEM) is significant statistic procedures for testing measurement, functional, predictive, and causal hypotheses. It can not only deal with explicit variables and latent variables, but can also analyze the relationship between multiple explanatory variables, multiple explained variables, and multiple mediation variables [75]. Referring to the relationships between explanatory variable and explained variable, this paper constructed the following path models of the main effects (Formula (2)):
c l g u e i , t = c 1 d f i i , t , + ε i , t
In Formula (2), clguei,t represents the CLGUE of province i in year t, dfii,t represents the DFI of province i in year t, c1 is the path coefficient of DFI influencing CLGUE, εi,t is the error term. If the path coefficient c1 is significantly positive, H1 is verified.

3.1.3. Models of Mediating Effects

According to the relationships among the explanatory variable, mediating variable and explained variable, this paper constructed the following path models of mediating effects (Formula (3)):
{ c l t i , t = a 1 d f i i , t + ε i , t c l g u e i , t = b 1 c l t i , t + c 1 ` d f i i , t + ε i , t
In Formula (3), clti,t represents the CLT of province i in year t, a1 is the path coefficient of DFI influencing CLT, b1 and c1` are the path coefficients of CLT affecting CLGUE and DFI affecting CLGUE, respectively. If the path coefficient a1 is significantly positive, H2 is verified. If the path coefficient b1 is significantly positive, H3 is supported. Furthermore, if the mediating path coefficient a1 × b1 (dfi→clt→clgue) is significantly positive, H4 is verified.

3.2. Variable Selection and Data Description

(1) Explained Variable: The index of CLGUE was measured by the super-efficient SBM model. In concept of CLGUE and the relevant literature [17,18], twelve variables were selected in the present study to construct the evaluation indicator system of CLGUE, involving input indicators, and desirable and undesirable output indicators (Figure 2).
This paper mainly takes carbon emissions and pollution emissions into account as undesired outputs. Total carbon emissions were calculated by multiplying the carbon source by the appropriate carbon emission factors. Based on the literature [18], carbon sources and coefficients include pesticides (4.394 1, kg C/kg), chemical fertilizers (0.895 6, kg C/kg), agriculture films (5.180, kg C/kg), agricultural irrigation (5, kg/hm2), agricultural machinery (25 kg C/hm2), total power of agricultural machinery (312.6 kg, C/kW), and agricultural tilling (312.6, kg C/km2). The calculation formula is set as follows:
C E C L U i = C i = T i · δ i
where C E C L U i represents the total carbon emissions from cultivated land utilization, T i represents the amount of the i-th carbon source, and δ i  refers to the i-th carbon source’s coefficient.
The pollution caused by cultivated land utilization refers mainly to non-point source pollution during cultivated land use. According to previous studies [18,21], nitrogen (phosphorus) fertilizer, pesticide, and agricultural film loss were used to represent pollution emissions. The corresponding loss coefficient refers to the manual of agricultural pollution source coefficient in National Pollution Source Survey. At the same time, the influence of regional differences on the results is considered in the estimation process.
(2) Explanatory Variables: The data source of the DFI index is from the Peking University DFI Index of China. The measurement of DFI is based on the development of innovative digital finance [76]. The index aggregate consists of three dimensions, coverage breath, usage depth, and digitalized level. Figure 3 illustrates the definitions of and relationships between these indicators.
(3) Mediating Variable: The mediating variable was CLT, indicated as the area proportion of CLT to household contracted cultivated land under the household responsibility system in China.
Table 1 illustrates the results of descriptive statistics. First, the average, minimum, and maximum value of DFI is 217.2, 18.33, and 431.9, respectively. It indicates that the levels of DFI of different provinces vary dramatically. Additionally, the levels of DFI of most provinces are at a relatively high level. Second, the average value and standard deviation of CLT are 0.316 and 0.163, respectively, the minimum value is 0.033, and maximum value is 0.911. Accordingly, the ratio of CLT of different provinces varies slightly, and the ratio of CLT of most provinces is at a lower rate. Third, the mean value of CLGUE is 0.704, closer to the maximum value of 1, indicating that the CLGUE of most provinces keeps a higher level. The standard deviation is 0.198, which means that the CLGUE of different provinces varies slightly.

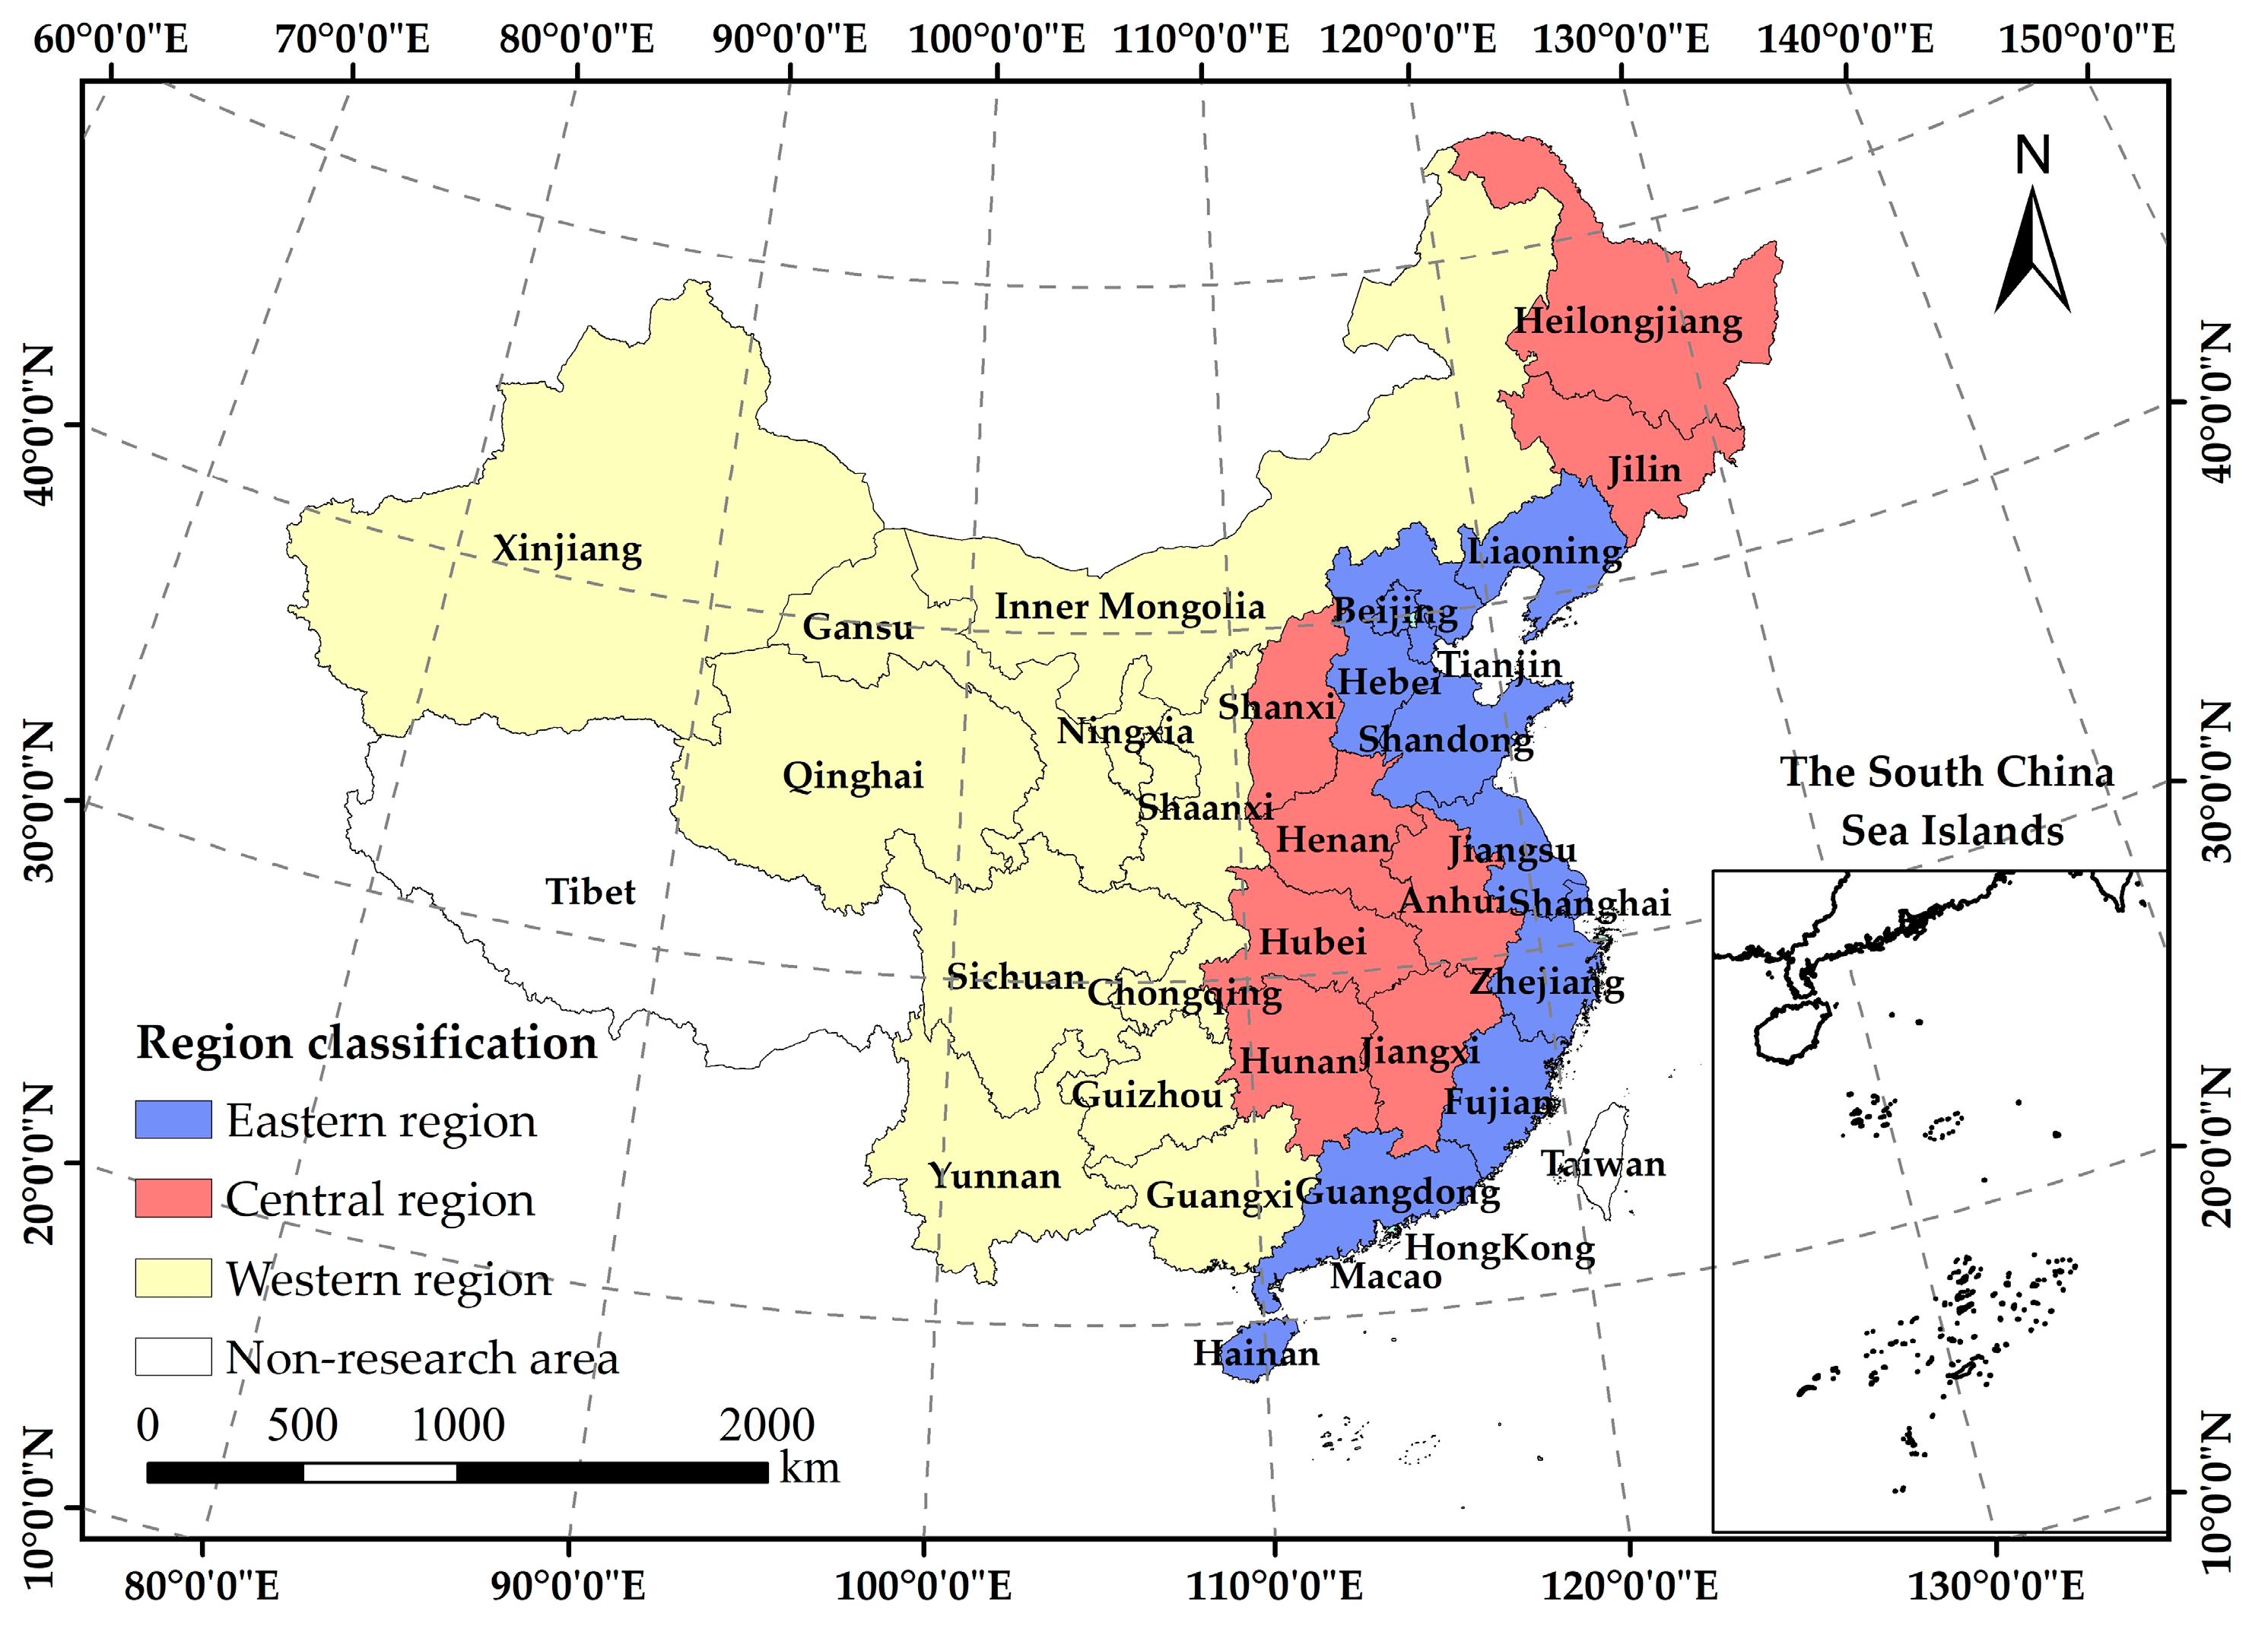
3.3. Research Region and Data Source

There are 34 provincial-level administrative institutions in China, and large regional differences exist in cultivated land resources, food production, and agriculture development [77]. Hong Kong, Macao, Taiwan, and Tibet were excluded from the empirical research due to lack of available data. Therefore, this present research’s subjects consist of 30 provinces or municipalities in mainland China. The CPC Central Committee on the “National Economic and Social Development Seventh Five–Year Plan” (1985) divided the 31 provinces into eastern, central, and western regions. This study also uses this classification (Figure 4).
The information that used to evaluate CLGUE and CLT was gathered from “China Statistical Yearbook”, “China Rural Statistical Year-book”, “China Rural Management Statistical Annual Report”, and China’s Rural Policy and Reform Statistical Annual Reports of the resent years, as well as the National Bureau of Statistics of China’s website. To fill in the gaps in the individual years’ missing data, the interpolation approach was used. In addition, the data source of the DFI index is from Peking University DFI Index of China.

4. Results

4.1. Measurement and Analysis of CLGUE

In this section, Equation (1) was used in this part to compute the CLGUE in China. China’s total CLGUE showed a trend toward progressive improvement, from 0.57 in 2011 to 0.92 in 2020, and the average annual growth rate was 5.46% (Figure 5). China has achieved initial success in transformation of cultivated land utilization to being green and efficient. One possible reason is that a number of policies have been formulated to advance the transformation of agricultural production, such as zero growth in fertilizer consumption [78]. In addition, it can be seen that the CLGUE of three regions are characterized by an overall upward trend. Furthermore, large regional differences exist in the average annual growth rates. The average annual growth rates for eastern, central, and western regions, respectively, were 6.24%, 3.70%, and 6.32%. The reason why the annual growth rate of CLGUE in the western region lags behind may be the main grain-producing areas are in central China. The main grain-producing areas play a pivotal role in the process of ensuring national food security. Because of the path dependence, the transformation of cultivated land utilization form “high input and high output” to “green and efficient” is more difficult in main grain-producing areas.
According to Huang and Wang [79], the efficient, relatively high-efficient group, relatively medium-efficient group, and relatively low-efficient groupings, respectively, were assigned to the provinces based on their efficiency values between [1], [0.8, 1), [0.6, 0.8), and [0, 0.6). The spatial–temporal evolution of CLGUE in 30 provinces is shown in Figure 6. In 2011, only Jilin, Heilongjiang, Shanghai, and Qinghai belonged to the efficient group, Beijing, Chongqing, and Ningxia belonged to the relatively medium-efficient group, the other 23 provinces belonged to the relatively low-efficient group. In 2015, Heilongjiang, Shanghai, and Qinghai shifted from the efficient group, while Shandong was moved into the efficient group. The spatial scope of the relatively high-efficiency and medium-efficiency groups emerged as an expanding trend. However, Gansu, Shanxi, Anhui, Yunnan, Inner Mongolia, Zhejiang, Hebei, Guangxi, and Jiangxi still remained in the relatively low-efficient group. In 2020, except Gansu, Shanxi, and Anhui, which still remained in the relatively low-efficient group, CLGUE in other provinces fell into the more efficient group or remained in the efficient group.

4.2. Structural Equation Model Results of the Main Effects

The structural equation model results of the main effects are presented in Figure 7 and Table 2. According to the results of model fitting test, the X2, RMSEA, and SRMR are all less than 0.05. This indicates good goodness of fit of the main effect model [80]. Since the fitting indexes are not used to compare the pros and cons of the models, CFI, AIC, BIC, and other indexes are not reported [81]. Furthermore, the path coefficient of DFI on CLGUE is 0.442, significant at the 1% level. This indicates that DFI can directly improve CLGUE, and hypothesis 1 is supported. Through structural equation model analysis of the main effects, we identified that DFI, characterized by digitalization and inclusiveness, can be a significant promoter of CLGUE. With the development of DFI, CLGUE in China can be dramatically improved.

4.3. Structural Equation Model Results of the Mediating Effects

The structural equation model results of the mediating effects are illustrated in Figure 8 and Table 3. According to the results of model fitting test, the X2, RMSEA, and SRMR are all less than 0.05. This indicates good goodness of fit of the main effect model [80]. We did not report CFI, AIC, BIC, and other indexes as well. Furthermore, the path coefficient of DFI on CLT is 0.183, passing the test at the 1% significant level. This indicates that DFI is positively correlated with CLT and hypothesis 2 is supported. Then, the path coefficient of CLT on CLGUE is 0.273, significant at the 1% level; hence, CLT is positively correlated with CLGUE and hypothesis 3 is verified. Finally, we investigated the significance of mediating effects. Based on the results of Table 4, the path coefficient of a1 × b1 (dfi→clt→clgue) is 0.132, significant at the 1% level. It demonstrates that CLT mediates the influencing path of DFI on CLGUE and H4 is verified. Additionally, since the direct path coefficient of DFI on CLGUE is 0.310, also passing the test at the 1% significant level, we identified that CLT has partial mediating effects on the relationship between DFI and CLGUE.

4.4. Robustness Tests

In this section, we use the method of the substitution of the explained variable to conduct robustness tests. SBM-Undesirable-CRS was selected to appraise the index of CLGUE, SBM-Undesirable-CRS is constructed on the assumption of constant returns to scale. SBM-Undesirable-VRS used in Section 4.1 is constructed on the assumption of variable returns to scale. On a basis of the results illustrated in Table 5, the path coefficient of DFI on CLGUE is 0.497, significant at the 1% level. This indicates that DFI is still positively correlated with CLGUE after the substitution of the explained variable in the main effect analysis. Then, based on the results in Table 6, DFI is positively correlated with CLGUE (0.483, significant at the 1% level), DFI is positively correlated with CLT (0.361, significant at the 1% level), and CLT is positively related to CLGUE (0.282, significant at the 1% level). Meanwhile, in Table 7, the new path coefficient of a1 × b1 (dfi→clt→clgue) is 0.136, significant at the 1% level. It indicates that CLT still mediates the influencing path of DFI on CLGUE after the substitution of the explained variable in the mediating effect analysis.

4.5. Heterogeneity Tests of Main Effects

We used the heterogeneity analysis to investigate the different influence of DFI on CLGUE based on different geographical locations. As is illustrated in Table 8, all the path coefficients of DFI on CLGUE in the three areas are significantly positive. The path coefficient of DFI on CLGUE in the eastern areas (0.633) is much higher than those in the central areas (0.228) and western areas (0.415). This indicates that the positive relationship between DFI and CLGUE in the eastern areas is more obvious. Possible reasons for this phenomenon are better facilities for finance and a higher level of financial development in the eastern region [82]. DFI and traditional finance are complementary, provide better financial services for cultivated land operators, and eventually raise CLGUE.
Additionally, heterogeneity analysis on the effects of DFI on CLGUE based on different grain functional was carried out. Referring to Ke et al. [16], 30 provinces can be divided into three categories of main grain-producing areas (MGPAs), main grain-marketing areas (MGMAs), and grain-producing and marketing balance areas (GPMBAs). The results in Table 8 indicate that all the path coefficients of DFI on CLGUE in the three grain-functional areas are significantly positive. The path coefficient of DFI on CLGUE in the MGMAs (0.568) is much higher than those in the MGPAs (0.408) and GPMBAs (0.360). MGMAs are located in the southeast coastal or economically developed provinces, with strict environmental regulation. Empirical analysis showed that environmental regulations had a prominent positive effect on the adoption of green farming practices, such as farmers adopting high efficiency, low toxicity, and low residue pesticides [83].

5. Discussion

This study draws on triple bottom line theory to empirical investigate whether and how DFI can affect CLGUE through CLT. Using a sample of Chinese provincial panel data during the period of 2011–2020 and SEM analyses, this paper draws the following conclusions:
(1) DFI can directly enhance CLGUE. DFI has the characteristics of digitalization and inclusiveness. Scientific analysis of various data generated and processed by digital technology is conducive to achieving green detection. Green finance arising from environmental conservation dramatically enhances the green features of finance, efficiently accelerating the increase of energy utilization efficiency and a reduction in carbon emissions. Apart from the environmental protection effects, DFI can efficiently improve the outputs and control the inputs of cultivated land, which further facilitates cultivated land utilization efficiency.
(2) DFI can indirectly improve CLGUE through cultivated land transfer. CLT means transferring cultivated land management rights from individual farmers to professional farmers or economic organizations. DFI can facilitate CLT by reducing transaction costs and information asymmetry, providing more nonagricultural entrepreneurial and employment opportunities and enhancing agricultural mechanization. Furthermore, CLT can transfer of managing rights of cultivated land from low-productivity operators to high-productivity operators, subsequently enhancing CLGUE by improving the efficiency of the utilization of fertilizers and pesticides, optimizing grain planting structure and driving large-scale agricultural modernization.
(3) DFI has regional heterogeneity in the improvement of CLGUE. Compared to the central and western areas, the positive relationship between DFI and CLGUE in the eastern areas is more obvious. In addition, compared with major grain producing and main grain producing and marketing balance areas, the positive relationship between DFI and CLGUE in the major grain marketing areas is more obvious.
Our findings make great contributions to the extant literature. In order to guarantee grain security and cultivated land utilization sustainably, the improvement of CLGUE has been more and more widely mentioned in agricultural sustainability in recent years. The extant literature has identified that digital financial inclusion is positively related to the agricultural supply chain [53], the rationalization of rural products’ industrial structure and green total factor productivity [82], agricultural production for rural households [84], agricultural high-quality development [85], etc. Nevertheless, studies on the relationship between DFI and low-carbon green utilization of farmland are scarce. In the recent decade, finance characterized by digital and inclusive connotation is developing rapidly in China [34], and seems to be conducive to increasing CLGUE, it is significative to empirical study the influencing mechanism of the emerging financing form on CLGUE. The present paper draws on triple bottom line theory and takes the CLT as the mediating mechanism, revealing how CLT can promote CLGUE in China. Although CLT adversely affects the use and yield of cultivated land in some developed countries [29,86], it has great effects on facilitating CLGUE in China. In China, the ownership rights of cultivated land belong to Chinese government and the operating and managing rights of cultivated land belong to individual farmers. The Chinese cultivated land transfer policy supports the individual farmers in transferring their management rights to large professional households and groups to develop large-scale agricultural operations. The specific forms of transfer include subcontract, transfer, investment, cooperation, leasing, exchange, and other means. Farmers can choose the most suitable way to transfer farmland according to their available funds. The processes of CLT are voluntary, fair, open, and paid. This study theoretically analyzes the impact and mechanism of DFI on CLGUE, constructs a framework mechanism of CLGUE, CLT, and CLGUE, and expands the research’s scope on DFI and provides a reference for green agricultural development and digital rural development.
Our findings also provide some practical insights. Firstly, the governments are recommended to increase investments in the research and development of digital financial technologies and applications, so as to continuously extend digital financial inclusion services to wider population. Governments are also suggested to simplify farmland transfer procedures, and widely publicize the subsidy scheme for farmland transfer in order to ensure that the activities of farmland transfer are more transparent, simple, and attractive. With the improvement of digital finance systems and the extension of farmland transfer, cultivated land’s green utilization efficiently can be improved. Secondly, since traditional institutions are experience difficulty in offering adequate financial products and services to farmers, financial institutions are recommended to continuously expand the coverage breadth, usage depth, and digitalization level of digital financing services to satisfy farmers’ fund demands. Farmers owning sufficient funds will increase their willingness to adopt new technology, introduce large-scale mechanization, and subsequently improve cultivated land green utilization efficiency. Finally, on the one hand, small-scale farmers are suggested to transfer out their land and obtain payments and compensation. They can engage in nonagricultural industry. On the other hand, small-scale farmers are recommended to transfer to other farmers’ land and form large-scale a agricultural production, because they have easier access to financial loans and insurance.
Despite these attractive contributions, our research also has limitations. First, our large sample covers Chinese provincial data from 2011 to 2020. Thereby, the generalization of our findings to other countries or regions should be made cautiously. Though our theory is not specific to the China’s context, future research may collect data from other countries, especially from developed countries with a maturely developed digital inclusive finance system and different cultivated land transfer policies. Second, owing to time and data constraints, we did not introduce other associated variables in the framework; for instance, the antecedent variables that can affect explanatory variables and the moderating variables that can affect the mechanism are not discussed. We can explore more associated variables in future research to obtain more theoretical and practical inspiration. For instance, we can discuss the antecedent variables of digital financial inclusion (e.g., digital technology, government support), the consequence variables of cultivated land green utilization efficiency (e.g., high-quality agricultural development, sustainably development), and other mediating variables (e.g., level of mechanization, management scale) as well. Last but not least, we measured the intensity of DFI according to the Peking University DFI Index of China. However, due to the rapid development of digital technology, it is difficult for us to cover all of the digital financing channels. In the future, a more scientific measurement method related to DFI can be introduced to reduce measurement errors.

Author Contributions

Conceptualization: M.Z. and H.Z.; methodology, M.Z. and H.Z.; software, H.Z. and H.S.; validation, H.Z. and Z.Z.; data curation, M.Z., H.Z. and H.S.; writing—original draft preparation, M.Z., H.Z. and Z.Z.; writing—review and editing, M.Z. and H.Z.; visualization, M.Z., H.Z., Z.Z. and H.S. All authors have read and agreed to the published version of the manuscript.

Funding

This research was funded by the Social Science Foundation of China (No. 21BGL287) and Education Department of Liaoning Province (No. LJKMR20220424).

Institutional Review Board Statement

Not applicable.

Informed Consent Statement

Not applicable.

Data Availability Statement

Data are available from authors upon reasonable request.

Conflicts of Interest

The authors declare no conflict of interest.

References

  1. Lin, X.; Fu, H. Spatial-Temporal Evolution and Driving Forces of Cultivated Land Based on the PLUS Model: A Case Study of Haikou City, 1980. Sustainability 2022, 14, 14284. [Google Scholar] [CrossRef]
  2. Fu, G.Z.; Bai, W.Q. Advances and prospects of evaluating cultivated land quality. Resour. Sci. 2015, 37, 0226–0236. [Google Scholar]
  3. Lichtenberg, E.; Ding, C. Assessing farmland protection policy in China. Land Use Policy 2008, 25, 59–68. [Google Scholar] [CrossRef]
  4. Abass, K.; Adanu, S.K.; Agyemang, S. Peri-urbanisation and loss of arable land in Kumasi Metropolis in three decades: Evidence from remote sensing image analysis. Land Use Policy 2018, 72, 470–479. [Google Scholar] [CrossRef]
  5. Gorgan, M.; Hartvigsen, M. Development of agricultural land markets in countries in Eastern Europe and Central Asia. Land Use Policy 2022, 120, 106257. [Google Scholar] [CrossRef]
  6. Berihun, M.L.; Tsunekawa, A.; Haregeweyn, N.; Meshesha, D.T.; Adgo, E.; Tsubo, M.; Masunaga, T.; Fenta, A.A.; Sultan, D.; Yibeltal, M. Exploring land use/land cover changes, drivers and their implications in contrasting agro-ecological environments of Ethiopia. Land Use Policy 2019, 87, 104052. [Google Scholar] [CrossRef]
  7. Wu, Y.; Shan, L.; Guo, Z.; Peng, Y. Cultivated land protection policies in China facing 2030: Dynamic balance system versus basic farmland zoning. Habitat Int. 2017, 69, 126–138. [Google Scholar] [CrossRef]
  8. Niu, S.D.; Fang, B. Cultivated land protection system in china from 1949 to 2019: Historical evolution, realistic origin exploration and path optimization. China Land Sci. 2019, 33, 1–12. [Google Scholar] [CrossRef]
  9. Feng, Y.G.; Peng, J.; Deng, Z.B.; Wang, J. Spatial-temporal variation of cultivated land’s utilization efficiency in china based on the dual perspective of non-point source pollution and carbon emission. China Popul. Resour. Environ. 2015, 25, 18. [Google Scholar] [CrossRef]
  10. Guo, F.Y.; Gao, S.Q.; Tong, L.J.; Ren, J.M. Spatio-temporal evolution track and influencing factors of green development efficiency in Yellow River Basin. Geogr. Res. 2022, 41, 167–180. [Google Scholar] [CrossRef]
  11. Zhou, M.; Zhang, H.; Ke, N. Cultivated Land Transfer, Management Scale, and Cultivated Land Green Utilization Efficiency in China: Based on Intermediary and Threshold Models. Int. J. Environ. Res. Public Health 2022, 19, 12786. [Google Scholar] [CrossRef] [PubMed]
  12. FAO. The State of Food and Agriculture; Food & Agriculture Organization of the U.N.: Washington, DC, USA, 2016. [Google Scholar]
  13. Lu, X.; Kuang, B.; Li, J.; Han, J.; Zhang, Z. Dynamic Evolution of Regional Discrepancies in Carbon Emissions from Agricultural Land Utilization: Evidence from Chinese Provincial Data. Sustainability 2018, 10, 552. [Google Scholar] [CrossRef] [Green Version]
  14. Lu, X.; Qu, Y.; Sun, P.; Yu, W.; Peng, W. Green Transition of Cultivated Land Use in the Yellow River Basin: A Perspective of Green Utilization Efficiency Evaluation. Land 2020, 9, 475. [Google Scholar] [CrossRef]
  15. Zhang, J.F.; He, S.W.; Zhang, G.H.; Zhang, A.L. Ecological Benefit, Spatial Spillover and Fiscal Transfer of Farmland in Watershed: Evidence from the Yangtze River Economic Belt. Issues Agric. Econ. 2020, 12, 120–132. [Google Scholar] [CrossRef]
  16. Ren, P.; Hong, B.T.; Ma, W.L.; Yuan, Q.Z.; Zhou, J.M. Ecological value estimation of cultivated land based on the IBIS model: A case study of Chong zhou city. Geogr. Res. 2016, 35, 2395–2406. [Google Scholar]
  17. Xie, H.; Chen, Q.; Wang, W.; He, Y. Analyzing the green efficiency of arable land use in China. Technol. Forecast. Soc. Chang. 2018, 133, 15–28. [Google Scholar] [CrossRef]
  18. Ke, N.; Lu, X.H.; Kuang, B.; Han, J. Regional differences and influencing factors of green and low-carbon utilization of cultivated land under the carbon neutrality target in China. China Land Sci. 2021, 35, 67–76. [Google Scholar] [CrossRef]
  19. Zhou, M.; Kuang, B.; Zhou, M.; Ke, N. The Spatial and Temporal Evolution of the Coordination Degree in Regard to Farmland Transfer and Cultivated Land Green Utilization Efficiency in China. Int. J. Environ. Res. Public Health 2022, 19, 10208. [Google Scholar] [CrossRef] [PubMed]
  20. Qu, Y.; Lyu, X.; Peng, W.; Xin, Z. How to Evaluate the Green Utilization Efficiency of Cultivated Land in a Farming Household? A Case Study of Shandong Province, China. Land 2021, 10, 789. [Google Scholar] [CrossRef]
  21. Chen, Q.; Xie, H. Temporal-Spatial Differentiation and Optimization Analysis of Cultivated Land Green Utilization Efficiency in China. Land 2019, 8, 158. [Google Scholar] [CrossRef] [Green Version]
  22. Xu, Y.; Liu, L.-Y.; Pu, L.-J.; Liu, Y.-M.; Xu, F.; Yu, C. Analysis on farmers’ behavioral intension of cropland use and its influencing factors in the coastal areas of Northern Jiangsu province. J. Nat. Resour. 2022, 37, 1643–1653. [Google Scholar] [CrossRef]
  23. Lu, X.M.; Wu, Y.F. Land-renting, Farmers’ Agricultural Credit Demands and Credit Constraints: An Analysis of CHFS Data. Financ. Res. 2021, 5, 40–58. [Google Scholar]
  24. Cheng, Q.W.; Xu, A.X.; Chen, Q. The realization path of agricultural carbon emission reduction under the background of “dual carbon” target. J. Southwest Minzu Univ. (Humanit. Soc. Sci.) 2022, 43, 115–125. [Google Scholar]
  25. Yan, G.Q.; He, Y.C.; Zhang, X.H. Can the development of digital inclusive finance promote agricultural mechanization? —Based on the perspective of the development of agricultural machinery outsourcing service market. J. Agrotech. Econ. 2022, 1, 51–64. [Google Scholar] [CrossRef]
  26. Sun, X.T.; Yu, T.; Yu, F.W. The impact of digital finance on agricultural mechanization: Evidence from 1869 counties in China. Chin. Rural Econ. 2022, 2, 76–93. [Google Scholar]
  27. Zhou, Z.; Zhang, Y.; Yan, Z. Will Digital Financial Inclusion Increase Chinese Farmers’ Willingness to Adopt Agricultural Technology? Agriculture 2022, 12, 1514. [Google Scholar] [CrossRef]
  28. Zhang, Y.Q. Study on the influence and mechanism of digital inclusive finance on rural land transfer: Empirical evidence from CFPS and PKU-DFIIC. Econ. Manag. 2022, 36, 30–40. [Google Scholar]
  29. Yìldiz, O.; Coruhlu, Y.E.; Biyik, C. Registration of agricultural areas towards the development of a future Turkish cadastral system. Land Use Policy 2018, 78, 207–218. [Google Scholar] [CrossRef]
  30. Slack, N.; Brandon-Jones, A.; Johnston, R. Essentials of Operations Management, 7th ed.; Pearson Education Limited: Essex, UK, 2018; pp. 47–49. [Google Scholar]
  31. Smith, G.; Block, L.B.; Ajami, N.; Pombo, A.; Velasco-Aulcy, L. Trade-offs across the water-energy-food nexus: A triple bottom line sustainability assessment of desalination for agriculture in the San quintín Valley, Mexico. Environ. Sci. Policy 2020, 114, 445–452. [Google Scholar] [CrossRef]
  32. Ellis, M.J.; Sexton, A.; Dunsford, I.; Stephens, N. The triple bottom line framework can connect people, planet and profit in cellular agriculture. Nat. Food 2022, 3, 804–806. [Google Scholar] [CrossRef]
  33. Norman, W.; Macdonald, C. Getting to the bottom of the triple bottom line. Bus. Ethics Q 2004, 14, 243–262. [Google Scholar] [CrossRef] [Green Version]
  34. Isaeva, A.; Salahodjaev, R.; Khachaturov, A.; Tosheva, S. The Impact of Tourism and Financial Development on Energy Consumption and Carbon Dioxide Emission: Evidence from Post-communist Countries. J. Knowl. Econ. 2021, 13, 773–786. [Google Scholar] [CrossRef]
  35. Shi, F.; Ding, R.; Li, H.; Hao, S. Environmental Regulation, Digital Financial Inclusion, and Environmental Pollution: An Empirical Study Based on the Spatial Spillover Effect and Panel Threshold Effect. Sustainability 2022, 14, 6869. [Google Scholar] [CrossRef]
  36. Lee, C.-C.; Wang, F.; Lou, R. Digital financial inclusion and carbon neutrality: Evidence from non-linear analysis. Resour. Policy 2022, 79, 102974. [Google Scholar] [CrossRef]
  37. Lee, C.-C.; Yuan, Z.; Wang, Q. How does information and communication technology affect energy security? International evidence. Energy Econ. 2022, 109, 105969. [Google Scholar] [CrossRef]
  38. Shen, J.H.; Long, Z.; Lee, C.-C.; Zhang, J. Comparative advantage, endowment structure, and trade imbalances. Struct. Chang. Econ. Dyn. 2021, 60, 365–375. [Google Scholar] [CrossRef]
  39. Dayioğlu, M.A.; Turker, U. Digital Transformation for Sustainable Future—Agriculture 4.0: A review. J. Agr. Sci. Tarim. Bili. 2021, 27, 373–399. [Google Scholar] [CrossRef]
  40. Wang, Q. Challenges, opportunities and suggestions for the development of China’s rural digital financial inclusion. Front. Econ. Manag. 2022, 3, 0044. [Google Scholar]
  41. Warren, P. The role of climate finance beyond renewables: Demand-side management and carbon capture, usage and storage. Clim. Policy 2019, 19, 861–877. [Google Scholar] [CrossRef]
  42. Ren, X.; Shao, Q.; Zhong, R. Nexus between green finance, non-fossil energy use, and carbon intensity: Empirical evidence from China based on a vector error correction model. J. Clean. Prod. 2020, 277, 122844. [Google Scholar] [CrossRef]
  43. Guo, Q.; Su, Z.; Chiao, C. Carbon emissions trading policy, carbon finance, and carbon emissions reduction: Evidence from a quasi-natural experiment in China. Econ. Chang. Restruct. 2021, 55, 1445–1480. [Google Scholar] [CrossRef]
  44. O’Toole, C.M.; Newman, C.; Hennessy, T. Financing Constraints and Agricultural Investment: Effects of the Irish Financial Crisis. J. Agric. Econ. 2013, 65, 152–176. [Google Scholar] [CrossRef]
  45. Jing, X.; Jiang, R.; Chen, Z.; Deng, Z. Agricultural output effect of rural finance: An extended regression approach. E M Ekon Manag. 2022, 25, 4–22. [Google Scholar] [CrossRef]
  46. Wang, Y.Q.; Xu, X.J.; Xiong, H.; Fang, X.F. Research on the influence of inter-linked index insurance and credit contract on the adoption of new technologies in family farms. Financ. Perspect. J. 2019, 33, 83–91. [Google Scholar]
  47. Lu, F.; Wang, W.; Liu, M.; Liu, M.; Qi, D. The non-linear effect of agricultural insurance on agricultural green competitiveness. Technol. Anal. Strat. Manag. 2022, 1–16. [Google Scholar] [CrossRef]
  48. Skarstein, R. Explaining Productivity Change in Underdeveloped Agriculture. Can the theory of induced innovation do it? Dev. Stud. 2013, 41, 75–90. [Google Scholar] [CrossRef]
  49. Busato, P.; Berruto, R. Minimising manpower in rice harvesting and transportation operations. Biosyst. Eng. 2016, 151, 435–445. [Google Scholar] [CrossRef]
  50. Demir, A.; Pesqué-Cela, V.; Altunbas, Y.; Murinde, V. Fintech, financial inclusion and income inequality: A quantile regression approach. Eur. J. Financ. 2020, 28, 86–107. [Google Scholar] [CrossRef]
  51. Wang, Y.; Li, X.; He, H.; Xin, L.; Tan, M. How reliable are cultivated land assets as social security for Chinese farmers? Land Use Policy 2019, 90, 104318. [Google Scholar] [CrossRef]
  52. Zhang, F.; Bao, X.; Deng, X.; Xu, D. Rural Land Transfer in the Information Age: Can Internet Use Affect Farmers’ Land Transfer-In? Land 2022, 11, 1761. [Google Scholar] [CrossRef]
  53. Fang, D.; Zhang, X. The Protective Effect of Digital Financial Inclusion on Agricultural Supply Chain during the COVID-19 Pandemic: Evidence from China. J. Theor. Appl. Electron. Commer. Res. 2021, 16, 3202–3217. [Google Scholar] [CrossRef]
  54. Wang, X.; Fu, Y. Digital financial inclusion and vulnerability to poverty: Evidence from Chinese rural households. China Agric. Econ. Rev. 2021, 14, 64–83. [Google Scholar] [CrossRef]
  55. Lorente, J.J.C.; Schmukler, S.L. The fintech revolution: A threat to global banking? Res. Policy Briefs 2018, 1, 105034. [Google Scholar]
  56. Ozturk, I.; Ullah, S. Does digital financial inclusion matter for economic growth and environmental sustainability in OBRI economies? An empirical analysis. Resour. Conserv. Recy. 2022, 185, 106489. [Google Scholar] [CrossRef]
  57. Khera, P.; Ng, S.; Ogawa, S.; Sahay, R. Measuring Digital Financial Inclusion in Emerging Market and Developing Economies: A New Index. Asian Econ. Policy Rev. 2022, 17, 213–230. [Google Scholar] [CrossRef]
  58. Belton, B.; Win, M.T.; Zhang, X.; Filipski, M. The rapid rise of agricultural mechanization in Myanmar. Food Policy 2021, 101, 102095. [Google Scholar] [CrossRef]
  59. Chari, A.; Liu, E.M.; Wang, S.-Y.; Wang, Y. Property Rights, Land Misallocation, and Agricultural Efficiency in China. Rev. Econ. Stud. 2020, 88, 1831–1862. [Google Scholar] [CrossRef]
  60. Shang, H.; Yi, X.; Yin, C.; Chen, Y.; Zhang, Z. How Does the Stability of Land Management Right (SLMR) Affect Family Farms’ Cultivated Land Protection and Quality Improvement Behavior (CLPQIB) in China? Land 2021, 10, 1052. [Google Scholar] [CrossRef]
  61. Lu, H.; Chen, Y.; Huan, H.; Duan, N. Analyzing Cultivated Land Protection Behavior From the Perspective of Land Fragmentation and Farmland Transfer: Evidence From Farmers in Rural China. Front. Environ. Sci. 2022, 10, 901097. [Google Scholar] [CrossRef]
  62. Wang, H.; Li, C.; Liu, J.; Zhang, S. Research on Farmers’ Willingness of Land Transfer Behavior Based on Food Security. Sustainability 2019, 11, 2338. [Google Scholar] [CrossRef] [Green Version]
  63. Cao, W.K.; Wu, D.E. Contract system for circulation of the right to rural land contractual management. Asian Agric. Res. 2010, 2, 53–57. [Google Scholar]
  64. Qiu, T.; Choy, S.B.; Li, S.; He, Q.; Luo, B. Does land renting-in reduce grain production? Evidence from rural China. Land Use Policy 2020, 90, 104311. [Google Scholar] [CrossRef]
  65. Chen, M.-Q.; Zhong, T.-Y.; Zhou, B.-J.; Huang, H.-S.; He, W.-J. Empirical research on farm households’ attitude and behaviour for cultivated land transferring and it’s influencing factors in China. Agric. Econ. 2010, 56, 409–420. [Google Scholar] [CrossRef] [Green Version]
  66. Huang, T.; Xiong, B. Space Comparison of Agricultural Green Growth in Agricultural Modernization: Scale and Quality. Agriculture 2022, 12, 1067. [Google Scholar] [CrossRef]
  67. Wu, Y.; Xi, X.; Tang, X.; Luo, D.; Gu, B.; Lam, S.K.; Vitousek, P.M.; Chen, D. Policy distortions, farm size, and the overuse of agricultural chemicals in China. Proc. Natl. Acad. Sci. USA 2018, 115, 7010–7015. [Google Scholar] [CrossRef] [Green Version]
  68. Davtalab-Olyaie, M.; Roshdi, I.; Nia, V.P.; Asgharian, M. On characterizing full dimensional weak facets in DEA with variable returns to scale technology. Optimization 2014, 64, 2455–2476. [Google Scholar] [CrossRef]
  69. Charnes, A.; Cooper, W.W.; Rhodes, E. Measuring the efficiency of decision making units. Eur. J. Oper. Res. 1978, 2, 429–444. [Google Scholar] [CrossRef]
  70. Banker, R.D.; Morey, R.C. The Use of Categorical Variables in Data Envelopment Analysis. Manag. Sci. 1986, 32, 1613–1627. [Google Scholar] [CrossRef]
  71. Niu, H.; Zhang, Z.; Xiao, Y.; Luo, M.; Chen, Y. A Study of Carbon Emission Efficiency in Chinese Provinces Based on a Three-Stage SBM-Undesirable Model and an LSTM Model. Int. J. Environ. Res. Public Health 2022, 19, 5395. [Google Scholar] [CrossRef]
  72. Tone, K. A slacks-based measure of efficiency in data envelopment analysis. Eur. J. Oper. Res. 2001, 130, 498–509. [Google Scholar] [CrossRef]
  73. Tone, K. Dealing with undesirable outputs in DEA: A slacks-based measure (SBM) approach. Present. NAPW III Tor. 2004, 2004, 44–45. [Google Scholar]
  74. Ma, D.; Li, G.; He, F. Exploring PM2.5 Environmental Efficiency and Its Influencing Factors in China. Int. J. Environ. Res. Public Health 2021, 18, 12218. [Google Scholar] [CrossRef]
  75. Bagozzi, R.P.; Yi, Y. Specification, evaluation, and interpretation of structural equation models. J. Acad. Mark. Sci. 2012, 40, 8–34. [Google Scholar] [CrossRef]
  76. Guo, F.; Wang, J.; Wang, F.; Kong, T.; Zhang, X.; Cheng, Z. Measuring the development of digital financial inclusion in China: Index compilation and spatial characteristics. J. Econ. 2020, 12, 1401–1418. [Google Scholar] [CrossRef]
  77. Ke, N.; Zhang, X.; Lu, X.; Kuang, B.; Jiang, B. Regional Disparities and Influencing Factors of Eco-Efficiency of Arable Land Utilization in China. Land 2022, 11, 257. [Google Scholar] [CrossRef]
  78. Zhou, M.; Hu, B. Decoupling of carbon emissions from agricultural land utilisation from economic growth in China. Agric. Econ. 2020, 66, 510–518. [Google Scholar] [CrossRef]
  79. Huang, H.P.; Wang, Z.P. Spatial—temporal Differences and Influencing Factors of Agricultural Land Eco-efficiency in Jiangxi Province: Based on the Dual Perspective of Non—point Source Pollution and Carbon Emission. Resour. Environ. Yangtze Basin 2022, 29, 412–423. [Google Scholar]
  80. Kline, R.B. Principles and Practice of Structural Equation Modeling, 4th ed.; The Guilford Press: New York, NY, USA, 2018. [Google Scholar]
  81. Yang, Y. Structural Equation Model and Stata Application, 1st ed.; Beijing Peking University Press: Beijing, China, 2021; pp. 42–45. [Google Scholar]
  82. Hong, M.; Tian, M.; Wang, J. Digital Inclusive Finance, Agricultural Industrial Structure Optimization and Agricultural Green Total Factor Productivity. Sustainability 2022, 14, 11450. [Google Scholar] [CrossRef]
  83. Zhang, Y.; Wang, S.G.; Chen, X. Research on the Influence of Digital Finance on Green Pesticide Application by Farmers —Based on the Information Availability Perspective. Chin. J. Agric. Resour. Reg. Plan. 2022. Available online: https://kns.cnki.net/kcms/detail/11.3513.S.20221101.1625.016.html (accessed on 1 August 2022).
  84. Liu, Y.; Liu, C.; Zhou, M. Does digital inclusive finance promote agricultural production for rural households in China? Research based on the Chinese family database (CFD). China Agric. Econ. Rev. 2021, 13, 475–494. [Google Scholar] [CrossRef]
  85. Wang, S.; Chen, Y.B. How can digital financial inclusion promote agricultural high-quality development? The mediating and threshold mechanism. J. Manag. 2022, 35, 72–87. [Google Scholar] [CrossRef]
  86. Coruhlu, Y.E.; Yildiz, O. Geographical database for object-oriented land division modelling in Turkey. Land Use Policy 2017, 68, 212–221. [Google Scholar] [CrossRef]
Figure 1. The basic principles of triple bottom line. (Source: Slack et al. [27]).
Sustainability 15 01569 g001
Figure 2. The indicators for measuring CLGUE. Note: AFAHF represents the abbreviation for agricultural, forestry, animal husbandry, and fishery practitioners; TO represents the abbreviation for total output values of agriculture, forestry, animal husbandry, and fishery.
Sustainability 15 01569 g002
Figure 3. Measurement of DFI Index. (Resource: Guo et al. [76]).
Sustainability 15 01569 g003
Figure 4. The research area and regional classification.
Sustainability 15 01569 g004
Figure 5. Average value of CLGUE in China, eastern, central, and western regions.
Sustainability 15 01569 g005
Figure 6. The spatial–temporal evolution of CLGUE.
Sustainability 15 01569 g006
Figure 7. Path diagram and empirical results of main effects. Note: *** represents that it is significant at the 1% level.
Sustainability 15 01569 g007
Figure 8. Path diagram and empirical results of mediating effects. Note: *** represents that it is significant at the 1% level.
Sustainability 15 01569 g008
Table 1. Results of descriptive statistics.
VariablesNumberMeanStd. Dev.MinimumMaximum
dfi300217.296.9718.33431.9
clt3000.3160.1630.0330.911
clgue3000.7040.1980.3151
Table 2. Results of main effects.
PathsCoefficientsStandard ErrorZ Valuep Value95% Confidence Interval (CI)
lndfi→clgue10.442 0.044 10.020 0.000 0.356 0.529
constant0.059 0.415 0.140 0.886 −0.754 0.873
variance (e.clgue)0.805 0.039 0.732 0.885
Table 3. Results of mediating effects.
PathsCoefficientsStandard ErrorZ Valuep Value95% CI
dfi→clt0.483 0.042 11.630 0.000 0.402 0.565
constant−1.894 0.363 −5.220 0.000 −2.605 −1.183
clt→clgue0.273 0.056 4.910 0.000 0.164 0.382
dfi→clgue0.310 0.054 5.730 0.000 0.204 0.416
constant0.576 0.424 1.360 0.174 −0.255 1.407
variance (e.clt)0.766 0.040 0.691 0.849
variance (e.clgue)0.748 0.042 0.670 0.834
Table 4. Tests of significance of mediating effects.
PathsCoefficientsStandard ErrorZ Valuep Value95% CI
dfi→clt→clgue0.132 0.029 4.470 0.000 0.074 0.190
Table 5. Results of robustness tests of main effects.
PathsCoefficientsStandard ErrorZ Valuep Value95% CI
dfi→clgue (new)0.497 0.041 12.230 0.000 0.418 0.577
constant−0.650 0.385 −1.690 0.091 −1.403 0.104
variance (e.clgue)0.753 0.040 0.677 0.836
Table 6. Results of robustness tests of mediating effects.
PathsCoefficientsStandard ErrorZ Valuep Value95% CI
dfi→clt0.483 0.042 11.630 0.000 0.402 0.565
constant−1.894 0.363 −5.220 0.000 −2.605 −1.183
clt→clgue (new)0.282 0.053 5.280 0.000 0.177 0.386
dfi→clgue (new)0.361 0.051 7.070 0.000 0.261 0.461
constant−0.116 0.395 −0.290 0.769 −0.890 0.659
variance (e.clt)0.766 0.040 0.691 0.849
variance (e.clgue)0.692 0.042 0.614 0.779
Table 7. Robustness tests of significance of mediating effects.
PathsCoefficientsStandard ErrorZ Valuep Value95% CI
dfi→clt→clgue (new)0.136 0.029 4.750 0.000 0.080 0.192
Table 8. Results of heterogeneity tests of main effects (dfi→clgue).
Eastern
Areas
Central
Areas
Western
Areas
MGPAsMGMAsGPMBAs
Coefficients0.633 0.228 0.415 0.408 0.586 0.360
Standard error0.051 0.105 0.075 0.070 0.071 0.084
Z value12.370 2.180 5.490 5.840 8.200 4.280
p value0.000 0.029 0.000 0.000 0.000 0.000
95% CI0.532 0.024 0.267 0.271 0.446 0.195
0.733 0.433 0.563 0.546 0.726 0.525
Disclaimer/Publisher’s Note: The statements, opinions and data contained in all publications are solely those of the individual author(s) and contributor(s) and not of MDPI and/or the editor(s). MDPI and/or the editor(s) disclaim responsibility for any injury to people or property resulting from any ideas, methods, instructions or products referred to in the content.

