Abstract
The reasonable optimization of energy structures and improvement of energy utilization efficiency are the inevitable way to achieve new progress in ecological civilization construction. The Yangtze River Economic Belt, as the leading demonstration area of China’s ecological civilization construction, is of great significance to take the lead in clarifying its energy efficiency situation under the dual-carbon goal. For this purpose, this paper uses the super-efficiency SBM model, ML index and Tobit model considering undesired output to explore the energy efficiency and the main factors affecting it of nine provincial capitals and two municipalities in the Yangtze River Economic Belt from 2003 to 2019. The results show that: (1) During the investigation period, the energy efficiency values of 11 cities are above 1, with a recent trend of decline, and the energy efficiency difference between regions is still expanding. (2) From 2003 to 2019, the overall energy efficiency of the Yangtze River Economic Belt has gradually improved with an average annual growth rate of 4.7%. Technological progress is the main force behind efficiency improvement, technical efficiency plays a small role, and the growth rate of the scale efficiency change index is only 1.3%, which means that the existing scale system of the Yangtze River Economic Belt still needs to be further improved. (3) The impact of industrial structure and government dominance on energy efficiency is significantly positive, while the degree of opening to the outside world is significantly negative. The relationship between economic development level and energy efficiency is an inverted “U” shape.
1. Introduction
The climate change crisis is a common challenge faced by humanity and no country can stay out of it. In order to effectively deal with the climate crisis, the international community is showing unprecedented solidarity and efforts and actively carrying out international cooperation to find coping strategies. Against this background, countries around the world have successively proposed dual-carbon goals [1]. In 2020, General Secretary Xi Jinping proposed the dual-carbon goal of China’s carbon peak in 2030 and carbon neutrality in 2060 at the 75th United Nations General Assembly, which demonstrates China’s determination and responsibility as a country with a large population and economy. This also means that in the future, China will focus on more efficient energy utilization and more a ecological and environmentally sustainable development model. At present, compared with the development of new energy, improving energy efficiency through related technologies is still an effective way to alleviate the problem of energy shortage in most countries. China’s “14th Five-Year Plan” proposes to promote a substantial increase in energy utilization efficiency and continuous improvement of the ecological environment. By 2025, China aims to reduce energy consumption per unit of GDP by 13.5% compared with 2020. In fact, energy conservation and carbon reduction have been incorporated into China’s national development plan in the “11th Five-Year Plan” period. The main tasks are clearly defined: fully implement the scientific outlook on development. It is required to build a resource-saving and environment-friendly society, vigorously develop the circular economy, protect and restore the natural ecology and intensify environmental protection [2]. The “12th Five-Year Plan” put forward a green development strategy, which made the goals of energy conservation and emission reduction more clear. In this plan, it was clearly required to optimize the pattern, promote the coordinated development of regions and the healthy development of urbanization, engaging in green development and resource saving, and build an environmentally friendly society [3]. The “13th Five-Year Plan” once again emphasized the goals of energy conservation, emission reduction, low carbon emission and improvement of energy and resource utilization efficiency; gave the guiding ideology of ecological civilization construction; and put forward proposals for accelerating the improvement of the ecological environment [4]. Since 2012, China has reduced energy consumption per unit of GDP by 24.6%, which is equivalent to reducing energy consumption by 1.27 billion tons of standard coal [5]. The “14th Five-Year Plan” set a 13.5% reduction in energy consumption per unit of GDP as one of the major binding targets for economic and social development [6]. To implement these major national strategic measures in the energy field, it is urgent to comprehensively improve the efficiency of energy utilization.
The Yangtze River Economic Belt has an extremely important strategic position in China’s regional development pattern. It is the golden economic belt with the widest coverage, the longest depth and the greatest influence in the country, an important ecological security barrier for the country’s sustainable development, and also a pioneering area which promotes the formation of high-quality development with complementary advantages. The Yangtze River Economic Belt spans three major plates including the western, central and eastern regions, covering 11 provinces and municipalities including Yunnan, Sichuan, Chongqing, Guizhou, Hubei, Hunan, Anhui, Jiangxi, Jiangsu, Zhejiang and Shanghai, covering an area of about 2,052,300 km2 and accounting for 21.4% of China’s territory. Statistics in 2020 show that its population is 42.9% of the country’s total and its GDP is 46.4% of the country’s total. It plays an important role in supporting and leading the country’s economic development. In addition, the Yangtze River Economic Belt is divided into upper, middle and lower reaches. The lower reaches include Shanghai, Jiangsu, Zhejiang and Anhui provinces, covering an area of about 350,300 km2, accounting for 17.1% of the Yangtze River Economic Belt. The middle reaches include Jiangxi, Hubei and Hunan provinces, covering an area of 564,600 km2, accounting for 27.5% of the Yangtze River Economic Belt. The upstream area includes Chongqing, Sichuan, Guizhou and Yunnan, covering an area of 1,137,400 km2, accounting for 55.4% of the Yangtze River Economic Belt. However, the high-quality development of the Yangtze River Economic Belt has long been constrained by factors such as unbalanced regional development and low energy utilization efficiency, and extensive development continues. Therefore, it is of great significance to further improve the energy utilization efficiency of the Yangtze River Economic Belt to explore what factors promote or hinder energy efficiency. The relevant conclusions and policy suggestions also have a reference value for other regions to improve energy efficiency.
The related research on energy utilization efficiency has always been a hot spot in the academic world, and some related studies on energy utilization efficiency are shown in Table 1. At present, most research on energy utilization efficiency measurement models and the construction of evaluation index systems mainly focus on the national, inter-provincial and regional scales [7,8,9,10,11,12,13], and there are rare reports on the research scale of provincial capital cities and municipalities directly under the central government. Generally speaking, compared with general prefecture-level cities, provincial capitals and municipalities directly under the central government have good completeness of data on the measurement of energy efficiency input–output indicators. However, the lack of data is more serious in the study of general prefecture-level cities, so most scholars have to use estimation to supplement the data. Therefore, the calculation results obtained in this way will inevitably deviate from the actual situation. Secondly, it is not difficult to see from the table that many scholars still choose the three industrial wastes as undesired outputs. We believe that the energy efficiency obtained by ignoring carbon dioxide emissions under the dual-carbon target is not only insignificant, but also deviates from the actual energy utilization efficiency and further misleads policy recommendations. For this reason, this paper selects nine provincial capital cities and two municipalities directly under the central government with 11 core cities in the 11 provinces and cities in the Yangtze River Economic Belt with relatively complete data as the representative research objects, and uses the super-efficiency factor considering undesired output. The SBM model measures the energy utilization efficiency of the Yangtze River Economic Belt, and uses the ML index for dynamic analysis. Finally, a Tobit Regression Model is constructed to further explore the main influencing factors of the energy utilization efficiency of the Yangtze River Economic Belt, and give relevant policy suggestions.

Table 1.
Related research on energy efficiency.
2. Calculation Model of Energy Utilization Efficiency
2.1. Super-SBM Model Considering Undesired Output
The use of energy elements in economic activities usually leads to the production of pollutants. Therefore, the selection of treatment methods for unexpected output is key in the current research on energy efficiency. Under the DEA method, it is generally hoped that the more expected output the better, while the less input and non-expected output the better. Based on this assumption, there are five processing methods: The first method is to take the unexpected output variable as the input variable. The second method is to take the reciprocal of the undesired output variable and replace it with the original undesired output. The third method was proposed and improved by Seiford and Zhu [27], and transforms the unexpected output variable into a new variable with the same change direction as the expected output through coordinate transformation. The fourth method is to use the direction distance function proposed by Chung et al. [28] to increase the expected output and reduce the unexpected output at the same time. The fifth method is the SBM model with unexpected output proposed by Tone [29], which considers the influence of relaxation variables on efficiency calculation, and the efficiency value obtained has better discrimination. Among the above five processing methods, the first processing method is obviously inconsistent with the actual situation, while the second processing method will cause the change range of the unexpected output index to change, so the first two processing methods may cause deviation in the efficiency estimation results. The third processing method can only keep the efficiency state (effective or ineffective) unchanged after the coordinate transformation, that is, it has “classification invariance”, but the efficiency value will change. At the same time, using this method will lead to DMUs with negative outputs being considered effective, so it is necessary to reevaluate DMUs with negative outputs. The fourth processing method avoids the shortcomings of the first three processing methods, but like the first three processing methods, it belongs to the radial efficiency measurement method, which may overestimate the efficiency value of the decision-making unit and reduce the differentiation of the evaluation results. In order to overcome this defect, the fifth processing method is improved on the basis of previous research, and is extended to a non-radial direction distance function. In recent years, the fourth and fifth treatment methods have been widely used in efficiency evaluation due to their advantages of reasonable structure and easy expansion.
In order to be close to reality, while calculating the energy utilization efficiency, in addition to the expected output of GDP, it is also necessary to consider the environmental pollution indicators that accompany the expected output such as carbon emissions and sulfur dioxide emissions, which are regarded as undesired output in the efficiency evaluation. By summarizing previous research results, it is found that data envelopment analysis (DEA) and its model have been widely used since it was proposed by Charnes, and it shows its unique advantages in the analysis of multi-input and multi-output situations. However, since the slack variables are not considered, the efficiency evaluation of the traditional DEA model deviates from the actual situation. To this end, Tone [29] proposed a non-radial DEA model with input and output slack variables—the SBM model. However, the SBM model has the same defect as the traditional DEA model, that is, it cannot further distinguish DMUs with an efficiency of 1. In response to this phenomenon, the Super-SBM model came into being. According to the SBM model proposed by Tone, the formula is:
In the above formula, the number of decision-making units is represented by n, m represents input, s1 represents the expected output, s2 represents the undesired output and x, yd, yu respectively represent the elements in the input matrix, the elements in the expected output matrix and the elements in the undesired output matrix. ρ is the energy efficiency value. When ρ ≥ 1, the energy utilization efficiency of this area was relatively effective; if ρ < 1, it means that the energy utilization efficiency of this area needs to be further improved.
2.2. Malmquist–Luenberger Index
Referring to the method proposed by Zhong Yinghua [30], the index can be expressed as:
In Formula (3), represents the input in the t period, represents the desired output, represents the undesired output and is the directional distance function under the condition of constant returns to scale (CRS). and are the distance functions in the t period and t + 1 period, respectively. is the mixed distance function of period t + 1 based on period t, and the mixed distance function of period t based on the technical level of period t + 1 is . The relevant formula is derived as follows:
In the above formula, EC, TC, PEC and SEC are the efficiency change index, the technological progress index, the pure technical efficiency change index and the scale efficiency change index, respectively. represents the directional distance function under the condition. If the ML index is greater than 1, it means that the value of energy utilization efficiency is increasing. In contrast, if the ML index is less than 1, it means that the value of energy utilization efficiency is decreasing.
3. Construction of Evaluation Index System and Data Sources
Through the comprehensive consideration of the index system in the existing efficiency evaluation literature, the authors found that most scholars choose to build the index system from aspects of capital, labor and energy, ignoring the scientific and technological investment in the rapid development of society. Concerning this phenomenon [31,32,33,34,35], this paper finally uses the inputs of energy, capital, labor and technology as input variables, GDP at constant price and urban green area are used as expected outputs, and emissions of carbon dioxide, industrial sulfur dioxide and industrial soot are used as undesired outputs. The indicator system is constructed in Figure 1. The specific description of the indicators is as follows:
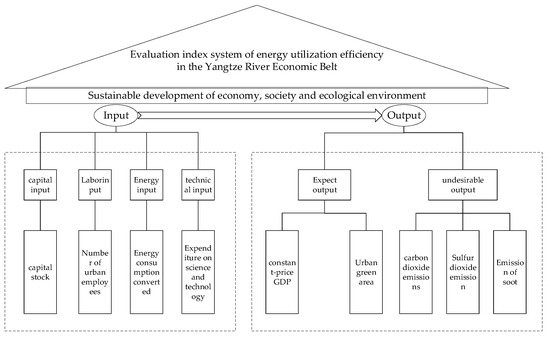
Figure 1.
Energy utilization efficiency index system of Yangtze River Economic Belt.
3.1. The Input Variables
- (1)
- Capital investment. In view of the fact that the actual capital investment data are not easy to obtain, the capital investment calculation in this paper adopts the current mainstream perpetual inventory method, and takes 2003 as the base period. The calculation formula is:
The capital stock in period t − 1 and period t are represented by , respectively; is the investment amount of fixed assets calculated at the price of the current year in year t; and δ is the depreciation rate of capital. This paper uses the calculation method of Zhang Jun [36] to choose δ = 9.6%, where is the investment in fixed assets in 2003, and g is the average growth rate of new fixed assets in the whole society from 2003 to 2019.
- (2)
- Energy input. This paper draws on the method of Li Zhi [37] on the premise that the sum of electricity, gas fuel and liquefied petroleum gas consumed by the city accounts for the same proportion of the total urban energy consumption as the proportion at the provincial level. For estimation of urban energy consumption data and unified conversion, the unit is 10,000 tons of standard coal.
- (3)
- Labor input. Strictly speaking, labor input should be measured according to the city’s effective labor time. Subject to the accuracy and availability of data, this paper selects the number of urban employees in the city as the input value of this variable.
- (4)
- Technology investment. This is expressed as the scientific and technological expenditure in the local public financial revenue and expenditure (city-wide).
3.2. The Expected Outputs
- (1)
- Constant-price GDP. This paper takes the regional GDP of 9 provincial capitals and 2 municipalities along the Yangtze River Economic Belt from 2003 to 2019 as one of the expected output indicators. Considering the impact of price factors, the constant-price GDP with the base period of 2003 is selected as the expected output.
- (2)
- Urban green area. Since the 18th National Congress of the Communist Party of China, General Secretary Xi Jinping has repeatedly emphasized that invaluable assets are inferior to clear waters and lush mountains. He believes that economic development should not be at the expense of the environment, and especially pointed out that the development that conforms to the green ecological environment is sustainable and real development. Therefore, the urban green area is also included in the index system in this paper.
3.3. Unexpected Outputs
Carbon dioxide emissions, industrial sulfur dioxide emissions and industrial soot emissions are used as undesired output indicators, and the calculation of carbon dioxide emissions draws on the method of Wu Jianxin [38]. It takes into account carbon dioxide emissions not only from direct energy consumption, such as gas and liquefied petroleum gas, but also from electricity, transportation and thermal energy consumption, which are added up to obtain the total carbon dioxide emissions of each city. Finally, referring to the method of Qiu Shilei [39], the social willingness to pay is used as the weight (as shown in Table 2) to fit the three undesired outputs into one environmental pollution emission index.
Table 2.
Social willingness to pay and weight of each pollutant.
The above variable data are all from the China Statistical Yearbook, China Urban Statistical Yearbook, China Energy Statistical Yearbook, China Environment Statistical Yearbook and the urban statistical yearbooks of relevant cities. A small number of missing values were filled using the average growth rate complement method and mean interpolation method for supplementary correction.
The above energy consumption data are time-series data. The unit root test method is generally used for the stability analysis of time series. The basic idea is to find the characteristic root of the characteristic equation of the model by fitting the applicable model of the series. Assuming time-series model as a non-homogeneous linear difference equation, then the characteristic equation of homogeneous linear equation is .
Setting up are p characteristic roots of homogeneous linear equation ; therefore, the necessary and sufficient condition for a time-series model to be stable is that its p characteristic roots are all on the unit circle, which is equivalent to the roots of the autoregressive coefficient polynomial of the time-series model all being outside the unit circle [26]. Proof: are p characteristic roots of the homogeneous linear equation . By substituting into the characteristic equation, we can obtain a special solution of the non-homogeneous linear equation :
The autocorrelation coefficient of the time series of energy efficiency of typical cities in the Yangtze River Economic Belt does not tend to zero quickly (for example, K = 1, K = 2 in the lag period), that is, it decreases slowly, indicating that the above original time-series data are stable.
4. Results and Analysis
4.1. Static Calculation of Energy Utilization Efficiency in the Yangtze River Economic Belt
Relying on the theoretical method of the undesired output super-efficiency SBM model, with the help of MaxDEA 8 Ultra software, the energy utilization efficiency values of nine provincial capitals and two municipalities along the Yangtze River Economic Belt from 2003 to 2019 were calculated under the condition of variable returns to scale (VRS). The details are shown in Table 3.
Table 3.
Annual average energy utilization efficiency in the Yangtze River Economic Belt from 2003 to 2019.
First, from an overall perspective, the average energy utilization efficiency of ten cities in Hefei, Nanchang, Wuhan, Shanghai, Nanjing, Changsha, Chongqing, Kunming and Guiyang were all greater than 1 from 2003 to 2019, accounting for 90.9% of the overall sample. This indicates that from the perspective of 11 core cities, the overall energy utilization efficiency of the Yangtze River Economic Belt has been relatively good over the past 17 years. The top three energy utilization efficiency averages from 2003 to 2019 are found in Shanghai, Nanjing and Guiyang. It is worth noting that the city with the lowest efficiency value is Hangzhou, with an average efficiency of 0.853, a difference of 0.584 from Shanghai, which has the highest average efficiency. From an economic point of view, Hangzhou is relatively advanced in economic development among these 11 cities, but its improvement in energy utilization efficiency is not significant. This result not only confirms that the degree of economic development and energy utilization efficiency are not positively correlated, but also shows that the extensive development of Hangzhou continues to a certain extent. In addition, in the research of many scholars, it is believed that the energy utilization efficiency of Guizhou province has always been at a low level of development [40]. From the perspective of the provincial capital and municipality directly under the central government, the results show that the energy efficiency of Guiyang ranks third among 11 cities. Based on the index system of this paper, many green development indicators are considered, and the energy utilization efficiency under the premise of sustainable development is examined. The degree of industrialization in Guiyang is relatively low and the emission of pollutants is less than that in other regions. Therefore, the energy utilization efficiency under the indicator system of this paper is quite impressive.
Secondly, from the time dimension analysis, in order to overcome the lack of intuitiveness of the time development trend of energy utilization efficiency in the data table, this paper draws the energy efficiency development trend map of the Yangtze River Economic Belt from 2003 to 2019. As shown in Figure 2, the average energy utilization efficiency of the Yangtze River Economic Belt is above 1. In general, the overall development of energy utilization efficiency in the Yangtze River Economic Belt has been stable. It began to fluctuate greatly in 2016 and had a downward trend, likely because the Political Bureau of the CPC Central Committee reviewed and approved the Outline of the Development Plan for the Yangtze River Economic Belt on 25 March 2016, which requires vigorous protection of the ecological environment of the Yangtze River and innovation-driven industrial upgrading. At the same time, it is emphasized that large-scale protection should be pursued instead of large-scale development. By 2021, according to the Economic Daily, a large number of high-energy-consuming and high-polluting enterprises have been shut down and banned and more than 8000 chemical companies have been “closed, and relocated”, which means that although there is still a certain gap between the current Yangtze River Economic Belt and the high-level coordinated development of economy and energy efficiency, the extensive economic development model with high investment and high emissions is constantly improving, and the improvement of energy efficiency and ecological protection during economic development of cities in the Yangtze River Economic Belt has begun to bear fruit.
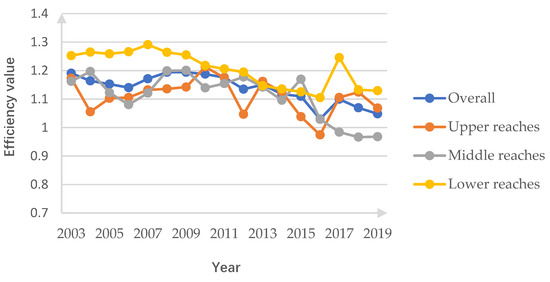
Figure 2.
The development trend of energy utilization efficiency in the Yangtze River Economic Belt.
Finally, from the analysis of the regional dimension, from the perspective of the upper, middle and lower regions in Figure 2, the regional differences in the energy utilization efficiency of the Yangtze River Economic Belt were obvious during the observation period of this paper, and the lower reaches (Shanghai, Nanjing, Hangzhou and Hefei) were the best and far ahead of the upper and middle reaches. It is worth noting that the three regions all declined during 2016–2019, and the differences in energy utilization efficiency between regions have been expanding. Relatively speaking, the development in other years has been relatively stable. In terms of the average value of downstream regions, Shanghai’s average energy utilization efficiency reached 1.437, ranking first among 11 cities in terms of energy utilization efficiency. This shows that Shanghai pays great attention to the improvement of energy efficiency while carrying out economic construction. The midstream (Nanchang, Wuhan and Changsha) energy utilization efficiency showed a downward trend before 2006, and then fluctuated and increased in the following years, which was generally stable. Since 2016, there has been a sharp decline in the midstream, and the average efficiency has dropped below 1 for the first time in 2017. The main reasons are that the integrated development level of the middle reaches is relatively low, the ability to tackle key technical problems and the transformation of innovation achievements is not strong, the industrial structure and spatial layout are unreasonable and environmental pollution problems are more prominent. The impact to the middle reaches was the largest among the three regions after the outline was carried out, resulting in a continued sharp decline in energy efficiency. The energy utilization efficiency value of the upstream (Chongqing, Chengdu, Guiyang and Kunming) has long been between the midstream and the downstream, which is relatively close to the midstream. The energy utilization efficiency value of the upstream area decreased from 1.173 in 2003 to 0.974 in 2016, reaching its lowest value. It began to rise continuously from 2017 to 2019, with good momentum.
4.2. Analysis of Dynamic Energy Utilization Efficiency
In order to further explore the dynamic trend of energy utilization efficiency in the Yangtze River Economic Belt, this paper uses the Malmquist–Luenberger (ML) index model to calculate the change value of its efficiency based on the MaxDEA 8 Ultra software on the panel data of 11 cities in the Yangtze River Economic Belt from 2003 to 2019. The calculation and decomposition results are shown in Table 4.
Table 4.
The ML index and its decomposition of the average energy utilization efficiency in the core cities of the Yangtze River Economic Belt.
From an overall perspective, as shown in Table 5, the ML index of the average energy utilization efficiency of the Yangtze River Economic Belt from 2003 to 2019 was 1.047, indicating that the overall energy utilization efficiency of the Yangtze River Economic Belt has gradually improved by 4.7%. From the perspective of index decomposition, the annual average values of the technical efficiency change index (EC), technological progress index (TC), pure technical efficiency change index (PEC) and scale efficiency change index (SEC) of the 11 core cities in the Yangtze River Economic Belt from 2003 to 2019 were 1.011, 1.059, 0.998 and 1.013, respectively. It can be seen that technological progress is the main force to improve the energy efficiency of the Yangtze River Economic Belt. Although technical efficiency also has a certain role in promoting energy efficiency, its effect is relatively small compared to technological progress. It is worth noting that the average pure technical efficiency of the Yangtze River Economic Belt as a whole does not reach 1, indicating that the infrastructure management and technical level of the Yangtze River Economic Belt are in urgent need of improvement. From a numerical point of view, the scale efficiency change index of the Yangtze River Economic Belt is in the growth stage, but the growth rate is not large, only 1.3%, indicating that the Yangtze River Economic Belt still needs to further improve the existing scale system.
Table 5.
The ML index and its decomposition of the average energy utilization efficiency in each year of the Yangtze River Economic Belt from 2003 to 2019.
From a regional perspective, from 2003 to 2019, the ML indices of energy utilization efficiency in the upper, middle and lower reaches of the Yangtze River Economic Belt were 1.005, 1.032 and 1.124, respectively, which further confirmed that there is a regional pattern of unbalanced development in the Yangtze River Economic Belt. Energy utilization efficiency in the lower reaches develops the fastest, far exceeding the middle and upper reaches. From a numerical point of view, technological progress has the greatest impetus to improve the energy efficiency of the three major regions of the Yangtze River Economic Belt. The technological progress of the upper and middle reaches is relatively close to about 4%, and the lower reaches are the most obvious. The average annual growth rate of technological progress has reached 11.4%. The numerical results are in good agreement with the actual economic development level and the status quo of scientific and technological development in the three regions. The biggest factor that promotes the growth of technical efficiency in the three regions of the Yangtze River Economic Belt is the scale efficiency change index.
From 2003 to 2019, the ML index value of the annual average energy utilization efficiency was greater than 1 in nine of 11 core cities in the Yangtze River Economic Belt, accounting for 82%. The city with the largest ML index was Nanjing and that with the smallest was Guiyang, with ML indexes of 1.186 and 0.950, respectively. The difference between the two is 0.236, which to a certain extent shows that the level of economic development has a driving effect on energy utilization efficiency.
5. Analysis of Influencing Factors of Energy Utilization Efficiency in the Yangtze River Economic Belt
5.1. Tobit Model
In this paper, the energy utilization efficiency of nine provincial capital cities and two municipalities directly under the central government in the Yangtze River Economic Belt is used as the explained variable, and the relevant factors affecting energy utilization efficiency are used as explanatory variables to construct a regression model. Since the energy utilization efficiency results obtained by the super-efficiency SBM calculation are truncated data, and when the explained variable is a limited value, the general linear regression method cannot describe the degree to which the explained variable is affected by the explanatory variable. In the general multiple linear regression method, the existence of the intercepted variable value will cause the analysis results to deviate from the actual situation. Through a large number of studies, scholars generally believe that the Tobit model has a natural advantage in solving the problem of efficiency distribution; the direction and the manner of efficiency improvement can be obtained from the regression results [41,42,43]. Based on the above situation, this paper selects the Tobit model to test the data, in order to avoid the possible bad results of general linear regression.
The Tobit model uses the maximum likelihood estimation method to estimate the variable parameters. The model formula is as follows:
In this formula, σ is the scale parameter, β is the regression parameter vector, ∼, in which the value of the explained variable is determined as follows:
In other words, when , the value of the explained variable is unrestricted actual observation. When , the value of the explained variable is restricted, and its value is intercepted as 0.
5.2. Variable Description and Data Source
The influencing factors of changes in urban energy utilization efficiency are very complex, and it is unrealistic to exhaust all the influencing factors. In view of the availability of data and with reference to existing research, we selected three existing research indicators: openness, industrial structure and environmental regulation. On this basis, this paper innovatively selects government dominance and Engel coefficient as two variable indicators of the economic development level. Therefore, this paper decides to determine the explanatory variables from the following five aspects:
- Degree of opening to the outside world (Open): This paper selects the actual use of foreign investment as a measure. With the inflow of international investment, to a certain extent, a large number of industries with high energy consumption and high pollution have been transferred in. In fact, there are obvious differences in the level of economic development among the regions of the Yangtze River Economic Belt, and the impact of international investment on its industrial structure and innovation capability is also different. Therefore, it is reasonable to assume that the impact of international investment on energy efficiency is also different; the technology spillover effect produced by foreign capital has a certain impact on energy utilization efficiency [44].
- Industrial structure (Ind): This paper selects the proportion of the total output value of the secondary industry in GDP as a measure of this influencing factor. The secondary industry is the main consumer of energy in China. The difficulty in realizing the improvement of energy utilization efficiency lies in whether the secondary industry can realize the optimization and upgrading of the industrial structure. Theoretically, while the secondary industry drives economic growth, it will also lead to high pollution, high energy consumption and rapid resource consumption. Optimizing the industrial structure will promote the improvement of energy utilization efficiency in the Yangtze River Economic Belt [45].
- Government dominance (Gov): This paper selects the proportion of government fiscal expenditure in GDP as a measure to indicate the role of the government in the strategy of “Do not engage in large-scale development, and focus on large-scale protection” in the Yangtze River Economic Belt. The government’s appropriate intervention in the economy can play a guiding and regulating role. Under the concept of high-quality economic development, the “Great Protection” strategy of the Yangtze River Economic Belt is to guide the regional energy utilization efficiency through the government’s macro-control, continue to promote regional green and sustainable development and help to build a pioneering demonstration belt for China’s ecological civilization construction.
- Environmental regulation (Envir): Here, we use the method of Ye Qin [46] to obtain the urban environmental regulation index and use it as a measure. Generally speaking, the stronger the environmental regulation, the faster the upgrading of industries with high energy consumption, high pollution and low energy utilization efficiency. The improvement of environmental regulation can not only reduce the emission of pollutants from the source, but also greatly stimulate the innovation of energy-saving emission reduction technologies and production processes of enterprises, thereby promoting the improvement of energy utilization efficiency in the Yangtze River Economic Belt.
- Economic development level (Econ): The Engel coefficient of urban households is selected as a measure. The level of economic development is the material basis for technological innovation in urban energy conservation, emission reduction and the improvement of energy efficiency. A large number of studies have shown that there is a correlation between regional energy utilization efficiency and economic level. For this reason, the level of economic development is considered to be included in the influencing factor variables for exploration.
On the basis of the above analysis, descriptive statistics of the variables (as shown in Table 6) were conducted, and the following econometric model was constructed:
Table 6.
Descriptive statistics of relevant variables.
Among them, YEE is the total factor energy utilization efficiency, C is the constant term and μ is the residual term.
Among the indicators selected above, except for the actual use of foreign investment and the Engel coefficient of urban households, which are from the statistical yearbooks of various cities, the rest of the data are taken from the “China Statistical Yearbook”. Due to the small value of energy utilization efficiency and the inconsistency of the original data dimensions, this paper chooses to take the logarithm of the actual use of foreign investment data for analysis, and other data are indices or proportions and are not processed.
5.3. Analysis of Regression Results
In this paper, the random effect model is used for calculation, and the regression results of the model are shown in Table 7.
Table 7.
Regression results of influencing factors of energy utilization efficiency in the Yangtze River Economic Belt.
The regression results from the above table show that:
- Degree of opening to the outside world (Open): The regression result is that for every 1% increase in the scale of foreign investment, the energy utilization efficiency will decrease by 0.058 percentage points. At present, the lower reaches of the Yangtze River Economic Belt are the main areas for utilizing FDI. However, the industrialization of the Yangtze River Delta region has basically been completed, and the level of science and technology is in a leading position in the world. Foreign investment is only used to maintain stable economic operation. It does not improve, and even hinders the improvement of, energy efficiency. The middle and upper reaches are not sufficiently open to the outside world; their ability to attract foreign capital is not strong, and the industrial structure and project quality of the foreign capital introduced need to be improved. This is the root cause of the significantly negative opening degree and energy utilization efficiency of the Yangtze River Economic Belt.
- Industrial structure (Ind): From the regression results, the higher the proportion of the secondary industry in GDP, the more significant the energy utilization efficiency. From a spatial point of view, the Yangtze River Economic Belt is a long and narrow belt-like area. The industrial correlation between the nine provincial capitals and two municipalities is weak, and it is impossible to form advantageous industrial clusters and difficult to form an effective extension of the industrial chain. Therefore, increasing the proportion of the secondary industry in the Yangtze River Economic Belt makes up for this deficiency to a certain extent, which in turn has a certain role in improving energy efficiency.
- Government dominance (Gov): The government’s intervention in the Yangtze River Economic Belt has a positive effect on the improvement of energy efficiency. So far, the central government has issued a series of strategic measures for the high-quality development of the Yangtze River Economic Belt. Construction along the Yangtze River has pointed out the direction and promoted the vigorous development of the economic level and energy efficiency of the Yangtze River Economic Belt. To a certain extent, government intervention can stimulate the beneficial effect of resource endowment on energy efficiency and play a positive role in promoting energy efficiency.
- Environmental regulation (Envir): The urban environmental regulation index is positively correlated with energy utilization efficiency, but the regression result is not significant. The authors believe that environmental regulation has inhibited the development of enterprises with low energy utilization efficiency in the Yangtze River Economic Belt to a certain extent, and accelerated the elimination high-polluting, high-energy-consumption and low-output enterprises. Therefore, it has a positive effect on the improvement of energy utilization efficiency.
- Level of economic development (Econ): The regression results show that the linear coefficient of the Engel coefficient is significantly positive, and its quadratic coefficient is significantly negative, which means that there is a relationship between the level of economic development and energy utilization efficiency. The inverted “U”-shaped relationship that promotes first and then inhibits [47] shows that with the continuous improvement of the level of economic development, the energy utilization efficiency of the Yangtze River Economic Belt presents a trend of first increase and then decrease.
5.4. Policy Recommendations
Based on the above conclusions, this paper puts forward the following policy suggestions on how to improve the energy utilization efficiency of the Yangtze River Economic Belt:
- Continue to expand reform and opening up, and coordinate and optimize the quality of opening up. In terms of opening to the outside world, attention should be paid to improving the quality of foreign investment. While the Yangtze River Economic Belt continues to expand its opening to the outside world, it actively improves the access system for foreign-funded enterprises and strictly controls the access threshold.
- Optimize the regional industrial structure and promote development according to local conditions. In terms of industrial structure, we should actively promote the transformation and upgrading of the country’s traditional industries, actively promote the high-end, green and intelligent development of the secondary industry, vigorously develop emerging industries, accelerate the deep integration of traditional manufacturing and Internet technology and further promote regional industries to achieve faster and better development.
- Optimize the top-level design of policies and speed up the transformation of government functions. When choosing government intervention methods, regional governments should consider the far-reaching impact of their policies on regional energy efficiency from multiple perspectives, and select more reasonable government intervention methods in a targeted manner. Invest in scientific research on energy-saving and efficiency-enhancing technologies, introduce energy-saving and efficiency-enhancing service-oriented industries and increase the enthusiasm of enterprises for energy-saving and efficiency improvement.
- Contribute to the construction of ecological civilization and promote the development of energy efficiency and high quality. Accelerate the iterative transformation of industries with high energy consumption, low energy efficiency and high pollution; promote the rapid implementation of scientific research results related to energy conservation and efficiency improvement; and further promote the improvement of energy utilization efficiency in the Yangtze River Economic Belt.
6. Research Conclusions
In this paper, carbon dioxide, sulfur dioxide and soot emissions are used as undesired outputs, and the static energy utilization efficiency of nine provincial capital cities and two municipalities in the Yangtze River Economic Belt is calculated using the super-efficiency SBM model considering undesired outputs. We used the Malmquist–Luenberger index to conduct a dynamic analysis of energy utilization efficiency, and finally we constructed a Tobit regression model to further explore the influencing factors of energy utilization efficiency in the Yangtze River Economic Belt. The result show that:
- During the inspection period, the overall static energy utilization efficiency of nine provincial capital cities and two municipalities in the Yangtze River Economic Belt has been relatively good in the past 17 years. The energy utilization efficiency value of 11 cities can exceed 1. However, there is a trend of decline recently and the difference in energy utilization efficiency between regions is still expanding. This is mainly due to the continuous expansion of the gap in the development level of different regions. In follow-up studies, we can focus on how to promote the balanced and coordinated development of different regions in combination with their individual characteristics and narrow the gap in comprehensive development.
- From 2003 to 2019, the overall energy utilization efficiency of the Yangtze River Economic Belt gradually improved, and the average annual growth rate of energy utilization efficiency is 4.7%. Technological progress is the main force for improving the energy utilization efficiency of the Yangtze River Economic Belt, and the role of technical efficiency is relatively small. It is worth noting that the growth rate of the scale efficiency change index of the Yangtze River Economic Belt is only 1.3%, which means that the existing scale system of the Yangtze River Economic Belt still needs to be further improved. Follow-up research should focus on how to promote the optimization of the urban agglomeration scale system of the Yangtze River Economic Belt.
- The impact of industrial structure and government dominance on energy utilization efficiency is significantly positive, the degree of opening to the outside world has a significant negative impact on the improvement of energy utilization efficiency, and there is an inverted “U” relationship between economic development level and energy utilization efficiency.
Author Contributions
G.J. and C.L. conceived and designed the study. Introduction, G.J. and X.Z.; methodology, G.J., C.L. and X.Z.; software, G.J. and J.L.; validation, G.J., X.Z. and C.L.; investigation, G.J. and P.L.; data resources, G.J. and C.L; data curation, G.J., X.Z. and C.L.; writing—original draft preparation, C.L.; writing—review and editing, G.J. and C.L.; supervision, G.J., P.L., J.L., X.Z. and C.L. All authors have read and agreed to the published version of the manuscript.
Funding
This research was funded by “The Open Fund of Key Laboratory of Anhui Higher Education Institutes” grant number CS2021-04.
Institutional Review Board Statement
Not applicable.
Data Availability Statement
All data, models or code that support the findings of this study are available from the corresponding author upon reasonable request.
Acknowledgments
The authors would like to thank the editor and anonymous reviewers for their valuable comments.
Conflicts of Interest
The authors declare no conflict of interest.
References
- Lin, B.Q. High Quality Growth of China’s economy in the process of carbon neutrality. Econ. Res. J. 2022, 57, 56–71. Available online: https://kns.cnki.net/kcms/detail/detail.aspx?FileName=JJYJ202201006&DbName=CJFQ2022 (accessed on 3 December 2022).
- Zhu, J.P.; Lin, B.Q. Economic growth pressure and energy efficiency improvement: Empirical evidence from Chinese cities. Appl. Energy 2022, 307, 118275. [Google Scholar] [CrossRef]
- Wei, W.; Hu, H.; Chang, C.P. Why the same degree of economic policy uncertainty can produce different outcomes in energy efficiency? New evidence from China. Struct. Chang. Econ. Dyn. 2022, 60, 467–481. [Google Scholar] [CrossRef]
- Xu, M.; Tan, R.; He, X. How does economic agglomeration affect energy efficiency in China? Evidence from endogenous stochastic frontier approach. Energy Econ. 2022, 108, 105901. [Google Scholar] [CrossRef]
- Hu, A.G. Chinese style green modernization: Review and prospect. J. Beijing Univ. Technol. Soc. Sci. Ed. 2022, 1–18. Available online: http://kns.cnki.net/kcms/detail/11.4558.G.20220913.0922.002.html (accessed on 9 December 2022).
- Zhang, S.; Wang, J.Y. Optimization of economic growth under the constraint of energy conservation and emission reduction during the “Fourteenth Five Year Plan” period. J. Hebei Univ. Econ. Trade 2022, 43, 45–56. [Google Scholar] [CrossRef]
- Zhao, H.R.; Guo, S.; Zhao, H.R. Provincial energy efficiency of China quantified by three-stage data envelopment analysis. Energy 2019, 166, 96–107. [Google Scholar] [CrossRef]
- Zhang, N.; Kong, F.B.; Yu, Y.N. Measuring ecological total-factor energy efficiency incorporating regional heterogeneities in China. Ecol. Indic. 2015, 51, 165–172. [Google Scholar] [CrossRef]
- Meng, M.; Qu, D.L. Understanding the green energy efficiencies of provinces in China: A Super-SBM and GML analysis. Energy 2022, 239, 121912. [Google Scholar] [CrossRef]
- Zhang, C.Q.; Chen, P.Y. Applying the three-stage SBM-DEA model to evaluate energy efficiency and impact factors in RCEP countries. Energy 2022, 241, 122917. [Google Scholar] [CrossRef]
- Francis, A.S.; Wang, J.M.; Benjamin, B.C.; Jesse, J.M.; Chen, J. The drivers of energy efficiency improvement among nine selected West African countries: A two-stage DEA methodology. Energy Strategy Rev. 2022, 43, 100910. [Google Scholar] [CrossRef]
- An, Q.X.; Wu, Q.F.; Li, J.L.; Xiong, B.B.; Chen, X.H. Environmental efficiency evaluation for Xiangjiang River basin cities based on an improved SBM model and Global Malmquist index. Energy Econ. 2019, 81, 95–103. [Google Scholar] [CrossRef]
- Zhang, Y.; Warren, J.; Xu, M. Total factor efficiency and convergence analysis of renewable energy in Latin American countries. Renew. Energy 2021, 170, 785–795. [Google Scholar] [CrossRef]
- Zhang, X.P.; Cheng, X.M.; Yuan, J.H.; Gao, X.J. Total-factor energy efficiency in developing countries. Energy Policy 2011, 39, 644–650. [Google Scholar] [CrossRef]
- Cheng, Z.H.; Liu, J.; Li, L.S.; Gu, X.B. Research on meta-frontier total-factor energy efficiency and its spatial convergence in Chinese provinces. Energy Econ. 2020, 86, 104702. [Google Scholar] [CrossRef]
- Yu, J.Q.; Zhou, K.L.; Yang, S.L. Regional heterogeneity of China’s energy efficiency in “new normal”: A meta-frontier Super-SBM analysis. Energy Policy 2019, 134, 375–388. [Google Scholar] [CrossRef]
- Zhang, S.Q.; Meng, L.S.; Li, Y. Impact of spatial agglomeration of energy capacity on regional energy efficiency. China Popul. Resour. Environ. 2021, 31, 58–66. Available online: https://kns.cnki.net/kcms/detail/detail.aspx?FileName=ZGRZ202105007&DbName=CJFQ2021 (accessed on 4 December 2022).
- Peng, S.Y. Study on Provincial Total Factor Energy Efficiency in China: Based on three-stage global UHSBM Model. Econ. Issues 2020, 1, 11–19. Available online: https://kns.cnki.net/kcms/detail/detail.aspx?FileName=JJWT202001003&DbName=CJFQ2020 (accessed on 10 November 2022).
- Shao, S.; Fan, M.T.; Yang, L.L. Economic restructuring, Green technology progress and low-carbon transition in China: An empirical study from the perspective of overall technological frontier and spatial spillover effect. Manag. World 2022, 38, 46–69+4–10. [Google Scholar] [CrossRef]
- Li, G.; Liu, J.G.; Li, T.Q. Regional difference of energy eco-efficiency in manufacturing industry considering undesired output: A two-stage analysis based on SBM and Tobit model. China Manag. Sci. 2019, 27, 76–87. [Google Scholar] [CrossRef]
- Shi, D.; Li, S.L. Emission trading system and energy efficiency: Measurement and empirical analysis of prefecture-level and above cities. China Ind. Econ. 2020, 9, 5–23. [Google Scholar] [CrossRef]
- Tian, Z.; Zhang, H.J.; Ren, F.G. Comparative study on Energy efficiency evaluation and Influencing factors of three major urban agglomerations in China under environmental constraints. Soft Sci. 2020, 34, 87–95. [Google Scholar] [CrossRef]
- Utlu, Z.; Hepbasli, A. A review on analyzing and evaluating the energy utilization efficiency of countries. Renew. Sustain. Energy Rev. 2007, 11, 1–29. [Google Scholar] [CrossRef]
- He, Y.; Liao, N.; Zhou, Y. Analysis on provincial industrial energy efficiency and its influencing factors in China based on DEA-RS-FANN. Energy 2018, 142, 79–89. [Google Scholar] [CrossRef]
- Yang, Z.S. The measurement and influences of China’s urban total factor energy efficiency under environmental pollution: Based on the game cross-efficiency DEA. J. Clean. Prod. 2019, 209, 439–450. [Google Scholar] [CrossRef]
- Wang, Z.; Feng, C.; Zhang, B. An empirical analysis of China’s energy efficiency from both static and dynamic perspectives. Energy 2014, 74, 322–330. [Google Scholar] [CrossRef]
- Seiford, L.M.; Zhu, J. A response to comments on modeling undesirable factors in efficiency evaluation. Eur. J. Oper. Res. 2005, 161, 579–581. [Google Scholar] [CrossRef]
- Chung, Y.H.; Färe, R.; Grosskopf, S. Productivity and undesirable outputs: A directional distance function approach. J. Environ. Manag. 1997, 51, 229–240. [Google Scholar] [CrossRef]
- Tone, K. A slacks-based approach to efficiency envelopment analysis in data envelopment. Eur. J. Oper. Res. 2002, 143, 32–41. [Google Scholar] [CrossRef]
- Yang, J.; Shao, H.H. A Study on China’s Industrial Growth under Environmental Constraints—An Empirical Analysis Based on Malmquist Lounberger Index. J. Quant. Technol. Econ. 2009, 26, 64–78. Available online: https://kns.cnki.net/kcms/detail/detail.aspx?FileName=SLJY200909008&DbName=CJFQ2009 (accessed on 10 November 2021).
- Sun, H.; Guo, J.G. The Impact and Mechanism of Environmental Regulation and Industrial Agglomeration on Energy Efficiency: From the Perspective of Spatial Effect. Nat. Resour. J. 2022, 37, 3234–3251. Available online: https://kns.cnki.net/kcms/detail/detail.aspx?FileName=ZRZX202212014&DbName=DKFXTEMP (accessed on 20 December 2022).
- Xu, J.W.; Li, C.C. A Study on the Spatial and Temporal Differentiation of Green Total Factor Energy Efficiency in the Yangtze River Economic Belt. J. China Three Gorges Univ. Humanit. Soc. Sci. 2022, 44, 54–62+93. [Google Scholar] [CrossRef]
- Utlu, Z.; Hepbasli, A. Assessment of the energy utilization efficiency in the Turkish transportation sector between 2000 and 2020 using energy and exergy analysis method. Energy Policy 2006, 34, 1611–1618. [Google Scholar] [CrossRef]
- Jin, B.; Liu, W.N. Local Market Scale and Energy Efficiency—Adjustment Path of Green Technology Progress and Green Technology Efficiency. Ecol. Econ. 2022, 38, 70–79+118. Available online: https://kns.cnki.net/kcms/detail/detail.aspx?FileName=STJJ202210006&DbName=DKFX2022 (accessed on 11 December 2022).
- Liu, Z.; Huang, H.; Deng, X.Y. Population Size, Industrial Structure and Energy Efficiency: An Empirical Study Based on Spatial Panel Econometric Model. Macroeconomy 2022, 8, 117–130+175. [Google Scholar] [CrossRef]
- Zhang, J.; Wu, G.Y.; Zhang, J.P. Estimation of China’s Provincial Physical Capital Stock: 1952–2000. Econ. Res. 2004, 10, 35–44. Available online: https://kns.cnki.net/kcms/detail/detail.aspx?FileName=JJYJ200410004&DbName=CJFQ2004 (accessed on 14 December 2021).
- Li, Z.; Li, G. Analysis on the difference characteristics and influencing factors of urban energy efficiency in China. Econ. Theory Bus. Manag. 2010, 7, 17–23. Available online: https://kns.cnki.net/kcms/detail/detail.aspx?FileName=JJLL201007004&DbName=CJFQ2010 (accessed on 10 December 2021).
- Wu, J.X.; Guo, Z.Y. Convergence analysis of carbon emissions in China based on continuous dynamic distribution method. Stat. Res. 2016, 33, 54–60. [Google Scholar] [CrossRef]
- Qiu, S.L.; Wang, Z.L.; Liu, S.; Dong, H.Z. Research on the Heterogeneity Effect of Environmental Regulation on Environmental Performance under the Constraint of Unexpected Output. China Popul. Resour. Environ. 2018, 28, 40–51. Available online: https://kns.cnki.net/kcms/detail/detail.aspx?FileName=ZGRZ201812005&DbName=CJFQ2018 (accessed on 25 June 2022).
- Yang, G.S.; Xie, Q.H. Spatial and temporal variation of green water resources efficiency in the Yangtze River Economic Belt: Based on SE-SBM and ML index method. Resour. Environ. Yangtze Basin 2019, 28, 349–358. Available online: https://kns.cnki.net/kcms/detail/detail.aspx?FileName=CJLY201902011&DbName=CJFQ2019 (accessed on 15 July 2022).
- Qin, B.T.; Liu, J.N. Spatial and Temporal Evolution and Spatial Spillover Analysis of Green Development Efficiency in Yangtze River Delta-Based on Super SBM Model and Tobit Regression. Ecol Econ. 2022, 38, 64–71. Available online: https://kns.cnki.net/kcms/detail/detail.aspx?FileName=STJJ202211011&DbName=DKFXTEMP (accessed on 12 September 2022).
- Liu, H.R. Research on the Measurement and Influencing Factors of Green Economic Efficiency in Beijing Tianjin Hebei Region—Analysis Based on Super efficiency SBM and Tobit Model. Ecol. Econ. 2022, 1–15. Available online: http://kns.cnki.net/kcms/detail/53.1193.F.20220915.1407.007.html (accessed on 13 September 2022).
- Zhao, Z.F. Research on the Measurement and Driving Factors of China’s Regional Green Technology Innovation Efficiency—Based on Superefficiency SBM and Tobit Model. Spec. Zone Econ. 2022, 8, 54–57. Available online: https://kns.cnki.net/kcms/detail/detail.aspx?FileName=TAJJ202208014&DbName=DKFX2022 (accessed on 19 September 2022).
- Qin, T.; Tong, J.P. Spatial-temporal evolution and influencing factors of water-energy-grain coupling efficiency in the Yangtze River Economic Belt. Resour. Sci. 2021, 43, 2068–2080. Available online: https://kns.cnki.net/kcms/detail/detail.aspx?FileName=ZRZY202110011&DbName=DKFX2021 (accessed on 12 July 2022).
- Wu, C.Q.; Dong, X. Research on total factor energy efficiency of the Yangtze River Economic Belt under environmental constraints. China Soft Sci. 2016, 3, 73–83. Available online: https://kns.cnki.net/kcms/detail/detail.aspx?FileName=ZGRK201603007&DbName=CJFQ2016 (accessed on 14 July 2022).
- Ye, Q.; Zeng, G.; Dai, S.Q.; Wang, F.L. Impact of different environmental regulation tools on energy conservation and emission reduction technology innovation in China: Based on Panel data of 285 prefecture-level cities. China Popul. Resour. Environ. 2018, 28, 115–122. Available online: https://kns.cnki.net/kcms/detail/detail.aspx?FileName=ZGRZ201802013&DbName=CJFQ2018 (accessed on 17 July 2022).
- Wang, S. Research on the relationship between green energy use, carbon emissions and economic growth in China. Soft Sci. 2020, 34, 7–11+24. [Google Scholar] [CrossRef]


Disclaimer/Publisher’s Note: The statements, opinions and data contained in all publications are solely those of the individual author(s) and contributor(s) and not of MDPI and/or the editor(s). MDPI and/or the editor(s) disclaim responsibility for any injury to people or property resulting from any ideas, methods, instructions or products referred to in the content. |
© 2023 by the authors. Licensee MDPI, Basel, Switzerland. This article is an open access article distributed under the terms and conditions of the Creative Commons Attribution (CC BY) license (https://creativecommons.org/licenses/by/4.0/).