1. Introduction
The climate change crisis is a common challenge faced by humanity and no country can stay out of it. In order to effectively deal with the climate crisis, the international community is showing unprecedented solidarity and efforts and actively carrying out international cooperation to find coping strategies. Against this background, countries around the world have successively proposed dual-carbon goals [
1]. In 2020, General Secretary Xi Jinping proposed the dual-carbon goal of China’s carbon peak in 2030 and carbon neutrality in 2060 at the 75th United Nations General Assembly, which demonstrates China’s determination and responsibility as a country with a large population and economy. This also means that in the future, China will focus on more efficient energy utilization and more a ecological and environmentally sustainable development model. At present, compared with the development of new energy, improving energy efficiency through related technologies is still an effective way to alleviate the problem of energy shortage in most countries. China’s “14th Five-Year Plan” proposes to promote a substantial increase in energy utilization efficiency and continuous improvement of the ecological environment. By 2025, China aims to reduce energy consumption per unit of GDP by 13.5% compared with 2020. In fact, energy conservation and carbon reduction have been incorporated into China’s national development plan in the “11th Five-Year Plan” period. The main tasks are clearly defined: fully implement the scientific outlook on development. It is required to build a resource-saving and environment-friendly society, vigorously develop the circular economy, protect and restore the natural ecology and intensify environmental protection [
2]. The “12th Five-Year Plan” put forward a green development strategy, which made the goals of energy conservation and emission reduction more clear. In this plan, it was clearly required to optimize the pattern, promote the coordinated development of regions and the healthy development of urbanization, engaging in green development and resource saving, and build an environmentally friendly society [
3]. The “13th Five-Year Plan” once again emphasized the goals of energy conservation, emission reduction, low carbon emission and improvement of energy and resource utilization efficiency; gave the guiding ideology of ecological civilization construction; and put forward proposals for accelerating the improvement of the ecological environment [
4]. Since 2012, China has reduced energy consumption per unit of GDP by 24.6%, which is equivalent to reducing energy consumption by 1.27 billion tons of standard coal [
5]. The “14th Five-Year Plan” set a 13.5% reduction in energy consumption per unit of GDP as one of the major binding targets for economic and social development [
6]. To implement these major national strategic measures in the energy field, it is urgent to comprehensively improve the efficiency of energy utilization.
The Yangtze River Economic Belt has an extremely important strategic position in China’s regional development pattern. It is the golden economic belt with the widest coverage, the longest depth and the greatest influence in the country, an important ecological security barrier for the country’s sustainable development, and also a pioneering area which promotes the formation of high-quality development with complementary advantages. The Yangtze River Economic Belt spans three major plates including the western, central and eastern regions, covering 11 provinces and municipalities including Yunnan, Sichuan, Chongqing, Guizhou, Hubei, Hunan, Anhui, Jiangxi, Jiangsu, Zhejiang and Shanghai, covering an area of about 2,052,300 km2 and accounting for 21.4% of China’s territory. Statistics in 2020 show that its population is 42.9% of the country’s total and its GDP is 46.4% of the country’s total. It plays an important role in supporting and leading the country’s economic development. In addition, the Yangtze River Economic Belt is divided into upper, middle and lower reaches. The lower reaches include Shanghai, Jiangsu, Zhejiang and Anhui provinces, covering an area of about 350,300 km2, accounting for 17.1% of the Yangtze River Economic Belt. The middle reaches include Jiangxi, Hubei and Hunan provinces, covering an area of 564,600 km2, accounting for 27.5% of the Yangtze River Economic Belt. The upstream area includes Chongqing, Sichuan, Guizhou and Yunnan, covering an area of 1,137,400 km2, accounting for 55.4% of the Yangtze River Economic Belt. However, the high-quality development of the Yangtze River Economic Belt has long been constrained by factors such as unbalanced regional development and low energy utilization efficiency, and extensive development continues. Therefore, it is of great significance to further improve the energy utilization efficiency of the Yangtze River Economic Belt to explore what factors promote or hinder energy efficiency. The relevant conclusions and policy suggestions also have a reference value for other regions to improve energy efficiency.
The related research on energy utilization efficiency has always been a hot spot in the academic world, and some related studies on energy utilization efficiency are shown in
Table 1. At present, most research on energy utilization efficiency measurement models and the construction of evaluation index systems mainly focus on the national, inter-provincial and regional scales [
7,
8,
9,
10,
11,
12,
13], and there are rare reports on the research scale of provincial capital cities and municipalities directly under the central government. Generally speaking, compared with general prefecture-level cities, provincial capitals and municipalities directly under the central government have good completeness of data on the measurement of energy efficiency input–output indicators. However, the lack of data is more serious in the study of general prefecture-level cities, so most scholars have to use estimation to supplement the data. Therefore, the calculation results obtained in this way will inevitably deviate from the actual situation. Secondly, it is not difficult to see from the table that many scholars still choose the three industrial wastes as undesired outputs. We believe that the energy efficiency obtained by ignoring carbon dioxide emissions under the dual-carbon target is not only insignificant, but also deviates from the actual energy utilization efficiency and further misleads policy recommendations. For this reason, this paper selects nine provincial capital cities and two municipalities directly under the central government with 11 core cities in the 11 provinces and cities in the Yangtze River Economic Belt with relatively complete data as the representative research objects, and uses the super-efficiency factor considering undesired output. The SBM model measures the energy utilization efficiency of the Yangtze River Economic Belt, and uses the ML index for dynamic analysis. Finally, a Tobit Regression Model is constructed to further explore the main influencing factors of the energy utilization efficiency of the Yangtze River Economic Belt, and give relevant policy suggestions.
3. Construction of Evaluation Index System and Data Sources
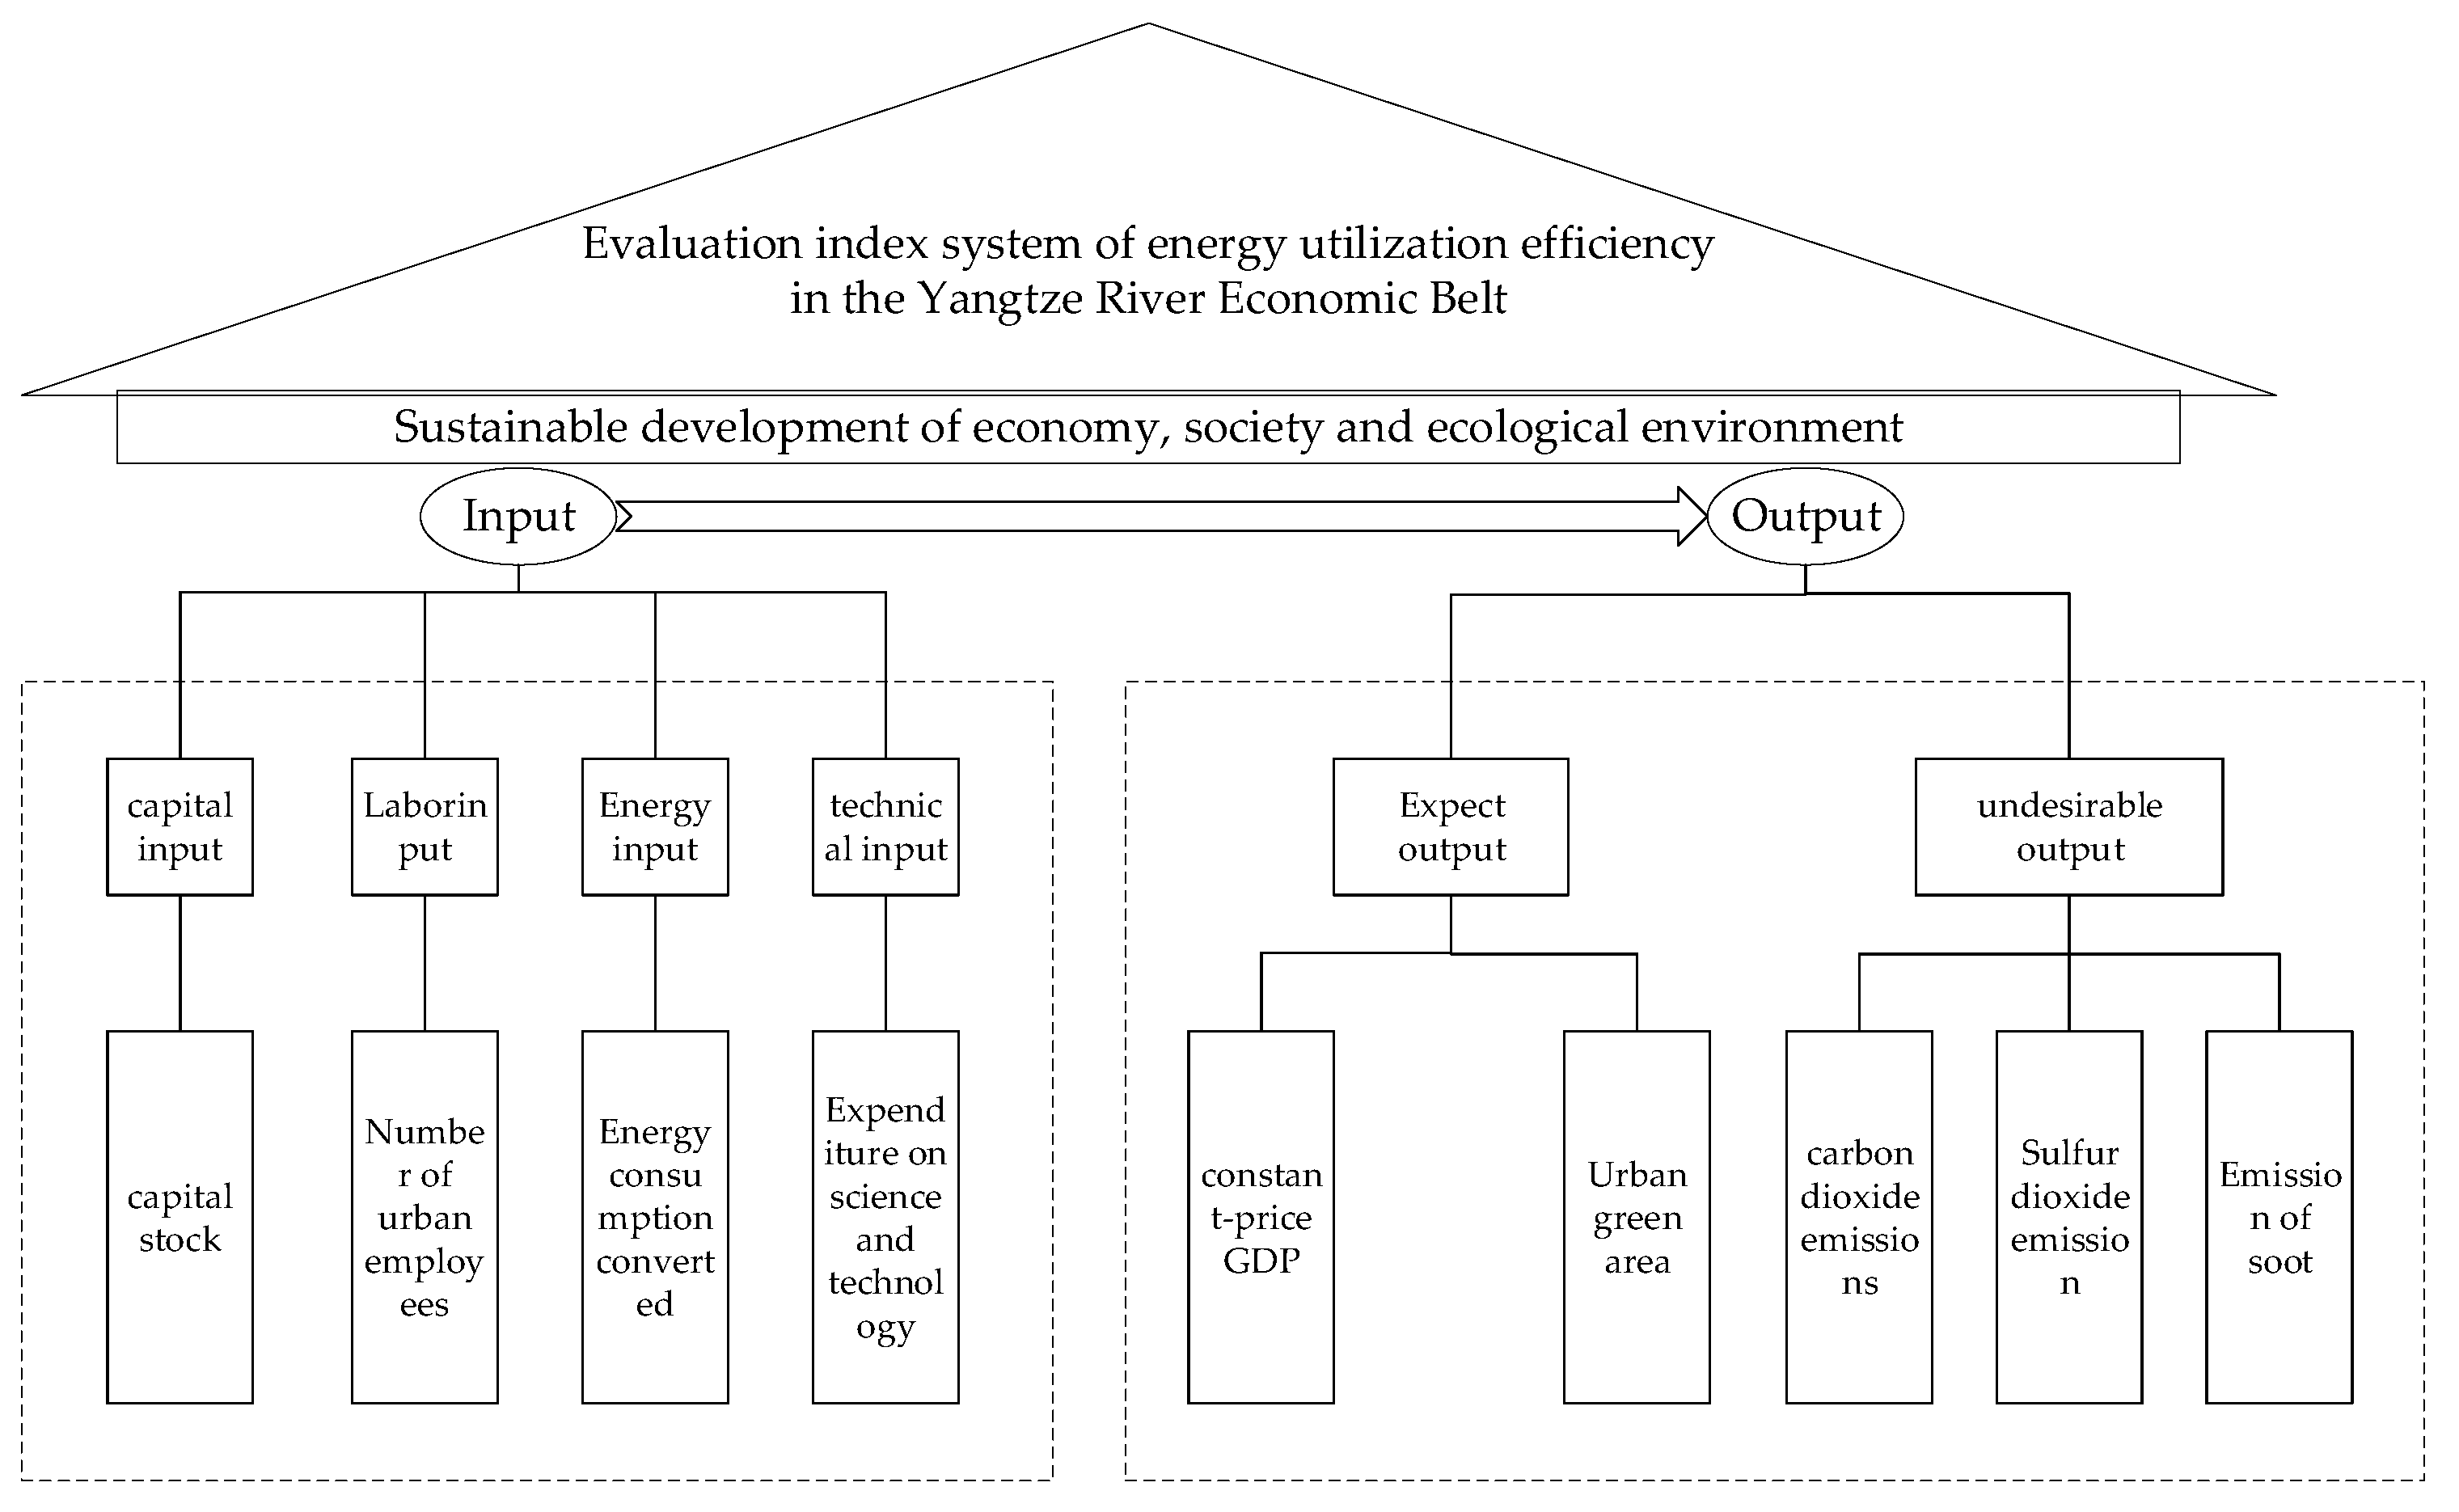
Through the comprehensive consideration of the index system in the existing efficiency evaluation literature, the authors found that most scholars choose to build the index system from aspects of capital, labor and energy, ignoring the scientific and technological investment in the rapid development of society. Concerning this phenomenon [
31,
32,
33,
34,
35], this paper finally uses the inputs of energy, capital, labor and technology as input variables, GDP at constant price and urban green area are used as expected outputs, and emissions of carbon dioxide, industrial sulfur dioxide and industrial soot are used as undesired outputs. The indicator system is constructed in
Figure 1. The specific description of the indicators is as follows:
3.1. The Input Variables
- (1)
Capital investment. In view of the fact that the actual capital investment data are not easy to obtain, the capital investment calculation in this paper adopts the current mainstream perpetual inventory method, and takes 2003 as the base period. The calculation formula is:
The capital stock in period
t − 1 and period
t are represented by
, respectively;
is the investment amount of fixed assets calculated at the price of the current year in year
t; and
δ is the depreciation rate of capital. This paper uses the calculation method of Zhang Jun [
36] to choose
δ = 9.6%
, where
is the investment in fixed assets in 2003, and
g is the average growth rate of new fixed assets in the whole society from 2003 to 2019.
- (2)
Energy input. This paper draws on the method of Li Zhi [
37] on the premise that the sum of electricity, gas fuel and liquefied petroleum gas consumed by the city accounts for the same proportion of the total urban energy consumption as the proportion at the provincial level. For estimation of urban energy consumption data and unified conversion, the unit is 10,000 tons of standard coal.
- (3)
Labor input. Strictly speaking, labor input should be measured according to the city’s effective labor time. Subject to the accuracy and availability of data, this paper selects the number of urban employees in the city as the input value of this variable.
- (4)
Technology investment. This is expressed as the scientific and technological expenditure in the local public financial revenue and expenditure (city-wide).
3.2. The Expected Outputs
- (1)
Constant-price GDP. This paper takes the regional GDP of 9 provincial capitals and 2 municipalities along the Yangtze River Economic Belt from 2003 to 2019 as one of the expected output indicators. Considering the impact of price factors, the constant-price GDP with the base period of 2003 is selected as the expected output.
- (2)
Urban green area. Since the 18th National Congress of the Communist Party of China, General Secretary Xi Jinping has repeatedly emphasized that invaluable assets are inferior to clear waters and lush mountains. He believes that economic development should not be at the expense of the environment, and especially pointed out that the development that conforms to the green ecological environment is sustainable and real development. Therefore, the urban green area is also included in the index system in this paper.
3.3. Unexpected Outputs
Carbon dioxide emissions, industrial sulfur dioxide emissions and industrial soot emissions are used as undesired output indicators, and the calculation of carbon dioxide emissions draws on the method of Wu Jianxin [
38]. It takes into account carbon dioxide emissions not only from direct energy consumption, such as gas and liquefied petroleum gas, but also from electricity, transportation and thermal energy consumption, which are added up to obtain the total carbon dioxide emissions of each city. Finally, referring to the method of Qiu Shilei [
39], the social willingness to pay is used as the weight (as shown in
Table 2) to fit the three undesired outputs into one environmental pollution emission index.
The above variable data are all from the China Statistical Yearbook, China Urban Statistical Yearbook, China Energy Statistical Yearbook, China Environment Statistical Yearbook and the urban statistical yearbooks of relevant cities. A small number of missing values were filled using the average growth rate complement method and mean interpolation method for supplementary correction.
The above energy consumption data are time-series data. The unit root test method is generally used for the stability analysis of time series. The basic idea is to find the characteristic root of the characteristic equation of the model by fitting the applicable model of the series. Assuming time-series model as a non-homogeneous linear difference equation, then the characteristic equation of homogeneous linear equation is .
Setting up
are
p characteristic roots of homogeneous linear equation
; therefore, the necessary and sufficient condition for a time-series model to be stable is that its
p characteristic roots
are all on the unit circle, which is equivalent to the roots of the autoregressive coefficient polynomial of the time-series model
all being outside the unit circle [
26]. Proof:
are
p characteristic roots of the homogeneous linear equation
. By substituting
into the characteristic equation, we can obtain a special solution of the non-homogeneous linear equation
:
The autocorrelation coefficient of the time series of energy efficiency of typical cities in the Yangtze River Economic Belt does not tend to zero quickly (for example, K = 1, K = 2 in the lag period), that is, it decreases slowly, indicating that the above original time-series data are stable.
5. Analysis of Influencing Factors of Energy Utilization Efficiency in the Yangtze River Economic Belt
5.1. Tobit Model
In this paper, the energy utilization efficiency of nine provincial capital cities and two municipalities directly under the central government in the Yangtze River Economic Belt is used as the explained variable, and the relevant factors affecting energy utilization efficiency are used as explanatory variables to construct a regression model. Since the energy utilization efficiency results obtained by the super-efficiency SBM calculation are truncated data, and when the explained variable is a limited value, the general linear regression method cannot describe the degree to which the explained variable is affected by the explanatory variable. In the general multiple linear regression method, the existence of the intercepted variable value will cause the analysis results to deviate from the actual situation. Through a large number of studies, scholars generally believe that the Tobit model has a natural advantage in solving the problem of efficiency distribution; the direction and the manner of efficiency improvement can be obtained from the regression results [
41,
42,
43]. Based on the above situation, this paper selects the Tobit model to test the data, in order to avoid the possible bad results of general linear regression.
The Tobit model uses the maximum likelihood estimation method to estimate the variable parameters. The model formula is as follows:
In this formula,
σ is the scale parameter,
β is the regression parameter vector,
∼
, in which the value of the explained variable is determined as follows:
In other words, when , the value of the explained variable is unrestricted actual observation. When , the value of the explained variable is restricted, and its value is intercepted as 0.
5.2. Variable Description and Data Source
The influencing factors of changes in urban energy utilization efficiency are very complex, and it is unrealistic to exhaust all the influencing factors. In view of the availability of data and with reference to existing research, we selected three existing research indicators: openness, industrial structure and environmental regulation. On this basis, this paper innovatively selects government dominance and Engel coefficient as two variable indicators of the economic development level. Therefore, this paper decides to determine the explanatory variables from the following five aspects:
Degree of opening to the outside world (Open): This paper selects the actual use of foreign investment as a measure. With the inflow of international investment, to a certain extent, a large number of industries with high energy consumption and high pollution have been transferred in. In fact, there are obvious differences in the level of economic development among the regions of the Yangtze River Economic Belt, and the impact of international investment on its industrial structure and innovation capability is also different. Therefore, it is reasonable to assume that the impact of international investment on energy efficiency is also different; the technology spillover effect produced by foreign capital has a certain impact on energy utilization efficiency [
44].
Industrial structure (Ind): This paper selects the proportion of the total output value of the secondary industry in GDP as a measure of this influencing factor. The secondary industry is the main consumer of energy in China. The difficulty in realizing the improvement of energy utilization efficiency lies in whether the secondary industry can realize the optimization and upgrading of the industrial structure. Theoretically, while the secondary industry drives economic growth, it will also lead to high pollution, high energy consumption and rapid resource consumption. Optimizing the industrial structure will promote the improvement of energy utilization efficiency in the Yangtze River Economic Belt [
45].
Government dominance (Gov): This paper selects the proportion of government fiscal expenditure in GDP as a measure to indicate the role of the government in the strategy of “Do not engage in large-scale development, and focus on large-scale protection” in the Yangtze River Economic Belt. The government’s appropriate intervention in the economy can play a guiding and regulating role. Under the concept of high-quality economic development, the “Great Protection” strategy of the Yangtze River Economic Belt is to guide the regional energy utilization efficiency through the government’s macro-control, continue to promote regional green and sustainable development and help to build a pioneering demonstration belt for China’s ecological civilization construction.
Environmental regulation (Envir): Here, we use the method of Ye Qin [
46] to obtain the urban environmental regulation index and use it as a measure. Generally speaking, the stronger the environmental regulation, the faster the upgrading of industries with high energy consumption, high pollution and low energy utilization efficiency. The improvement of environmental regulation can not only reduce the emission of pollutants from the source, but also greatly stimulate the innovation of energy-saving emission reduction technologies and production processes of enterprises, thereby promoting the improvement of energy utilization efficiency in the Yangtze River Economic Belt.
Economic development level (Econ): The Engel coefficient of urban households is selected as a measure. The level of economic development is the material basis for technological innovation in urban energy conservation, emission reduction and the improvement of energy efficiency. A large number of studies have shown that there is a correlation between regional energy utilization efficiency and economic level. For this reason, the level of economic development is considered to be included in the influencing factor variables for exploration.
On the basis of the above analysis, descriptive statistics of the variables (as shown in
Table 6) were conducted, and the following econometric model was constructed:
Among them, YEE is the total factor energy utilization efficiency, C is the constant term and μ is the residual term.
Among the indicators selected above, except for the actual use of foreign investment and the Engel coefficient of urban households, which are from the statistical yearbooks of various cities, the rest of the data are taken from the “China Statistical Yearbook”. Due to the small value of energy utilization efficiency and the inconsistency of the original data dimensions, this paper chooses to take the logarithm of the actual use of foreign investment data for analysis, and other data are indices or proportions and are not processed.
5.3. Analysis of Regression Results
In this paper, the random effect model is used for calculation, and the regression results of the model are shown in
Table 7.
The regression results from the above table show that:
Degree of opening to the outside world (Open): The regression result is that for every 1% increase in the scale of foreign investment, the energy utilization efficiency will decrease by 0.058 percentage points. At present, the lower reaches of the Yangtze River Economic Belt are the main areas for utilizing FDI. However, the industrialization of the Yangtze River Delta region has basically been completed, and the level of science and technology is in a leading position in the world. Foreign investment is only used to maintain stable economic operation. It does not improve, and even hinders the improvement of, energy efficiency. The middle and upper reaches are not sufficiently open to the outside world; their ability to attract foreign capital is not strong, and the industrial structure and project quality of the foreign capital introduced need to be improved. This is the root cause of the significantly negative opening degree and energy utilization efficiency of the Yangtze River Economic Belt.
Industrial structure (Ind): From the regression results, the higher the proportion of the secondary industry in GDP, the more significant the energy utilization efficiency. From a spatial point of view, the Yangtze River Economic Belt is a long and narrow belt-like area. The industrial correlation between the nine provincial capitals and two municipalities is weak, and it is impossible to form advantageous industrial clusters and difficult to form an effective extension of the industrial chain. Therefore, increasing the proportion of the secondary industry in the Yangtze River Economic Belt makes up for this deficiency to a certain extent, which in turn has a certain role in improving energy efficiency.
Government dominance (Gov): The government’s intervention in the Yangtze River Economic Belt has a positive effect on the improvement of energy efficiency. So far, the central government has issued a series of strategic measures for the high-quality development of the Yangtze River Economic Belt. Construction along the Yangtze River has pointed out the direction and promoted the vigorous development of the economic level and energy efficiency of the Yangtze River Economic Belt. To a certain extent, government intervention can stimulate the beneficial effect of resource endowment on energy efficiency and play a positive role in promoting energy efficiency.
Environmental regulation (Envir): The urban environmental regulation index is positively correlated with energy utilization efficiency, but the regression result is not significant. The authors believe that environmental regulation has inhibited the development of enterprises with low energy utilization efficiency in the Yangtze River Economic Belt to a certain extent, and accelerated the elimination high-polluting, high-energy-consumption and low-output enterprises. Therefore, it has a positive effect on the improvement of energy utilization efficiency.
Level of economic development (Econ): The regression results show that the linear coefficient of the Engel coefficient is significantly positive, and its quadratic coefficient is significantly negative, which means that there is a relationship between the level of economic development and energy utilization efficiency. The inverted “U”-shaped relationship that promotes first and then inhibits [
47] shows that with the continuous improvement of the level of economic development, the energy utilization efficiency of the Yangtze River Economic Belt presents a trend of first increase and then decrease.
5.4. Policy Recommendations
Based on the above conclusions, this paper puts forward the following policy suggestions on how to improve the energy utilization efficiency of the Yangtze River Economic Belt:
Continue to expand reform and opening up, and coordinate and optimize the quality of opening up. In terms of opening to the outside world, attention should be paid to improving the quality of foreign investment. While the Yangtze River Economic Belt continues to expand its opening to the outside world, it actively improves the access system for foreign-funded enterprises and strictly controls the access threshold.
Optimize the regional industrial structure and promote development according to local conditions. In terms of industrial structure, we should actively promote the transformation and upgrading of the country’s traditional industries, actively promote the high-end, green and intelligent development of the secondary industry, vigorously develop emerging industries, accelerate the deep integration of traditional manufacturing and Internet technology and further promote regional industries to achieve faster and better development.
Optimize the top-level design of policies and speed up the transformation of government functions. When choosing government intervention methods, regional governments should consider the far-reaching impact of their policies on regional energy efficiency from multiple perspectives, and select more reasonable government intervention methods in a targeted manner. Invest in scientific research on energy-saving and efficiency-enhancing technologies, introduce energy-saving and efficiency-enhancing service-oriented industries and increase the enthusiasm of enterprises for energy-saving and efficiency improvement.
Contribute to the construction of ecological civilization and promote the development of energy efficiency and high quality. Accelerate the iterative transformation of industries with high energy consumption, low energy efficiency and high pollution; promote the rapid implementation of scientific research results related to energy conservation and efficiency improvement; and further promote the improvement of energy utilization efficiency in the Yangtze River Economic Belt.


