
Effects of Vehicle Air Temperature on Drivers’ Cognitive Abilities Based on EEG
Abstract
:1. Introduction
- To explore how the vehicle air temperature influences the driver’s cognitive abilities, EEG features, vigilance, and thermal comfort;
- To investigate the changing pattern in the driver’s EEG under vehicle air temperature;
- To study the potential explanatory mechanisms of changes in cognitive abilities underlying the vehicle air temperature and practical contribution.
2. Methodologies
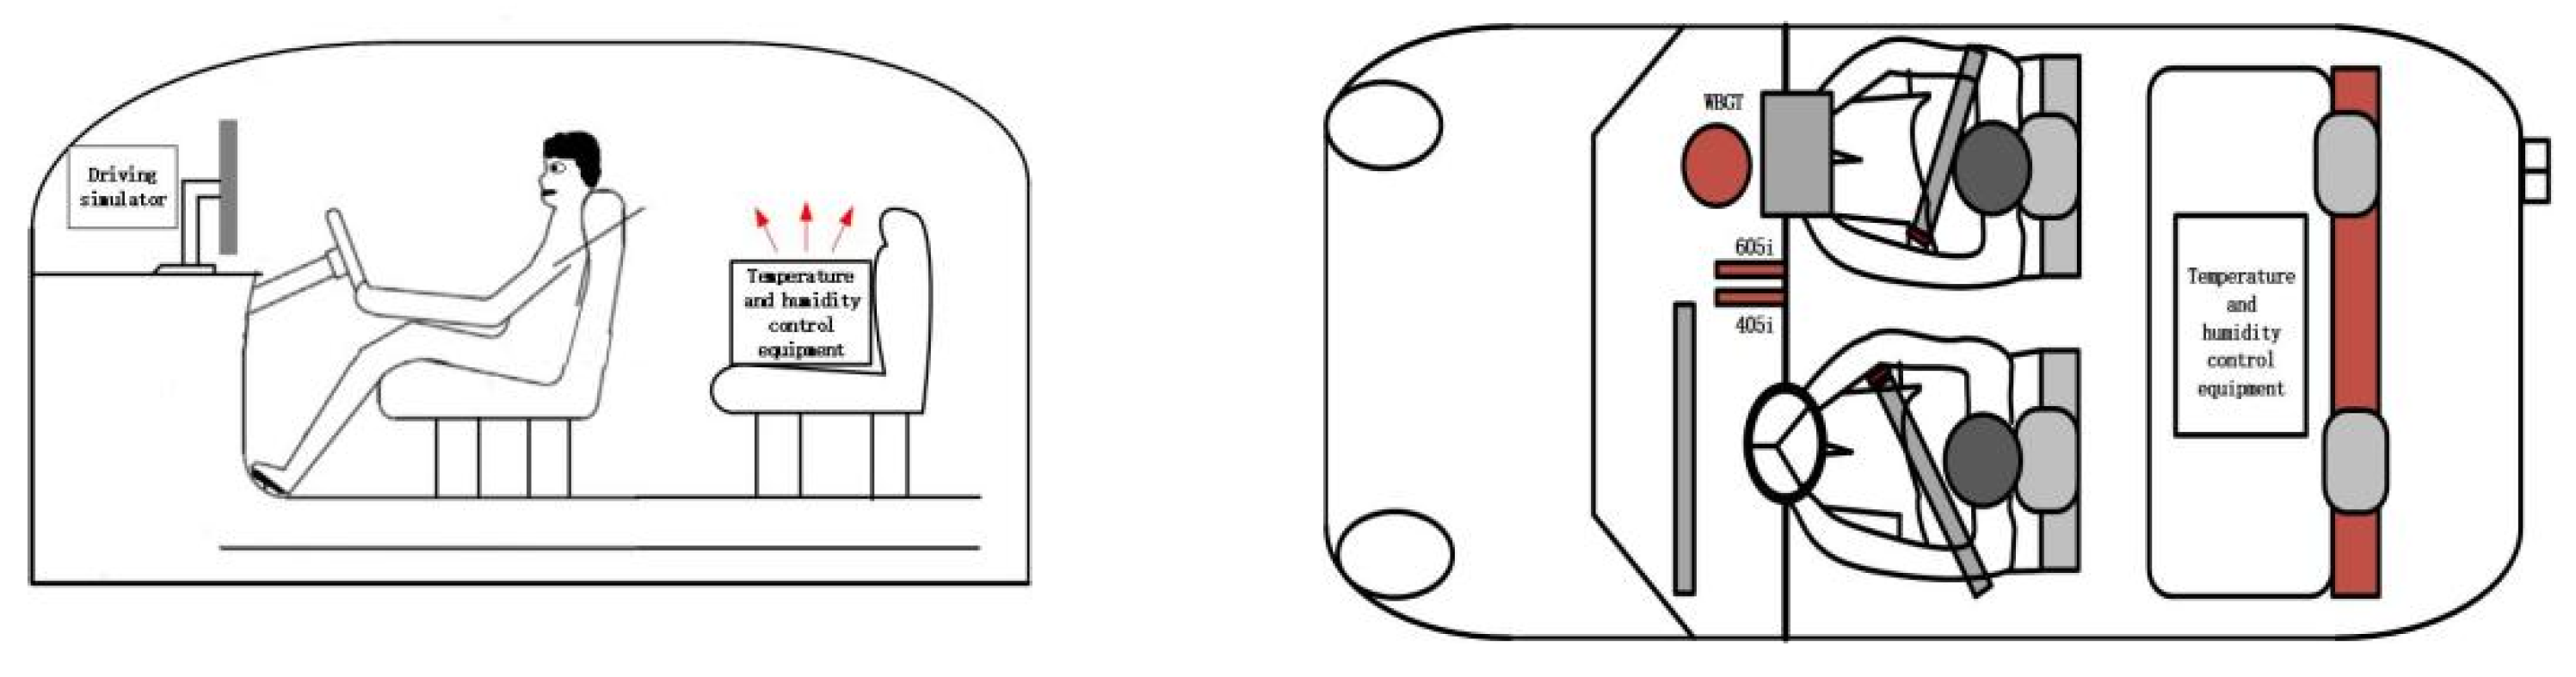
2.1. Experimental Facilities and Conditions
2.2. Measurement and Instruments
2.3. Participants
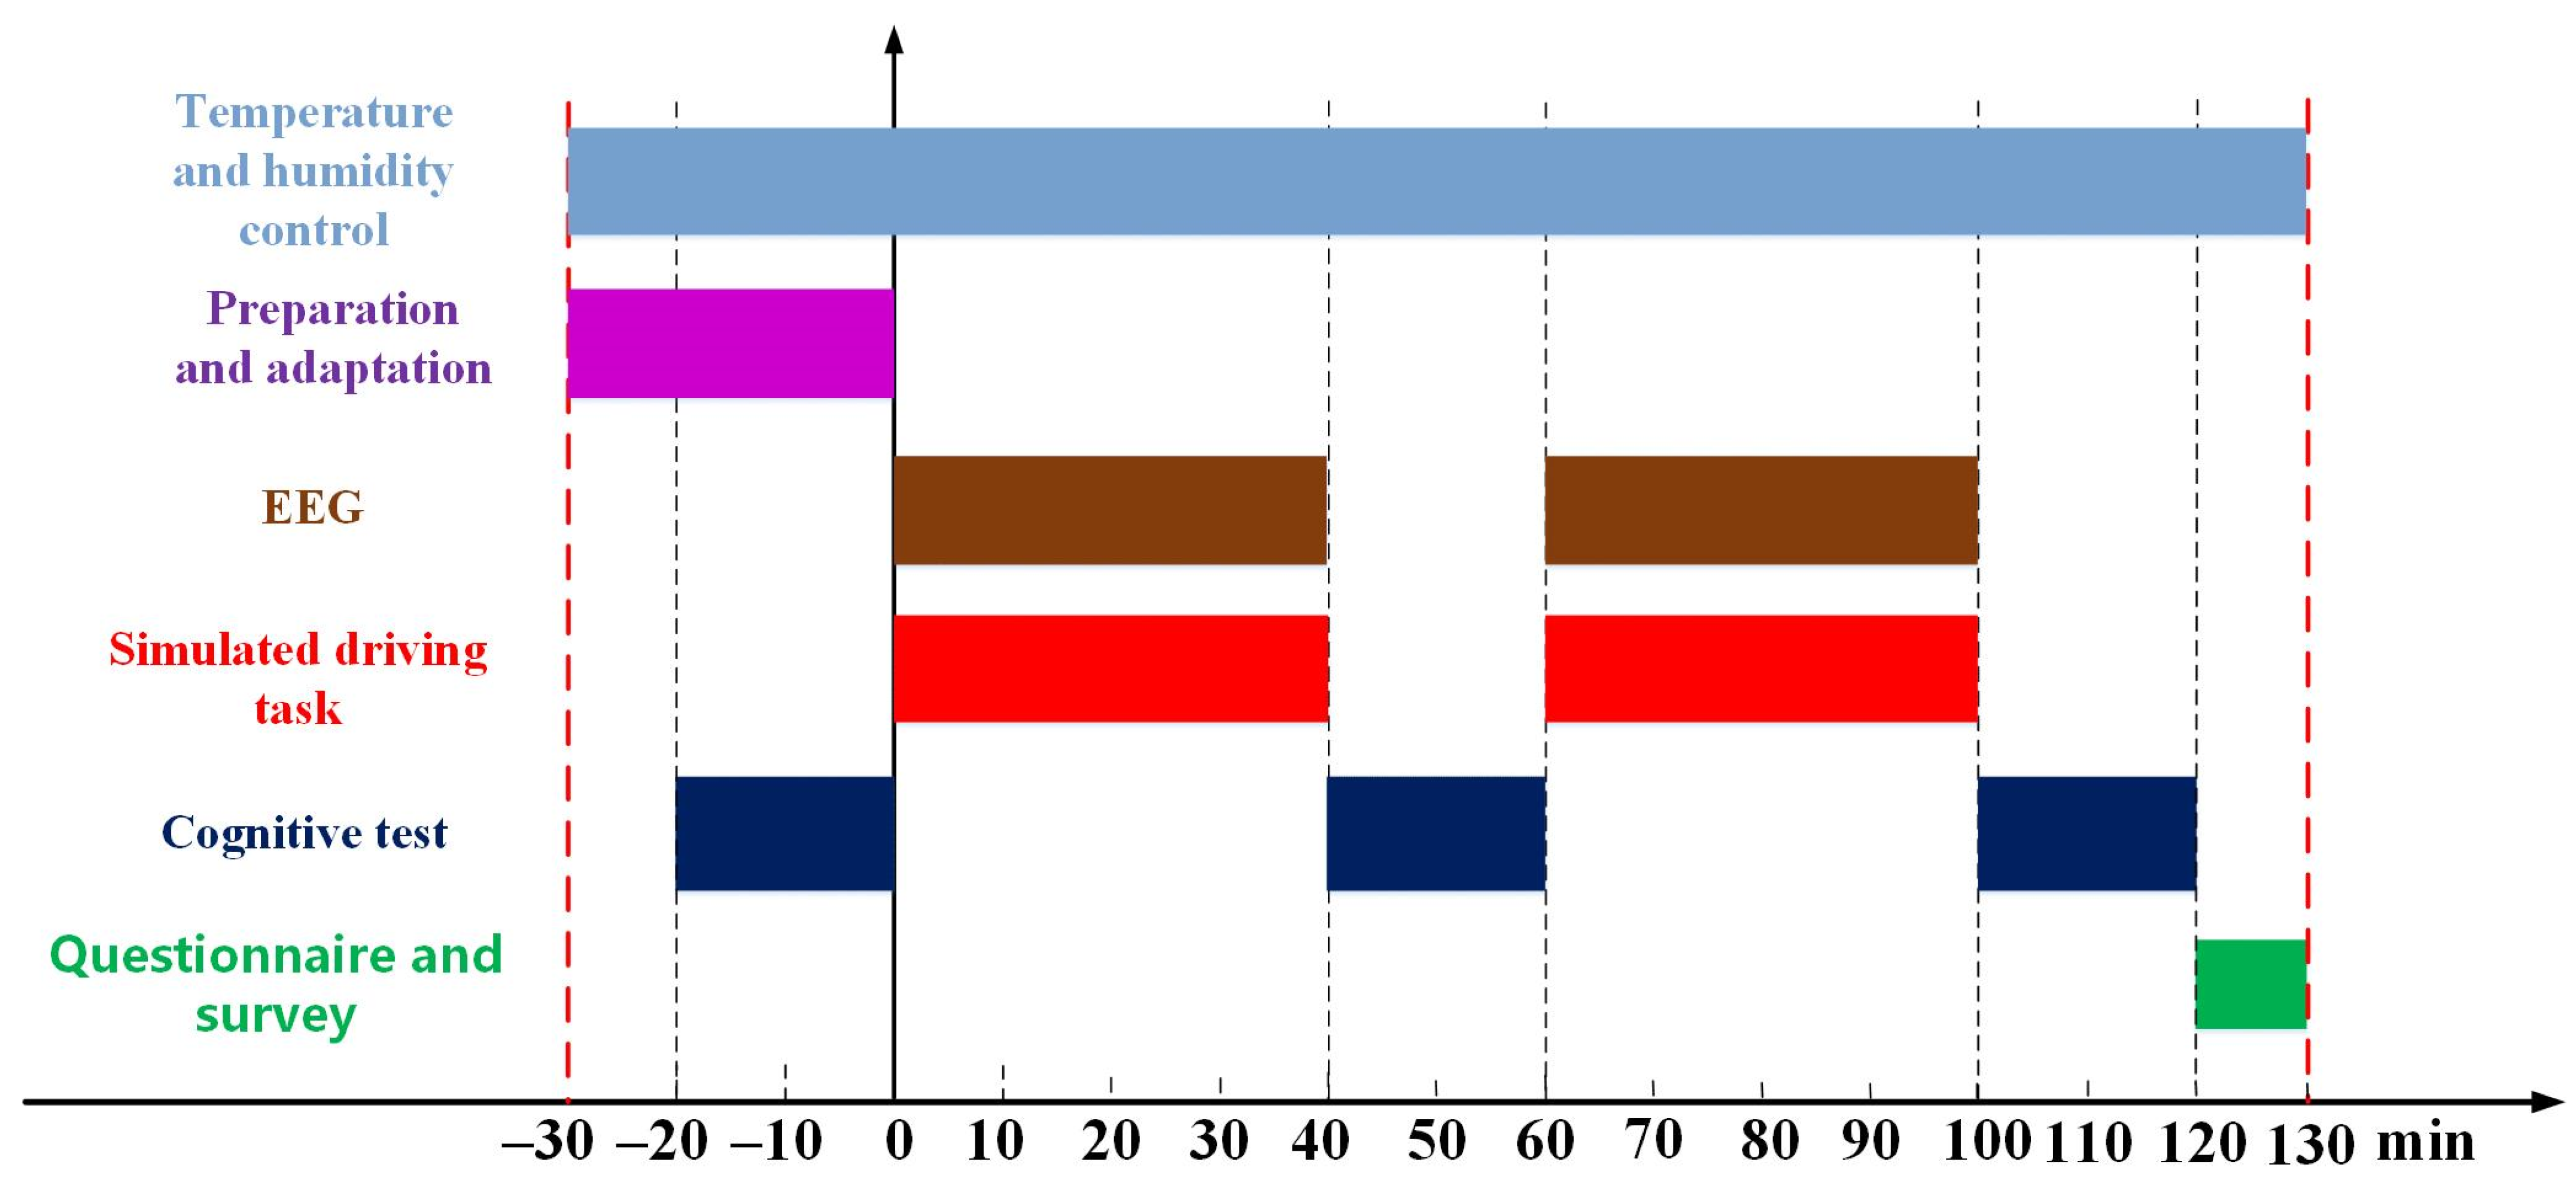
2.4. Experimental Protocol
2.5. Subjective Questionnaire
2.6. Cognitive Ability Test
2.7. Data Processing Method
2.8. EEG Features
2.8.1. Power Spectrum Features
2.8.2. Vigilance and Arousal
2.8.3. Frontal EEG Asymmetry
3. Results
3.1. EEG Features Calculation
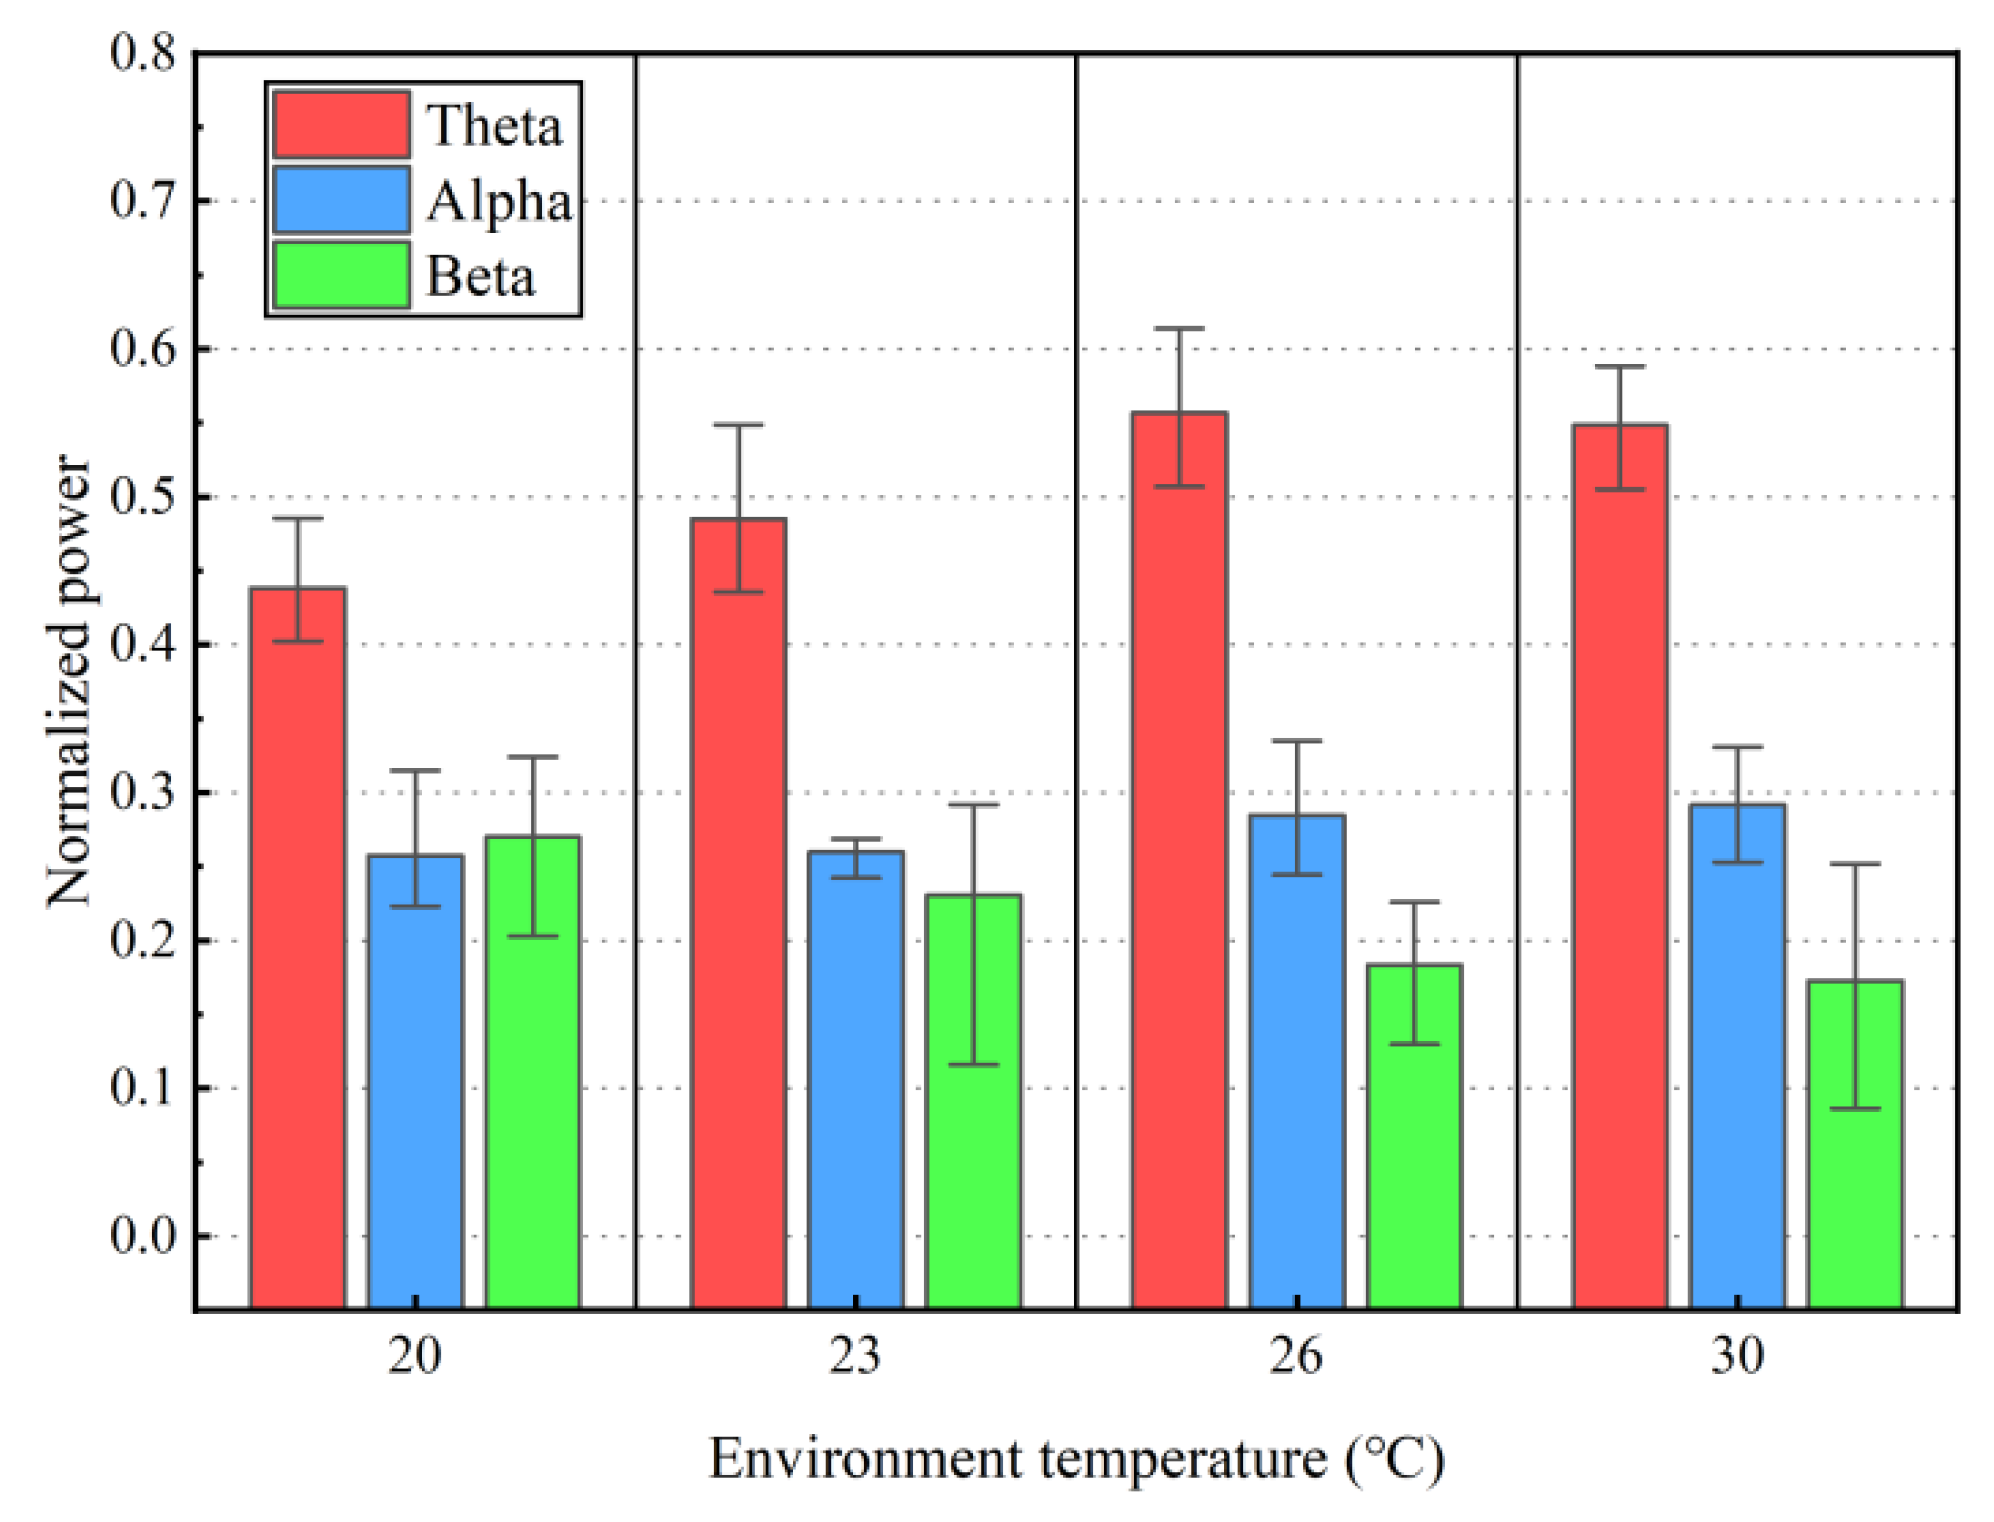
3.1.1. Normalized Power
3.1.2. Alertness Level
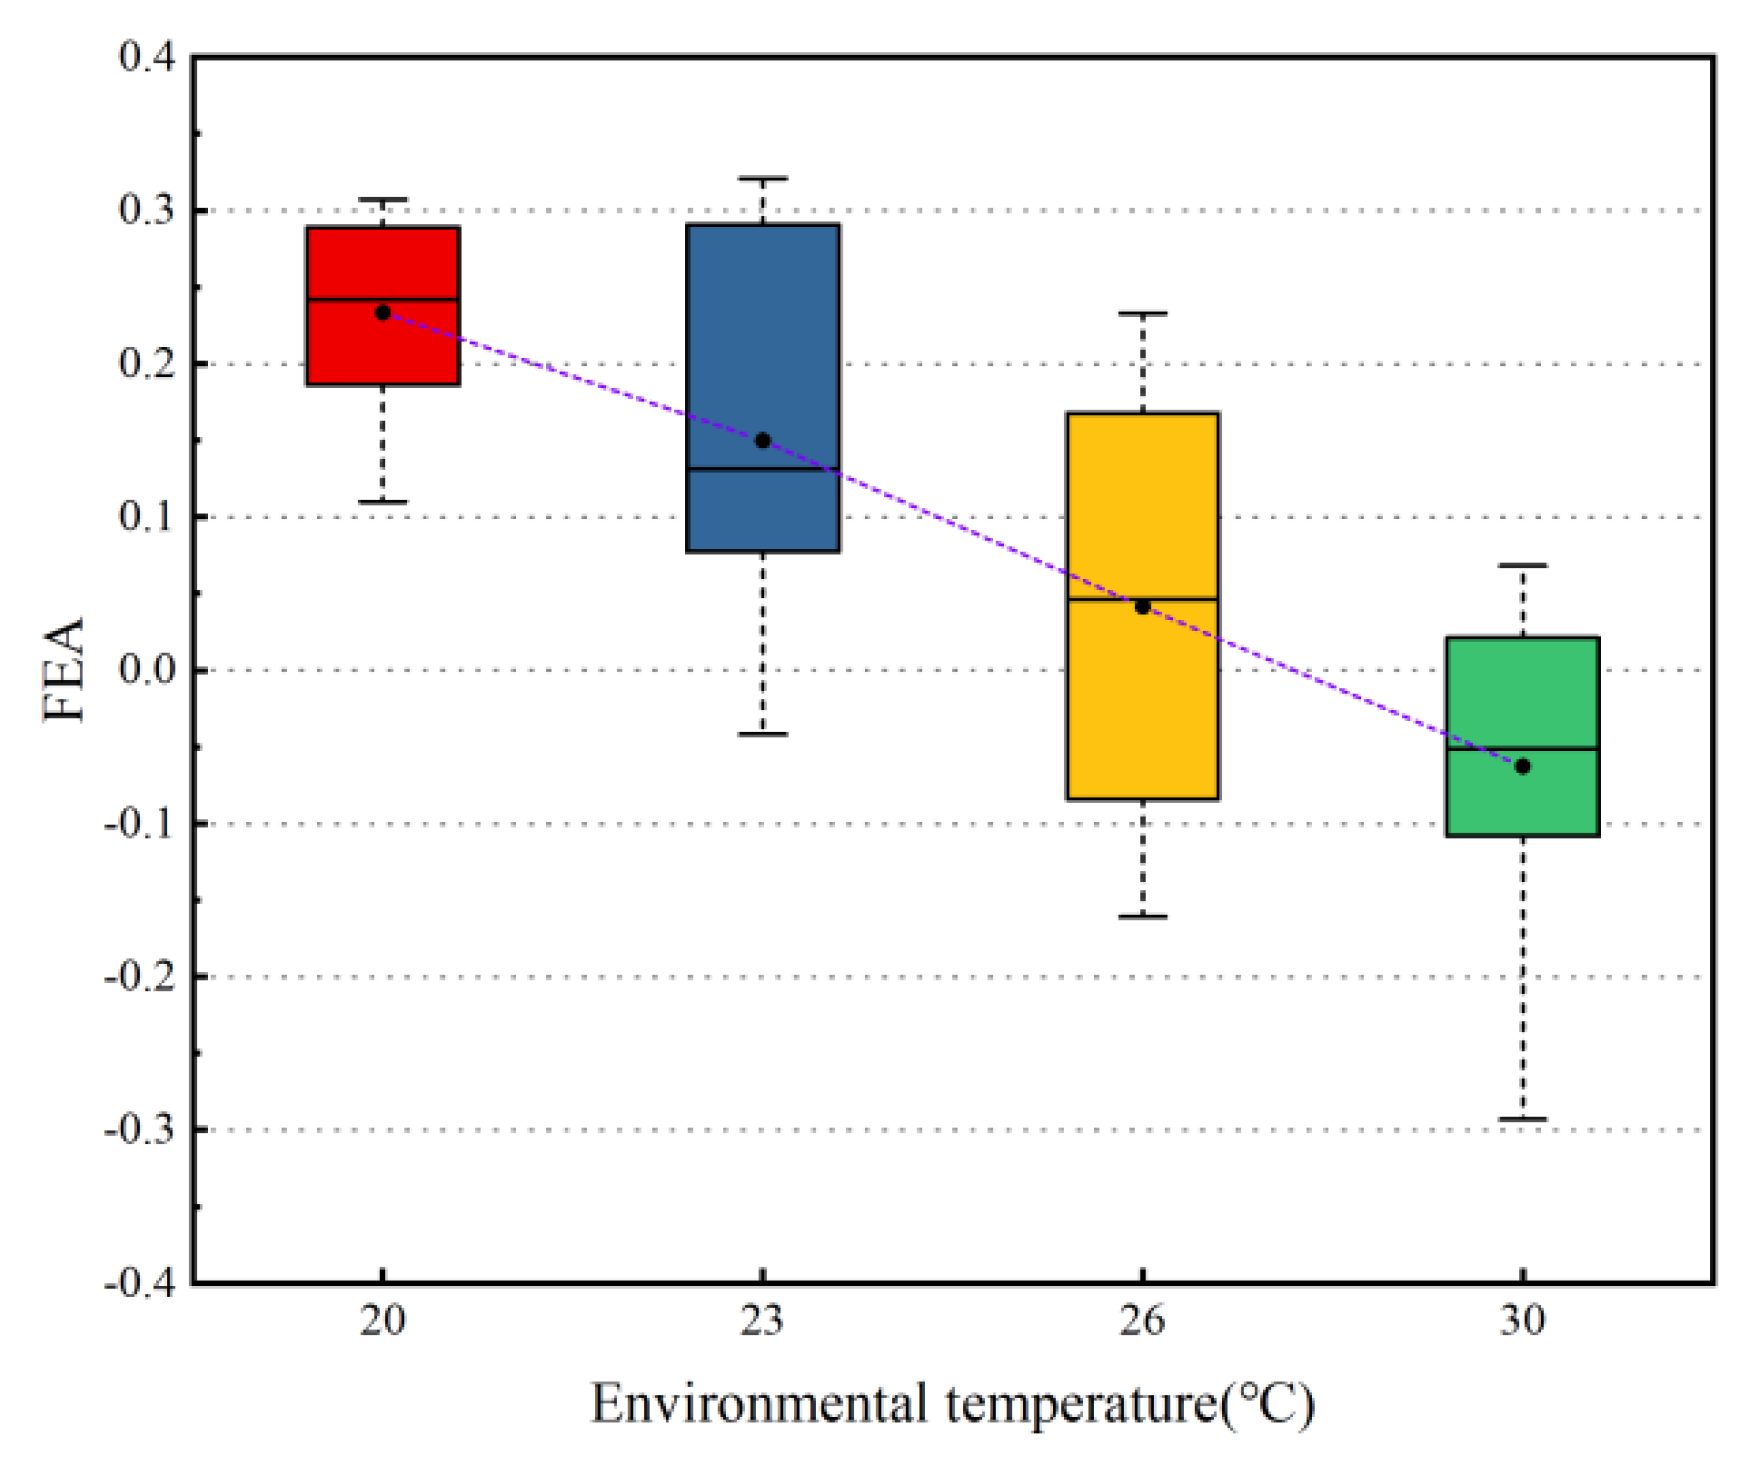
3.1.3. Frontal EEG Asymmetry
3.1.4. EEG Wavelet Entropy
3.2. Cognitive Outcomes
3.3. Subjective Questionnaire
4. Discussion
4.1. Correlation Analysis
4.2. Correlation Analysis between EEG and TSV
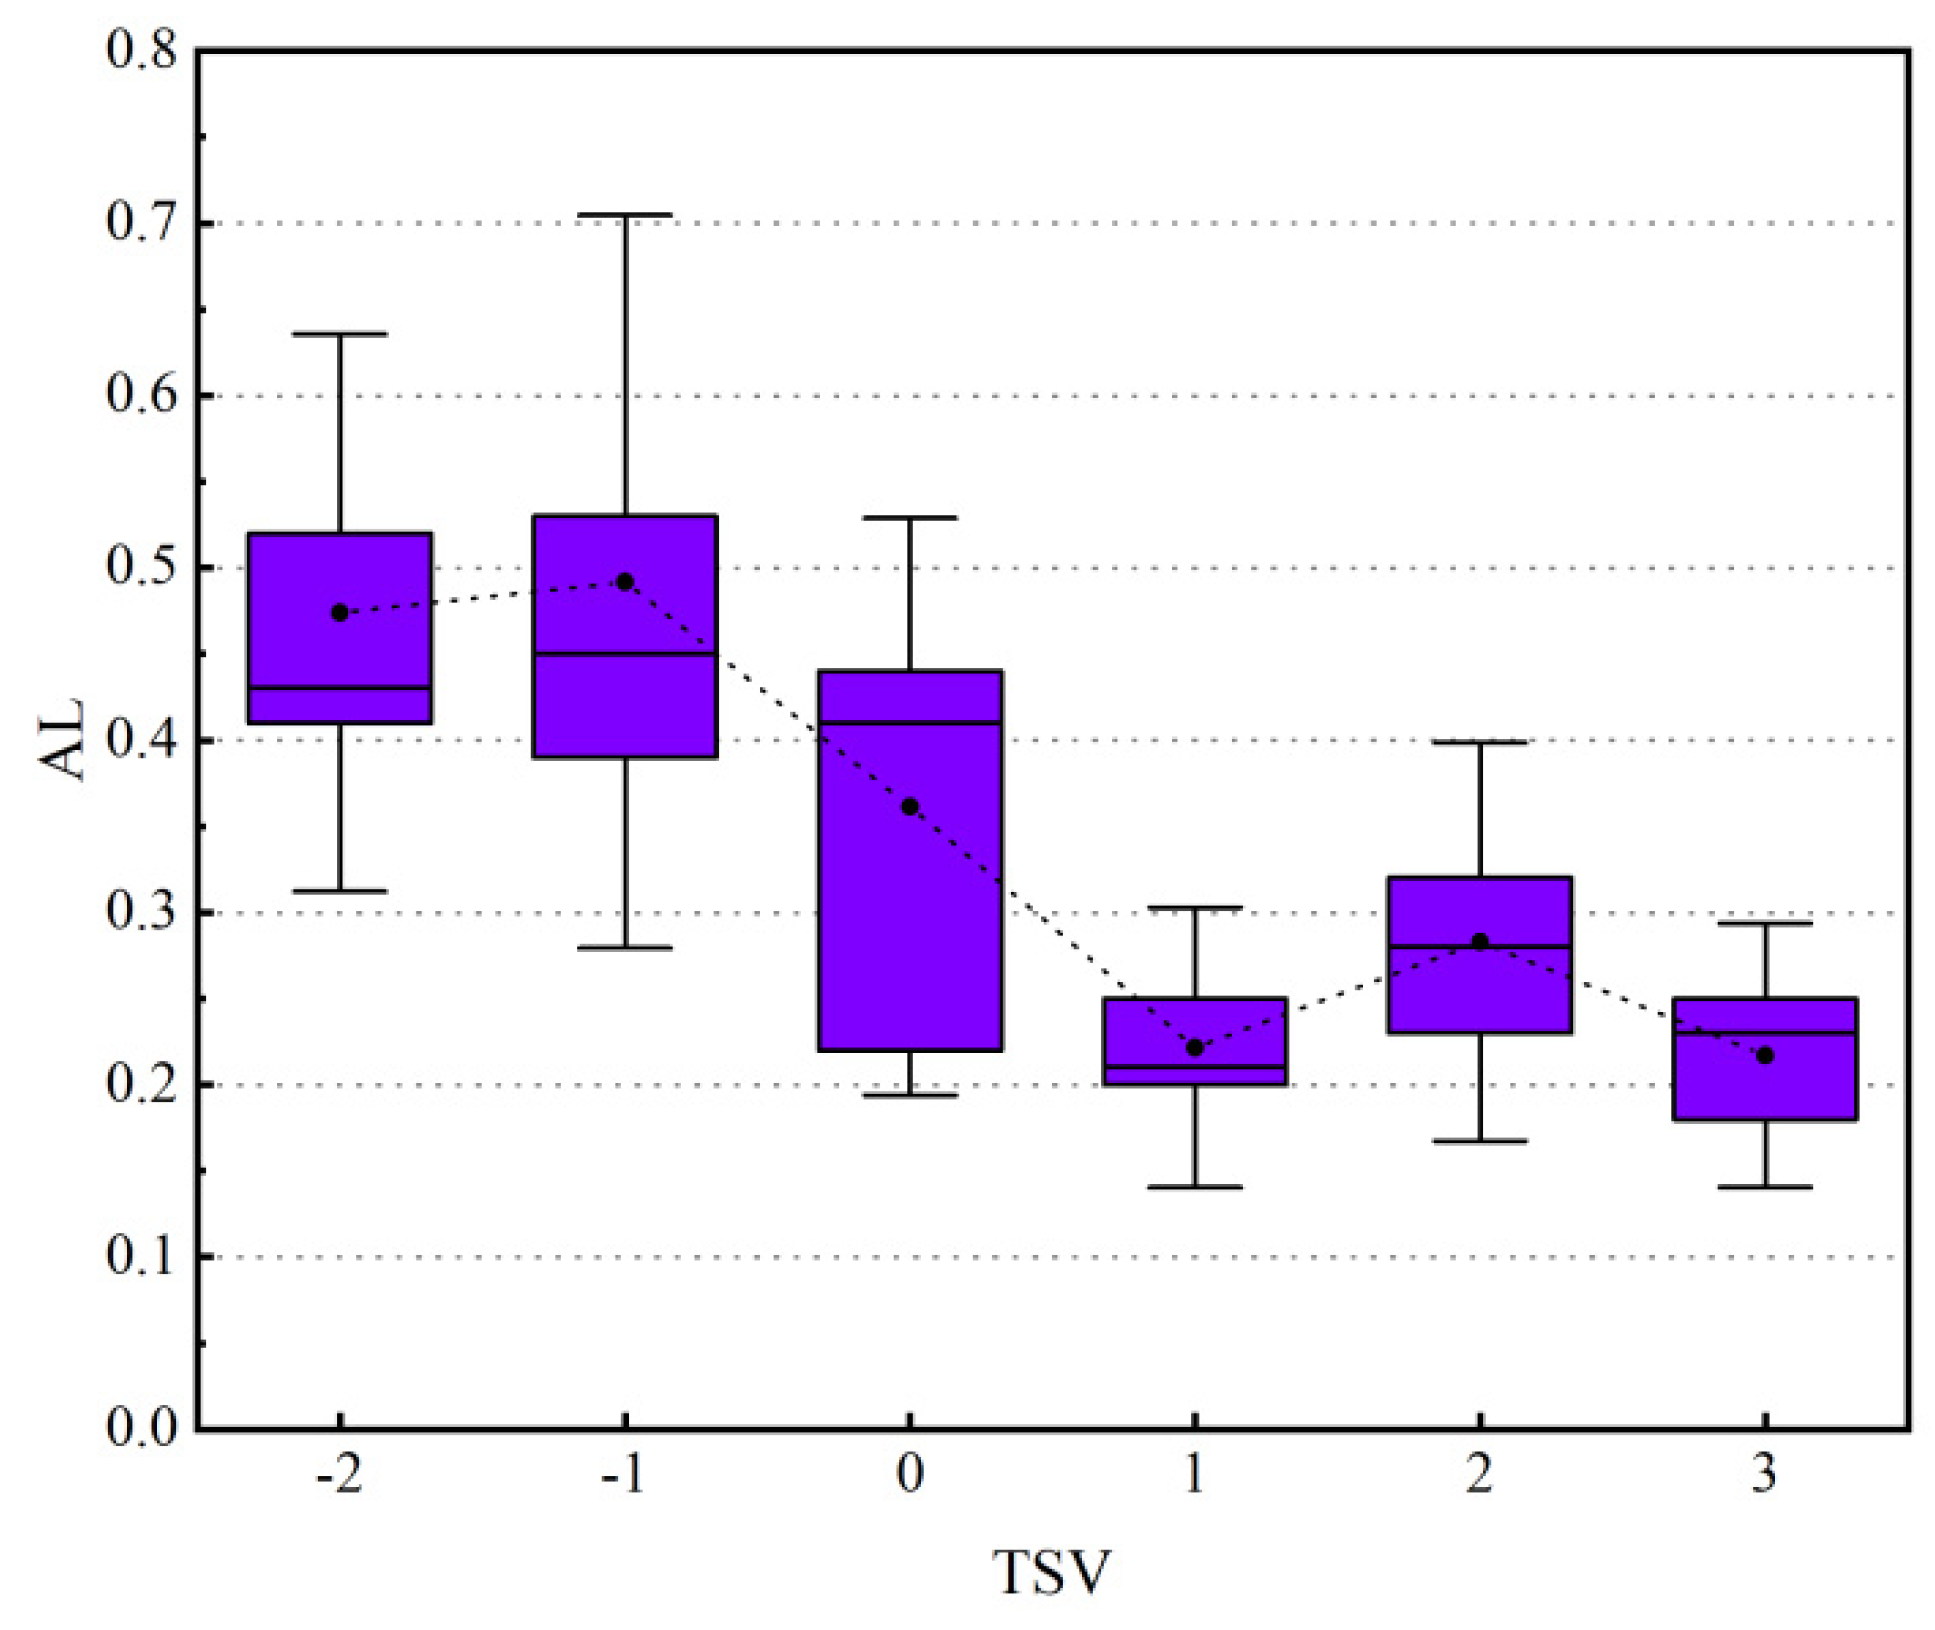
4.2.1. Correlation Analysis between AL and TSV
4.2.2. Correlation Analysis between EEG Wavelet Entropy and TSV
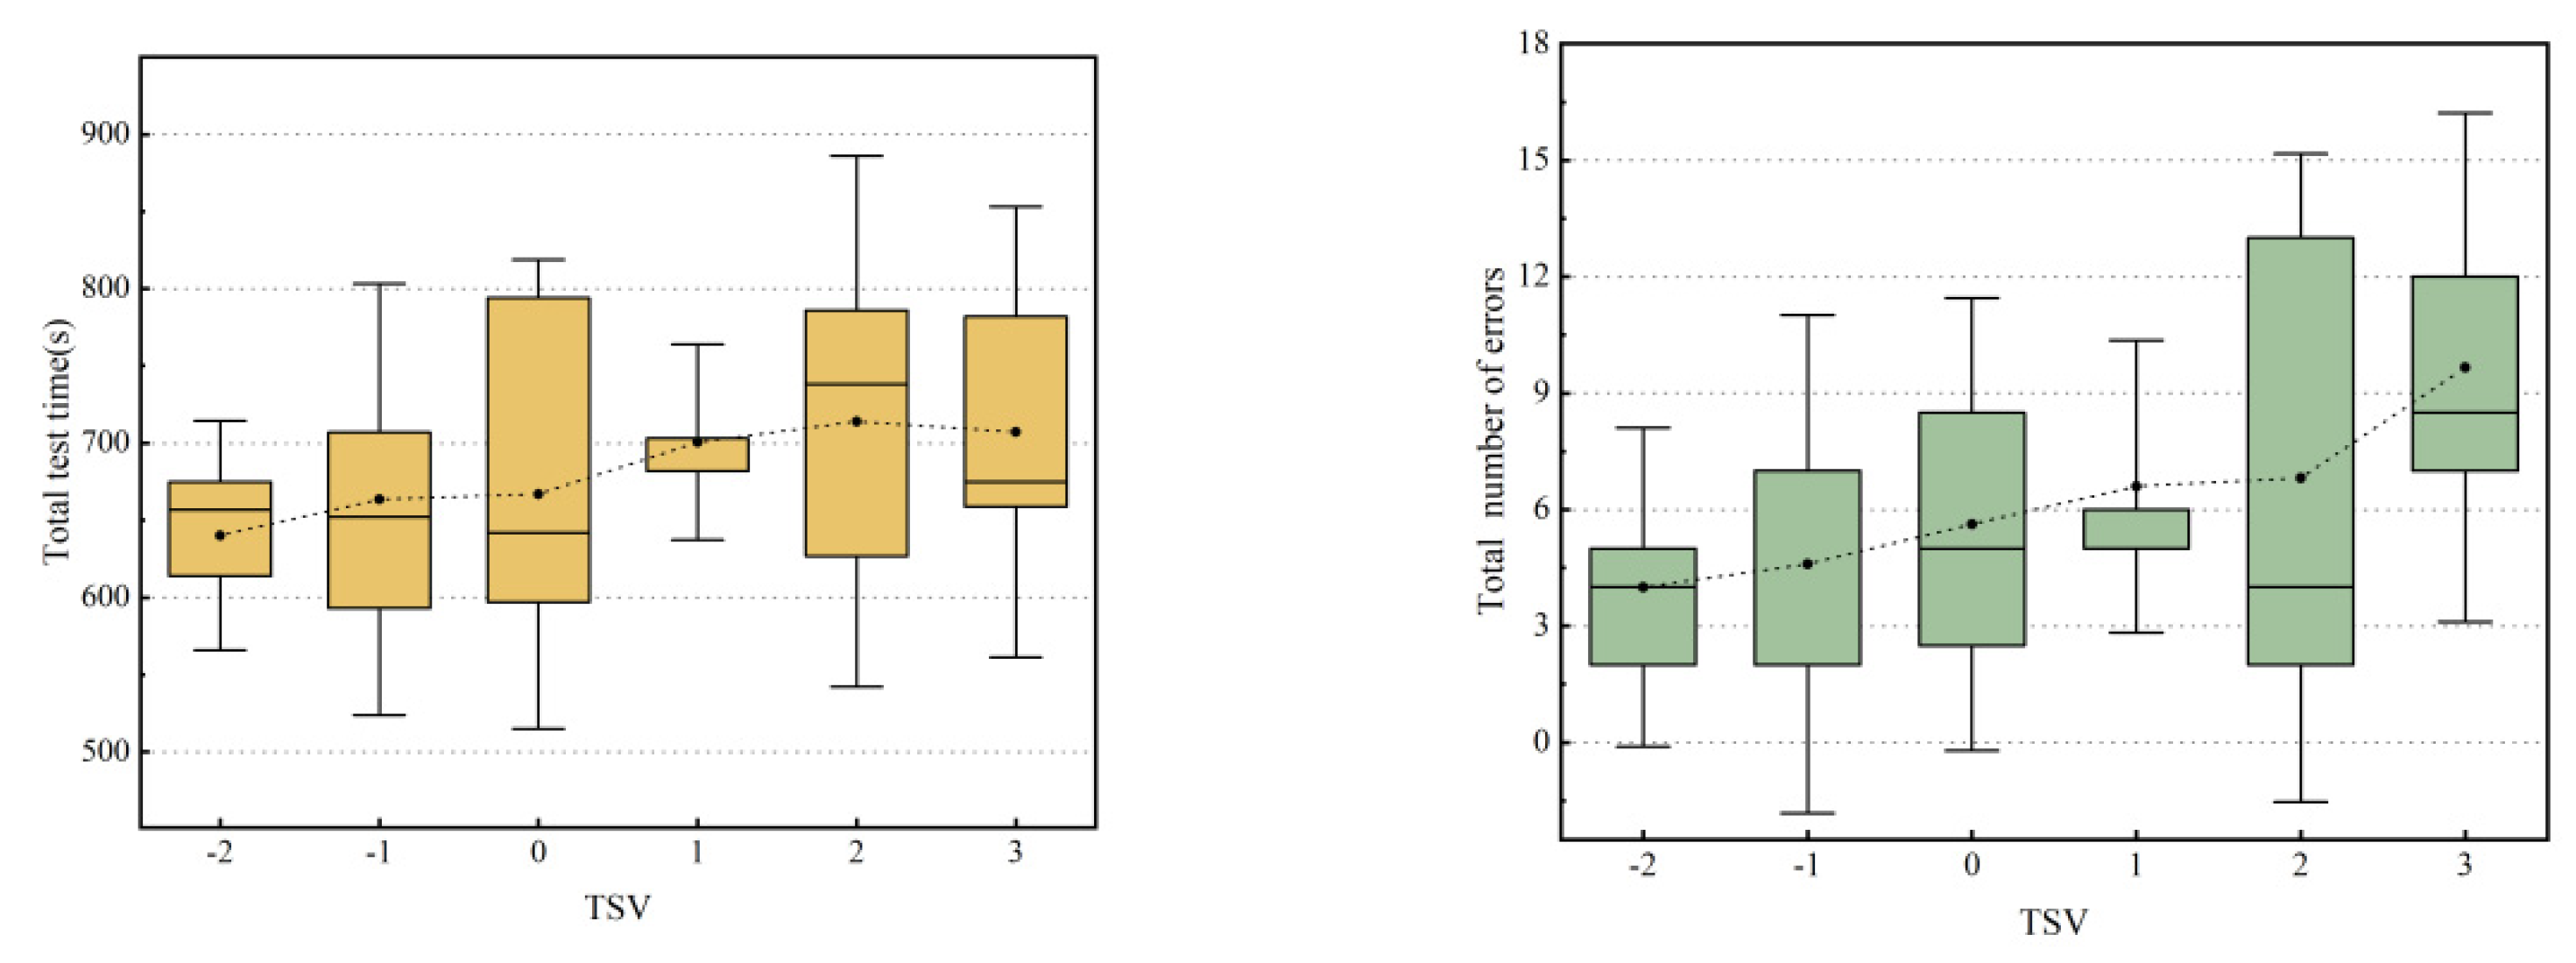
4.3. Correlation Analysis between Cognitive Ability and TSV
5. Limitations and Future Work
6. Conclusions
- Lower vehicle interior temperatures increase driver alertness and arousal. As the ambient temperature rose, the normalized power of θ activity and α activity increased, and the vigilance and frontal EEG asymmetry declined. At 20 °C, the β and α wave components of the EEG signal strengthened, and the level of alertness (AL) and frontal EEG asymmetry (FEA) elevated. At 23 °C, the wavelet entropy values of the two segments before and after the experiment were the largest, and the wavelet entropy difference was also the greatest.
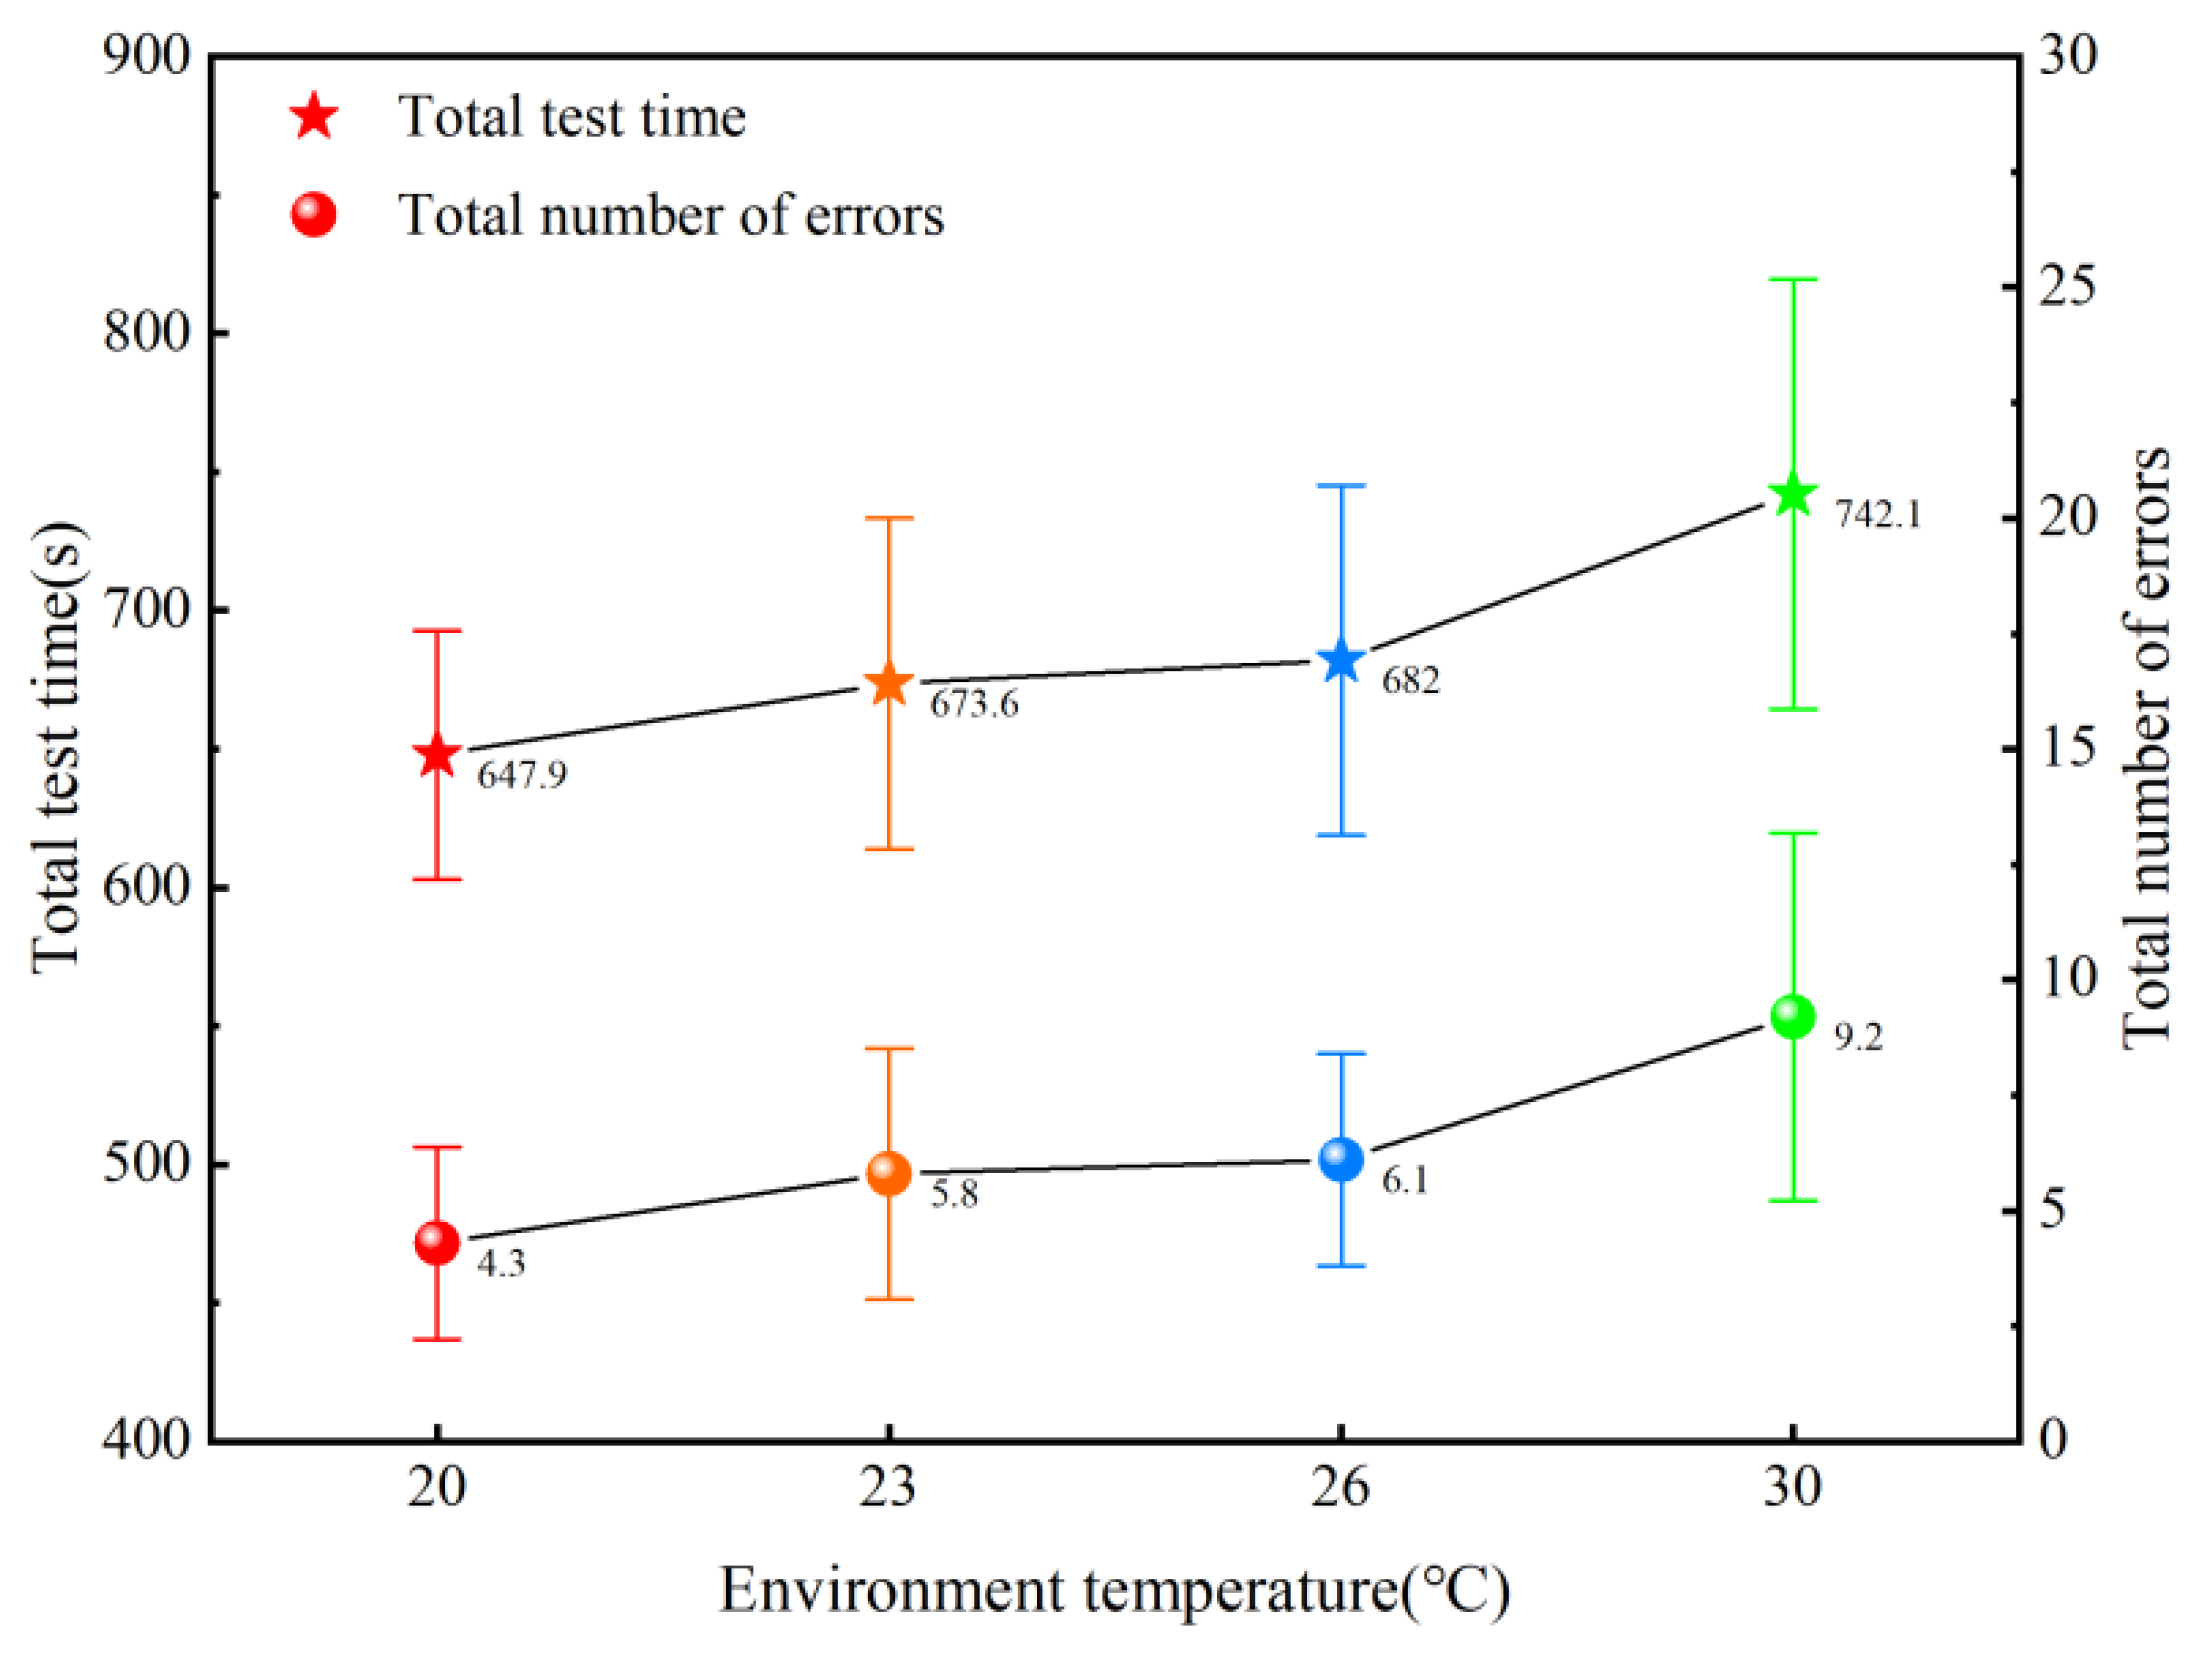
- The drivers’ cognitive test time and the number of errors increased, while their cognitive ability decreased with the rising of ambient temperature. At 20 °C, the driver could maintain a high level of cognitive ability, and at 23 °C, the subjective thermal comfort of the driver was optimal. Therefore, to achieve high cognitive performance and thermal comfort, the vehicle’s ambient temperature should be maintained in the range of 20–23 °C.
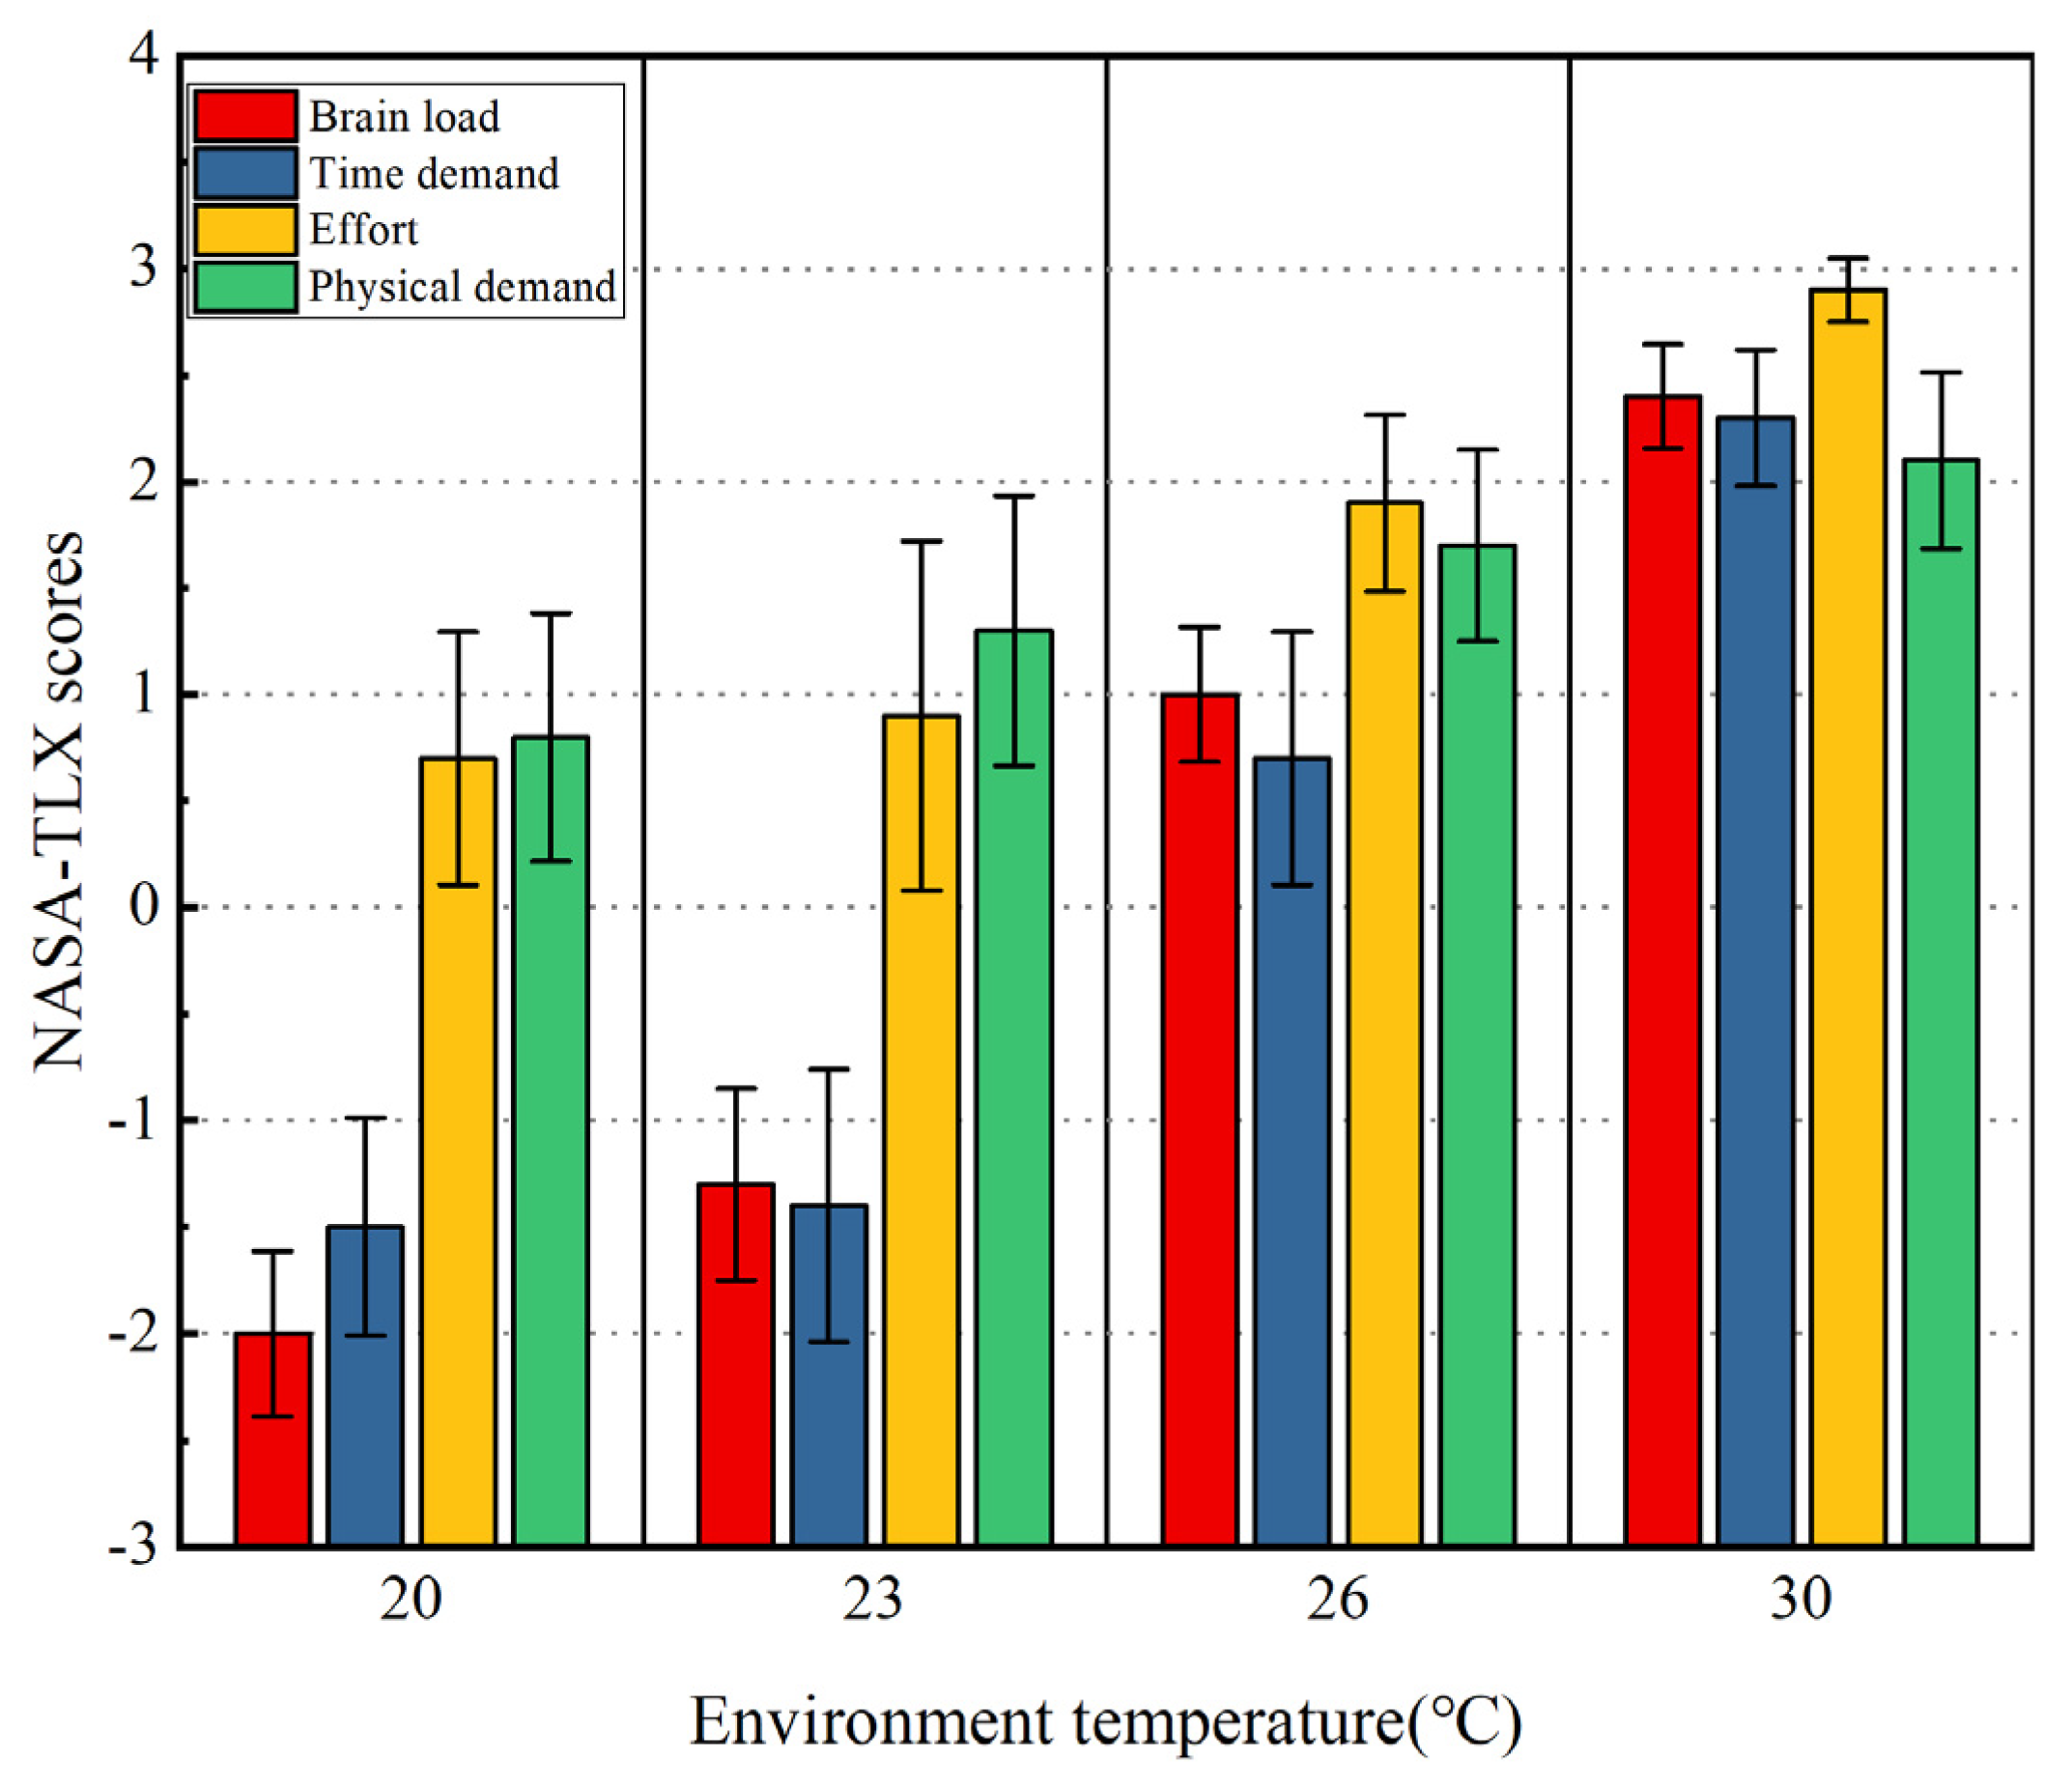
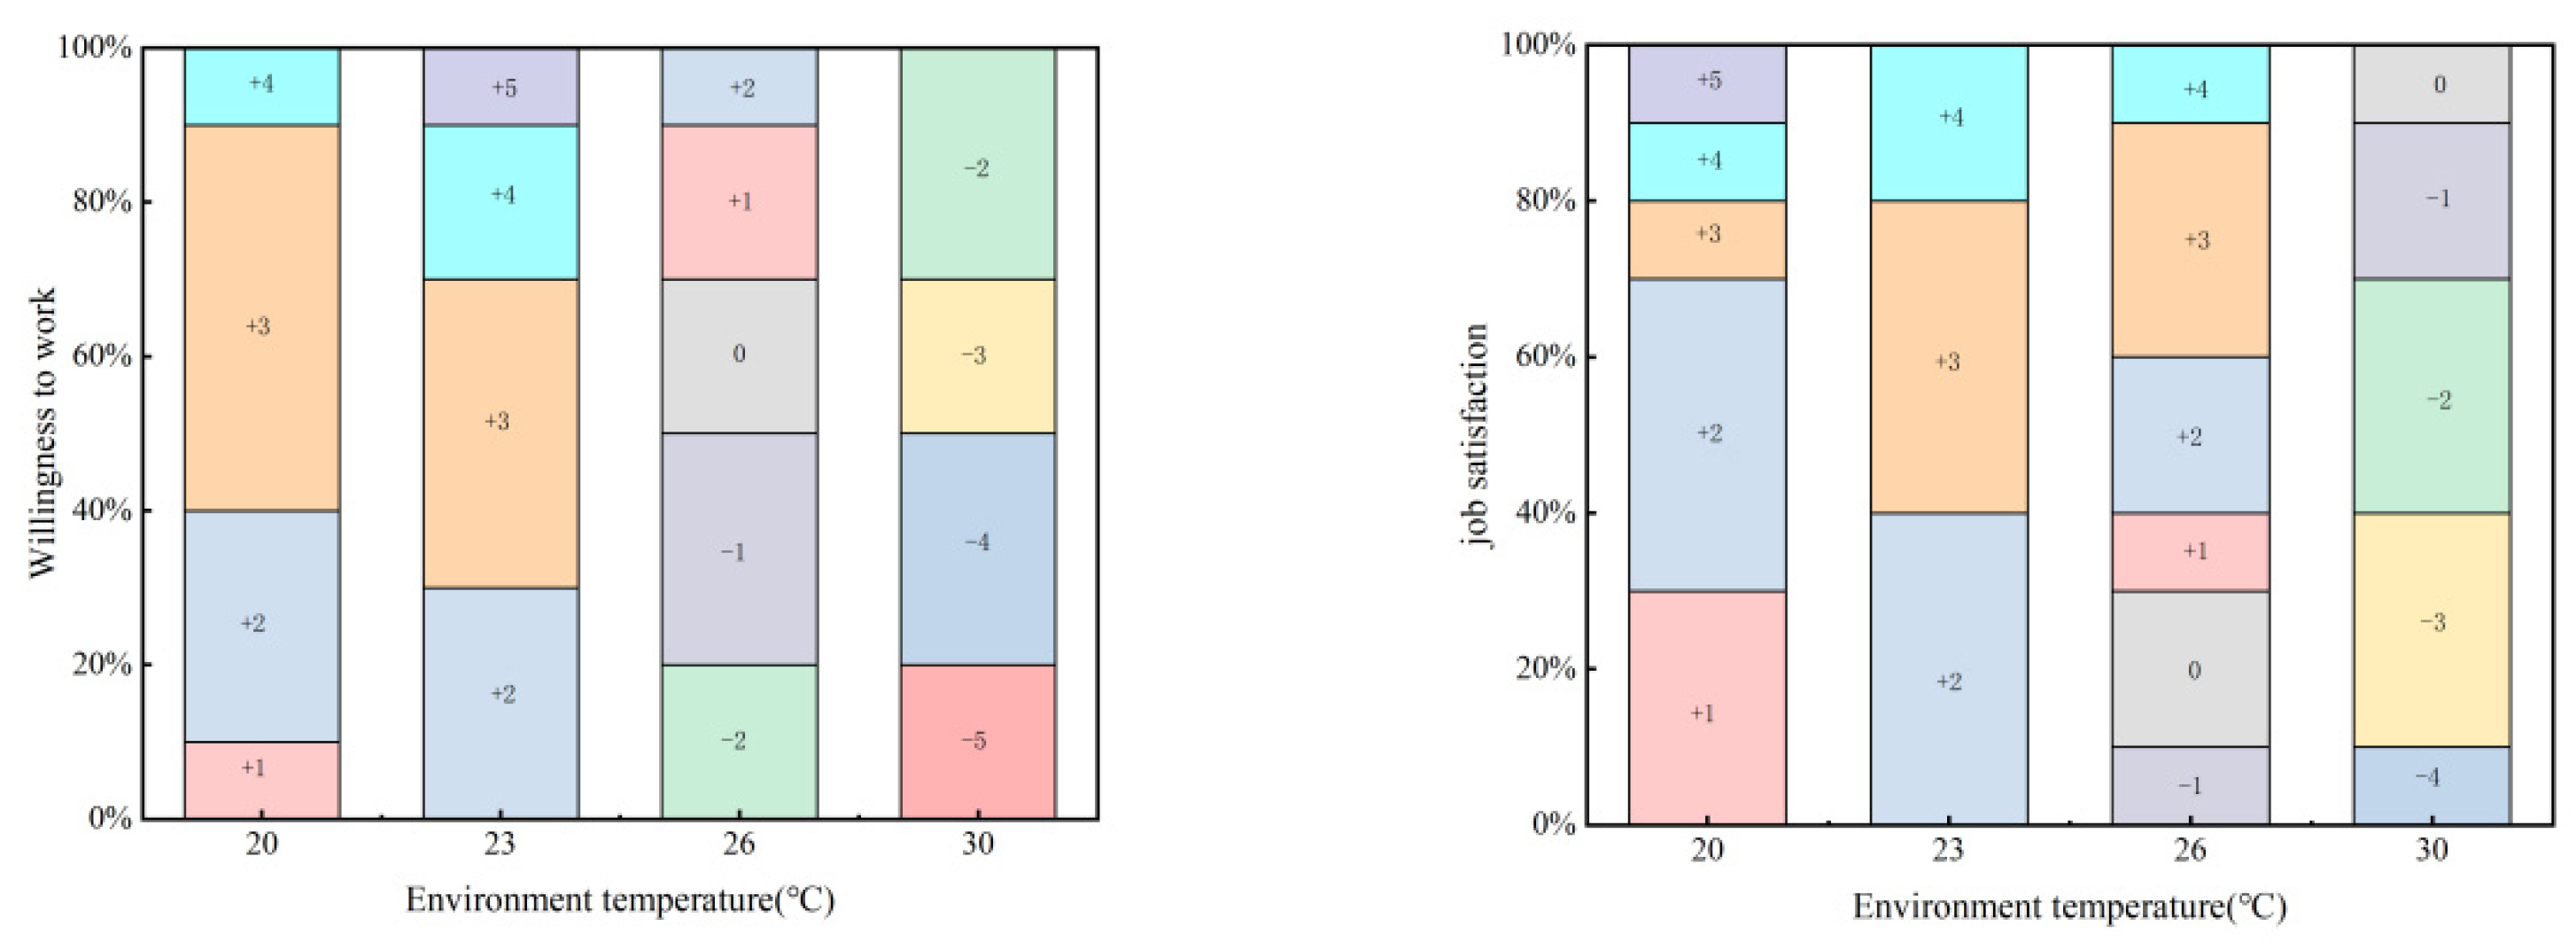
- As the ambient temperature rose, the thermal sensation, thermal comfort score and brain load increased in the subjective questionnaire; and environmental acceptance, job satisfaction and willingness to work decreased. At uncomfortable ambient temperatures, drivers experienced the uncomfortable states of dizziness, sleepiness, and weakness.
- The correlation analysis showed that there was a significant negative correlation between ambient temperature and motivation and environmental acceptance (p < 0.001). In contrast, there was a positive correlation between vehicle air temperature and test time and the number of errors; there was a significant positive correlation between TSV, mental demand, physical demand, temporal demand, performance thermal sensation, and vehicle air temperature (p < 0.001); there was a significant and high positive correlation between brain load and ambient temperature (p < 0.001); there was a weak positive correlation between FEA, vigilance, wavelet entropy and ambient temperature (p < 0.05).
Author Contributions
Funding
Institutional Review Board Statement
Informed Consent Statement
Data Availability Statement
Conflicts of Interest
Nomenclature
| Abbreviations | |
| EEG | Electroencephalogram |
| RH | Relative humidity |
| TA | Ambient temperature |
| TW | Wet Bulb Globe Temperature (WBGT) |
| TSV | Thermal sensation vote |
| TCV | Thermal comfort vote |
| TAV | Thermal acceptance vote |
| V | Air velocity |
| NASA-TLX | National aeronautics and space administration task load index |
| PSD | Power spectral density |
| BMI | Body mass index |
| θ | Theta wave |
| α | Alpha wave |
| β | Beta wave |
| FEA | Frontal EEG asymmetry |
| ANOVA | Analysis of variance |
References
- Huang, J.; Luo, X.; Peng, X.Y. A Novel Classification Method for a Driver’s Cognitive Stress Level by Transferring Interbeat Intervals of the ECG Signal to Pictures. Sensors 2020, 20, 1340. [Google Scholar] [CrossRef] [PubMed] [Green Version]
- Szczurek, A.; Maciejewska, A. Categorisation for air quality assessment in car cabin. Transp. Res. Part D Transp. Environ. 2016, 48, 161–170. [Google Scholar] [CrossRef]
- Zhang, S.; He, W.P.; Chen, D.K.; Chu, J.J.; Fan, H. Thermal comfort analysis based on PMV/PPD in cabins of manned submersibles. Build. Environ. 2019, 148, 668–676. [Google Scholar] [CrossRef]
- Yun, S.; Chun, C.; Kwak, J.; Park, J.S.; Seo, S. Prediction of thermal comfort of female passengers in a vehicle based on an outdoor experiment. Energy Build. 2021, 248, 111161. [Google Scholar] [CrossRef]
- Li, W.J.; Chen, J. Analysis on the correlation between human physiological thermal responses and subjective thermal sensation in inhomogeneous thermal environment of passenger compartment. Automot. Eng. 2022, 44, 131–141. [Google Scholar]
- Rosaria, C.; Chiara, C. Comfort seat design: Thermal sensitivity of human back and buttock. Int. J. Ind. Ergon. 2020, 78, 102961. [Google Scholar] [CrossRef]
- Daanen, H.A.; Huang, X. Driving performance in cold, warm, and thermoneutral environments. Appl. Ergon. 2003, 34, 597–602. [Google Scholar] [CrossRef]
- Al Horr, Y.; Arif, M.; Kaushik, A.; Mazroei, A.; Katafygiotou, M.; Elsarrag, E. Occupant productivity and office indoor environment quality: A review of the literature. Build. Environ. 2016, 105, 369–389. [Google Scholar] [CrossRef] [Green Version]
- Kim, H.; Hong, T.; Kim, J.; Yeom, S. A psychophysiological effect of indoor thermal condition on college students’ learning performance through EEG measurement. Build. Environ. 2020, 184, 107223. [Google Scholar] [CrossRef]
- Zhai, Y.N.; Wang, X.T.; Niu, H.B.; Wang, X.L. Fuzzy comprehensive evaluation of human work efficiency in a high-temperature thermal-radiation environment. Sustainability 2022, 14, 13959. [Google Scholar] [CrossRef]
- Tham, K.W.; Willem, H.C. Room air temperature affects occupants’ physiology, perceptions and mental alertness. Build. Environ. 2010, 45, 40–44. [Google Scholar] [CrossRef]
- Teplan, M. Fundamentals of EEG measurement. Meas. Sci. Rev. 2002, 2, 1–11. [Google Scholar]
- Shan, X.; Yang, E.H.; Zhou, J.; Chang, V.W.C. Neural-signal electroencephalogram (EEG) methods to improve human-building interaction under different indoor air quality. Build. Environ. 2018, 129, 46–53. [Google Scholar] [CrossRef]
- Ghosh, R.; Sinha, N.; Biswas, S.K. Removal of Eye-Blink Artifact from EEG Using LDA and Pre-trained RBF Neural Network. In Smart Computing Paradigms: New Progresses and Challenges; Springer: Singapore, 2020; pp. 217–225. [Google Scholar]
- Li, J.; Wu, W.; Jin, Y.; Zhao, R.; Bian, W. Research on environmental comfort and cognitive performance based on EEG+VR+LEC evaluation method in underground space. Build. Environ. 2021, 198, 107886. [Google Scholar] [CrossRef]
- Phadikar, S.; Sinha, N.; Ghosh, R.; Ghaderpour, E. Automatic Muscle Artifacts Identification and Removal from Single-Channel EEG Using Wavelet Transform with Meta-Heuristically Optimized Non-Local Means Filter. Sensors 2022, 22, 2948. [Google Scholar] [CrossRef]
- Egambaram, A.; Badruddin, N.; Asirvadam, V.S.; Begum, T.; Fauvet, E.; Stolz, C. Online detection and removal of eye blink artifacts from electroencephalogram. Biomed. Signal Process. Control 2021, 69, 102887. [Google Scholar] [CrossRef]
- Sharma, M.; Tiwari, J.; Patel, V.; Acharya, U.R. Automated Identification of Sleep Disorder Types Using Triplet Half-Band Filter and Ensemble Machine Learning Techniques with EEG Signals. Electronics 2021, 10, 1531. [Google Scholar] [CrossRef]
- Ahmed, M.Z.I.; Sinha, N.; Phadikar, S.; Ghaderpour, E. Automated Feature Extraction on AsMap for Emotion Classification Using EEG. Sensors 2022, 22, 2346. [Google Scholar] [CrossRef]
- Jung, T.P.; Makeig, S.; Stensmo, M.; Sejnowski, T.J. Estimating alertness from the EEG power spectrum. IEEE Trans. Biomed. Eng. 1997, 44, 60–69. [Google Scholar] [CrossRef]
- Christensen, J.C.; Estepp, J.R.; Wilson, G.F.; Russell, C.A. The effects of day-to-day variability of physiological data on operator functional state classification. Neuroimage 2012, 59, 57–63. [Google Scholar] [CrossRef]
- Zheng, G.; Li, K.; Bu, W.; Wang, Y. The effects of indoor high temperature on circadian rhythms of human work efficiency. Int. J. Environ. Res. Public Health 2019, 16, 759. [Google Scholar] [CrossRef] [Green Version]
- Brouwer, A.-M.; Hogervorst, M.A.; Erp, J.B.F.V.; Heffelaar, T.; Zimmerman, P.H.; Oostenveld, R. Estimating workload using EEG spectral power and ERPs in the n-back task. J. Neural Eng. 2012, 9, 045008. [Google Scholar] [CrossRef] [PubMed]
- Zhu, M.; Liu, W.; Wargochi, P. Changes in EEG signals during the cognitive activity at varying air temperature and relative humidity. J. Expo. Sci. Environ. Epidemiol. 2020, 30, 285–298. [Google Scholar] [CrossRef] [PubMed] [Green Version]
- Hwang, S.; Jebelli, H.; Choi, B.; Choi, M.; Lee, S. Measuring workers’ emotional state during construction tasks using wearable EEG. J. Constr. Eng. Manag. 2018, 144, 04018050. [Google Scholar] [CrossRef]
- Angsuwatanakul, L.T.; Ounjai, K. Multiscale entropy as a new feature for EEG and FNIRS analysis. Entropy 2020, 22, 189. [Google Scholar] [CrossRef] [Green Version]
- Son, J.; Park, M. Detection of cognitive and visual distraction using radial basis probabilistic neural networks. Int. J. Automot. Technol. 2018, 19, 935–940. [Google Scholar] [CrossRef]
- Lan, L. Mechanism and Evaluation of the Effects of Indoor Environment Quality on Human Productivity. Ph.D. Thesis, Shanghai Jiao Tong University, Shanghai, China, 2010. [Google Scholar]
- Jiang, J.; Wang, D.J.; Liu, Y.F.; Di, Y.H.; Liu, J.P. A field study of adaptive thermal comfort in primary and secondary school classrooms during winter season in Northwest China. Build. Environ. 2020, 175, 106802. [Google Scholar] [CrossRef]
- Yang, Y.; Hu, L.; Zhang, R.; Zhu, X.; Wang, M. Investigation of students’ short-term memory performance and thermal sensation with heart rate variability under dif-ferent environments in summer. Build. Environ. 2021, 195, 107765. [Google Scholar] [CrossRef]
- Jiang, J.; Wang, D.J.; Liu, Y.F.; Xu, Y.C.; Liu, J.P. A study on pupils’ learning performance and thermal comfort of primary schools in China. Build. Environ. 2018, 134, 102–113. [Google Scholar] [CrossRef]
- Choi, Y.; Kim, M.; Chun, C. Effect of temperature on attention ability based on electroencephalogram measurements. Build. Environ. 2019, 147, 299–304. [Google Scholar] [CrossRef]
- Zhang, S.; Zhu, N.; Lu, S. Responses of human perception and skin temperature to directed thermal radiation in hot environments. Build. Environ. 2021, 197, 107857. [Google Scholar] [CrossRef]
- ANSI/ASHRAE Standard 55-2017; Thermal Environment Conditions for Human Occupancy. ASHRAE: American Society of Heating, Refrigerating and AirConditioning Engineers: Atlanta, GA, USA, 2017.
- ISO 7730; Ergonomics of the Thermal Environment-Analytical Determination and Interpretation of Thermal Comfort Using Calculation of the PMV and PPD Indices and Local Thermal Comfort Criteria. 3rd ed. International Organisation for Standardization: Geneva, Switzerland, 2005.
- Lu, K.; Wei, Z.; Zhuang, D.; Wanyan, X. Integrated physiological model for mental workload assessment and prediction of aircraft flight deck display interface. J. Beijing Univ. Aeronaut. Astronaut. 2016, 42, 685–693. [Google Scholar]
- Chandra, S.; Verma, K.L.; Sharma, G.; Mittal, A.; Jha, D. EEG based cognitive workload classification during NASA MATB-II multitasking. Int. J. Cognit. Res. Sci. Eng. Educ. 2015, 3, 35–42. [Google Scholar] [CrossRef]
- Lan, L.; Lian, Z.W.; Pan, L.; Ye, Q. Neurobehavioral approach for evaluation of office workers’ productivity: The effects of room temperature. Build. Environ. 2009, 44, 1578–1588. [Google Scholar] [CrossRef]
- Niu, H.B.; Zhai, Y.N.; Huang, Y.Q.; Wang, X.T.; Wang, X.L. Investigating the short-term cognitive abilities under local strong thermal radiation through EEG measurement. Build. Environ. 2022, 224, 109567. [Google Scholar] [CrossRef]
- Pion-Tonachini, L.; Kreutz-Delgado, K.; Makeig, S. ICLabel: An automated electroencephalographic independent component classifier, dataset, and website. Neuroimage 2019, 198, 181–197. [Google Scholar] [CrossRef] [Green Version]
- Wang, D.J.; Chen, J.; Zhao, D. Monitoring workers’ attention and vigilance in construction activities through a wireless and wearable electroencephalography system. Autom. Constr. 2017, 82, 122–137. [Google Scholar] [CrossRef]
- Zhang, N.N.; Wang, H.; Fu, R.R. Wavelet entropy-based feature extraction of driving fatigue EEG signals. Automot. Eng. 2013, 35, 1139–1142. [Google Scholar]
- Ding, Z.M.; Xiong, D.S.; Chen, Y.K.; Zhang, X.A.; Dou, J.H.; Chen, Y.Y. Depth of anesthesia monitoring based on EEG sample entropy and wavelet entropy. Chin. J. Med. Phys. 2018, 35, 243–248. [Google Scholar]


| Type | Name | Measuring Devices | Versions | Range |
|---|---|---|---|---|
| Environmental parameters | TA | Testo-Smart | 405i | −20 °C~ +60 °C |
| RH | Probes | 0–100% | ||
| V | 0–30 m/s | |||
| TW | WBGT index meter | 2006 | 5–40 °C | |
| Physiological indices | EEG | EEG device | Open BCI | 128 Hz 16 Channels |
| Testing Capability | Test Project | Test Content | Legend |
|---|---|---|---|
| Memory | Graphics memory | Given a variety of patterns, select the correct pattern position by memory |  |
| Thinking | Shorthand simplified | In a certain period of time, arrive at the answers of five mixed numbers through mental arithmetic and then select the correct option |  |
| Perception | Find the target graphic | Find out the figure given by the topic from 36 different figures |  |
| Vigilance | Reaction speed | First press the left green key to start the test. When the middle light is on, click the right red key immediately |  |
| Environmental Temperature | Wavelet Entropy in the First Half | Wavelet Entropy in the Second Half | Wavelet Entropy Difference |
|---|---|---|---|
| 20 °C | 0.86 ± 0.31 | 0.78 ± 0.42 | 0.08 ± 0.11 |
| 23 °C | 0.89 ± 0.38 | 0.82 ± 0.56 | 0.07 ± 0.18 |
| 26 °C | 0.72 ± 0.19 | 0.61 ± 0.32 | 0.11 ± 0.13 |
| 30 °C | 0.57 ± 0.21 | 0.44 ± 0.42 | 0.13 ± 0.21 |
| Testing Capability | Test Time (s)/Number of Errors | |||
|---|---|---|---|---|
| 20 °C | 23 °C | 26 °C | 30 °C | |
| Thinking | 259.4 ± 41.1/1.7 ± 1.8 | 264.8 ± 44.3/2.1 ± 1.1 | 260.6 ± 36.5/2.1 ± 1.5 | 291.4 ± 54.3/3.0 ± 1.8 |
| Memory | 197.4 ± 37.8/1.5 ± 1.3 | 204.6 ± 37.6/1.8 ± 1.8 | 226.8 ± 62.4/2.4 ± 1.3 | 233.1 ± 46.4/3.7 ± 2.8 |
| Perception | 191.1 ± 13.8/1.1 ± 0.9 | 204.2 ± 44.5/1.9 ± 1.5 | 194.6 ± 27.4/1.1 ± 1.3 | 217.6 ± 42.7/2.5 ± 2.0 |
| Total | 647.9 ± 62.8/4.3 ± 2.9 | 673.6 ± 83.5/5.8 ± 3.8 | 682.0 ± 88.3/6.1 ± 3.2 | 742.1 ± 108.6/9.2 ± 5.6 |
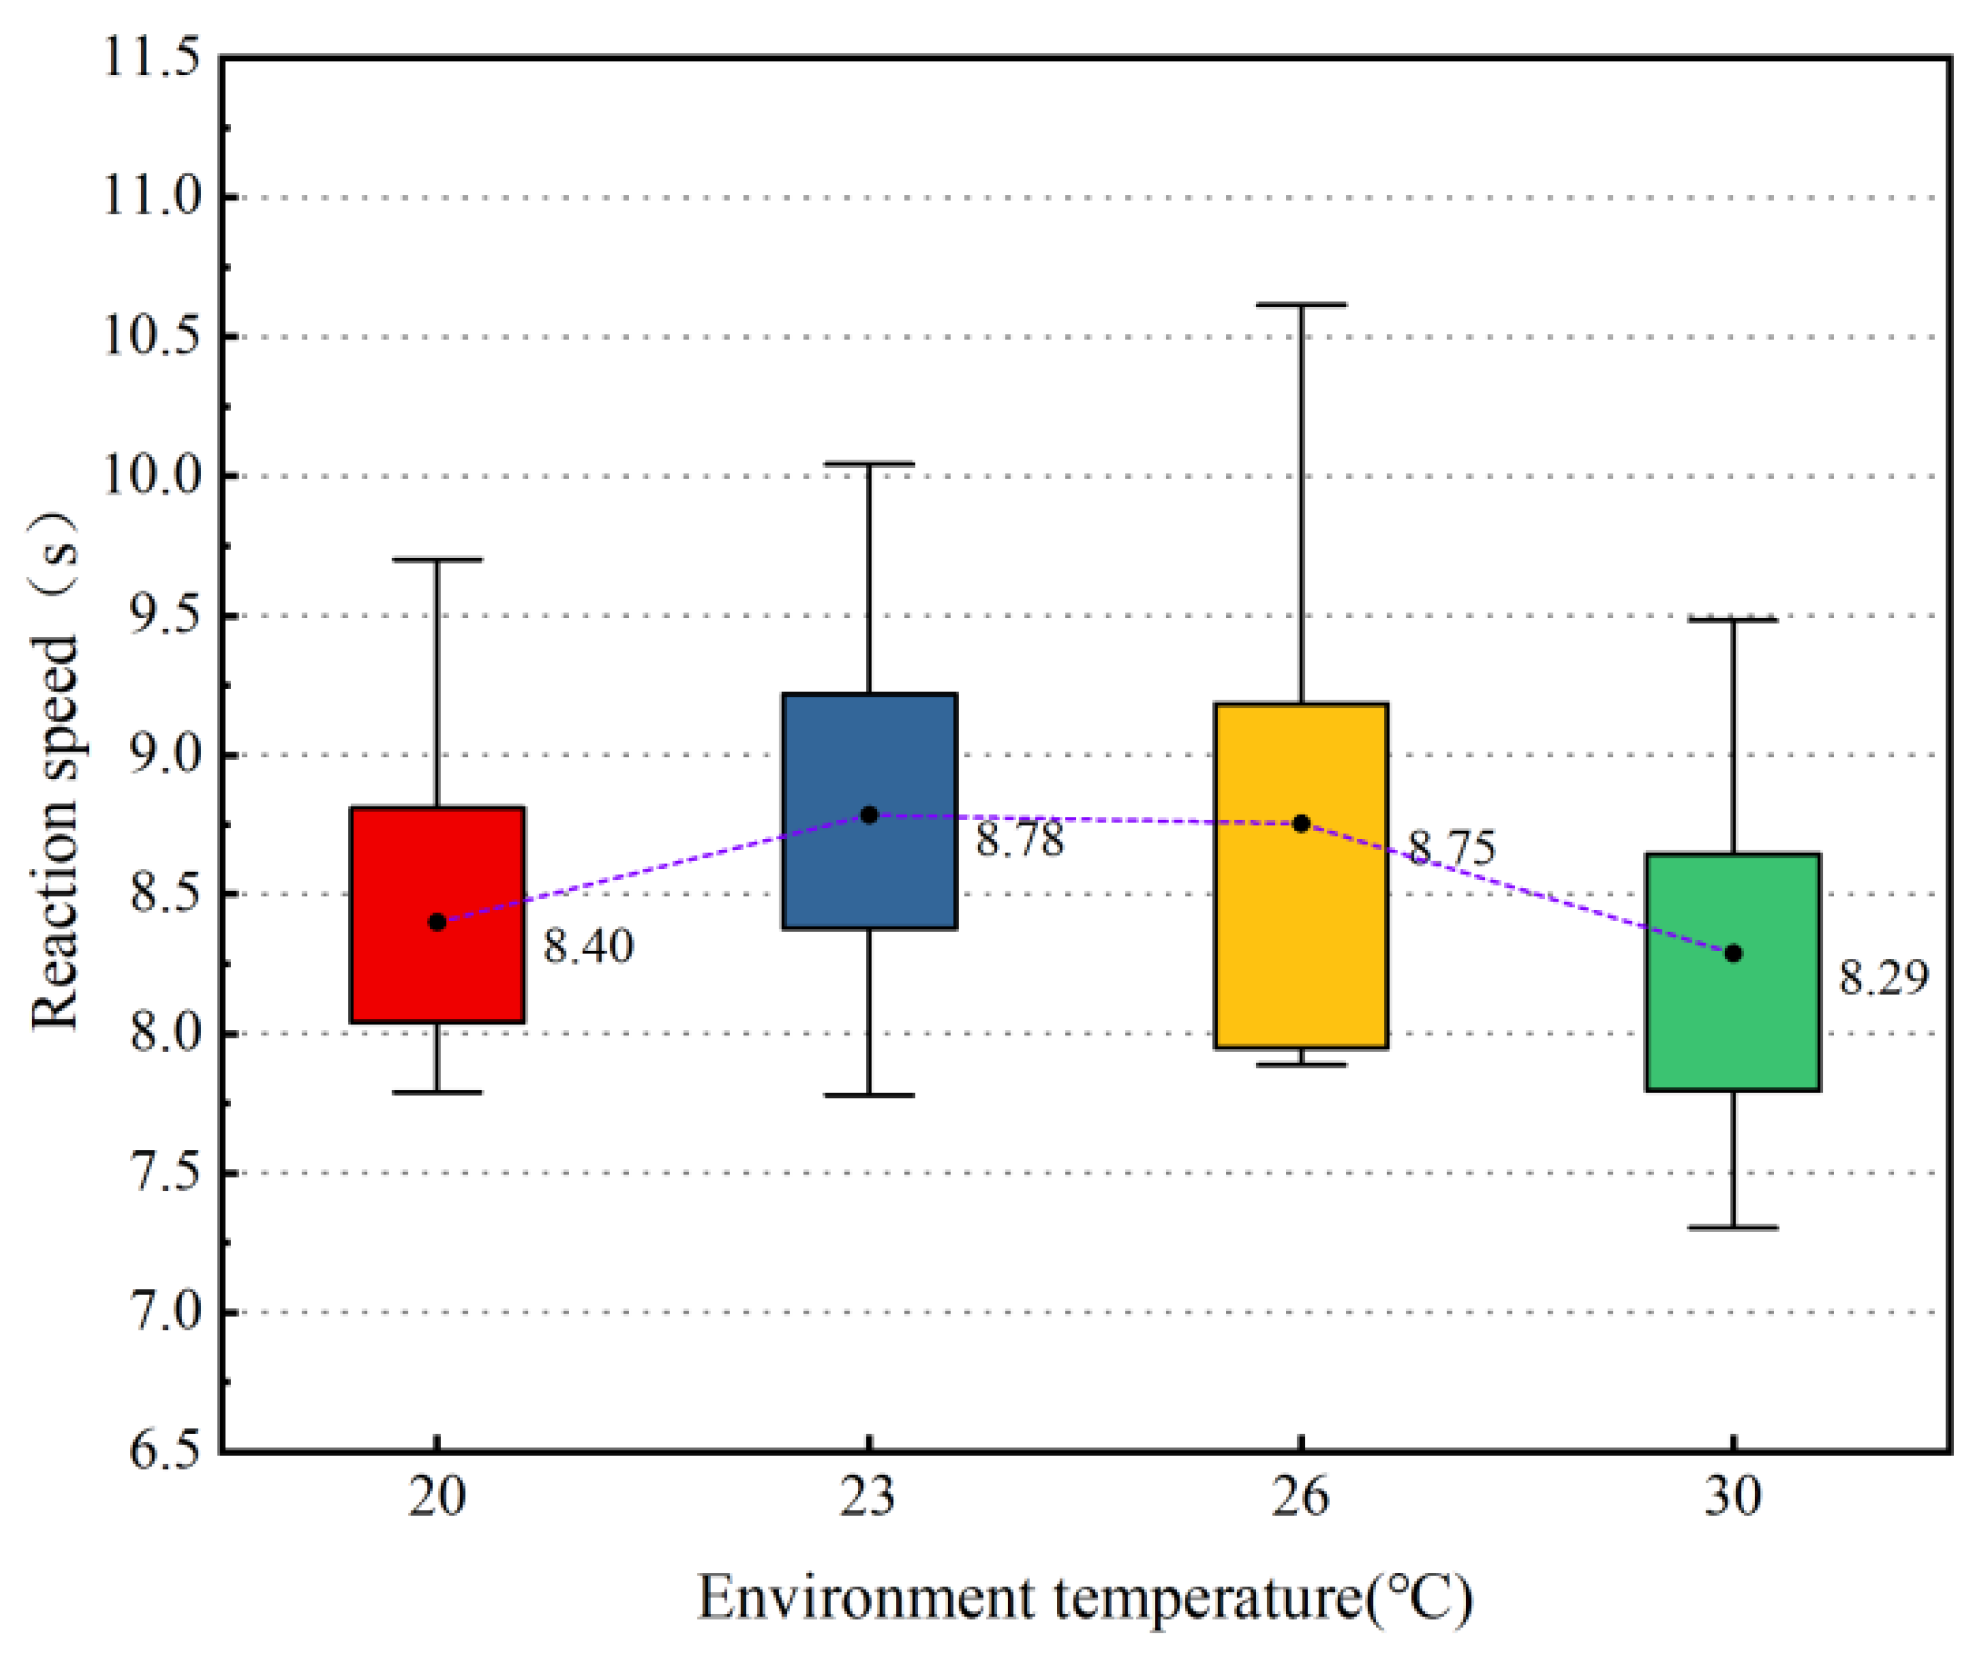
| Vigilance | 8.400 ± 0.596 | 8.785 ± 0.636 | 8.753 ± 0.854 | 8.288 ± 0.608 |
| Test Project | Scale Range | 20 °C | 23 °C | 26 °C | 30 °C | p |
|---|---|---|---|---|---|---|
| Thermal sensation | Unbearable cold (−3) → Unbearable heat (+3) | −1.5 ± 0.5 | 0.3 ± 0.5 | 2 ± 0.7 | 2.5 ± 0.5 | ** |
| Thermal comfort | Cold discomfort (−3) → Heat discomfort (+3) | −1.4 ± 0.7 | 0.4 ± 0.5 | 1.7 ± 0.5 | 2.9 ± 0.1 | ** |
| Environmental acceptance | Unacceptable (−1) → Acceptable (+1) | 0.5 ± 0.2 | 0.9 ± 0.2 | −0.5 ± 0.4 | −0.9 ± 0.2 | ** |
| Dizzy | No (−3) → Yes (+3) | −2.7 ± 0.5 | −2.2 ± 0.9 | 0.6 ± 0.8 | 2.2 ± 0.6 | ** |
| Fatigue | No (−3) → Yes (+3) | −2.2 ± 0.8 | −1.2 ± 1.0 | 1.2 ± 0.9 | 2.4 ± 0.7 | ** |
| Sleepy | No (−3) → Yes (+3) | −2.8 ± 0.4 | −2.1 ± 0.6 | −1.3 ± 0.8 | 0.3 ± 0.7 | ** |
| Lack of Concentration | No (−3) → Yes (+3) | −2.6 ± 0.5 | −2.1 ± 0.7 | −0.2 ± 0.8 | 1.3 ± 0.3 | ** |
| Thinking ability | No (−3) → Yes (+3) | −2.7 ± 0.5 | −2.3 ± 0.8 | −0.7 ± 1.2 | 0.7 ± 0.5 | ** |
| Vehicle Air Temperature | r | p |
|---|---|---|
| Test time | 0.371 | 0.019 |
| Number of errors | 0.391 | 0.013 |
| TSV | 0.89 | <0.001 |
| Motivation | −0.52 | <0.001 |
| Mental Demand | 0.91 | <0.001 |
| Physical Demand | 0.95 | <0.001 |
| Temporal Demand | 0.96 | <0.001 |
| Performance | 0.66 | <0.001 |
| Thermal sensation | 0.973 | <0.001 |
| Thermal comfort | 0.954 | <0.001 |
| Environmental acceptance | −0.897 | <0.001 |
| Brain load | 0.909 | <0.001 |
| FEA | 0.453 | <0.05 |
| Vigilance | 0.692 | <0.05 |
| Wavelet entropy | 0.661 | <0.05 |
Disclaimer/Publisher’s Note: The statements, opinions and data contained in all publications are solely those of the individual author(s) and contributor(s) and not of MDPI and/or the editor(s). MDPI and/or the editor(s) disclaim responsibility for any injury to people or property resulting from any ideas, methods, instructions or products referred to in the content. |
© 2023 by the authors. Licensee MDPI, Basel, Switzerland. This article is an open access article distributed under the terms and conditions of the Creative Commons Attribution (CC BY) license (https://creativecommons.org/licenses/by/4.0/).
Share and Cite
Wang, X.; Yang, Q.; Zhai, Y.; Niu, H.; Wang, X. Effects of Vehicle Air Temperature on Drivers’ Cognitive Abilities Based on EEG. Sustainability 2023, 15, 1673. https://doi.org/10.3390/su15021673
Wang X, Yang Q, Zhai Y, Niu H, Wang X. Effects of Vehicle Air Temperature on Drivers’ Cognitive Abilities Based on EEG. Sustainability. 2023; 15(2):1673. https://doi.org/10.3390/su15021673
Chicago/Turabian StyleWang, Xianglin, Qian Yang, Yingni Zhai, Haobo Niu, and Xinta Wang. 2023. "Effects of Vehicle Air Temperature on Drivers’ Cognitive Abilities Based on EEG" Sustainability 15, no. 2: 1673. https://doi.org/10.3390/su15021673