Article

A Big Data Approach for Investigating Bridge Deterioration and Maintenance Strategies in Taiwan

Department of Civil Engineering, National Central University, No. 300, Chung-da Rd., Taoyuan 32011, Taiwan
*
Author to whom correspondence should be addressed.
Sustainability 2023, 15(2), 1697; https://doi.org/10.3390/su15021697
Submission received: 1 December 2022 / Revised: 5 January 2023 / Accepted: 8 January 2023 / Published: 16 January 2023
(This article belongs to the Special Issue Construction Project and Management in Smart Cities)

Abstract

:
Due to the dwindling maintenance budget and lack of qualified bridge inspectors, bridge-management agencies in Taiwan need to develop cost-effective maintenance and inspection strategies to preserve the safety and functionality of their aging, natural disaster-prone bridges. To inform the development of such a strategy, this study examined the big data stored in the Taiwan Bridge Management System (TBMS) using the knowledge discovery in databases (KDD) process. Cluster and association algorithms were applied to the inventory and five-year inspection data of 2849 bridges to determine the bridge structural configurations and components that are prone to deterioration. Bridge maintenance agencies can use the results presented to reevaluate their current maintenance and inspection strategies and concentrate their limited resources on bridges and components most prone to deterioration.

1. Introduction

Several bridge management databases have been recently transformed into rich repositories of big data as a result of advances in bridge structural health monitoring (SHM) systems, non-destructive testing (NDT) procedures, information technologies, and the massive volume of periodic bridge inspection reports amassed over the preceding decades [1,2]. One such database is the Taiwan Bridge Management System (TBMS), which to date contains over 3 million data records. Developed in 2000 by the National Central University (NCU) through the support of the Ministry of Transportation and Communications (MOTC), the TBMS is a web-based, centralized database used by bridge maintenance agencies in Taiwan to store all maintenance management data from its highway- and railway bridge infrastructure. It has nine modules, including kernel modules for inventory, inspection, and maintenance data of over 28,000 bridges. Its inventory module has over 80,000 records of the general definition of each bridge, including, among others, the design and geometry of its superstructure and substructure, and its location and ownership.
The TBMS inspection module is periodically updated to include the results of the most recent bridge inspections. Every two years, bridges are visually evaluated at the component level to determine their overall condition. Existing and emerging deteriorations discovered during these inspections are defined based on four criteria and rated on a scale from 0 to 4 (Figure 1). These criteria include the degree of deterioration (D), the extent of deterioration (E), the relevance to safety of deterioration (R), and the urgency (U) of deterioration repair, hence the term DER&U (Table 1). Inspectors document their findings by completing inspection forms with 141 fields for each bridge. Due to the detailed nature of the DER&U inspection process, the TBMS inspection module has accumulated more than 2.7 million entries over the years, and it is anticipated that this figure will continue to grow by around 14,000 entries annually.
Databases of such scale and complexity are thought to be untapped sources of knowledge that have the potential to advance current bridge design, construction, and maintenance practices [1,3]. Discovering such knowledge, however, requires an abstract level of inquiry (e.g., understanding the underlying relationship between different factors such as bridge performance, age, design, environment, usage, and deterioration patterns) that is beyond the capabilities of conventional statistical tools and database management programming languages such as SQL [3,4]. To do this, researchers instead employ a computer-driven, interdisciplinary, and more advanced process called knowledge discovery in databases (KDD) [5,6,7]. Fayyad and Stolorz (1997) defined the KDD process as “the overall nontrivial process of discovering valid, novel, potentially useful, and ultimately understandable patterns in data [4].” Data mining is an integral component of this process and requires the application of one or more machine learning algorithms to extract or mine patterns hidden behind massive data (Figure 1) [3,4,5,7,8,9].
The KDD process has been used in several bridge engineering and management studies to extract knowledge from the now available big data. Most of these data have been generated and collected during the bridge’s operation and maintenance (O&M) phase of its life cycle [2]. Bridge maintenance agencies receive raw data from NDT techniques and sensors from SHM systems, which can then be converted into useful bridge and network-level data [1]. With this data and different machine learning-based procedures, researchers and bridge maintenance agencies can adopt a data-driven approach to bridge O&M without physically examining bridges [1,2,6,10,11]. Data collected from SHM systems, for instance, can be analyzed using either supervised (e.g., classification, ensemble learning, regression) or unsupervised machine learning algorithms (e.g., clustering and association) [6]. Sun et al. (2020) provided an overview of how these algorithms have been used to process data from SHM systems, as well as an assessment of their strengths and limitations.
Wu et al. (2020) observed that developments in data-driven bridge O&M are generally heading toward five areas of application [1]: (1) investigation of bridge deterioration factors and the development of bridge structural health models, (2) estimation of failure probability or load capacity, (3) evaluation of bridge life expectancy, (4) generation of solutions for resolving issues related to bridge or network-level O&M and selection of appropriate SHM and NDT tools, and (5) assessment or prediction of bridge condition. In one of the most recent studies, Mortagi and Ghosh (2022) suggested factoring in the potential adverse effects of climate change when evaluating the seismic performance of aging highway bridge structures [12]. Sony et al. (2022) proposed a windowed one-dimensional convolutional neural network model to detect structural problems in bridges using the vibration responses collected by SHM systems [13]. Abdelmaksoud et al. (2021) recommended parameterized logistic models as an alternative to the existing bridge deterioration models used as a reference for establishing an optimum inspection frequency and maintenance schedule for each bridge [14]. Their technique uses fewer parameters than reliability-based models and can be used without the assumptions normally needed to forecast bridge condition using Markov chain-based models integrated in a number of bridge management systems.
In addition to these studies, a new body of research using bridge inspection data from databases such as the National Bridge Inventory (NBI) database and the Korean Bridge Management System (KOBMS) has begun to emerge [7,15,16,17,18,19,20]. The objectives of these studies can be generally categorized into two: predictive and informative (or descriptive) [21]. The objective of predictive data mining studies is to solve a specific problem by forecasting the future values of one or more database fields using data from other fields [4]. An example of such studies includes the work of Li et al. (2021) wherein they used the descriptive text from more than 8000 inspection reports to develop a neural network model aimed at promoting consistency and reliability in bridge condition assessment among inspectors [19]. Xia et al. (2021) developed a fully data-driven, regional-level bridge maintenance management framework using data extracted from inspection reports [22]. Lei et al. (2022) developed a framework for regional-level bridge maintenance planning based on deep reinforcement learning using data accumulated from years of bridge-inspection reports [23]. Informative data mining, on the other hand, seeks to identify patterns hidden inside massive data sets that a domain expert may not readily recognize. For example, Radovic et al. (2017) conducted a two-step cluster analysis on the inspection data of 9809 concrete decks of highway bridges to discover which combination of concrete deck design parameters could result in bad and good conditions [7]. Kim and Yoon (2010) analyzed the inspection data of 5289 bridges located in North Dakota using multiple regression analysis to determine the critical factors that contribute to the deterioration of bridges exposed to cold temperatures [18]. Diaz Arancibia et al. (2020) studied the inspection data of more than 1400 deck girder-type highway bridges to determine whether bridge performance is sensitive to skew [16]. Alogdianakis et al. (2020) conducted a statistical analysis of the inspection data of nearly 20,000 coastal bridges to determine the critical distance from the coastline to inland, where airborne sea chlorides can be expected to cause deterioration to bridges [24]. Kim and Queiroz (2017) examined the four-year inspection data of over 1 million bridge decks and superstructures to identify their performance against different environmental conditions, study how their condition ratings changed over time, and examine how the performances of different structural types compare to one another [17].

Research Motivation and Objective

Bridge management agencies in Taiwan currently face several challenges. The budget allocated for bridge maintenance has been declining every year, undermining the recruitment of qualified bridge inspectors and the awarding of contracts for bridge rehabilitation. In addition, a large portion of its bridge inventory has already aged. At least 5000 bridges have been in service for more than four decades, and the construction dates of more than 8000 are undocumented (Table 2). Furthermore, due to Taiwan’s location, topographical features, and geological composition, its bridges are vulnerable to the destructive effects of extreme natural hazards such as typhoons and earthquakes [25]. Flood-induced scouring, erosion, and debris collision frequently result in catastrophic failures during typhoons and torrential rainstorms [26].
These challenges necessitate a cost-effective bridge maintenance and inspection strategy capable of maintaining the safety and serviceability of Taiwan’s bridge infrastructure. To inform the development of such a strategy, this study aims to determine the types of bridge structural configurations and the particular bridge components that are most likely to develop deterioration by using the KDD process to analyze the data stored in the inventory and inspection modules of the TBMS. Knowing such information could help bridge maintenance agencies rethink their bridge maintenance strategies and focus their limited resources on bridges and components that are likely to deteriorate, resulting in a more economical use of maintenance funds.

2. Materials and Methods

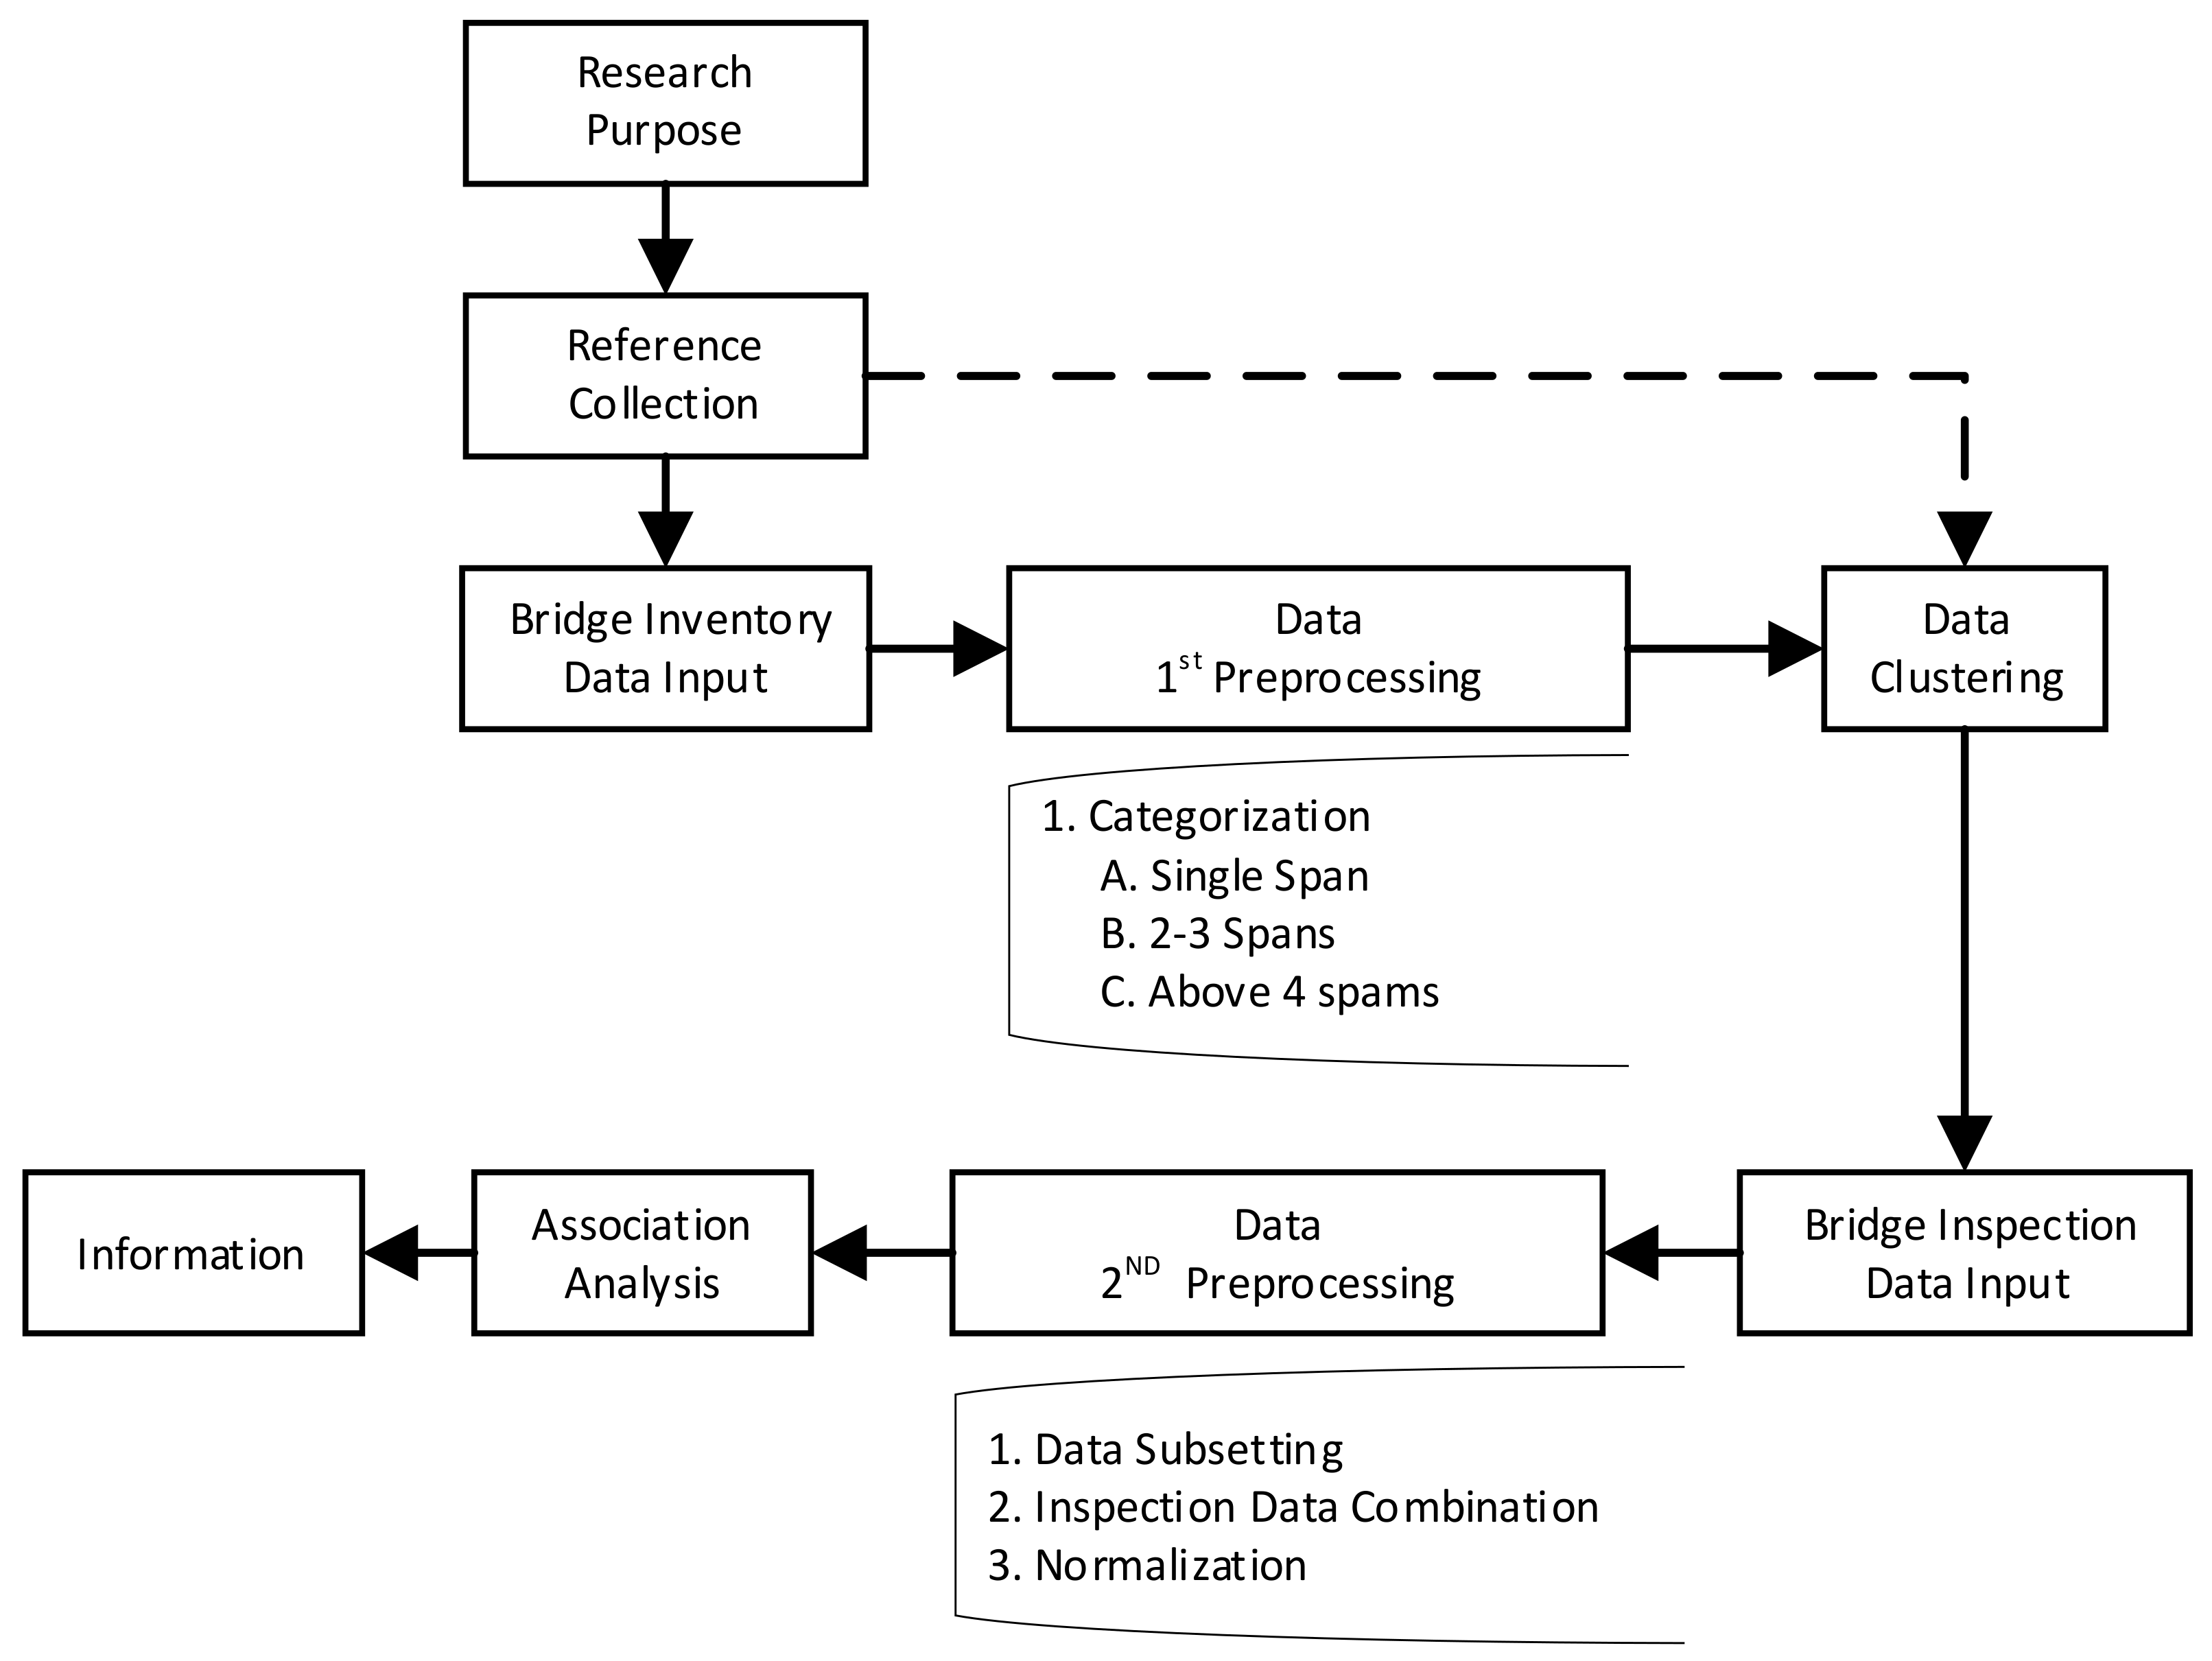
Using the KDD process, this study examined the inventory and inspection data extracted from the TBMS to identify the types of bridge structural configurations and components that are most susceptible to deterioration. The k-means and Apriori unsupervised algorithms were used for data preprocessing and mining. Figure 2 presents a flowchart of the implemented KDD procedure. Each of its elements is discussed in the following subsections.

2.1. TBMS Bridge-Inspection and Inventory-Data Overview

The inventory and five-year inspection data (2012 to 2016) of 2849 inland and coastal bridges, including those spanning major river systems, were extracted from the TBMS database. These bridges are maintained by either the central government or the local government agencies in the south–central region of Taiwan, including the cities of Taichung, Tainan, and Kaohsiung, as well as the counties of Changhua, Yunlin, Chiayi, and Pingtung. Since the inspection forms for slab, girder, and box-girder bridge types all contain identical fields, only these bridges were included in this study. Although other types such as arch, truss, and cable-supported bridges also exist in Taiwan, their numbers are too limited to be considered. Each type was classified into three groups according to the number of spans: single span, two to three spans, and four or more spans. These groupings were established to reduce the variability in deterioration patterns caused by certain structural features such as the number of spans, length of span, type of underpass, etc. Table 3 provides an overview of the distribution of bridges based on their type and number of spans.

2.2. Bridge-Inventory and Inspection-Data Preprocessing

A data set may contain discrepancies, missing values, or noise due to human error and technical issues, among other causes [8,20,27,28,29]. This is particularly true for data contained in bridge management databases, where the periodic updating of inspection and inventory data for the most part remains a manual process requiring the participation of qualified bridge inspectors. To ensure the data sets are adequate and accurate, and that the knowledge mined from these is reliable, data should be preprocessed before data-mining techniques are applied [5,20,27,29]. Data preprocessing can be in the form of data reduction, missing-value imputation, noise treatment, and data resampling, depending on the characteristics of the raw data and the intended data mining technique [6,8,27,28]. For this research, the bridge inspection and inventory data extracted from the TBMS were preprocessed using Microsoft Excel to ensure that each field contained consistent formal terms.
To prepare the TBMS inspection data for the subsequent association analysis, a three-part data preprocessing was performed. First, the extracted data were checked for inconsistencies with the DER&U evaluation criteria. Instances of components with a D value of 0 were reviewed to check whether they were indeed bridge components specified on the inspection form but not integrated into the actual configuration of the inspected bridge. Components with an E value of 0 were also reviewed, particularly bridge foundations whose condition often cannot be conveniently assessed. Inspectors sometimes assign “null, 0, null” DER values to foundations since they are embedded. In such a situation, however, the condition of the piers and abutments can be regarded as a reference, as they often manifest the condition of their corresponding supports. Therefore, the corresponding DER for the foundations were assumed to be “1, 0, 0” for piers or abutments in good condition (i.e., D = 1). Next, invalid test data and bridges with incomplete data records were deleted, as their inclusion could undermine the outcomes of the association analysis. Finally, components with recorded D values of 3 and 4 were replaced with a value of 2, forming two groups: components with deterioration (i.e., D = 2) and components without deterioration (i.e., D = 1).

2.3. Cluster Analysis

Cluster analysis is an unsupervised machine learning algorithm that divides or partitions large data sets into several distinct clusters containing members that share a high degree of attribute similarity [5,9,29,30]. It can be used either as an independent data mining technique or as a supportive data preprocessing technique to enhance the data set format in preparation for application of another data mining algorithm [15,29,30]. Different clustering algorithms have been extensively used in bridge engineering and management studies to analyze data obtained from structural health monitoring systems [6] and bridge inspection data [7,15].
Depending on the cluster algorithm applied, the degree of similarity between cluster members can be measured in terms of distance, density, or continuity [29]. For this research, the distance-based k-means algorithm built into the IBM SPSS Statistics 21 was used to partition the bridge into clusters in preparation for the subsequent association analysis. The k-means algorithm organizes or partitions a data set D containing n objects into a k number of clusters (kn). It randomly assigns k objects as initial centroids. The algorithm then forms clusters by aligning each remaining object with its nearest centroid. A new centroid is calculated based on the new cluster formed. The similarity measure within each cluster is improved by iterating the process until the clusters formed do not change. In the end, the similarity measure within each cluster should be at its highest and at its lowest between clusters. An in-depth explanation of the k-means algorithm can be found in [5,29].

2.4. Association Analysis

Association analysis is another unsupervised data mining technique used to discover interesting knowledge or patterns behind massive data sets [5,29,30]. This provides knowledge in the form of frequent item sets or association rules that indicate the relationships between items in large data sets [4]. One well-known application of association analysis is to analyze market basket transactions to recognize trends in consumer spending [5]. Its application has since been expanded, including in the analysis of data from automated building operation and management systems [30], bridge structural health monitoring systems [6], and the construction industry [8] For this research, the SPSS Modeler 18.2 was used to discover the association between the items in the bridge inventory data and the deterioration of a bridge component. The Apriori algorithm was used to generate the association rules. To check the objective interestingness of the generated rules, the support, confidence, and lift of each rule were determined. For the formal definitions of these parameters, the reader is directed to the works of Tan et al. (2019) and Han et al. (2012) [5,29].

3. Results

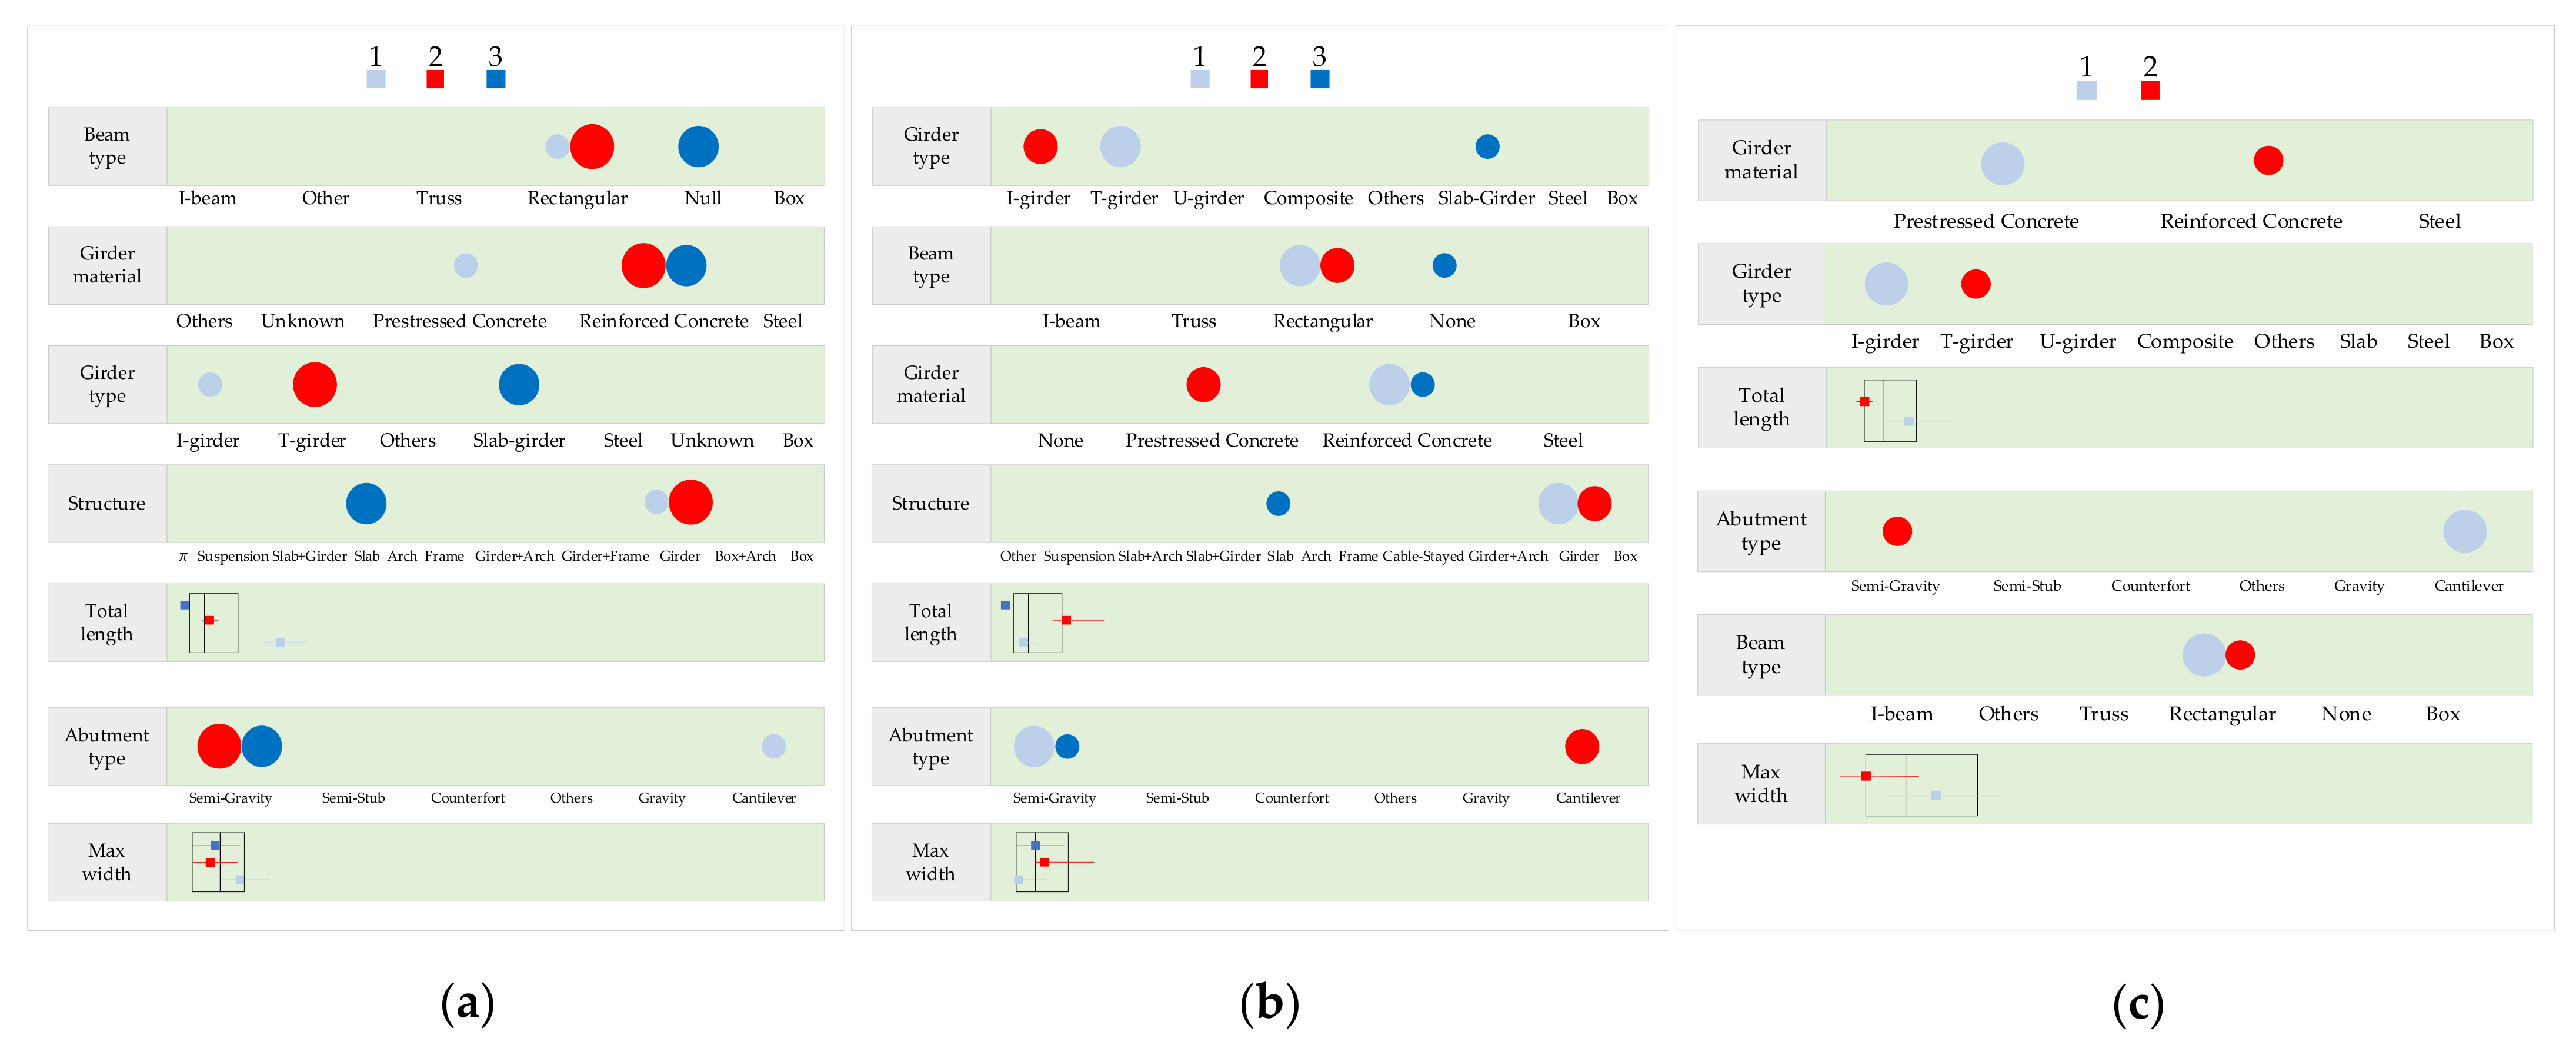
The 2849 bridges were clustered using IBM SPSS Statistics 21 on the basis of seven bridge inventory fields or attributes that were selected through trial and error from the initial 20 fields listed in Table 4 until the clusters attained the best quality. These attributes include bridge length, maximum net width, structural type, main beam type, main beam material, beam shape, and abutment type. Based on these attributes, the bridges, through their inspection data, were grouped into eight clusters. The 1781 single-span bridges were clustered into three groups, the 795 bridges with two to three spans into three groups, and the 273 bridges with more than four spans into two groups (Figure 3).
These bridge clusters were then analyzed using SPSS Modeler 18.2 to discover the association between the items in the bridge inventory data and the deterioration of a bridge component in each cluster. The seven attributes or bridge inventory fields could form different combinations. If a combination of these attributes accounts for more than 10% of all possible combinations in a cluster and the number of bridge components with a D value of 2 or higher in the records accounts for more than 25% of said records, the statistical results of such a combination indicate a greater likelihood of bridge component deterioration. At the end of the association analysis, rules that suggest the bridge configurations that are likely to contribute to the deterioration of a specific component were generated.
For single-span bridges, four association rules suggest that the deterioration of the abutment, girder, and bridge deck should be anticipated more than for other components. Gravity-type abutments are 25% more likely to deteriorate. Steel girders supporting bridges less than 12.712 m wide while resting on cantilever abutments have a 32.18% chance of developing defects. Two association rules for bridge decks on single-span bridges were determined. Bridge decks with widths between 12.712 to 23.684 m and supported by cantilever-type abutments have a 96% chance of forming deterioration. Meanwhile, bridge decks carried by rectangular beams and girders made of reinforced concrete have a 28.89% chance of deteriorating.
For bridges with two to three spans, the deck guard rails, abutments, and pier foundation should be inspected more closely. Three association rules concerning deck guard rails were generated. First, deck guard rails on bridges supported by buttressed counterfort abutments have a 75% of developing deterioration. Deck guard rails on bridges with widths between 28.28 and 40.42 m have a 67.86% chance of deterioration. In both situations, the bridge length is less than 59.84 m. Another bridge configuration to look for that has an association with the condition of the guard rails is if the bridge is slab-type, has a length of less than 15.52 m, and is supported by semi-gravity abutments. Guard rails have a 72% chance of developing deterioration in this case. For bridges with widths between 17.4 and 26.64 m that are supported by semi-gravity type abutments and T-shaped girders, there is an 80% likelihood of abutment and pier foundation deterioration.
For bridges with more than four spans, seven association rules involving the superstructure drainage, deck guard rails, approach embankment, approach guard rails, retaining walls, and bridge deck were generated. Superstructure drainages in bridges supported by pile bent-type abutments have a 100% chance of developing deterioration. Deck guard rails on bridges supported by pile-bent abutments also have a 100% chance of developing deterioration. The same likelihood should also be expected on deck guard rails in bridges with U-shaped girders. Two association rules involving the approach embankment were generated. The approach embankments of bridges with I-shaped girders and cantilever-type abutments have a 25.62% chance of deteriorating. If the beam is rectangular, the chance of deterioration is 37.5%. For both of these rules, the bridge length is between 386.64 and 732.48 m. Two bridge configurations were found to have an association with the development of deterioration in the approach guard rails, retaining walls, and bridge deck. There is a 25.62% chance that these components will deteriorate on bridges with lengths between 386.64 and 732.48 m, with rectangular beams and abutments of the cantilever type. Approach guard rails, retaining walls, and deck of bridges with a length of less than 386.64 m, a width of less than 10.76 m, and abutments of the cantilever type have probabilities of deterioration of 25.6%, 27.77%, and 40%, respectively.

4. Discussion

These results revealed two issues. First, they reflect how Taiwan’s geographical characteristics affect its bridge infrastructure. Approximately two-thirds of the island of Taiwan is covered by steep mountain ranges along the east coast. River systems have carved through these mountains and developed valleys, necessitating the construction of several bridges to link the surrounding cities and counties. Based on their GPS coordinates, most of the single-span bridges are located in the upper and middle sections of these rivers, where the slope is often steep, the current is strong, and the channel cross-section is narrow. Single-span bridge abutments, girders, and decks become susceptible to deterioration under these conditions, particularly if the bridge clearance is low. The other two groups of bridges are located halfway downstream, where both the slope and the current gradually recede. Thus, deterioration often forms in the embankments and retaining walls due to lateral erosion of the river.
Second is the influence of cantilever-type abutments in the development of deterioration in some of the components that form the first and third bridge groups. The results indicate that cantilever-type abutments may lead to the development of deterioration in the steel girders and bridge decks of single-span bridges. The approach guard rail, retaining walls, and deck of bridges with more than four spans may also develop defects due to the same type of abutment. Cantilever-type abutments support 30.37% of single-span bridges and 55.68% of bridges with more than four spans. This could be because the effects of heavy rainfall and flooding have exceeded the existing design criteria set to build these abutments. Therefore, a review of the standards for the design and construction of cantilever-type abutments may be needed to mitigate the effects of extreme weather events.

5. Conclusions

The TBMS inventory and five-year inspection data of 2849 slab, girder, and box-girder bridges in the south–central region of Taiwan were analyzed using the KDD process to gain insight into their deterioration patterns. Using clustering and association algorithms, the bridges were arranged into clusters and then analyzed to discover the association between the inventory data and the deterioration of the bridge components within each cluster. This process generated association rules that suggest the bridge configurations that are likely to contribute to the deterioration of a specific component. Among the results, it was revealed that for single-span bridges, gravity-type abutments are more susceptible to deterioration than any other type. For bridges with two to three spans, their abutments and pier foundations have an 80% chance of developing deterioration if they include T-girder, semi-gravity abutment, and a length of 17.4 to 26.64 m. For bridges with more than four spans, deterioration in the approach embankment, approach guard rail, retaining walls, and bridge deck should be expected, particularly for bridges with a length and width of less than 386.64 m and 10.76 m, respectively. The deterioration patterns in the bridges analyzed reflect the effect of Taiwan’s topography and extreme natural events. These results can not only help bridge agencies plan their maintenance and inspection program, but also provide new insight for bridge designers in creating more resilient bridges.
As previously mentioned, the deterioration values of the components extracted from the TBMS inspection module were modified. To facilitate analysis, bridge components with recorded D values of 3 and 4 were replaced with a value of 2. Thus, only the occurrence of component deterioration (i.e., whether a component has deterioration or not) and not its severity (i.e., whether the deterioration is fair, bad, or serious) was considered in the analysis. Future research may incorporate the variances in the degree of deterioration of the bridge components to determine the bridge configuration and components most susceptible to severe deterioration.

Author Contributions

Conceptualization, Y.-H.C. and N.-J.Y.; methodology, Y.-H.C. and J.M.M.T.; software, Y.-H.C.; validation, Y.-H.C., N.-J.Y., and J.M.M.T.; formal analysis, Y.-H.C. and J.M.M.T.; investigation, Y.-H.C. and J.M.M.T.; resources, Y.-H.C. and N.-J.Y.; data curation, Y.-H.C. and J.M.M.T.; writing—original draft preparation, Y.-H.C.; writing—review and editing, N.-J.Y. and J.M.M.T.; supervision, N.-J.Y.; project administration, N.-J.Y.; funding acquisition, N.-J.Y. All authors have read and agreed to the published version of the manuscript.

Funding

This research received no external funding.

Data Availability Statement

Not applicable.

Acknowledgments

The authors would like to express their gratitude to the Department of Civil Engineering, National Central University, Taiwan, for their administrative support.

Conflicts of Interest

The authors declare no conflict of interest.

References

  1. Wu, C.; Wu, P.; Wang, J.; Jiang, R.; Chen, M.; Wang, X. Critical review of data-driven decision-making in bridge operation and maintenance. Struct. Infrastruct. Eng. 2020, 18, 47–70. [Google Scholar] [CrossRef]
  2. Yang, J.; Xiang, F.; Li, R.; Zhang, L.; Yang, X.; Jiang, S.; Zhang, H.; Wang, D.; Liu, X. Intelligent bridge management via big data knowledge engineering. Autom. Constr. 2022, 135, 104118. [Google Scholar] [CrossRef]
  3. Buchheit, R.B.; Garrett, J.H.; Lee, S.R.; Brahme, R. A Knowledge Discovery Framework for Civil Infrastructure: A Case Study of the Intelligent Workplace. Eng. Comput. 2000, 16, 264–274. [Google Scholar] [CrossRef]
  4. Fayyad, U.; Stolorz, P. Data mining and KDD: Promise and challenges. Futur. Gener. Comput. Syst. 1997, 13, 99–115. [Google Scholar] [CrossRef]
  5. Tan, P.-N.; Steinbach, M.; Karpatne, A.; Kumar, V. Introduction to Data Mining, 2nd ed.; Pearson: New York, NY, USA, 2019. [Google Scholar]
  6. Sun, L.; Shang, Z.; Xia, Y.; Bhowmick, S.; Nagarajaiah, S. Review of Bridge Structural Health Monitoring Aided by Big Data and Artificial Intelligence: From Condition Assessment to Damage Detection. J. Struct. Eng. 2020, 146, 04020073. [Google Scholar] [CrossRef]
  7. Radovic, M.; Ghonima, O.; Schumacher, T. Data Mining of Bridge Concrete Deck Parameters in the National Bridge Inventory by Two-Step Cluster Analysis. ASCE-ASME J. Risk Uncertain. Eng. Syst. Part A Civ. Eng. 2017, 3, F4016004. [Google Scholar] [CrossRef]
  8. Yan, H.; Yang, N.; Peng, Y.; Ren, Y. Data mining in the construction industry: Present status, opportunities, and future trends. Autom. Constr. 2020, 119, 103331. [Google Scholar] [CrossRef]
  9. Ng, H.S.; Toukourou, A.; Soibelman, L. Knowledge Discovery in a Facility Condition Assessment Database Using Text Clustering. J. Infrastruct. Syst. 2006, 12, 50–59. [Google Scholar] [CrossRef]
  10. Jin, X.; Wah, B.W.; Cheng, X.; Wang, Y. Significance and Challenges of Big Data Research. Big Data Res. 2015, 2, 59–64. [Google Scholar] [CrossRef]
  11. An, Y.; Chatzi, E.; Sim, S.; Laflamme, S.; Blachowski, B.; Ou, J. Recent progress and future trends on damage identification methods for bridge structures. Struct. Control. Health Monit. 2019, 26, e2416. [Google Scholar] [CrossRef]
  12. Mortagi, M.; Ghosh, J. Consideration of Climate Change Effects on the Seismic Life-Cycle Cost Analysis of Deteriorating Highway Bridges. J. Bridg. Eng. 2022, 27, 04021103. [Google Scholar] [CrossRef]
  13. Sony, S.; Gamage, S.; Sadhu, A.; Samarabandu, J. Multiclass Damage Identification in a Full-Scale Bridge Using Optimally Tuned One-Dimensional Convolutional Neural Network. J. Comput. Civ. Eng. 2022, 36, 04021035. [Google Scholar] [CrossRef]
  14. Abdelmaksoud, A.M.; Balomenos, G.P.; Becker, T.C. Parameterized Logistic Models for Bridge Inspection and Maintenance Scheduling. J. Bridg. Eng. 2021, 26, 04021072. [Google Scholar] [CrossRef]
  15. Chang, K.; Chi, S. Bridge Clustering for Systematic Recognition of Damage Patterns on Bridge Elements. J. Comput. Civ. Eng. 2019, 33, 04019028. [Google Scholar] [CrossRef]
  16. Diaz Arancibia, M.; Rugar, L.; Okumus, P. Role of Skew on Bridge Performance. Transp. Res. Rec. J. Transp. Res. Board 2020, 2674, 282–292. [Google Scholar] [CrossRef]
  17. Kim, Y.J.; Queiroz, L.B. Big Data for condition evaluation of constructed bridges. Eng. Struct. 2017, 141, 217–227. [Google Scholar] [CrossRef]
  18. Kim, Y.J.; Yoon, D.K. Identifying Critical Sources of Bridge Deterioration in Cold Regions through the Constructed Bridges in North Dakota. J. Bridg. Eng. 2010, 15, 542–552. [Google Scholar] [CrossRef]
  19. Li, T.; Alipour, M.; Harris, D.K. Mapping textual descriptions to condition ratings to assist bridge inspection and condition assessment using hierarchical attention. Autom. Constr. 2021, 129, 103801. [Google Scholar] [CrossRef]
  20. Martinez, P.; Mohamed, E.; Mohsen, O.; Mohamed, Y. Comparative Study of Data Mining Models for Prediction of Bridge Future Conditions. J. Perform. Constr. Facil. 2020, 34, 04019108. [Google Scholar] [CrossRef]
  21. Kim, H.; Soibelman, L.; Grobler, F. Factor selection for delay analysis using Knowledge Discovery in Databases. Autom. Constr. 2008, 17, 550–560. [Google Scholar] [CrossRef]
  22. Xia, Y.; Lei, X.; Wang, P.; Sun, L. A data-driven approach for regional bridge condition assessment using inspection reports. Struct. Control. Health Monit. 2021, 29, e2915. [Google Scholar] [CrossRef]
  23. Lei, X.; Xia, Y.; Deng, L.; Sun, L. A deep reinforcement learning framework for life-cycle maintenance planning of regional deteriorating bridges using inspection data. Struct. Multidiscip. Optim. 2022, 65, 149. [Google Scholar] [CrossRef]
  24. Alogdianakis, F.; Charmpis, D.C.; Balafas, I. Macroscopic effect of distance from seacoast on bridge deterioration—Statistical data assessment of structural condition recordings. Structures 2020, 27, 319–329. [Google Scholar] [CrossRef]
  25. Chang, J.-C. Natural hazards in Taiwan. Geojournal 1996, 38, 251–257. [Google Scholar] [CrossRef]
  26. Wang, H.; Hsieh, S.-C.; Lin, C.; Wang, C.-Y. Forensic Diagnosis on Flood-Induced Bridge Failure. I: Determination of the Possible Causes of Failure. J. Perform. Constr. Facil. 2014, 28, 76–84. [Google Scholar] [CrossRef]
  27. Luengo, J.; García-Gil, D.; Ramírez-Gallego, S.; García, S.; Herrera, F. Big Data Preprocessing: Enabling Smart Data; Springer: Cham, Switzerland, 2020. [Google Scholar]
  28. García, S.; Ramírez-Gallego, S.; Luengo, J.; Benítez, J.M.; Herrera, F. Big data preprocessing: Methods and prospects. Big Data Anal. 2016, 1, 9. [Google Scholar] [CrossRef] [Green Version]
  29. Han, J.; Kamber, M.; Pei, J. Data Mining: Concepts and Techniques, 3rd ed.; Elsevier: Amsterdam, The Netherlands, 2012. [Google Scholar]
  30. Xiao, F.; Fan, C. Data mining in building automation system for improving building operational performance. Energy Build. 2014, 75, 109–118. [Google Scholar] [CrossRef]
Figure 1. Knowledge discovery in databases (KDD) process [5].
Sustainability 15 01697 g001
Figure 2. Research flowchart.
Sustainability 15 01697 g002
Figure 3. Bridge clusters: (a) single-span bridges, (b) 2- to 3-span bridges, (c) ≥ 4-span bridges.
Sustainability 15 01697 g003
Table 1. DER&U evaluation criteria.
01234
DNot existingGoodFairBadSerious
E* U/I<10%10–30%30–60%Over 60%
RUncertainMinorLimitedMajorLarge
U N/ARoutineIn 3 years or under observationIn 1 yearImmediate
* U/I—unable to inspect, N/A—not applicable.
Table 2. Age distribution of bridges in Taiwan (from Taiwan’s National Statistical System for Vehicle Bridges).
Bridge AgeFreeway
Bridges
Highway
Bridges
Railway
Bridges
Country/County
Bridges
Total
<200022
2 to 106028542611998
11 to 201189311521923211
21 to 301526118221842457171
31 to 405172934040105130
>4058968957232575116
Unknown154511086618831
Table 3. Location and distribution of bridges covered in this study.
Bridge LocationSlabGirderBox Girder
Single
Span
2 to 3
Spans
≥4
Spans
Single
Span
2 to 3
Spans
≥4
Spans
Single
Span
2 to 3
Spans
≥4
Spans
Taichung City8117124514142233
Tainan City0186013242026
Kaohsiung City1263232639720103
Changhua County3830332613010
Yunlin County802755939400
Chiayi County2592622909635213
Pingtung County15340619910046211
Table 4. TBMS bridge-inventory attributes.
No.AttributeTypeContents
1DepartmentnvarcharTaichung City, Tainan City, Kaohsiung City, Changhua County, Yunlin County, Chiayi County, Pingtung County
2SectionnvarcharDajia District, Daan District, Dali District, Daya District, etc.
3RoutenvarcharPingtung 127, etc.
4Year builtintUnknown—2013
5Number of spansint1 to 44
6Lengthfloat6 to 1770 m
7Maximum span lengthfloat6 to 173 m
8Maximum net widthfloat1.74 to 80.25 m
9Slab areafloat12.4 to 72,216 m2
10Drivewayint1 to 10
11Bridge structurenvarcharSlab bridge, girder bridge, box-girder bridge
12Type of supportnvarcharSimple, fixed, continuous
13Material of girdernvarcharReinforced concrete, prestressed concrete, steel
14Type of girdernvarcharSlab, I-girder, T-girder, rectangular girder, box-girder
15Type of beamnvarcharI-beam, rectangular beam
16Type of abutmentnvarcharCantilever, gravity, semi-gravity
17Type of expansionnvarcharFinger plate, gai-top, etc.
18Type of bearingnvarcharSimple clamping, synthetic rubber, pot bearing, etc.
19Type of wingwallnvarcharCantilever, gravity, semi-gravity
20Type of pavementnvarcharReinforced concrete, asphalt concrete, others
Disclaimer/Publisher’s Note: The statements, opinions and data contained in all publications are solely those of the individual author(s) and contributor(s) and not of MDPI and/or the editor(s). MDPI and/or the editor(s) disclaim responsibility for any injury to people or property resulting from any ideas, methods, instructions or products referred to in the content.