
Sustainable e-Learning by Data Mining—Successful Results in a Chilean University
 , ,
, ,
Abstract
:1. Introduction
Problem Statement, Goal, and Contributions
- First, this article identifies potential variables for success or failure in e-learning programs, not only academic factors, through a systematic literature review.
- Second, this article defines a repeatable data mining application for identifying students’ success patterns in e-learning environments using a large set of data. This analysis was not feasible with other methods.
- Third, this article provides a utilization example of multi-year historical data starting when e-learning programs began being a phenomenon in Chile and other countries (the year 2000). Other institutions in the region could repeat this application.
2. e-Learning and Data Mining
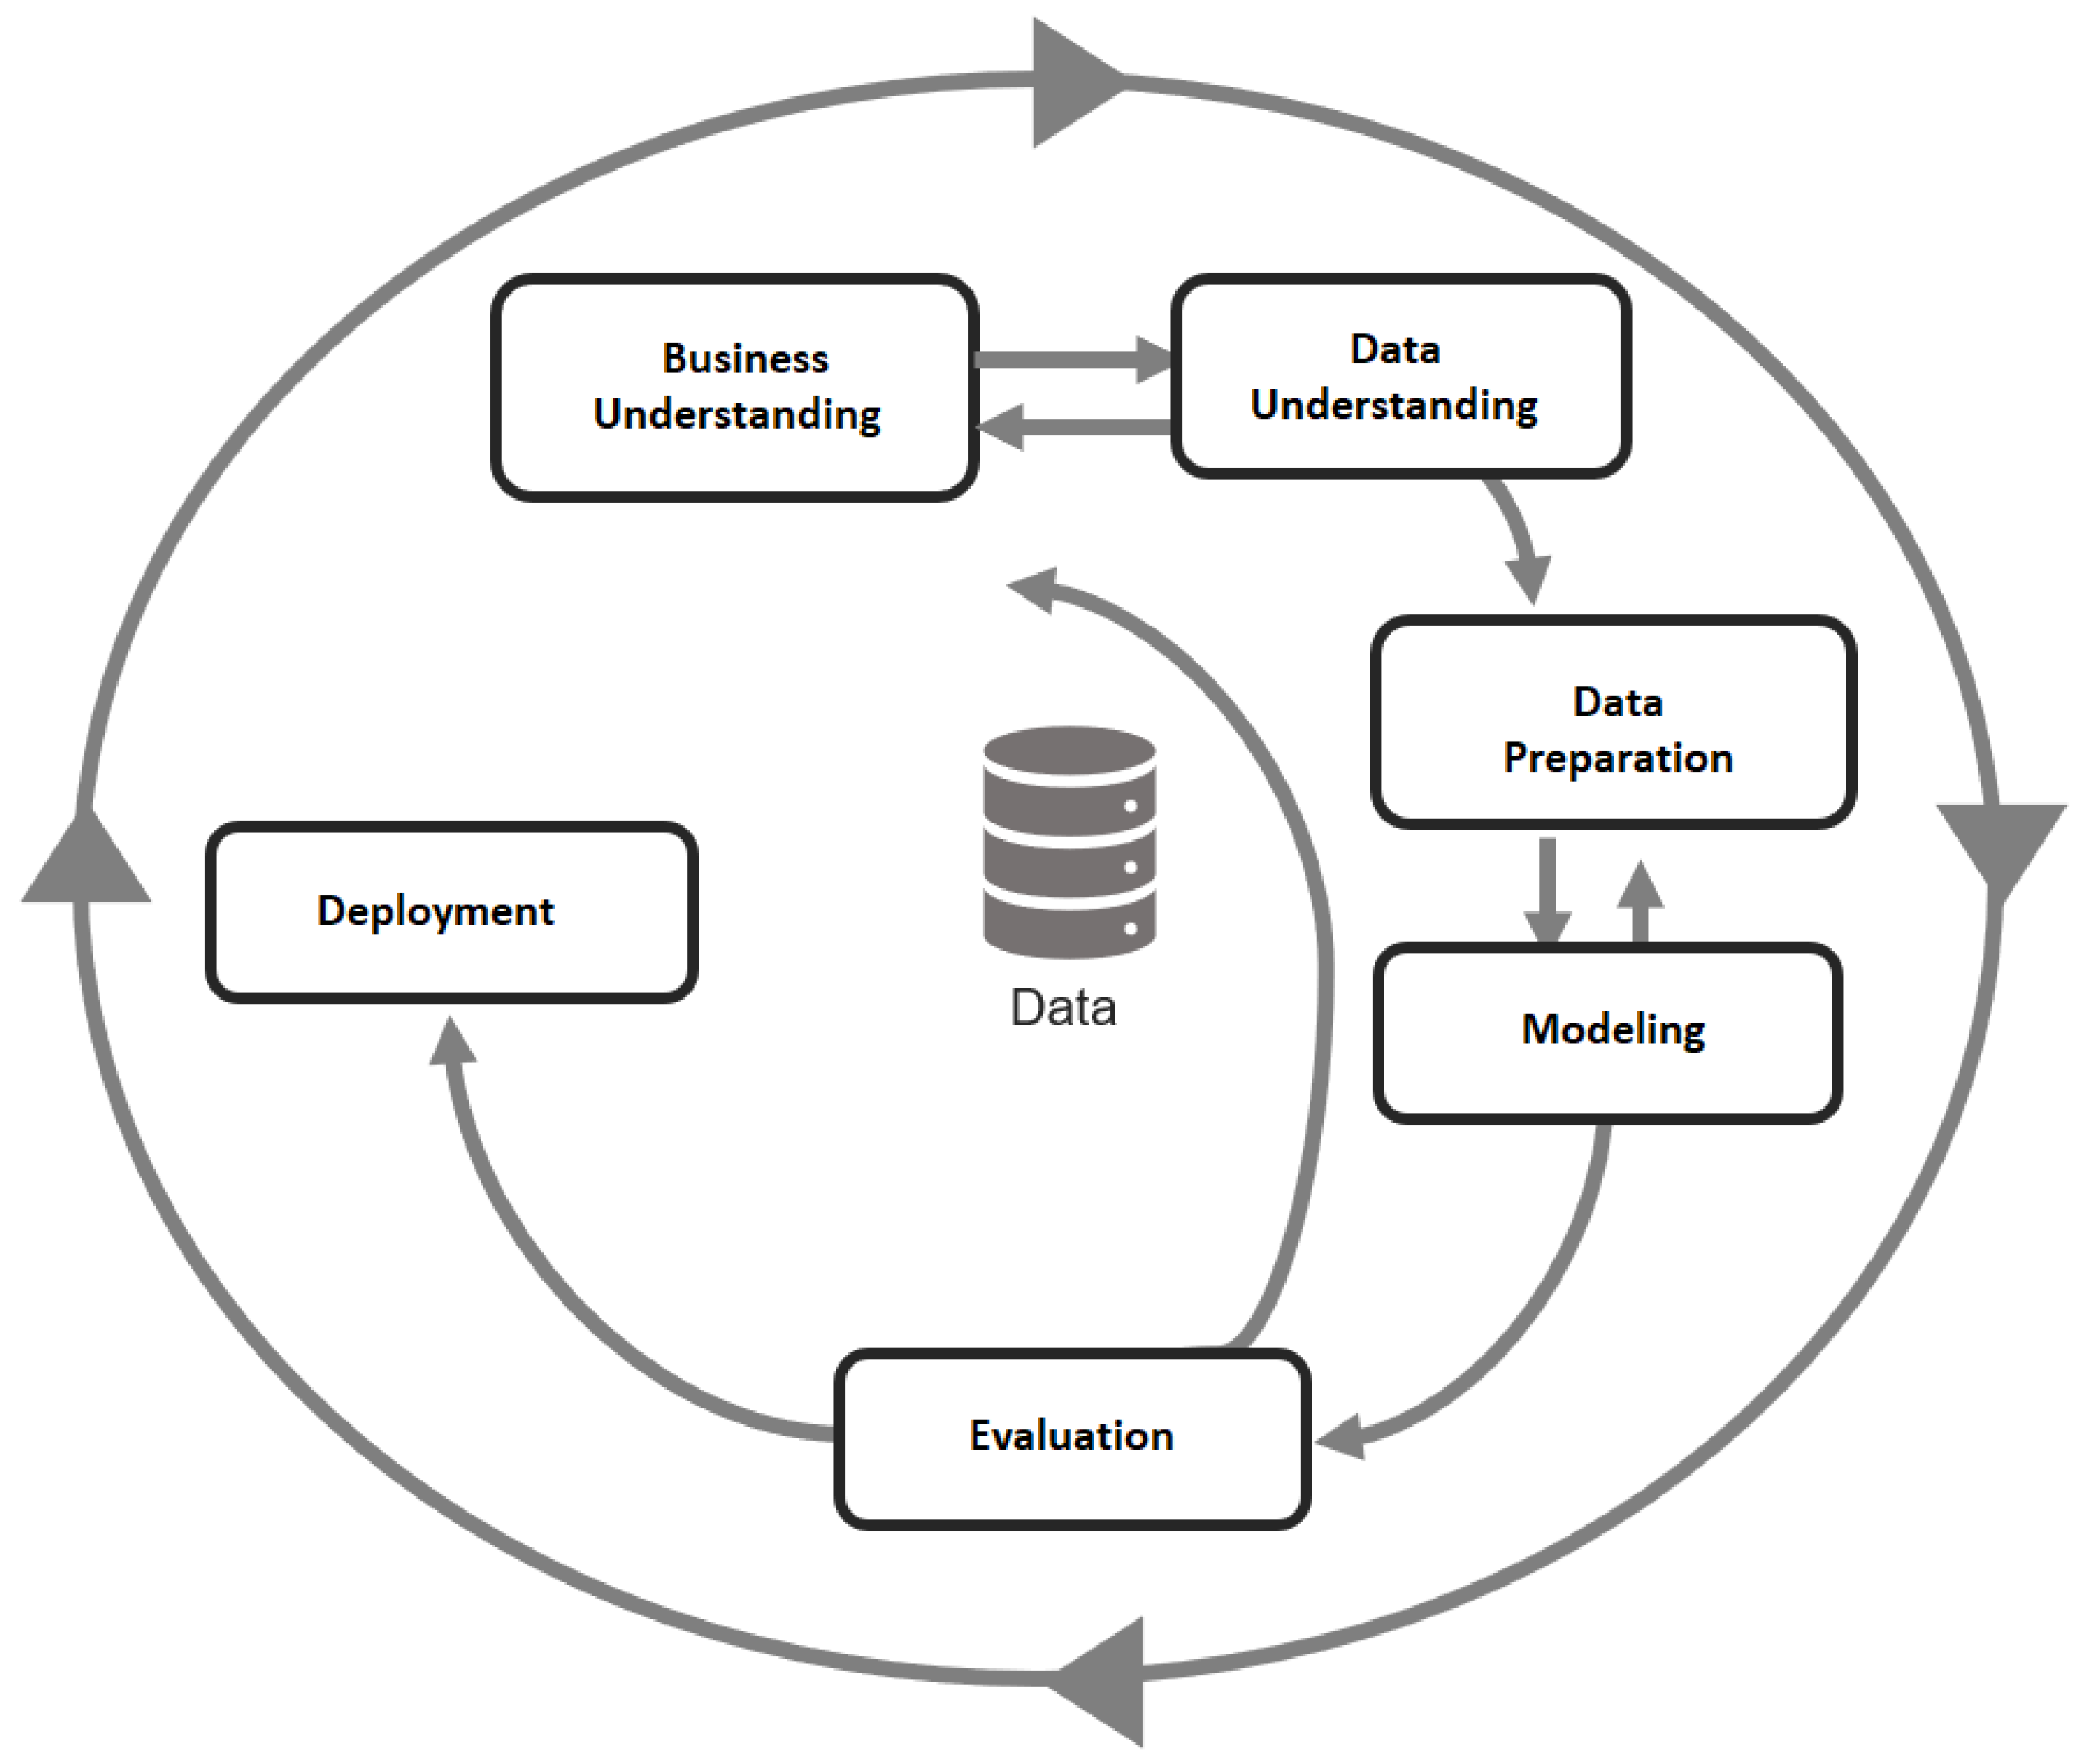
2.1. CRISP-DM
- Business Understanding Phase: The first phase analysis of the problem includes understanding the project’s objectives and requirements from a business or institutional perspective.
- Data Comprehension Phase: The second phase of data analysis includes the initial data collection, identifying the quality of the data.
- Data Preparation Phase: This phase includes general data selection tasks for applying modeling techniques (variables and samples), data cleaning, generation of additional variables, integration of different data sources, and format changes.
- Modeling Phase: In this phase, selecting the most appropriate modeling techniques takes place to generate and evaluate the model. The parameters used in the model generation depend on the characteristics of the data.
- Evaluation Phase: In the evaluation phase, the model is evaluated, not from the data point of view, but for fulfilling the problem’s success criteria. If the generated model is valid based on the success established in the first phase, the model is exploited.
- Implementation Phase: At this stage, in addition to the implementation of the model, the results must be presented and documented understandably, to achieve an increase in knowledge.
2.2. Data Mining Techniques
- Naive Bayes: It is based on Bayes theorem with an assumption of independence among predictors. It assumes that the presence of a particular feature in a class is unrelated to the presence of any other feature. Naïve Bayes mainly targets the text classification industry. It is mainly used for clustering and classification purposes depending on the conditional probability of happening [36].
- Random Forest: This classifier combines prediction trees in which a hierarchical division of the underlying data space is sustained. In the hierarchical division of the data space, comment partitions are created that are more skewed in terms of their distribution of terms [37].
- AdaBoost: The name is an acronym for Adaptive Boosting and it is a meta-algorithm. This algorithm supports a distribution or set of weights over the training set. Initially, all weights equally set, but on each round, the weights of incorrectly classified samples are increased then the weak learner focuses on these samples. AdaBoost originally ability to minimize the error, and maximize the margin with respect to features [38].
- Decision Trees (J48): The J48 algorithm builds a decision tree that classifies the class attribute based on the input attributes. The algorithm is based on the C4.5 algorithm developed by Quinlan [39]. The algorithm uses a greedy search method to create decision trees and allows changing different parameters to obtain a better classification accuracy [40].
- Neural Networks: The development of the neural network uses a non-linear optimization model. Unlike other analyses, it is not easy to interpret clearly, unlike the results and parameters provided by other analyses. For the construction of the classifier used in this research, the multilayer perceptron neural network was used, which builds a neural network in the form of a waterfall, which has one or more hidden layers [41].
2.3. Data Mining in Education
3. Methodology
3.1. Institution Background
3.2. Selection and Understanding of Data
3.3. Data Preparation
- Data selection and cleaning: first, we selected the data attributes, considering the objective and data quality problems. As a result, we selected the following tables and attributes: (i) STUDENT (RUT of the student, sex, date of birth, profession, nationality, marital status, education); (ii) STUDENT_ADDRESS (RUT of the student, commune, city); (iii) PROGRAM (name of the program, date of registration, type of program); (iv) STUDENT_PROGRAM (RUT of the student, academic situation, final grade of the program). For the analysis, we followed the next filter: Students who enrolled in the programs between 2000 and 2018 (enrollment date 2000) and (enrollment date 2018)).
- Data Quality: a problem presented by the data is the amount of missing data in some of them, such as the program’s attribute name. We decided to keep the records with unknown values because their elimination results in excluding rows with valid values in the objective set. Moreover, we faced data categorization because the applied techniques for the analysis (classification) mainly use categorical data to facilitate their construction and interpretation.
- Construction of the Data: to fulfill the project’s objective, an attribute called region was created, which derives from the attribute commune and city. The region attribute takes the value corresponding to the region that the commune and city belong to. When the data selection and construction process was complete, the changes were saved to the files for their use later in the modeling stage. The new files are in SPSS format.
3.4. Modeling
4. Results
5. Discussion
6. Conclusions, Recommendation, and Future Work
- The use of educational data mining, particularly the CRISP-DM methodology, greatly contributes to systematization and efficiency in identifying patterns in the data of distance education. The study allowed us to systematize the data in various sources and formats of the distance education platform in the institution under study (DEC-UCN) and provide valuable information for future analyses in this context.
- Data mining tools can present more significant advantages than purely statistical tools since they are exploratory, allowing working with different dimensions of the same problem. It is also essential to highlight the possibility and flexibility of these analysis tools to allow us to work with categorical and numerical variables in the same analysis.
- The performance analysis of the different classification algorithms indicated that the random forest and decision tree algorithms were the ones that allowed a better prediction of results and, therefore, identified the variables that could better explain the performance of students in e-learning programs. The decision tree proved to be a beneficial tool to find relationships between variables unidentified by previously used analysis tools, mainly because a decision tree uses techniques less restrictive than statistics. Those techniques do not require, for example, conditions of data normality and are tolerant of noise in the data.
Author Contributions
Funding
Institutional Review Board Statement
Informed Consent Statement
Data Availability Statement
Conflicts of Interest
References
- Coman, C.; Țîru, L.G.; Meseșan-Schmitz, L.; Stanciu, C.; Bularca, M.C. Online teaching and learning in higher education during the coronavirus pandemic: Students’ perspective. Sustainability 2020, 12, 10367. [Google Scholar] [CrossRef]
- Koedinger, K.R.; D’Mello, S.; McLaughlin, E.A.; Pardos, Z.A.; Rosé, C.P. Data mining and education. WIREs Cogn. Sci. 2015, 6, 333–353. [Google Scholar] [CrossRef] [PubMed]
- Asín, A.; Peinado, J.; Jurado, P. La sociedad del conocimiento y las TICs: Una inmejorable oportunidad para el cambio docente. In Pixel-Bit: Revista de Medios y Educación Nº 34; Universidad de Sevilla: Seville, Spain, 2009; pp. 179–204. ISSN 1133-8482. [Google Scholar]
- Delone, W.H.; McLean, E.R. The DeLone and McLean Model of Information Systems Success: A Ten-Year Update. J. Manag. Inf. Syst. 2003, 19, 9–30. [Google Scholar]
- Alsabawy, A.; Cater-Steel, A.; Soar, J. A Model to Measure E-Learning Systems Success. Meas. Organ. Inf. Syst. Success New Technol. Pract. 2012, 39, 293–317. [Google Scholar] [CrossRef] [Green Version]
- Herrera, M.; Ruiz, S.; Romagnano, M.R.; Ganga, L.; Lund, M.I.; Torres, E. Aplicando métodos y técnicas de la ciencia de los datos a datos universitarios. In Proceedings of the XXI Workshop de Investigadores en Ciencias de la Computación WICC 2019, Universidad Nacional de San Juan, San Jose, Argentina, 21 October 2019. [Google Scholar]
- Martínez-Plumed, F.; Contreras-Ochando, L.; Ferri, C.; Hernández Orallo, J.; Kull, M.; Lachiche, N.; Ramírez Quintana, M.J.; Flach, P.A. CRISP-DM Twenty Years Later: From Data Mining Processes to Data Science Trajectories. IEEE Trans. Knowl. Data Eng. 2019, 33, 3048–3061. [Google Scholar] [CrossRef] [Green Version]
- Hussin, W.N.T.W.; Harun, J.; Shukor, N.A. A Review on the Classification of Students’ Interaction in Online Social Collaborative Problem-based Learning Environment: How Can We Enhance the Students’ Online Interaction? Univ. J. Educ. Res. 2019, 7, 125–134. [Google Scholar] [CrossRef]
- Fukuzawa, S.; Cahn, J. Technology in problem-based learning: Helpful or hindrance? Int. J. Inf. Learn. Technol. 2019, 36, 66–76. [Google Scholar] [CrossRef]
- Valverde-Berrocoso, J.; Garrido-Arroyo, M.d.C.; Burgos-Videla, C.; Morales-Cevallos, M.B. Trends in educational research about e-learning: A systematic literature review (2009–2018). Sustainability 2020, 12, 5153. [Google Scholar] [CrossRef]
- Ocaña, J.M.; Morales-Urrutia, E.K.; Pérez-Marín, D.; Pizarro, C. Can a learning companion be used to continue teaching programming to children even during the COVID-19 pandemic? IEEE Access 2020, 8, 157840–157861. [Google Scholar] [CrossRef]
- Palacios, C.A.; Reyes-Suárez, J.A.; Bearzotti, L.A.; Leiva, V.; Marchant, C. Knowledge Discovery for Higher Education Student Retention Based on Data Mining: Machine Learning Algorithms and Case Study in Chile. Entropy 2021, 23, 485. [Google Scholar] [CrossRef]
- Gao, P.; Wu, W.; Yang, Y. Discovering Themes and Trends in Digital Transformation and Innovation Research. J. Theor. Appl. Electron. Commer. Res. 2022, 17, 1162–1184. [Google Scholar] [CrossRef]
- Fayyad, U.; Piatetsky-Shapiro, G.; Smyth, P. From data mining to knowledge discovery in databases. AI Mag. 1996, 17, 37. [Google Scholar]
- Nájera, A.B.U.; de la Calleja Mora, J. Brief review of educational applications using data mining and machine learning. Redie. Rev. Electrón. Investig. Educ. 2017, 19, 84–96. [Google Scholar]
- Cummins, M.R. Nonhypothesis-driven research: Data mining and knowledge discovery. In Clinical Research Informatics; Springer: Berlin/Heidelberg, Germany, 2019; pp. 341–356. [Google Scholar]
- Sugiyarti, E.; Jasmi, K.A.; Basiron, B.; Huda, M.; Shankar, K.; Maseleno, A. Decision support system of scholarship grantee selection using data mining. Int. J. Pure Appl. Math. 2018, 119, 2239–2249. [Google Scholar]
- Witten, I.H.; Frank, E. Data mining: Practical machine learning tools and techniques with Java implementations. ACM Sigmod Rec. 2002, 31, 76–77. [Google Scholar] [CrossRef]
- Ngo, T. Data mining: Practical machine learning tools and technique, by ian h. witten, eibe frank, mark a. hell. ACM SIGSOFT Softw. Eng. Notes 2011, 36, 51–52. [Google Scholar] [CrossRef]
- Scheuer, O.; McLaren, B.M. Educational data mining. Encycl. Sci. Learn. 2012, 1075, 1079. [Google Scholar]
- Hernández-Blanco, A.; Herrera-Flores, B.; Tomás, D.; Navarro-Colorado, B. A systematic review of deep learning approaches to educational data mining. Complexity 2019, 2019, 1306039. [Google Scholar] [CrossRef]
- Cengiz, M.; Birant, K.U.; Yildirim, P.; Birant, D. Development of an interactive game-based learning environment to teach data mining. Int. J. Eng. Educ. 2017, 33, 1598–1617. [Google Scholar]
- Almaiah, M.A.; Almulhem, A. A conceptual framework for determining the success factors of e-learning system implementation using Delphi technique. J. Theor. Appl. Inf. Technol. 2018, 96, 5962–5976. [Google Scholar]
- Almaiah, M.A.; Alyoussef, I.Y. Analysis of the effect of course design, course content support, course assessment and instructor characteristics on the actual use of E-learning system. IEEE Access 2019, 7, 171907–171922. [Google Scholar] [CrossRef]
- Almaiah, M.A.; Alismaiel, O.A. Examination of factors influencing the use of mobile learning system: An empirical study. Educ. Inf. Technol. 2019, 24, 885–909. [Google Scholar] [CrossRef]
- Almaiah, M.A.; Al-Khasawneh, A.; Althunibat, A. Exploring the critical challenges and factors influencing the E-learning system usage during COVID-19 pandemic. Educ. Inf. Technol. 2020, 25, 5261–5280. [Google Scholar] [CrossRef] [PubMed]
- Hendrickx, T.; Cule, B.; Meysman, P.; Naulaerts, S.; Laukens, K.; Goethals, B. Mining Association Rules in Graphs Based on Frequent Cohesive Itemsets. In Proceedings of the Advances in Knowledge Discovery and Data Mining; Cao, T., Lim, E.P., Zhou, Z.H., Ho, T.B., Cheung, D., Motoda, H., Eds.; Springer International Publishing: Cham, Switzerland, 2015; pp. 637–648. [Google Scholar]
- Moro, S.; Cortez, P.; Laureano, R. Using Data Mining for Bank Direct Marketing: An Application of the CRISP-DM Methodology; EUROSIS-ETI: Ostend, Belgium, 2011. [Google Scholar]
- Ghazal, M.M.; Hammad, A. Application of knowledge discovery in database (KDD) techniques in cost overrun of construction projects. Int. J. Constr. Manag. 2022, 22, 1632–1646. [Google Scholar] [CrossRef]
- Hand, D.J.; Smyth, P.; Mannila, H. Principles of Data Mining; MIT Press: Cambridge, MA, USA, 2001. [Google Scholar]
- Dåderman, A.; Rosander, S. Evaluating Frameworks for Implementing Machine Learning in Signal Processing: A Comparative Study of CRISP-DM, SEMMA and KDD; KTH, School of Electrical Engineering and Computer Science (EECS): Stockholm, Sweden, 2018. [Google Scholar]
- Wiemer, H.; Drowatzky, L.; Ihlenfeldt, S. Data Mining Methodology for Engineering Applications (DMME)—A Holistic Extension to the CRISP-DM Model. Appl. Sci. 2019, 9, 2407. [Google Scholar] [CrossRef] [Green Version]
- Wirth, R.; Hipp, J. CRISP-DM: Towards a standard process model for data mining. In Proceedings of the 4th International Conference on the Practical Applications of Knowledge Discovery and Data Mining, Manchester, UK, 11–13 April 2000; Volume 1, pp. 29–39. [Google Scholar]
- Phyu, T.N. Survey of classification techniques in data mining. In Proceedings of the International Multiconference of Engineers and Computer Scientists, London, UK, 1–3 July 2009; Volume 1. [Google Scholar]
- Soofi, A.A.; Awan, A. Classification techniques in machine learning: Applications and issues. J. Basic Appl. Sci. 2017, 13, 459–465. [Google Scholar] [CrossRef]
- Mahesh, B. Machine learning algorithms-a review. Int. J. Sci. Res. (IJSR) 2020, 9, 381–386. [Google Scholar]
- Phan, T.N.; Kuch, V.; Lehnert, L.W. Land Cover Classification using Google Earth Engine and Random Forest Classifier—The Role of Image Composition. Remote Sens. 2020, 12, 2411. [Google Scholar] [CrossRef]
- Hameed, K.; Chai, D.; Rassau, A. A sample weight and adaboost cnn-based coarse to fine classification of fruit and vegetables at a supermarket self-checkout. Appl. Sci. 2020, 10, 8667. [Google Scholar] [CrossRef]
- Quinlan, J. C4.5: Programs for Machine Learning; Ebrary online; Elsevier Science: Amsterdam, The Netherlands, 2014. [Google Scholar]
- Badawi, S.A.Q.; Takruri, M.; Albadawi, Y.; Khattak, M.A.K.; Nileshwar, A.K.; Mosalam, E. Four Severity Levels for Grading the Tortuosity of a Retinal Fundus Image. J. Imaging 2022, 8, 258. [Google Scholar] [CrossRef]
- Chaves, L.; Marques, G. Data mining techniques for early diagnosis of diabetes: A comparative study. Appl. Sci. 2021, 11, 2218. [Google Scholar] [CrossRef]
- Martínez-Cerdá, J.F.; Torrent-Sellens, J.; González-González, I. Socio-technical e-learning innovation and ways of learning in the ICT-space-time continuum to improve the employability skills of adults. Comput. Hum. Behav. 2020, 107, 105753. [Google Scholar] [CrossRef]
- Pozón-López, I.; Kalinic, Z.; Higueras-Castillo, E.; Liébana-Cabanillas, F. A multi-analytical approach to modeling of customer satisfaction and intention to use in Massive Open Online Courses (MOOC). Interact. Learn. Environ. 2020, 28, 1003–1021. [Google Scholar] [CrossRef]
- Gilar-Corbi, R.; Pozo-Rico, T.; Castejón, J.L. Desarrollando la Inteligencia Emocional en Educación Superior: Evaluación de la Efectividad de un Programa en tres Países; Universidad Nacional de Educación a Distancia (España): Madrid, Spain, 2019. [Google Scholar]
- Wani, H.A. The relevance of e-learning in higher education. ATIKAN 2013, 3. [Google Scholar]
- Meskhi, B.; Ponomareva, S.; Ugnich, E. E-learning in higher inclusive education: Needs, opportunities and limitations. Int. J. Educ. Manag. 2019, 33, 424–437. [Google Scholar] [CrossRef]
- Saqr, M.; Alamro, A. The role of social network analysis as a learning analytics tool in online problem based learning. BMC Med. Educ. 2019, 19, 160. [Google Scholar] [CrossRef] [PubMed] [Green Version]
- Al-Fraihat, D.; Joy, M.; Sinclair, J. Evaluating E-learning systems success: An empirical study. Comput. Hum. Behav. 2020, 102, 67–86. [Google Scholar] [CrossRef]
- Romi, I.M. A Model for e-Learning Systems Success: Systems, Determinants, and Performance; Palestine Polytechnic University: Hebron, Palestinian, 2017. [Google Scholar]
- Hayashi, A.; Chen, C.; Ryan, T.; Wu, J. The role of social presence and moderating role of computer self efficacy in predicting the continuance usage of e-learning systems. J. Inf. Syst. Educ. 2020, 15, 5. [Google Scholar]
- Damabi, M.; Firoozbakht, M.; Ahmadyan, A. A Model for Customers Satisfaction and Trust for Mobile Banking Using DeLone and McLean Model of Information Systems Success. J. Soft Comput. Decis. Support Syst. 2018, 5, 21–28. [Google Scholar]
- Donovan, E.; Guzman, I.R.; Adya, M.; Wang, W. A Cloud Update of the DeLone and McLean Model of Information Systems Success. J. Inf. Technol. Manag. 2018, 29, 23–34. [Google Scholar]
- Németh, T. How to back up Modules with blended learning The e-Learning platform of FAME. Prosperitas 2019, 6, 102–141. [Google Scholar] [CrossRef]
- Radha, S.; Michael Mariadhas, J.; Subramani, A.; Akbar Jan, N. Role of e-learning and digital media resources in employability of management students. Online J. Distance Educ. e-Learn. 2019, 7, 116–123. [Google Scholar]
- Cidral, W.A.; Oliveira, T.; Di Felice, M.; Aparicio, M. E-learning success determinants: Brazilian empirical study. Comput. Educ. 2018, 122, 273–290. [Google Scholar] [CrossRef]
- García Aretio, L. El problema del abandono en estudios a distancia. Respuestas desde el Diálogo Didáctico Mediado. RIED. Rev. Iberoam. Educ. Distancia 2019, 22, 245–270. [Google Scholar] [CrossRef]
- Weinberg, S.L.; Abramowitz, S.K. Statistics Using IBM SPSS: An Integrative Approach, 3rd ed.; Cambridge University Press: Cambridge, CA, USA, 2016. [Google Scholar]
- Li, M.; Xu, H.; Deng, Y. Evidential Decision Tree Based on Belief Entropy. Entropy 2019, 21, 897. [Google Scholar] [CrossRef] [Green Version]
- Zhao, L.; Lee, S.; Jeong, S.P. Decision Tree Application to Classification Problems with Boosting Algorithm. Electronics 2021, 10, 1903. [Google Scholar] [CrossRef]
- Chiu, Y.P. Social Recommendations for Facebook Brand Pages. J. Theor. Appl. Electron. Commer. Res. 2021, 16, 71–84. [Google Scholar] [CrossRef]
- Hossin, M.; Sulaiman, M.N. A review on evaluation metrics for data classification evaluations. Int. J. Data Min. Knowl. Manag. Process 2015, 5, 1. [Google Scholar]
- Nhu, V.H.; Janizadeh, S.; Avand, M.; Chen, W.; Farzin, M.; Omidvar, E.; Shirzadi, A.; Shahabi, H.; Clague, J.; Jaafari, A.; et al. Gis-based gully erosion susceptibility mapping: A comparison of computational ensemble data mining models. Appl. Sci. 2020, 10, 2039. [Google Scholar] [CrossRef] [Green Version]
- Tsiakmaki, M.; Kostopoulos, G.; Kotsiantis, S.; Ragos, O. Implementing AutoML in educational data mining for prediction tasks. Appl. Sci. 2019, 10, 90. [Google Scholar] [CrossRef] [Green Version]
- Chicco, D.; Jurman, G. Machine learning can predict survival of patients with heart failure from serum creatinine and ejection fraction alone. BMC Med. Inform. Decis. Mak. 2020, 20, 1–16. [Google Scholar] [CrossRef] [PubMed] [Green Version]
- Jiménez-Valverde, A. Insights into the area under the receiver operating characteristic curve (AUC) as a discrimination measure in species distribution modelling. Glob. Ecol. Biogeogr. 2012, 21, 498–507. [Google Scholar] [CrossRef]
- Soria-Barreto, K.; Ruiz-Campo, S.; Al-Adwan, A.S.; Zuniga-Jara, S. University students intention to continue using online learning tools and technologies: An international comparison. Sustainability 2021, 13, 13813. [Google Scholar] [CrossRef]


| Metric | Definition |
|---|---|
| Precision | It is used to measure the positive patterns that are correctly predicted from the total predicted patterns in a positive class [62]. |
| Recall | It permits to measure the fraction of positive patterns that are correctly classified [62]. |
| Accuracy | It measures the ratio of correct predictions over the total number of instances evaluated [63]. |
| F1 | Metric that represents the harmonic mean between recall and precision values [41]. |
| Matthew’s correlation coefficient (MCC) | Measure that is not affected by the dataset problem of being unbalanced. MCC is a correlation coefficient between observed and predicted binary rankings; returns a value between and . A coefficient of represents a perfect prediction, 0 is no better than a random prediction, and indicates complete disagreement between prediction and observation [64]. |
| ROC curve | It is a graphic representation of the relationship between the true-positive and false-positive ratios of the classifier. The area under the ROC curve provides an approach to evaluate which model is better on average. A model will be considered to discriminate better than chance if the curve lies above the diagonal of no discrimination, i.e., if the AUC is higher than [65]. |
| Program | Frequency | Percentage |
|---|---|---|
| Human Resources Management | 1996 | 10.7 |
| Environmental Management | 1617 | 8,7 |
| Family Mediation | 1506 | 8.1 |
| Psychopedagogy | 1499 | 8.0 |
| Total Quality Management Total | 1169 | 6.3 |
| Integrated Management: Quality. Environment. and Safety | 1009 | 5.4 |
| Educational Orientation | 894 | 4.8 |
| Higher Education | 648 | 3.5 |
| Education and Professional Technical High School Teacher | 545 | 2.9 |
| Primary Education Teacher with a Minor in NB1 and NB2 | 509 | 2.7 |
| Family Counseling | 507 | 2.7 |
| Behavioral Management Techniques Applied to Children and Adolescents | 499 | 2.7 |
| Education and Primary Education Teacher | 467 | 2.5 |
| Criminal Procedural Law: “Accusatory System or Oral Trial” | 446 | 2.4 |
| Communication and Language Disorder | 418 | 2.2 |
| Educational Administration | 402 | 2.2 |
| Administration of Technical-Pedagogical Units | 388 | 2.1 |
| Preparation and Evaluation of Investment Projects | 326 | 1.7 |
| Minor in Language and Communication for Teachers of the Second Cycle of Language and Communication | 292 | 1.6 |
| Minor in Education in Mathematics for Teachers of the Second Cycle of Basic General Education | 247 | 1.3 |
| Degree in Education and Primary Education Teacher | 237 | 1.3 |
| Management in Corporate Communication | 179 | 1.0 |
| Continuous Improvement | 173 | 0.9 |
| Higher level in Executive Secretariat | 154 | 0.8 |
| Mathematics Education for Primary Education Teachers | 145 | 0.8 |
| Pedagogical Management for Higher Level Technical Training | 129 | 0.7 |
| Formulation and evaluation of projects | 98 | 0.5 |
| Others | 2180 | 11.6 |
| Sample | Predicted | |||||||
|---|---|---|---|---|---|---|---|---|
| Act | Rem | Abn | Trans | Grad | Cert | Correct % | ||
| Training | Active (Act) | 0 | 2 | 0 | 0 | 0 | 34 | 0.0% |
| Removed (Rem) | 0 | 6102 | 0 | 0 | 0 | 1140 | 84.3% | |
| Abnegated (Abn) | 0 | 426 | 0 | 0 | 0 | 20 | 0.0% | |
| Transferred (Trans) | 0 | 17 | 0 | 0 | 0 | 3 | 0.0% | |
| Graduated (Grad) | 0 | 302 | 0 | 0 | 0 | 201 | 0.0% | |
| Certified (Cert) | 0 | 2906 | 0 | 0 | 0 | 1720 | 37.2% | |
| Overall % | 0.0% | 75.8% | 0.0% | 0.0% | 0.0% | 24.2% | 60.8% | |
| Testing | Active (Act) | 0 | 2 | 0 | 0 | 0 | 16 | 0.0% |
| Removed (Rem) | 0 | 2565 | 0 | 0 | 0 | 479 | 84.3% | |
| Abnegated (Abn) | 0 | 181 | 0 | 0 | 0 | 8 | 0.0% | |
| Transferred (Trans) | 0 | 13 | 0 | 0 | 0 | 0 | 0.0% | |
| Graduated (Grad) | 0 | 103 | 0 | 0 | 0 | 97 | 0.0% | |
| Certified (Cert) | 0 | 1300 | 0 | 0 | 0 | 753 | 36.7% | |
| Overall % | 0.0% | 75.0% | 0.0% | 0.0% | 0.0% | 24.5% | 60.2% | |
| TP Rate | FP Rate | Precision | Recall | F-Measure | MCC | ROC Area | PRC Area | |
|---|---|---|---|---|---|---|---|---|
| AdaBoostM1 | 0.622 | 0.532 | 0.593 | 0.622 | 0.574 | 0.118 | 0.543 | 0.559 |
| Naïve Bayes | 0.617 | 0.616 | 0.548 | 0.617 | 0.475 | 0.007 | 0.535 | 0.554 |
| Random Forest | 0.645 | 0.435 | 0.634 | 0.645 | 0.636 | 0.222 | 0.652 | 0.658 |
| TREE J.48 | 0.643 | 0.494 | 0.625 | 0.643 | 0.607 | 0.184 | 0.604 | 0.609 |
Disclaimer/Publisher’s Note: The statements, opinions and data contained in all publications are solely those of the individual author(s) and contributor(s) and not of MDPI and/or the editor(s). MDPI and/or the editor(s) disclaim responsibility for any injury to people or property resulting from any ideas, methods, instructions or products referred to in the content. |
© 2023 by the authors. Licensee MDPI, Basel, Switzerland. This article is an open access article distributed under the terms and conditions of the Creative Commons Attribution (CC BY) license (https://creativecommons.org/licenses/by/4.0/).
Share and Cite
Sánchez, A.; Vidal-Silva, C.; Mancilla, G.; Tupac-Yupanqui, M.; Rubio, J.M. Sustainable e-Learning by Data Mining—Successful Results in a Chilean University. Sustainability 2023, 15, 895. https://doi.org/10.3390/su15020895
Sánchez A, Vidal-Silva C, Mancilla G, Tupac-Yupanqui M, Rubio JM. Sustainable e-Learning by Data Mining—Successful Results in a Chilean University. Sustainability. 2023; 15(2):895. https://doi.org/10.3390/su15020895
Chicago/Turabian StyleSánchez, Aurora, Cristian Vidal-Silva, Gabriela Mancilla, Miguel Tupac-Yupanqui, and José M. Rubio. 2023. "Sustainable e-Learning by Data Mining—Successful Results in a Chilean University" Sustainability 15, no. 2: 895. https://doi.org/10.3390/su15020895