Article

Public Behavior in Urban Parks during Pandemics as a Foundation for Risk Assessment by Park Managers: A Case Study in Saudi Arabia

by
Farouk Daghistani
Department of Landscape Architecture, Faculty of Architecture and Planning, King Abdulaziz University, Jeddah 21589, Saudi Arabia
Sustainability 2023, 15(2), 904; https://doi.org/10.3390/su15020904
Submission received: 16 November 2022 / Revised: 21 December 2022 / Accepted: 30 December 2022 / Published: 4 January 2023

Abstract

:
Accessing parks without transmitting viruses would ensure not depriving people of parks’ health benefits during pandemics. This study attempts to develop a practical tool for park managers to assess the risk of contracting respiratory contagious illnesses, decide on meaningful mitigation measures, and monitor the effect of these measures. The assessment is based on the spatial and temporal behaviors of users at each park open space type (POST), particularly the behaviors that may impact the risk of illness transmission. The researcher created a checklist, including five factors relating to users: physical distancing, density, duration of stay, percentage of users wearing masks, and frequency of surface touch; then, the implementation of the tool was demonstrated by selecting a sample zone from Jeddah waterfront park, Saudi Arabia, while COVID-19 was active. User behavior data were collected at the POSTs of the sample zone, using behavioral mapping and tracking methods. After analyzing the data using ArcGIS Desktop and SPSS Statistics software, the data were used to fill out the composed checklist to assess the risk at POSTs. The findings indicated that the waterfront railing area, playground, and pier were the POSTs with the highest risk. By using the checklist, park managers can contribute to the success of non-pharmaceutical mitigation interventions at a local scale.

1. Introduction

Access to public parks plays a significant role in increasing users’ physical activities [1], reducing stress levels, and improving mental health and wellbeing [2]. During respiratory pandemics, access to parks is debatable, due to the risk of illness transmission. Several studies have underlined the need for accessing green spaces for relieving symptoms, such as fatigue and depression, caused by the adopted measures for controlling the transmission of illness. In the study [3] in Bulgaria, the findings indicated that university students who stayed home during COVID-19 experienced better mental health when exposed to greenery. Moreover, the study [4] used a survey distributed online (with 6080 valid responses from 77 countries) and found that getting in touch with green/blue spaces helped people to cope better with lockdown measures. The study concluded that lockdown severity is positively associated with poor mental health. However, other studies argued that higher accessibility to public parks during pandemics promotes interaction between people, thus increasing the potential risk of transmission. The study [5] explored the distributive effects of accessibility of public green spaces on the COVID-19 cases distribution in London. The results indicated that higher accessibility to such spaces would lead to higher likelihood of infection.
Considering this conflict, suggestions were made to allow outdoor space accessibility during pandemics, while preventing virus transmission by controlling the spatial and temporal user behaviors that may increase the risk of exposure to the virus. In their commentary, in [6] recommended several solutions that could encourage people to access green spaces, while allowing for physical distancing during COVID-19. Their short-term recommendations included keeping parks open while controlling the number of visitors at one time, through, for example, time slots or sign-up sheets by park staff in larger parks. In the study [7] at Arches National Park, Utah, United States, visitors’ observations were conducted using motion sensor cameras. The researchers modeled the probability of intergroup encounters and found that as group size and number of groups increase, the probability of encounters rises. They recommended that park managers continue to monitor compliance with the guidelines of the Centers for Disease Control and Prevention and encourage visitors to avoid creating large groups. Moreover, in [8] used a quasi-experimental design to understand the behaviors of beachgoers in Virginia Beach, Virginia, U.S., during COVID-19. The study selected the peak beach tourism season to investigate the spatial and temporal behaviors that may lessen or heighten the risk of exposure to the illness. An open-source webcam and an unmanned aerial vehicle (UAV), commonly known a drone, were employed to collect imagery of beachgoer physical distancing compliance. According to the researchers of this study, the findings point to management strategies that coastal managers can implement to understand how to reduce the potential of virus transmission while accessing beach amenities during pandemics. Such studies, and many similar others, used various methods to collect and analyze human behavioral data that influence decision-making to hinder virus transmission, but lacked developing an assessment tool that identifies, at least relatively, how different open spaces in a park have different risk levels of possible virus transmission.
Respiratory viruses can be transmitted via four major modes: physical contact with an infected person, physical contact with a contaminated surface (fomite), respiratory droplets (produced naturally when breathing, speaking, sneezing, etc.), and aerosols (suspended fine solid particles or liquid droplets in the air) [9]. Several non-pharmaceutical measures have proven to be effective in reducing the transmission of respiratory viruses. They include personal measures (mask-wearing, hand-washing, and social distancing), and environmental measures (avoiding enclosed or crowded spaces and frequent cleaning and disinfection of surfaces) [10,11]. Both types of measures are strongly associated with human behaviors.
Moreover, culturally influenced human behaviors (e.g., compliance with pandemic safety measures) have proven to be important in respiratory illness transmission [12]. Culture is a collective sense of consciousness that influences and conditions human behaviors [13]. Ref. [14] grouped the cultures into contact culture (where people use closer interpersonal distances and frequent touching, such as in Latin America and most Arab countries) and noncontact culture (where people exhibit opposite preferences and behaviors, such as in Northern Europe and Asia). Human behavior (at an individual level) has the potential to considerably reduce or raise virus outbreaks [15].
Identifying the patterns of human behavior can be achieved by systematic observation methods. Behavioral mapping is a well-known method, used in this respect for recording human behavior in particular locations [16]. This mapping method can be focused on places or individuals [17]. Place-centered mapping is suitable for assessing the usage of a particular area by recording the locations and activities of its users. On the other hand, individual-centered mapping is appropriate for recording the movements and activities of individuals in a place over time. Both methods of mapping can also be combined.
Place-centered and individual-centered mapping methods can be used to address the problematic positive association between public access to outdoor spaces and the increased potential risk of illness transmission. Park managers should frequently assess the risks/benefits of opening each park open space type (POST) (e.g., playground, promenade, open gym, etc.) for public accessibility during pandemics to highlight the trade-offs. However, there are no practical tools to assist park managers in this regard.
The present study has been undertaken to allow for safe POSTs accessibility during pandemics, so that people are not deprived of the mental and physical health benefits associated with their activities. This can be accomplished by reducing spatial and temporal user behaviors that may increase the risk of exposure to the virus. The study proposed a tool for park managers to assess the risk of illness transmission at various POSTs during pandemics. First, the tool was created. Second, the implementation of the developed tool was demonstrated by selecting a sample zone from Jeddah waterfront park (JWP), Saudi Arabia, while COVID-19 was active nationally and internationally. Then, user behavior data were collected at the POSTs of the sample zone, using behavioral mapping and tracking methods. Next, the collected data were analyzed using ArcGIS Desktop and SPSS Statistics software. Finally, the collected and analyzed data were used for filling out the checklist, which yielded objective results on risk level at each POST of JWP.
To the best knowledge of the researcher, this is the first attempt to develop and implement a practical risk assessment tool for respiratory illness transmission on the POST level by observing user behaviors. Through composing, testing, and improving tools, such as the one attempted in this study, park managers can contribute to the success of non-pharmaceutical interventions to slow down the spread of respiratory contagious illnesses. Moreover, the application of this tool will help to mitigate the impacts of pandemics through more informed planning and management decisions at the local scale.

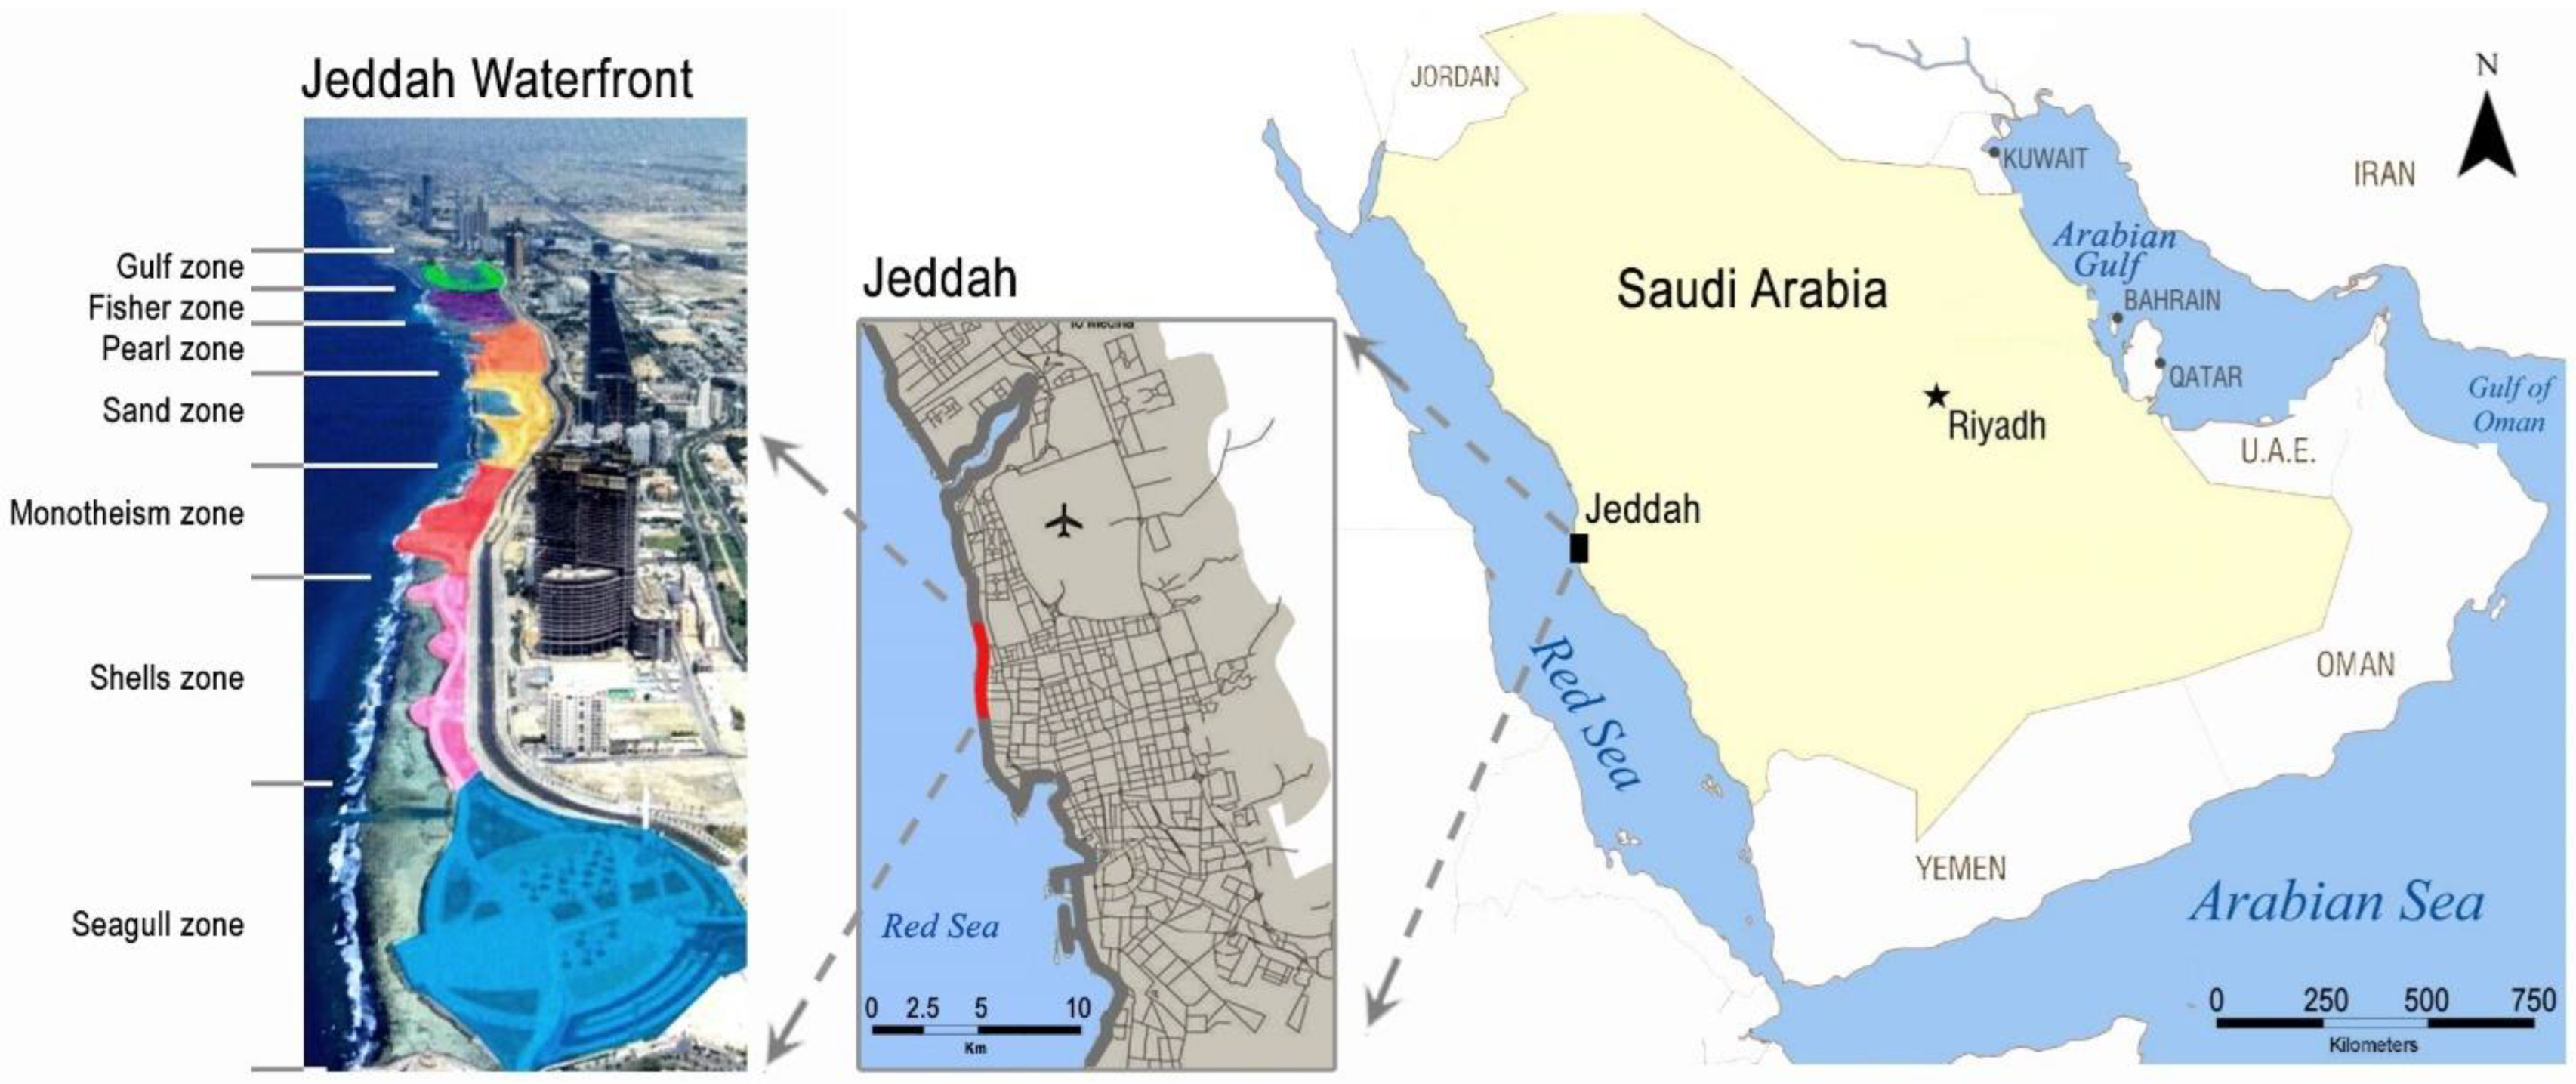
2. JWP and Its Management before and during COVID-19

Jeddah, known as the Bride of the Red Sea, is located on the western coast of Saudi Arabia at the middle of the Red Sea’s eastern shore. It is surrounded by plains and mountains from the east and by the sea from the west. Jeddah is the second largest city in the country and its largest coastal urban area (population is around 5 million in 2022). A large population of expatriates reside in Jeddah, as it is considered the commercial gateway of the country, and an important center for money and business. One of the most attractive features of Jeddah is its corniche, which extends along the coast for more than 48 km (Figure 1).
JWP, a portion of Jeddah Corniche, is one of the largest outdoor recreational urban waterfront parks in the Middle East [18]. It includes seven zones: Gulf, Fisher, Pearl, Sand, Monotheism, Shells, and Seagull, which include various POSTs which are all wheelchair-accessible and lit up well at night until dawn. In 2012, Jeddah’s Corniche won the Big Project Middle East Award, an official accolade that recognizes the organizations and individuals that have contributed to the construction and sustainability industries across the Cooperation Council for the Arab States of the Gulf. JWP has become a popular destination for millions of residents and tourists to enjoy appealing views of the Red Sea, expansive green open spaces, recreational facilities, and infrastructure [19]. JWP expands for 4.5 km, over an area of 730,000 m2, with a carrying capacity of 120,000 visitors, and a parking facility for 3000 cars [20]. The total cost for the project was reported to be approximately 800 million Saudi riyals ($213.3 million) [21].
JWP has a management center named the Control and Monitoring Centre. It administers the coastal facilities, crowds, traffic congestion, and even cases of missing children. Additionally, the center monitors violations and abuses, such as vandalism and selling without permits. The working team includes office and field personnel from Jeddah Municipality, as well as security and government authorities, who are deployed 24/7. The center has 125 CCTV cameras distributed all over the site [22]. Furthermore, it has a public address system that makes announcements, warnings, directions, and awareness messages to visitors. The messages and announcements are sufficiently audible over the park area.
Direct and indirect management approaches [23] are common strategies employed by the managers of JWP’s Control and Monitoring Centre. Direct management (hard enforcement) includes giving citations, enforcing regulations, and applying closures, while indirect management (soft enforcement) includes posting signage and providing educational awareness. With direct management, the center restricts individuals’ freedom to promptly accomplish a targeted result while, with indirect management, the center employs education and information to change people’s behavior.
During the COVID-19 pandemic, management of JWP became a complicated task that had to additionally consider controlling the spread. Therefore, JWP was closed for several months during the peak of the pandemic [24] and, unfortunately, its frequent visitors were deprived of the mental and physical health benefits associated with the activities in the park. The timeline of the lockdown, which was part of the mitigation measures applied by the Saudi government, can be divided into four periods. The initial partial lockdown strategy was applied when the first cases in the country were identified (in the Qatif region), from 8–23 March 2020. The second period was from 24 March to 1 April 2020, when the partial lockdown strategy was applied in all provinces of the country. The third period was from 2–5 April 2020, when a 24-h lockdown strategy was applied in Makkah and Madinah, as these two holiest cities in the Muslim world receive over 10 million visitors annually for Umrah and pilgrimage [25,26]. The fourth period was from 6–19 April 2020, when Riyadh, Jeddah, and several other cities were included in the full lockdown [27,28]. Since the first period and up to several months later, several measures to combat the spread of the Coronavirus, including the closure of JWP, were applied. After reopening, the measures that were still mandatory included wearing facemasks and ensuring appropriate social distancing. During this period, direct and indirect management strategies were applied by the JWP’s Control and Monitoring Centre. Recently, the shift from the direct management approach (i.e., waterfront closure) to the indirect management approach (i.e., signage, awareness, etc.) raised the need to develop a risk assessment tool that could be used by the Control and Monitoring Centre for evaluating the behaviors of JWP’s visitors, in terms of compliance with instructions (e.g., wearing masks, applying two meters social distancing, etc.) delivered through indirect management.

3. Materials and Methods

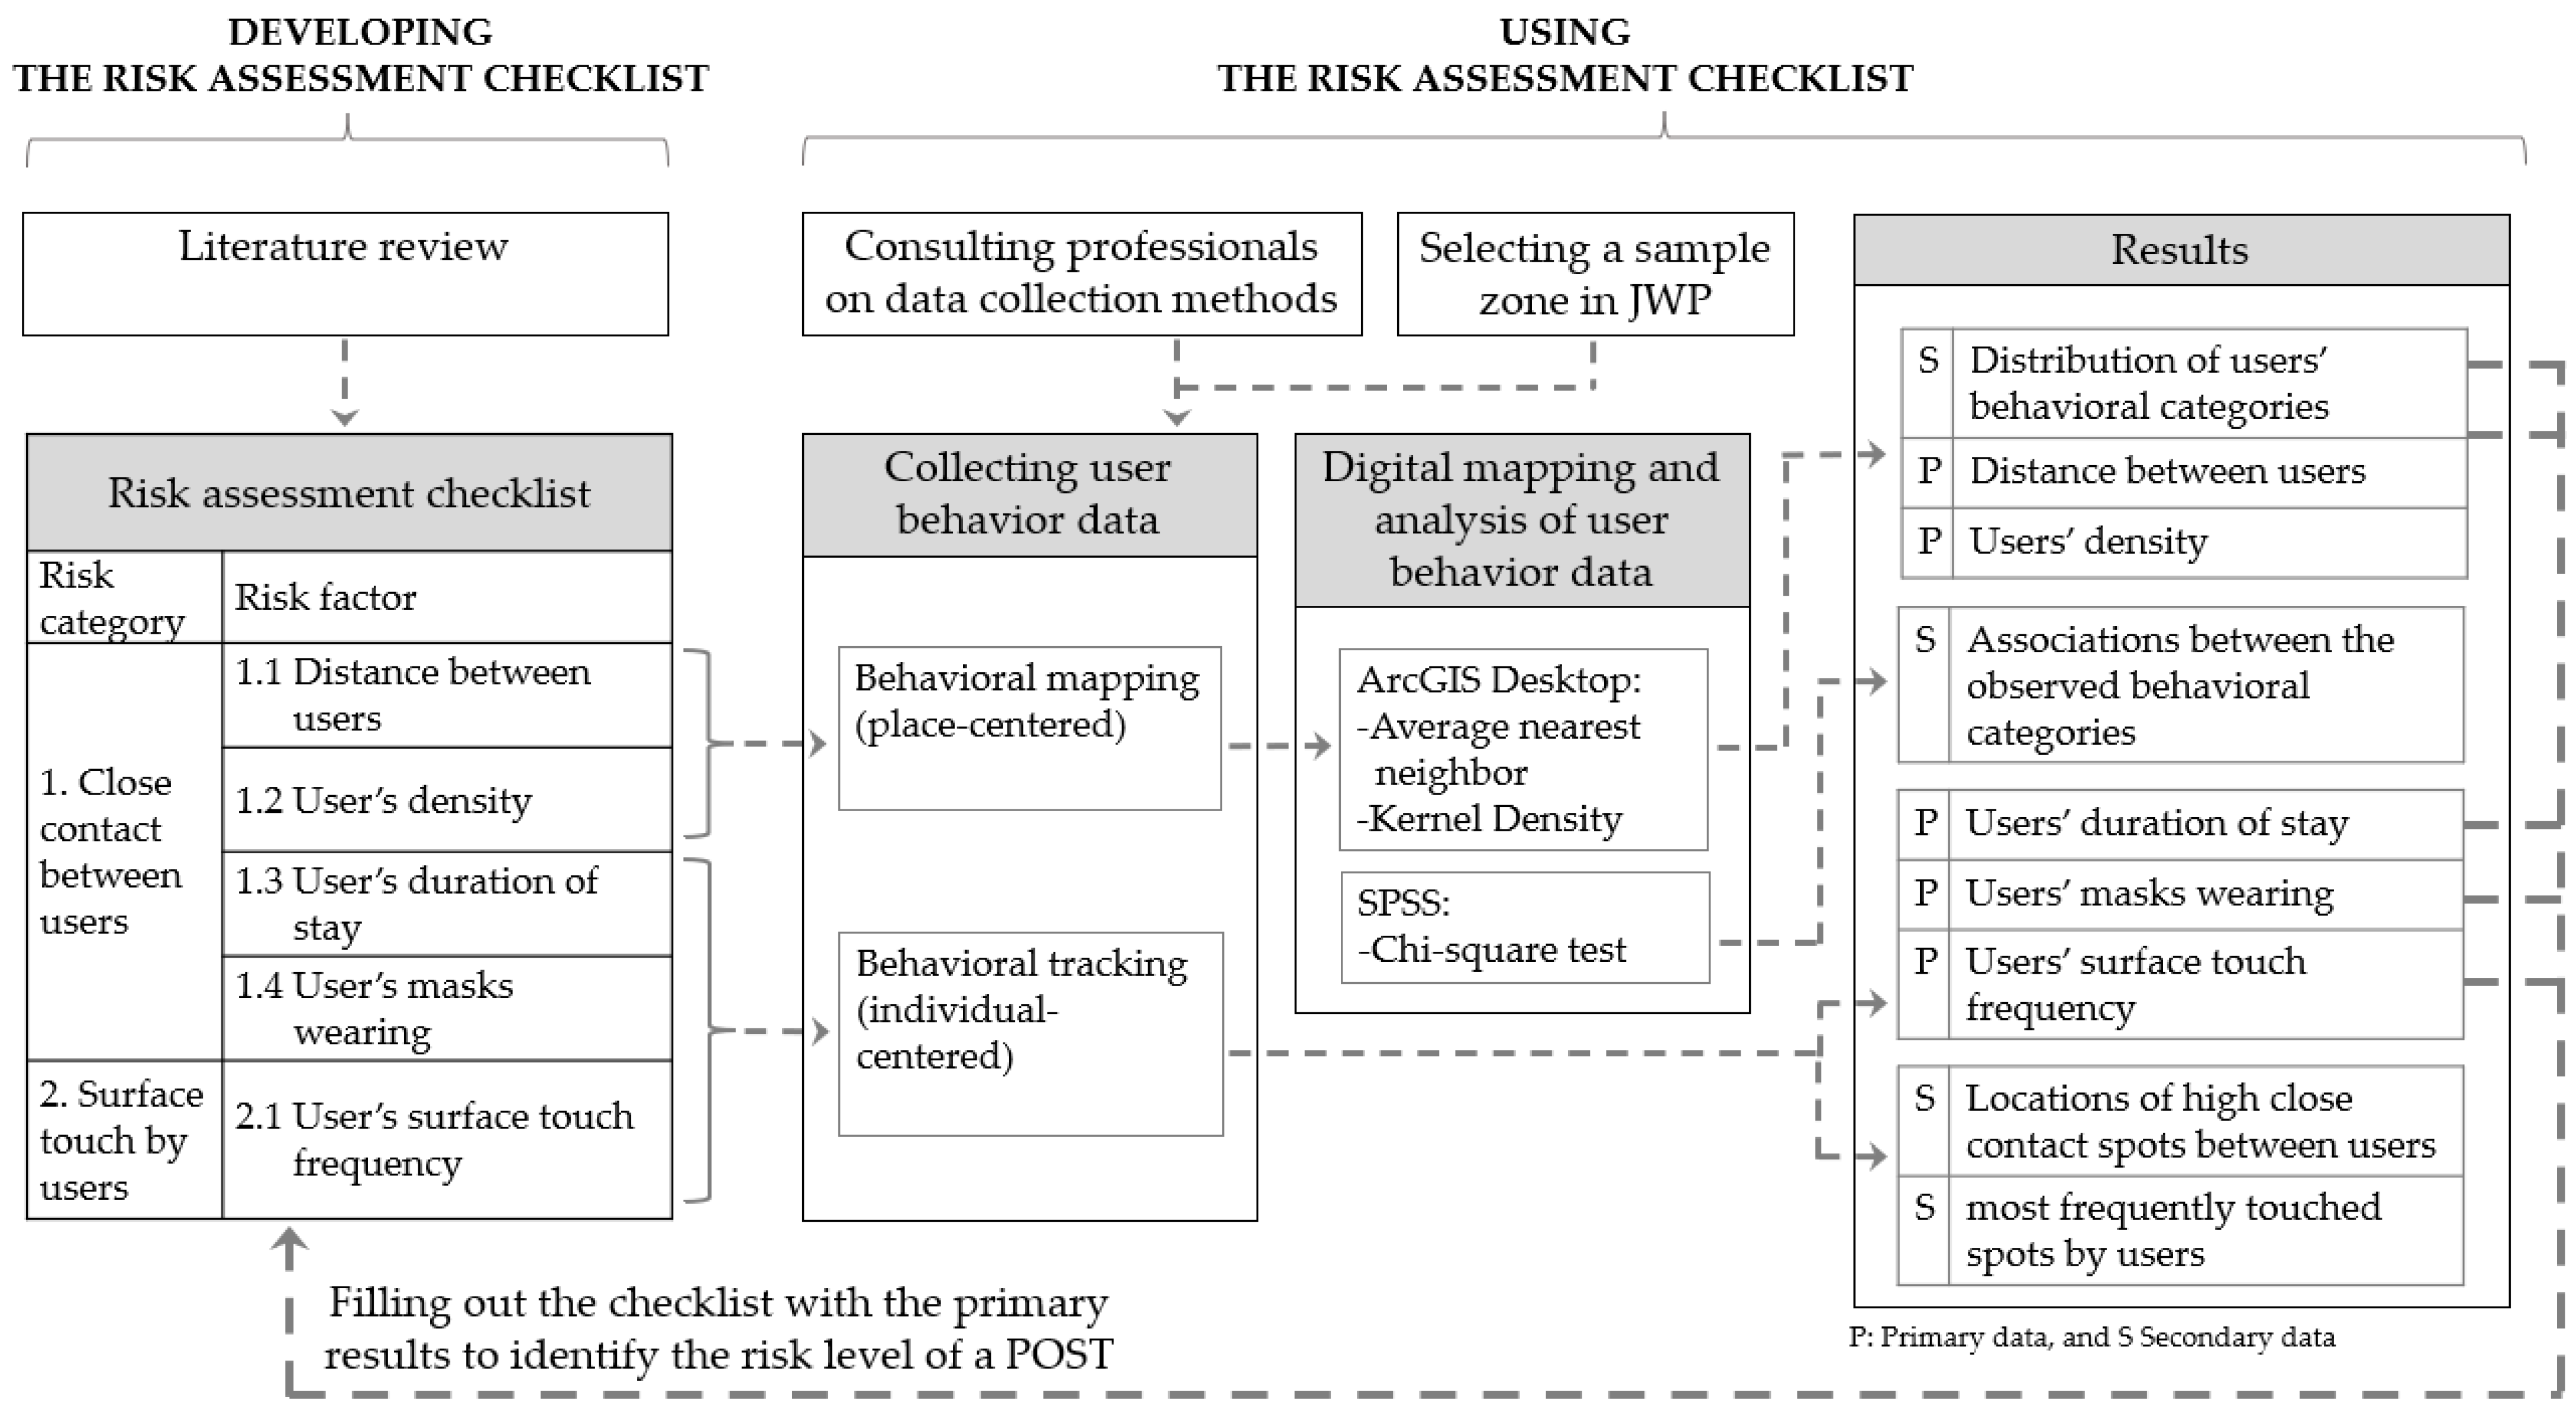
3.1. Developing the Risk Assessment Checklist

Using bibliographic databases, including ScienceDirect, Web of Science, PubMed, and Google Scholar, a literature review was conducted for publications relating to the factors that contribute to the level of risk of respiratory illness transmission. The focus was on the publications of the years 2020–2022 (from the start of COVID-19). The search strings used included ”respiratory contagious illness”, ”pandemic”, ”user behavior”, ”risk assessment”, ”physical distancing”, ”masks”, and ”surface touch”. Results from the literature review suggested two risk categories, including five risk factors that were incorporated into the assessment checklist as explained below. Additionally, to collect social behavior data about those factors, landscape architecture professionals (from King Abdulaziz University, Jeddah, Saudi Arabia) were also consulted regarding the data collection methods. Accordingly, the researcher developed a checklist for objectively assessing the potential risk level of contracting respiratory illnesses at various POSTs, based on user behaviors.
The checklist consisted of five factors related to the close contact between the POST’s users and the surface touch by the POST’s users. The close contact category was associated with four risk assessment factors: (1) the distance between POST’s users [29], (2) the density of POST’s users [30], (3) the duration of stay of POST’s users [31], and (4) the percentage of POST’s users that are wearing masks [32]. The surface touch category was associated with the factor of surface touch frequency by POST’s users [33]. A four-level assessment scale was used to identify the relative risk level of each POST: virtually none (zero points), low (one point), medium (two points), and high (three points). Therefore, the maximum total score was 15 points at each POST (Table 1).

3.2. Using the Risk Assessment Checklist in JWP

To demonstrate how the checklist can estimate the potential risk of exposure to a respiratory illness at various POSTs, the checklist was used for risk assessment in JWP. This process was carried out in the following steps.

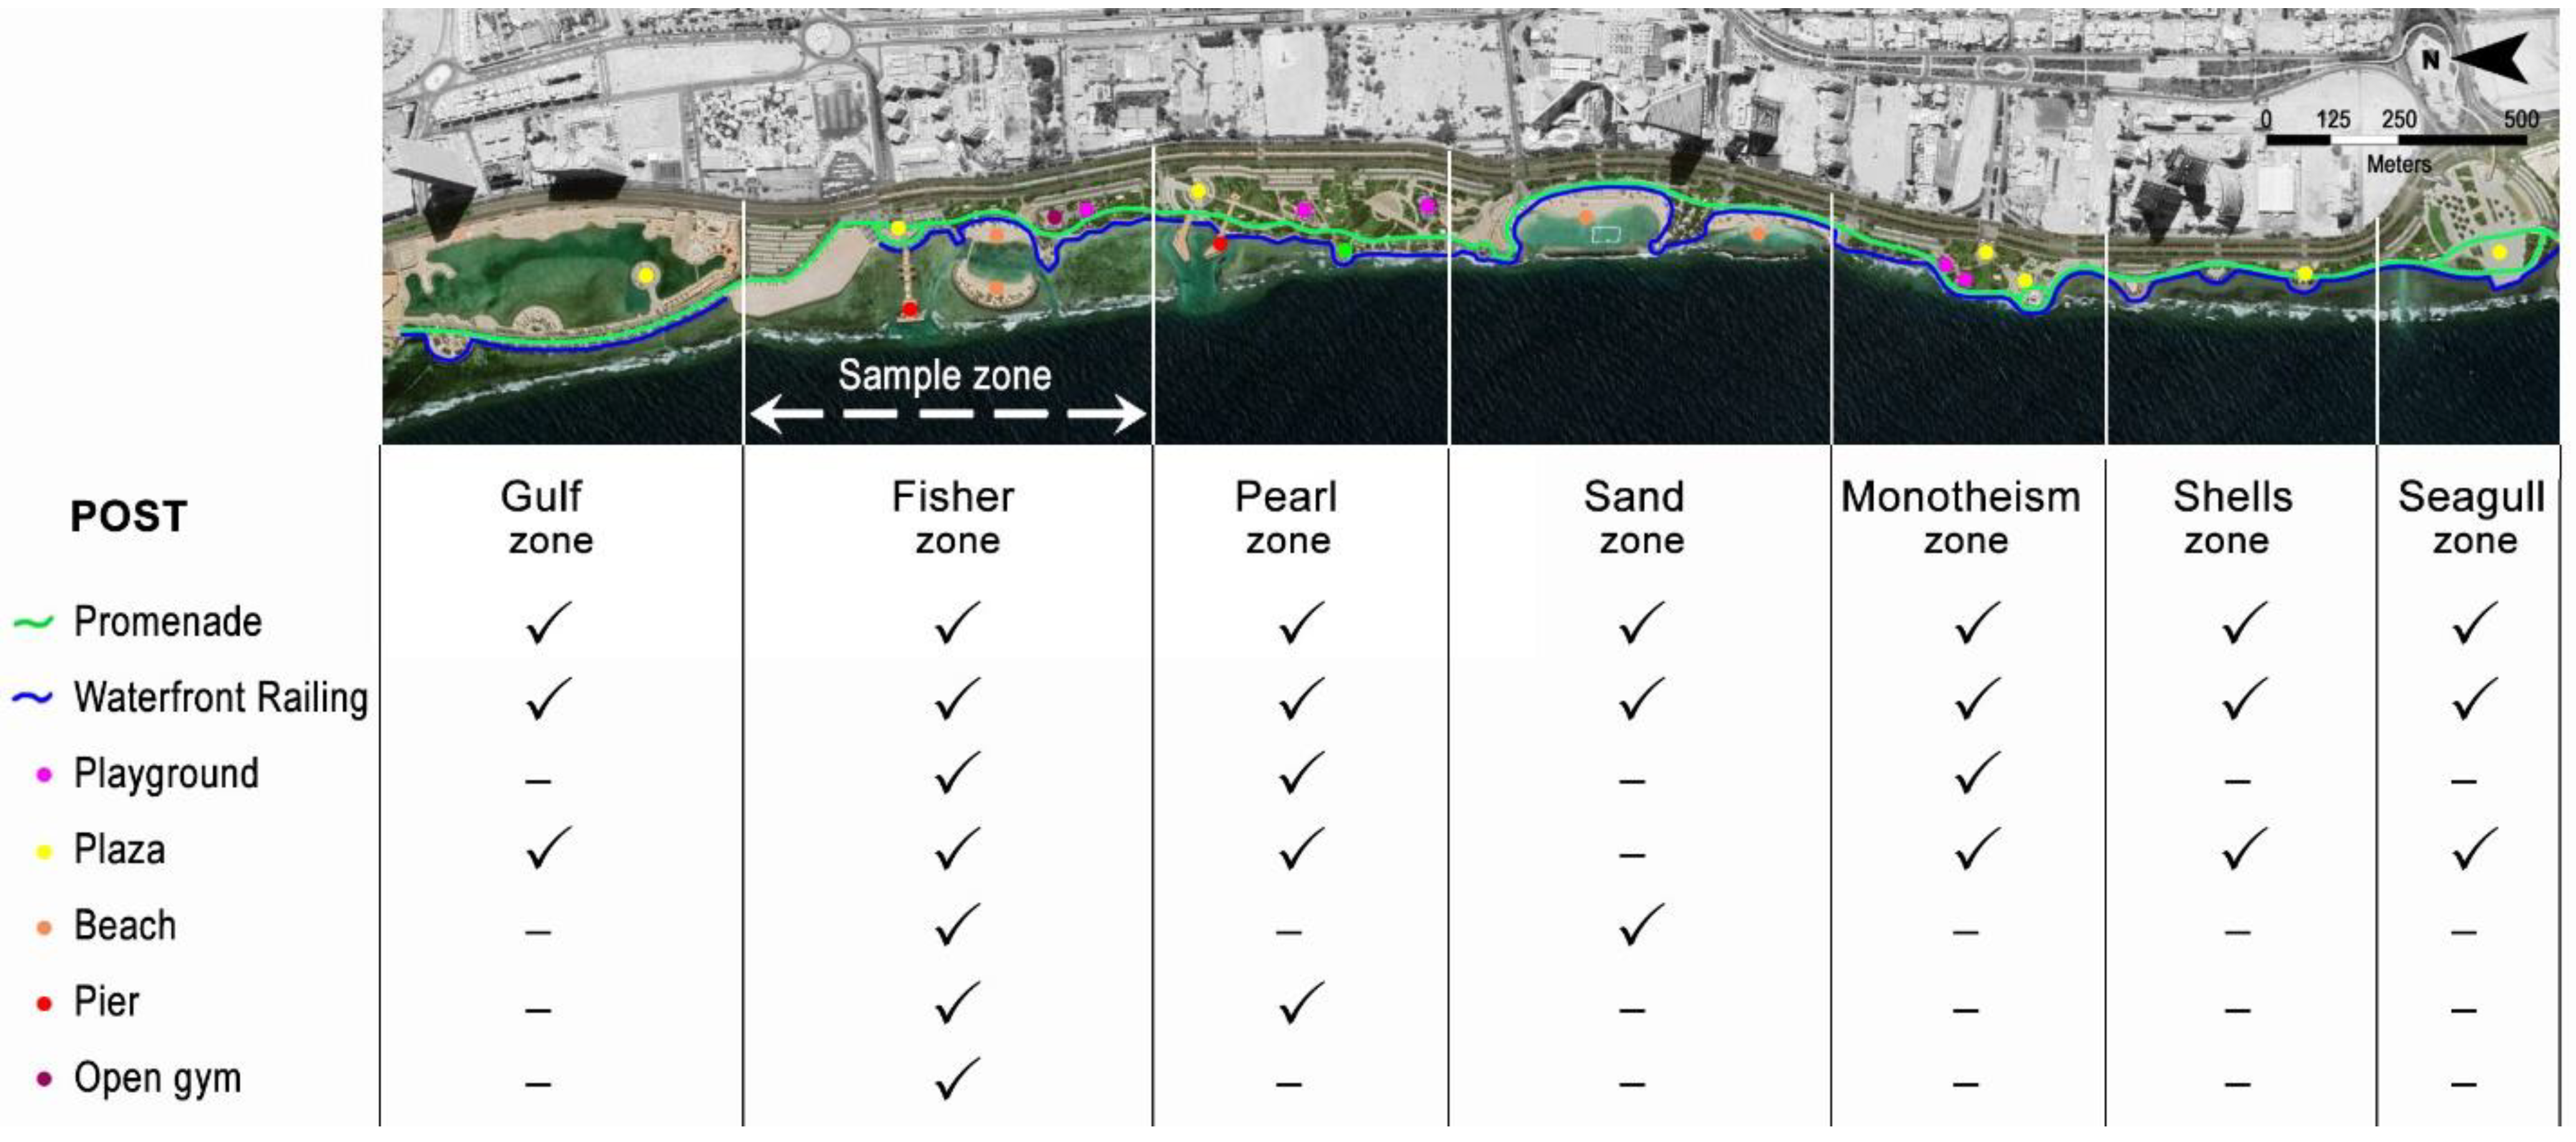
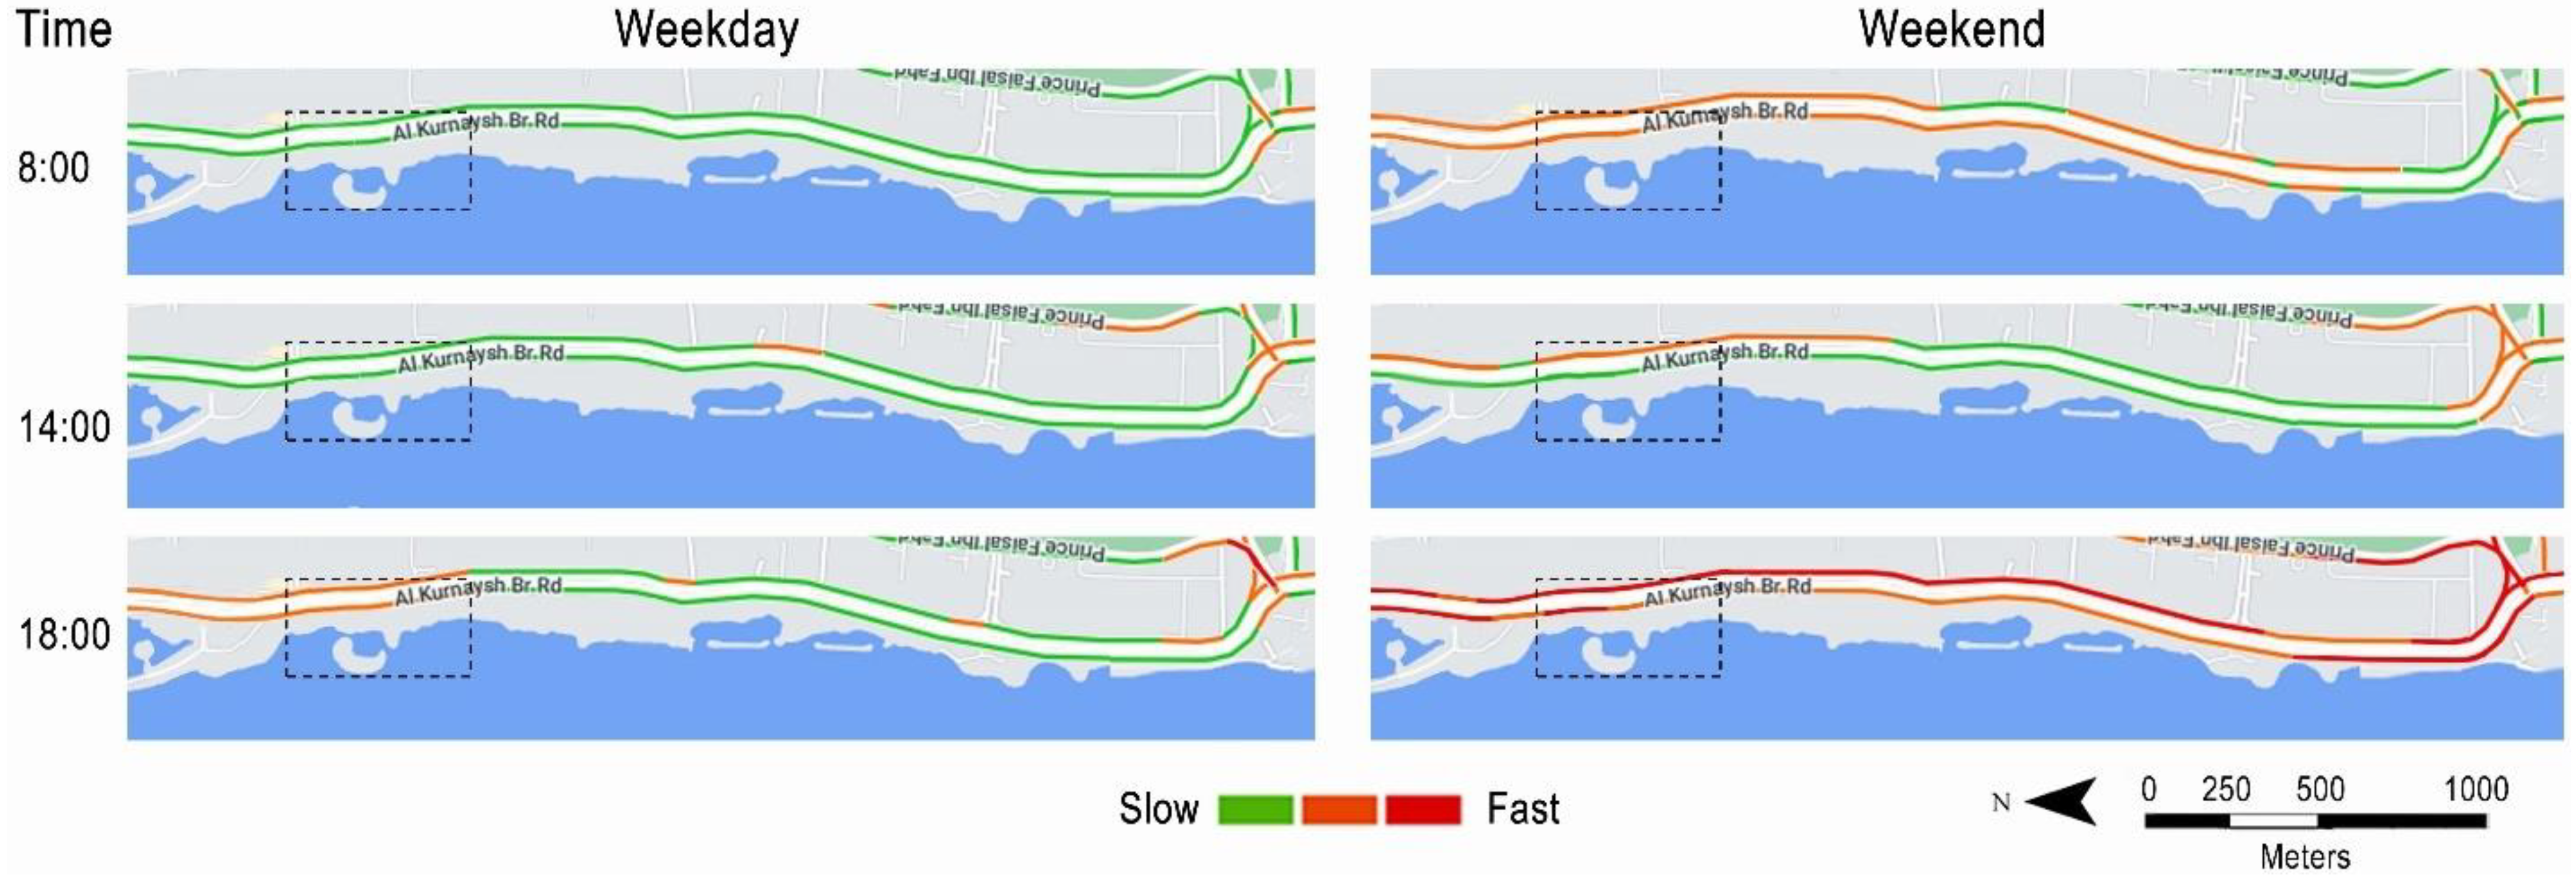
3.2.1. Selecting a Sample Zone in JWP

The researcher conducted an inventory of POSTs in JWP and identified seven prominent POSTs: playground (five counts), plaza (seven counts), piers (three counts), open gym (one count), promenade (one continuous), waterfront railing area (one continuous), and beach (four counts). Figure 2 shows the geographical distributions of those POSTs in the seven zones of JWP. The Fisher zone was found to include all prominent POSTs; thus, it was selected as the sample zone for this study (Figure 3). However, because the beaches in JWP were closed during the period of this study, the beach POST was excluded.
The researcher chose to carry out the investigations during the peak of visiting season, between November 2021 and February 2022 (average high temperature: 29.3 °C; average low temperature: 19.3 °C) [34]. The sample zone was monitored from morning to midnight during three weekdays and three weekends to identify the busiest time of the week in terms of the maximum number of users. As per these observations, the busiest time was found to be at six o’clock in the evening on weekends (Figure 4). This observation complies with the ”typical traffic” feature of Google Maps [35] (Figure 5). Thus, the researcher decided to perform the sample zone observations at this specific time.

3.2.2. Collecting Human Behavior Data

To collect data on user behavior in the six POSTs of the sample zone, two methods were used: behavioral mapping (place-centered) and behavioral tracking (individual-centered). The former was used to collect data for the checklist’s risk factors 1.1 and 1.2, respectively, whereas the latter was used to collect data for the risk factors 1.3, 1.4, and 2.1, respectively (Table 1).
For the behavioral mapping, the five observation steps proposed by [36] were followed:
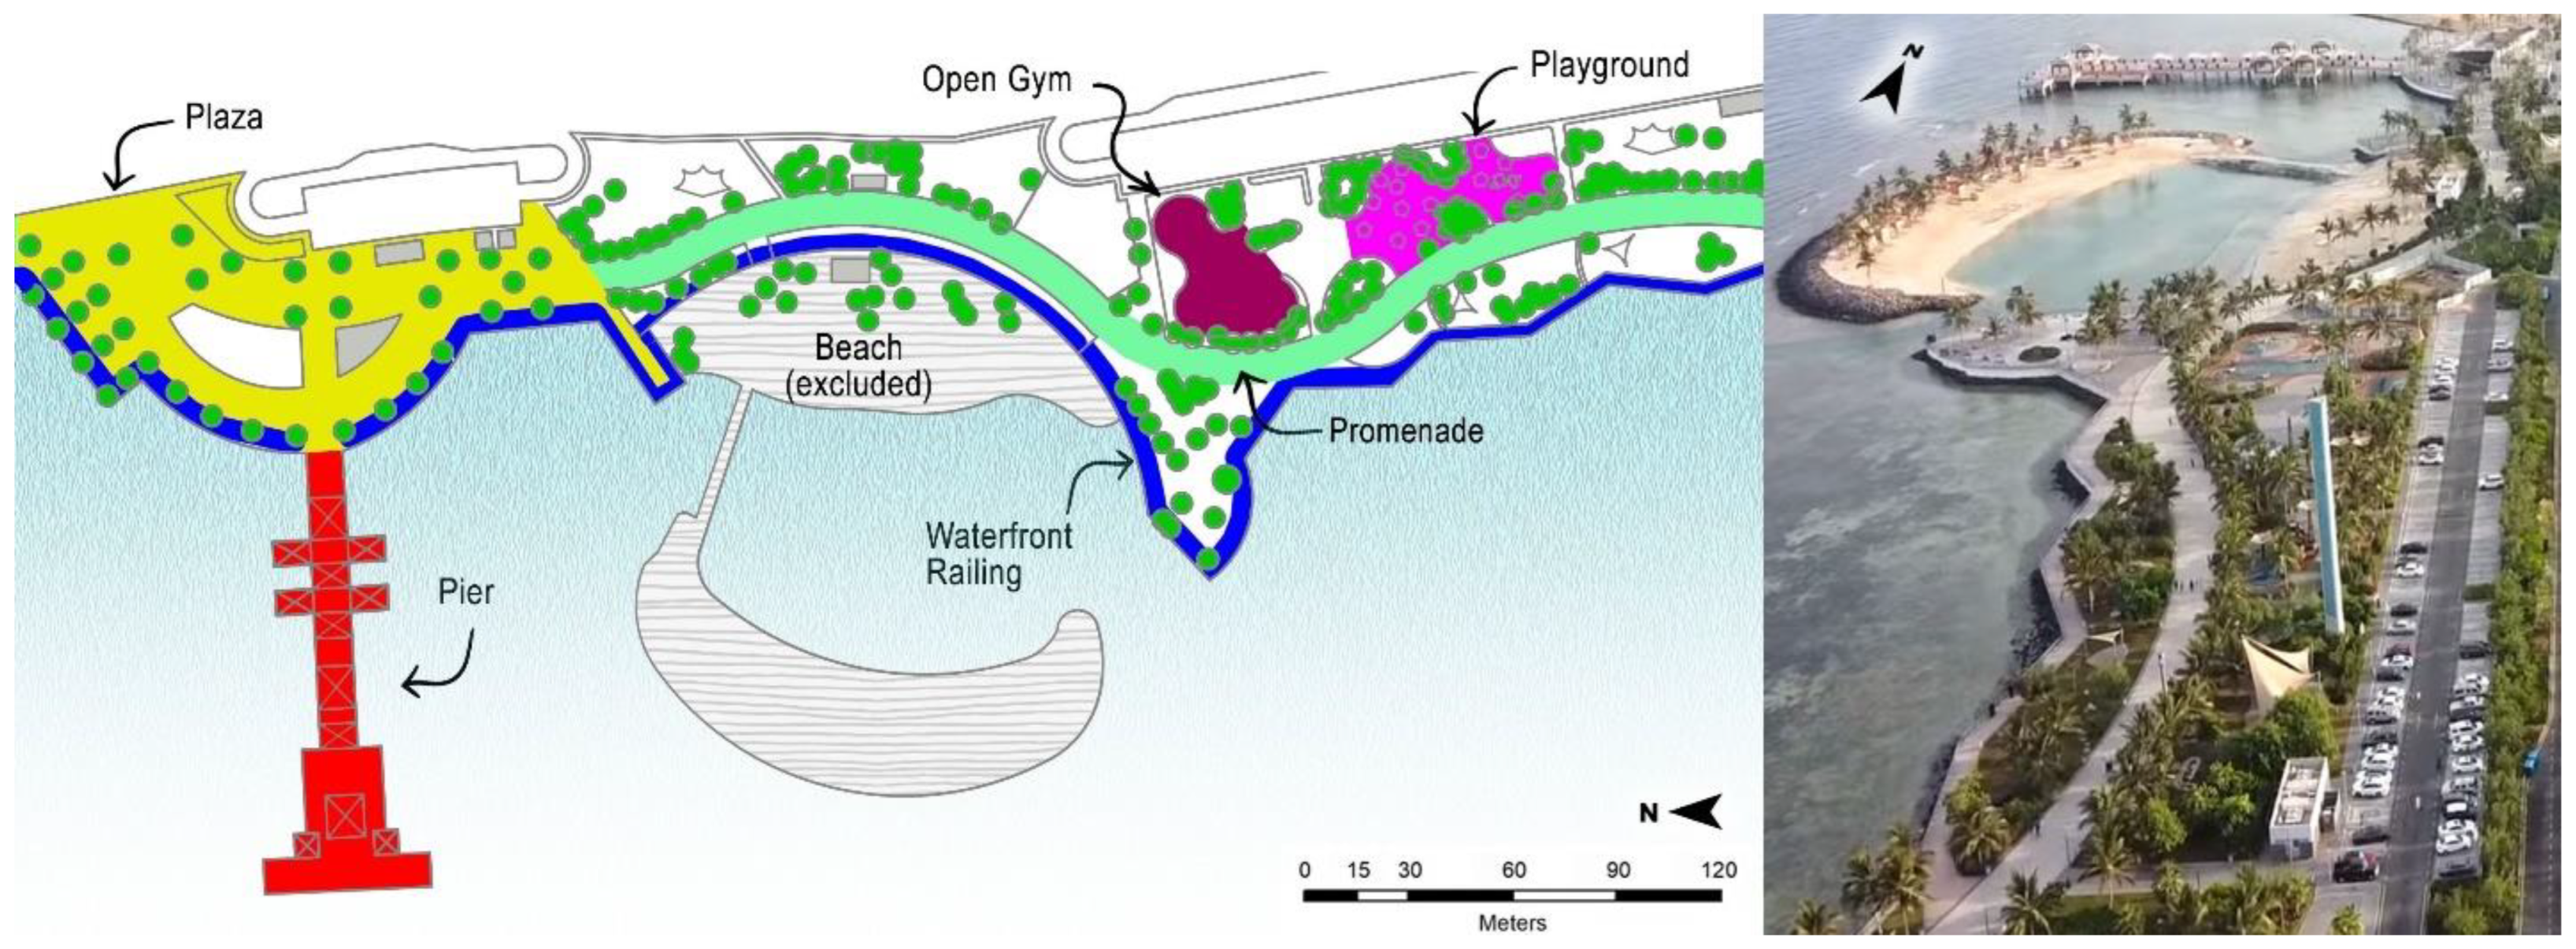
  • Preparing a base map: A base map for the sample zone was prepared using AutoCAD. The base map accurately contained the locations of site furniture (e.g., shelters, trees, benches, play equipment) to determine the spatial occupancies of users;
  • Defining the behavioral categories: To align the behavioral categories with the study objectives, the researcher visited the site beforehand and defined the categories as well as their corresponding codes (Table 2);
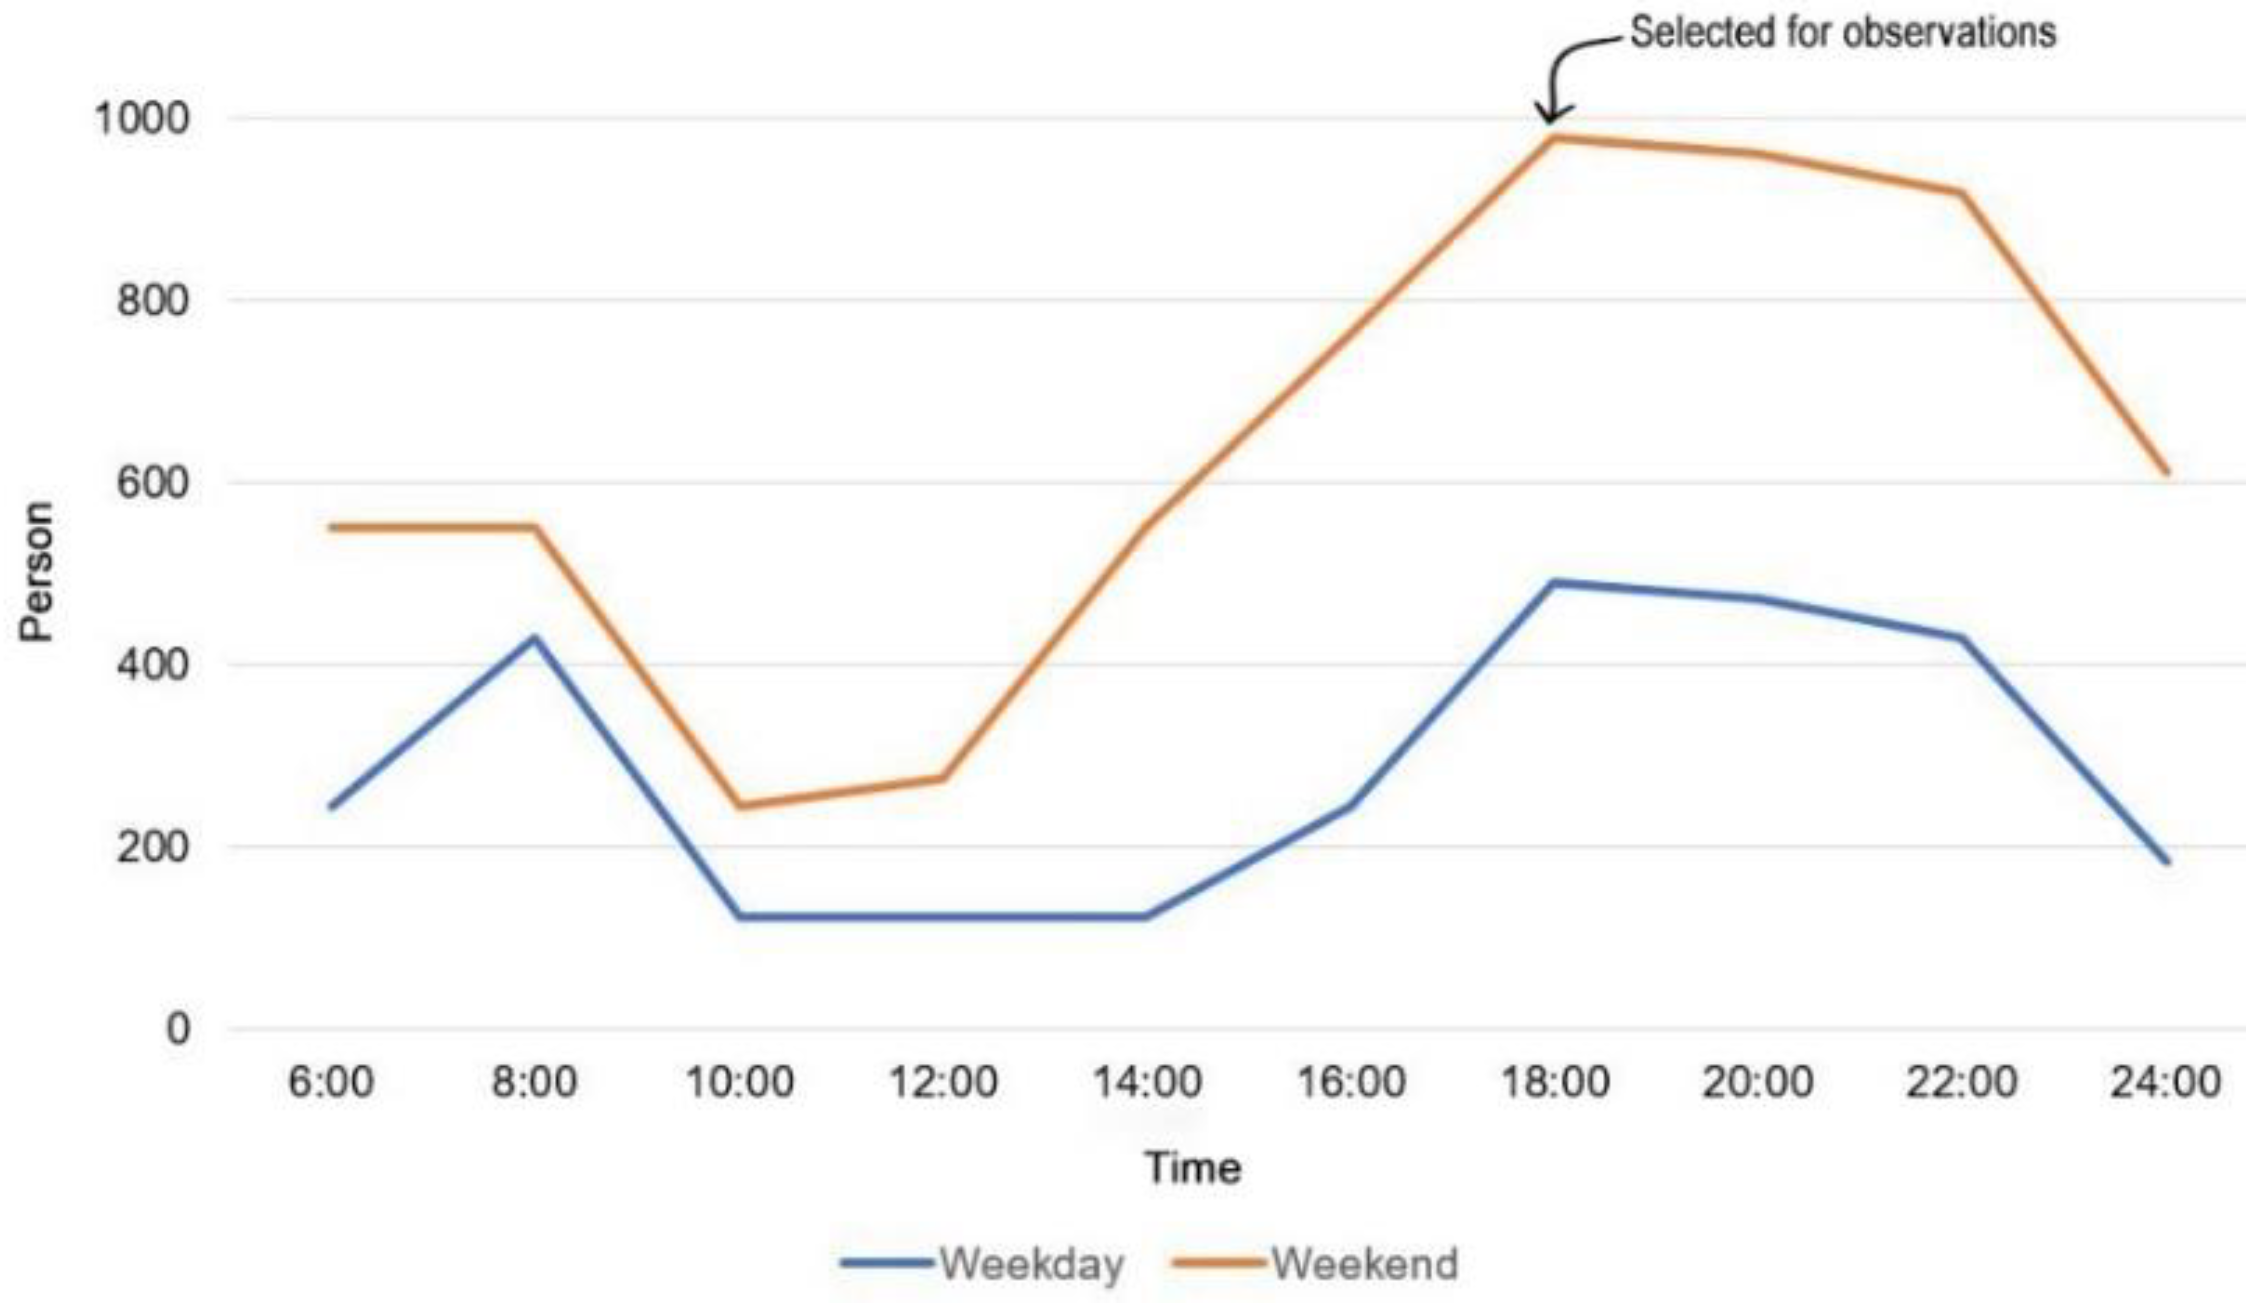
  • Constructing an observation schedule: An observation schedule that included two observation rounds to be performed in the sample zone was prepared;
  • Preparing a systematic procedure for observation: The procedure of observation prepared includes: (a) walking a pre-determined path along the promenade of the sample zone, (b) completing each observation round in about 20 min, (c) performing observations simultaneously by two teams of trained inspectors (two persons per team), (d) registering observations manually on the base map and data sheets, and (e) using mobile phone photography and video recordings to verify the recorded observations;
  • Preparing a system of coding and counting which eases the recording during the observations.
As to behavioral tracking, which is appropriate for studying the behaviors of a person or a group of people [37], it was used to collect data at the six POSTs of the sample zone, following the next four steps:
  • Adding more features to the prepared base map for collecting further details about user behaviors at each POST;
  • Defining four behavioral categories to be observed at each POST: the user’s duration of stay (code = stay), the user’s adherence to wearing a mask (codes: wearing mask = wm, and not wearing mask = nwm), the user’s touch spots (marked on the base map and images on mobile phones), and the user’s touch frequency (code = tf);
  • Identifying the sample size, the sampling strategies, and the observation schedule. The sample size was considerably small, according to [17], as 10 individuals at each POST were observed (60 in total). The individuals tracked at each observation round were selected at random;
  • Preparing the procedure for tracking observations. This included: (a) each observation round starts when the observed individuals enter the POST and ends when they exit, and (b) all observations are to be recorded on the POST’s detailed base maps and data sheets.

3.2.3. Data Analysis

The observations recorded on the base map and data sheets during the behavioral mapping and tracking were transferred to ArcGIS Desktop 10.7.1 software for digital mapping and analysis. The resulting map included all registered individuals as points (dots) linked to an attribute table that included records for the observed behavioral categories of all individuals. The Kernel Density tool was used to calculate user density in the sample zone and to recognize the hotspots. The Kernel function flattens the targeted values over space by counting incidents per unit area [38]. The researcher examined two density plots smoothed by 15 m and 2 m search radii, respectively, to gain greater insight into the data. The 15 m search radius parameter produced a smoother and more generalized density output, while the 2 m search radius produced an output that revealed more details and highlighted the risky spots of social distancing. Additionally, ArcGIS’s spatial statistics tool (average nearest neighbor) was used to analyze patterns of user distribution at each POST.
Moreover, using SPSS Statistics 24.0 software, the data were examined through descriptive and inferential analysis. The Chi-square test was used to examine the association between the sociodemographic characteristics of the users and their behaviors of interest to the study aim.

3.2.4. Identifying the Risk Levels in the Sample Zone

Using the collected and analyzed data of user behavior in the sample zone, the risk of contracting a respiratory illness at each POST was calculated using the developed risk assessment checklist (Table 1).
Figure 6 shows a diagram for the research methodology of this study, as explained above.

4. Results

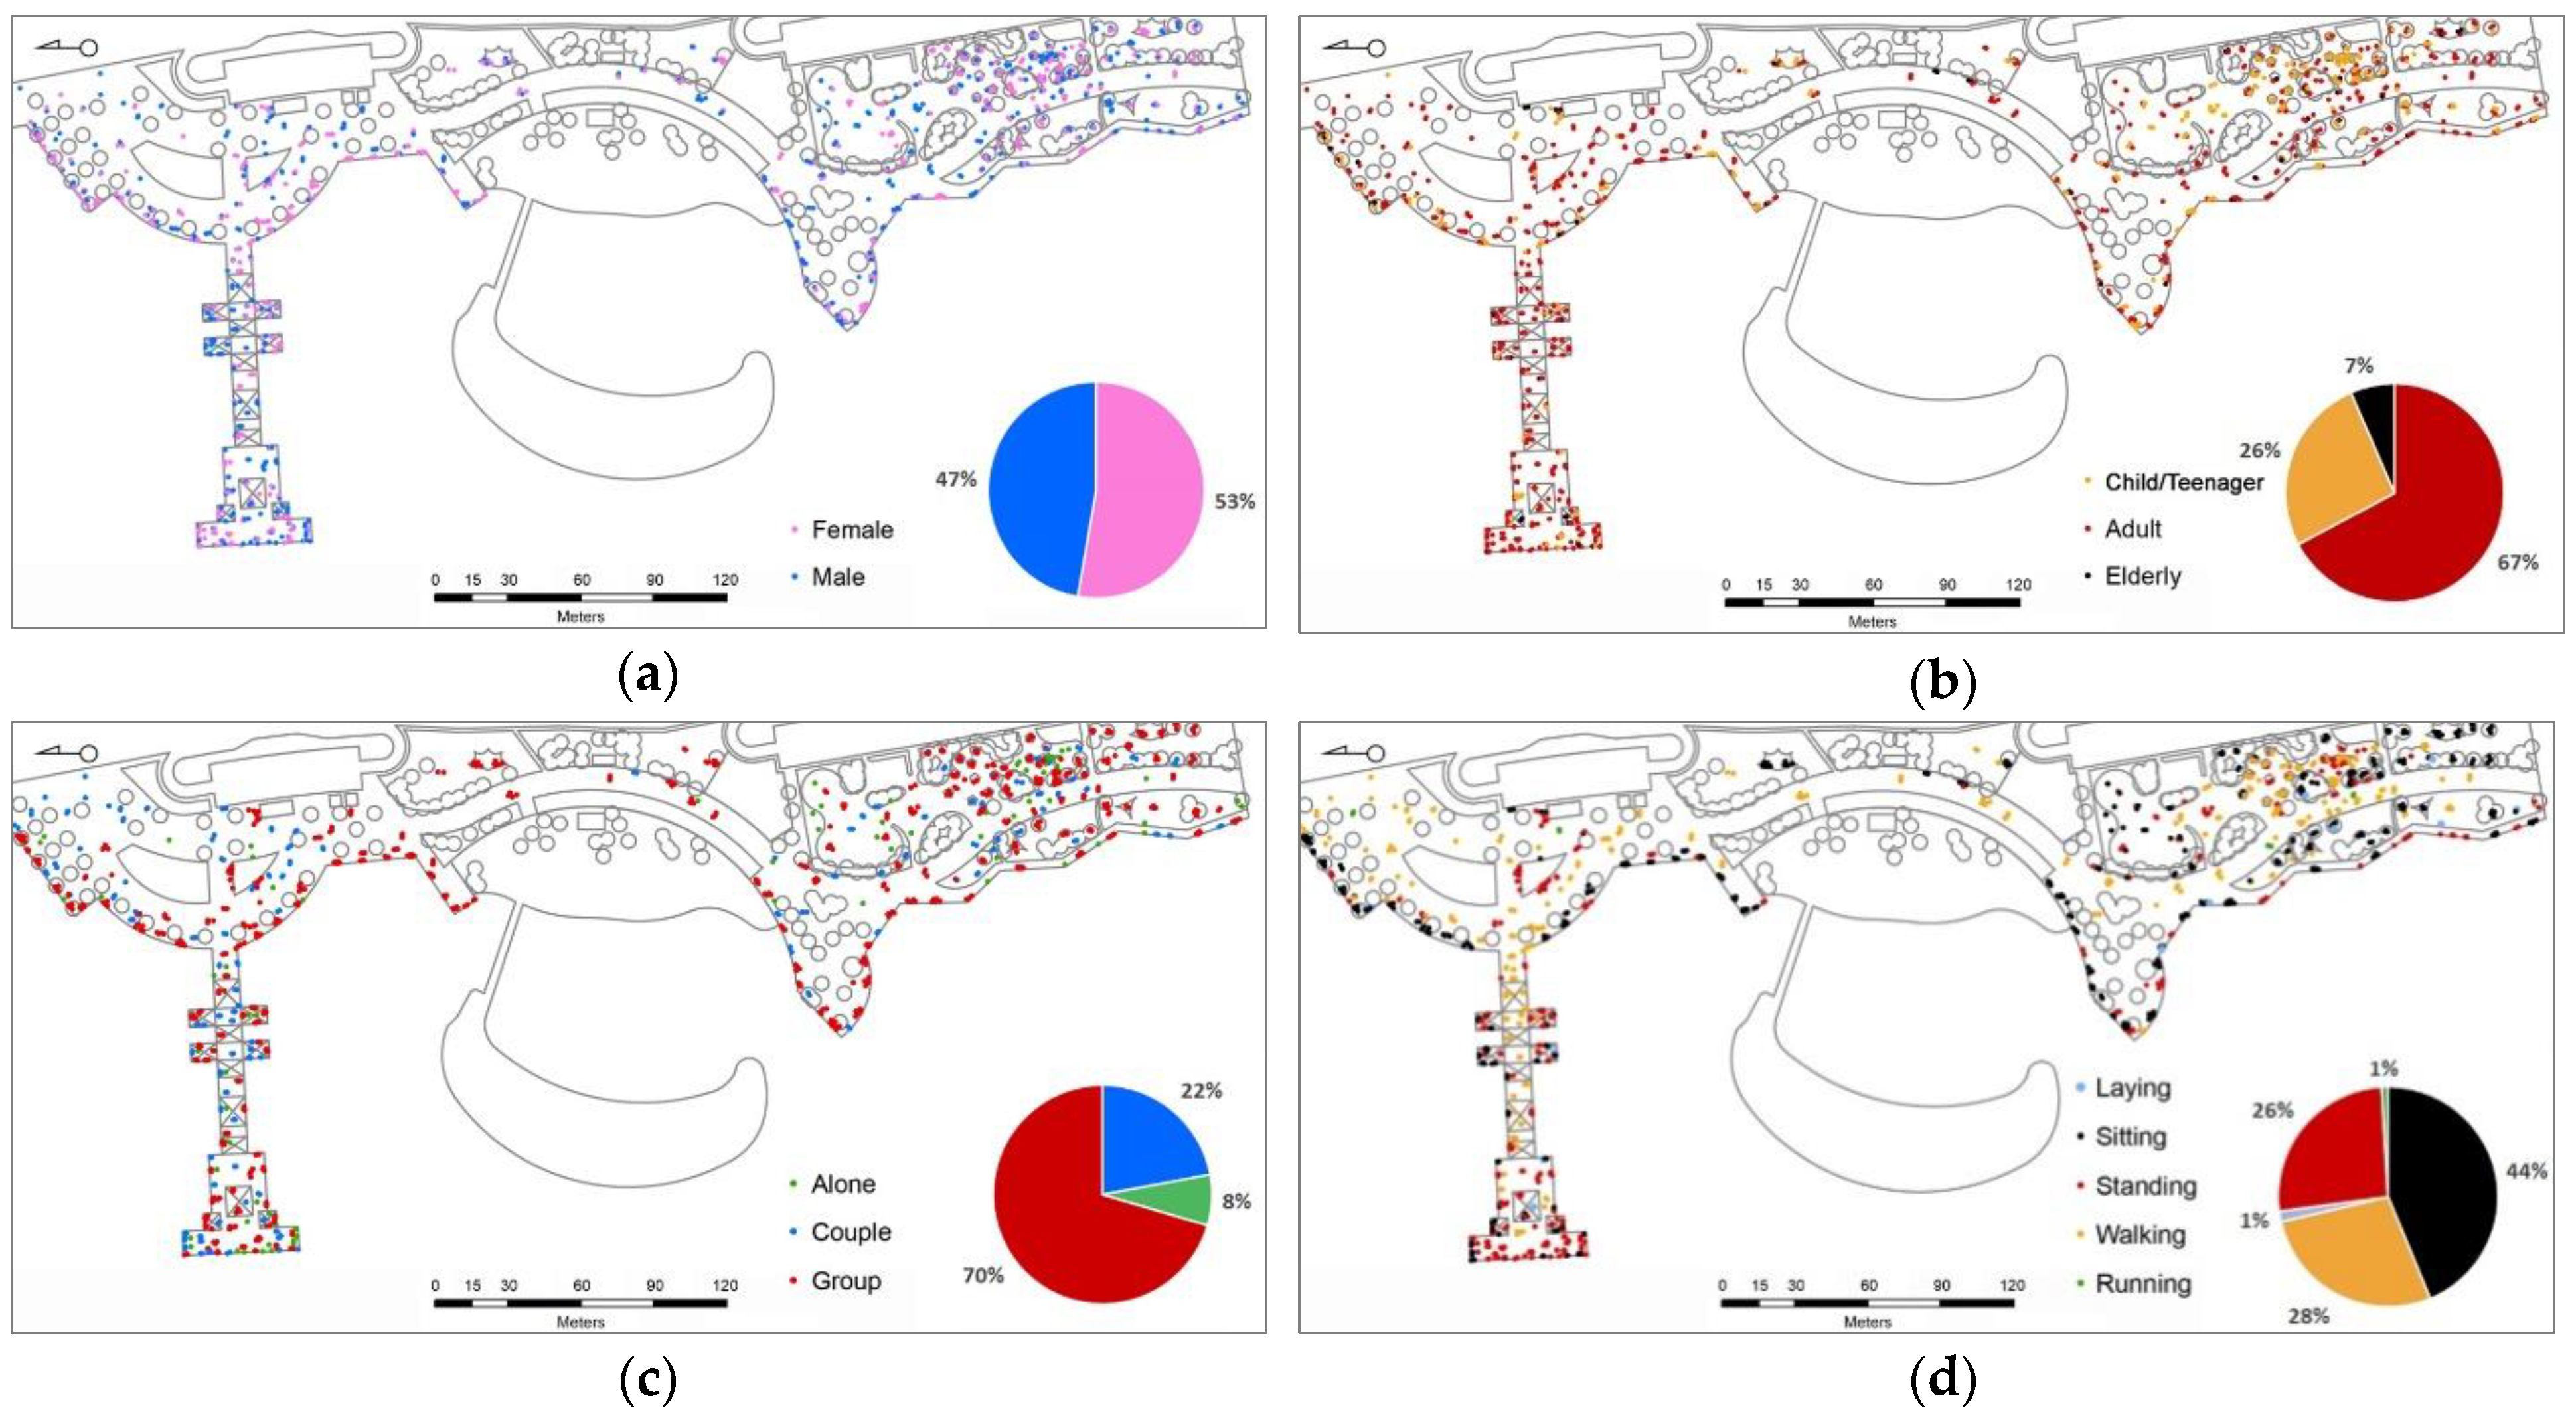
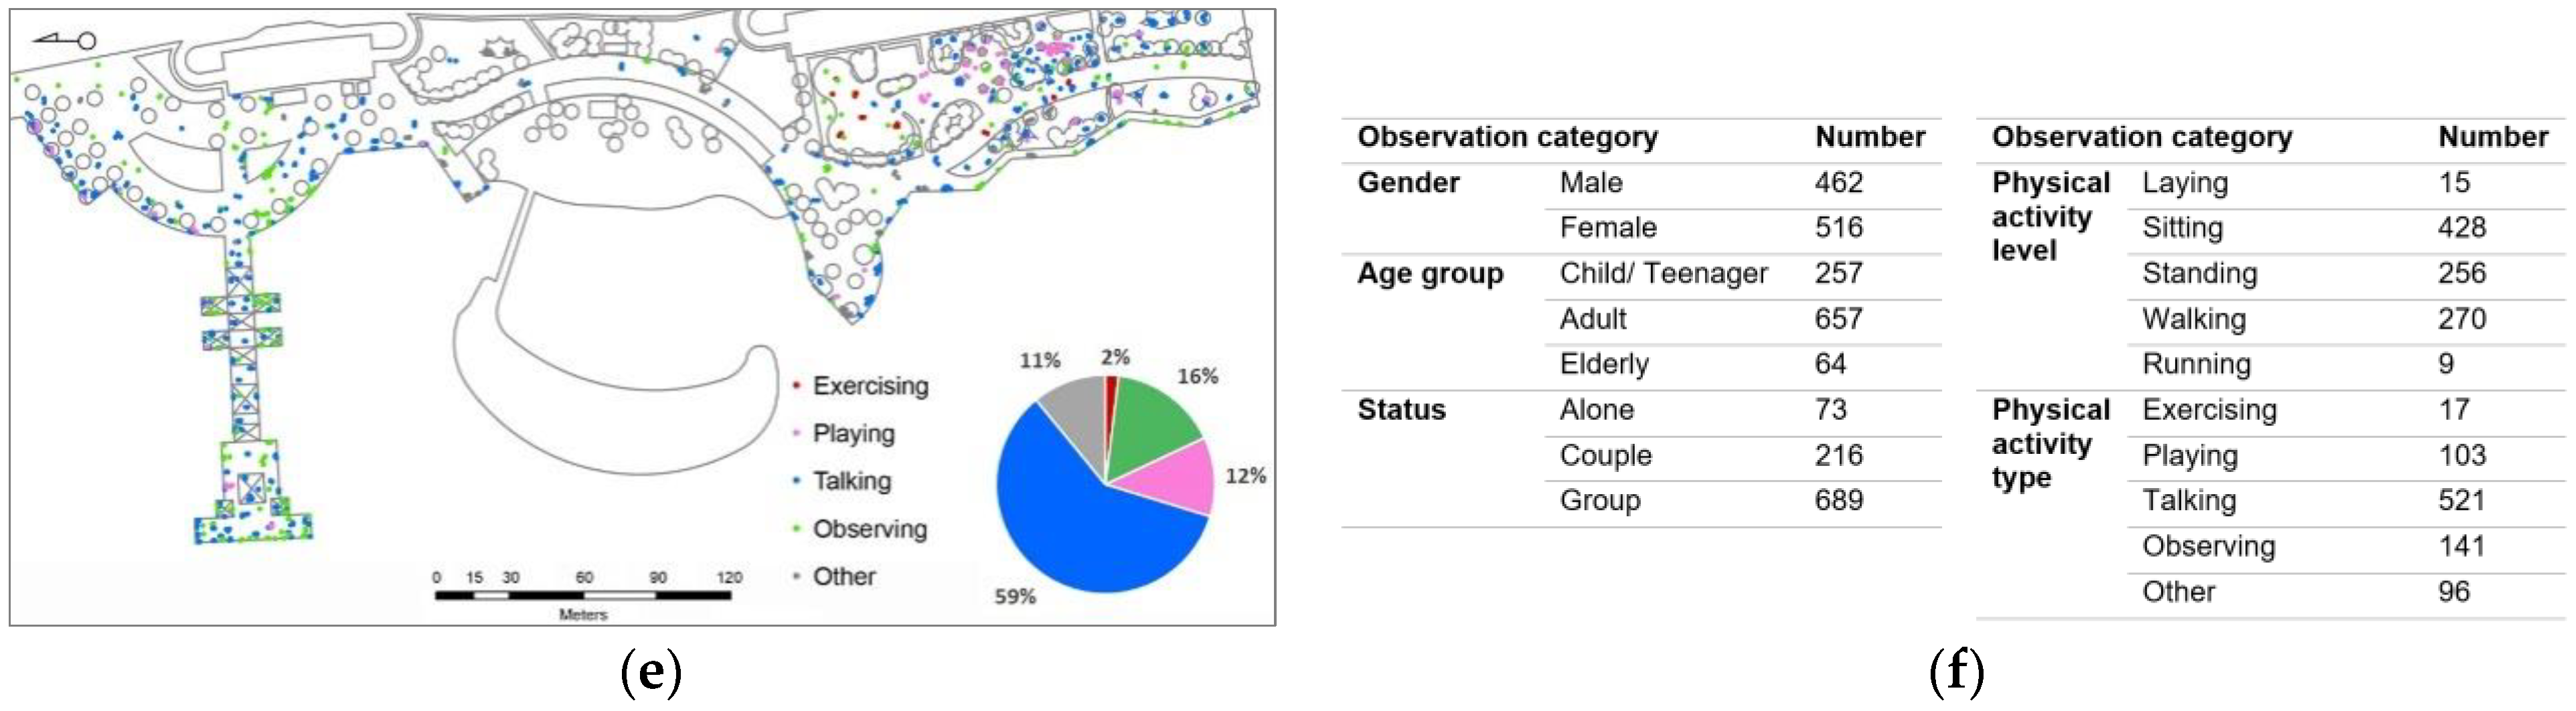
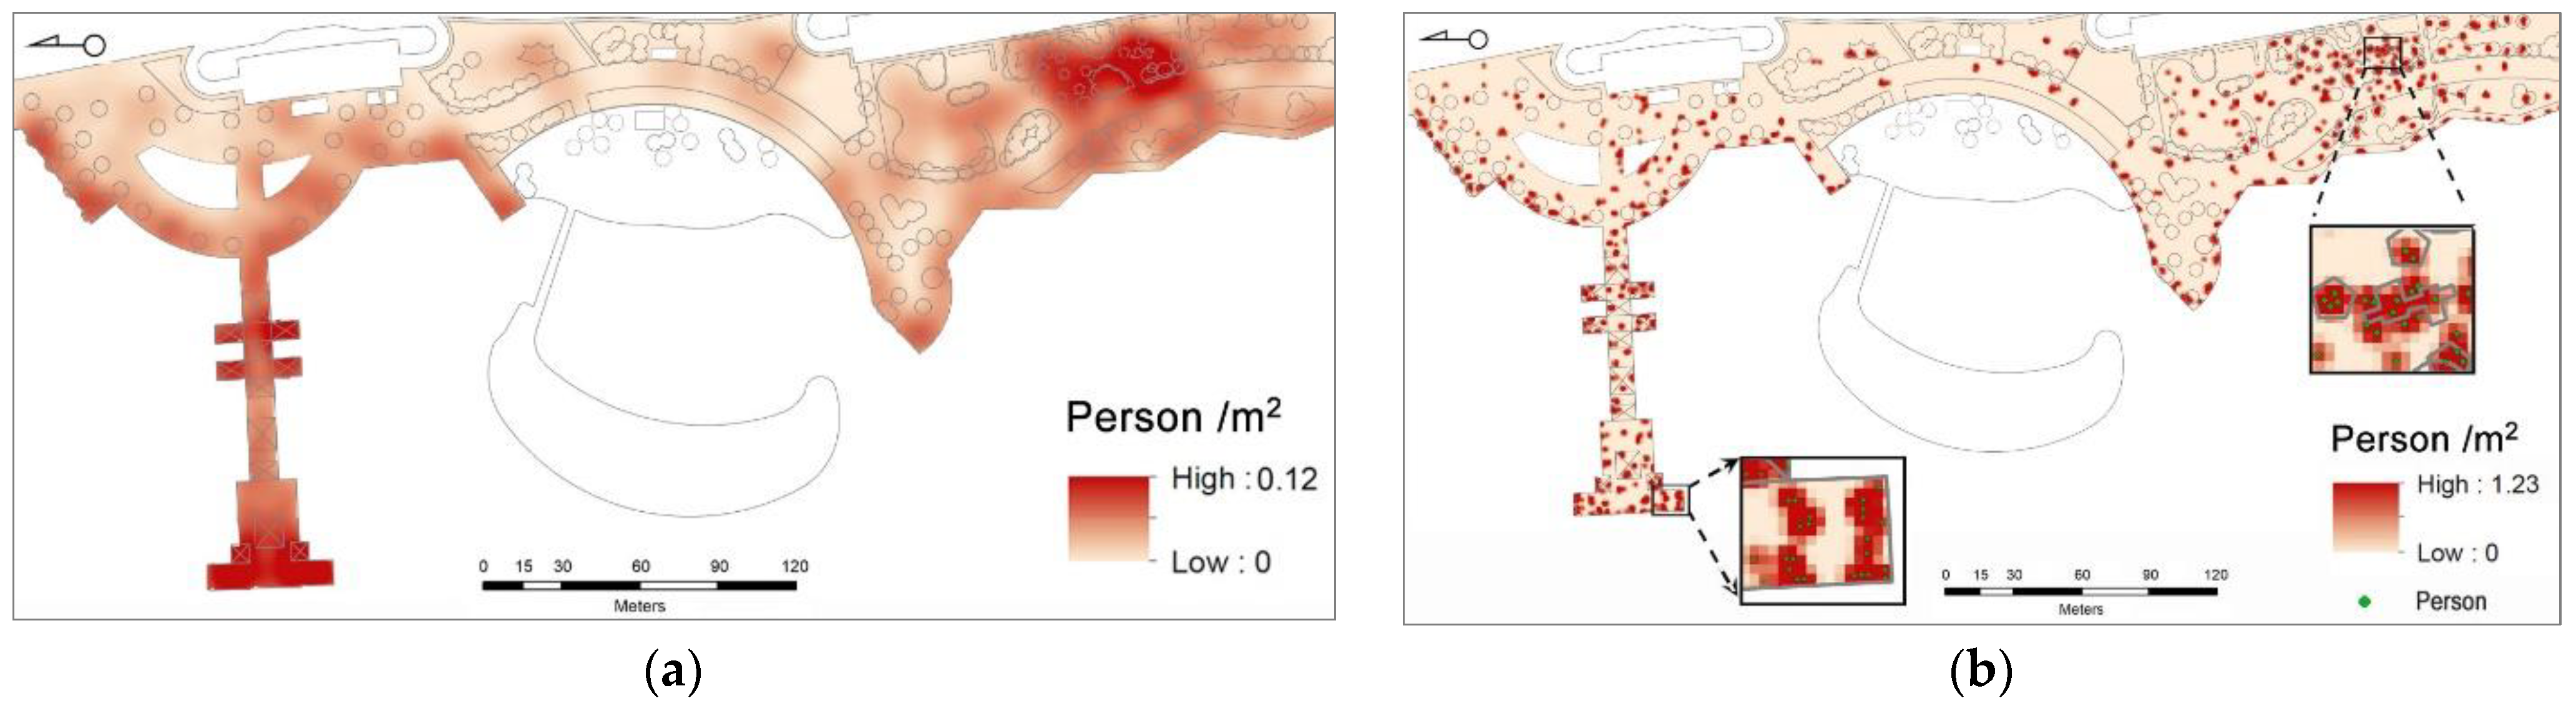
4.1. Data Collected Using Behavioral Mapping

The collected data, using the behavioral mapping method, were transferred to ArcGIS for digital mapping and analysis. The results indicated that there were 978 observed users: the majority were females (53%), and adults (67%) who were in groups (70%) while walking (28%) and talking (59%). Figure 7 shows detailed data about the distribution of users’ behavioral categories in the sample zone.
Moreover, the Kernel Density tool of ArcGIS identified the locations of hotspots (relatively high user density) in the sample zone. The two examined density plots were smoothed by 15 m and 2 m search radii. The 15 m search radius output (Figure 8a) highlighted the relatively highest density POSTs (playground, pier, and waterfront railing area). The 2 m search radius output (Figure 8b) highlighted the spots where the distance between users was <2 m. The mean distance between users and their spatial patterns at each POST was calculated (Table 3). Additionally, the average density of users at each POST was calculated (Table 4).
Additionally, the data were imported to SPSS for further analysis. The Chi-square test was applied to locate the possible associations between the observed behavioral categories and found five statistically significant associations. Gender was found to be significantly associated with the status (Chi-square = 16.016, df = 2, p < 0.001) and the physical activity level (Chi-square = 32.538, df = 4, p < 0.001) (Table 5). Additionally, there was strong evidence of a relationship between the age group category and each of the status categories (Chi-square = 74.779, df = 4, p < 0.001), physical activity level category (Chi-square = 42.762, df = 8, p < 0.001), and physical activity type category (Chi-square = 385.870, df = 8, p < 0.001) (Table 6). Moreover, robust relationships were found between the status category and each of the physical activity level categories (Chi-square = 107.826, df = 8, p < 0.001) and the physical activity type category (Chi-square = 84.661, df = 8, p < 0.001) (Table 7).

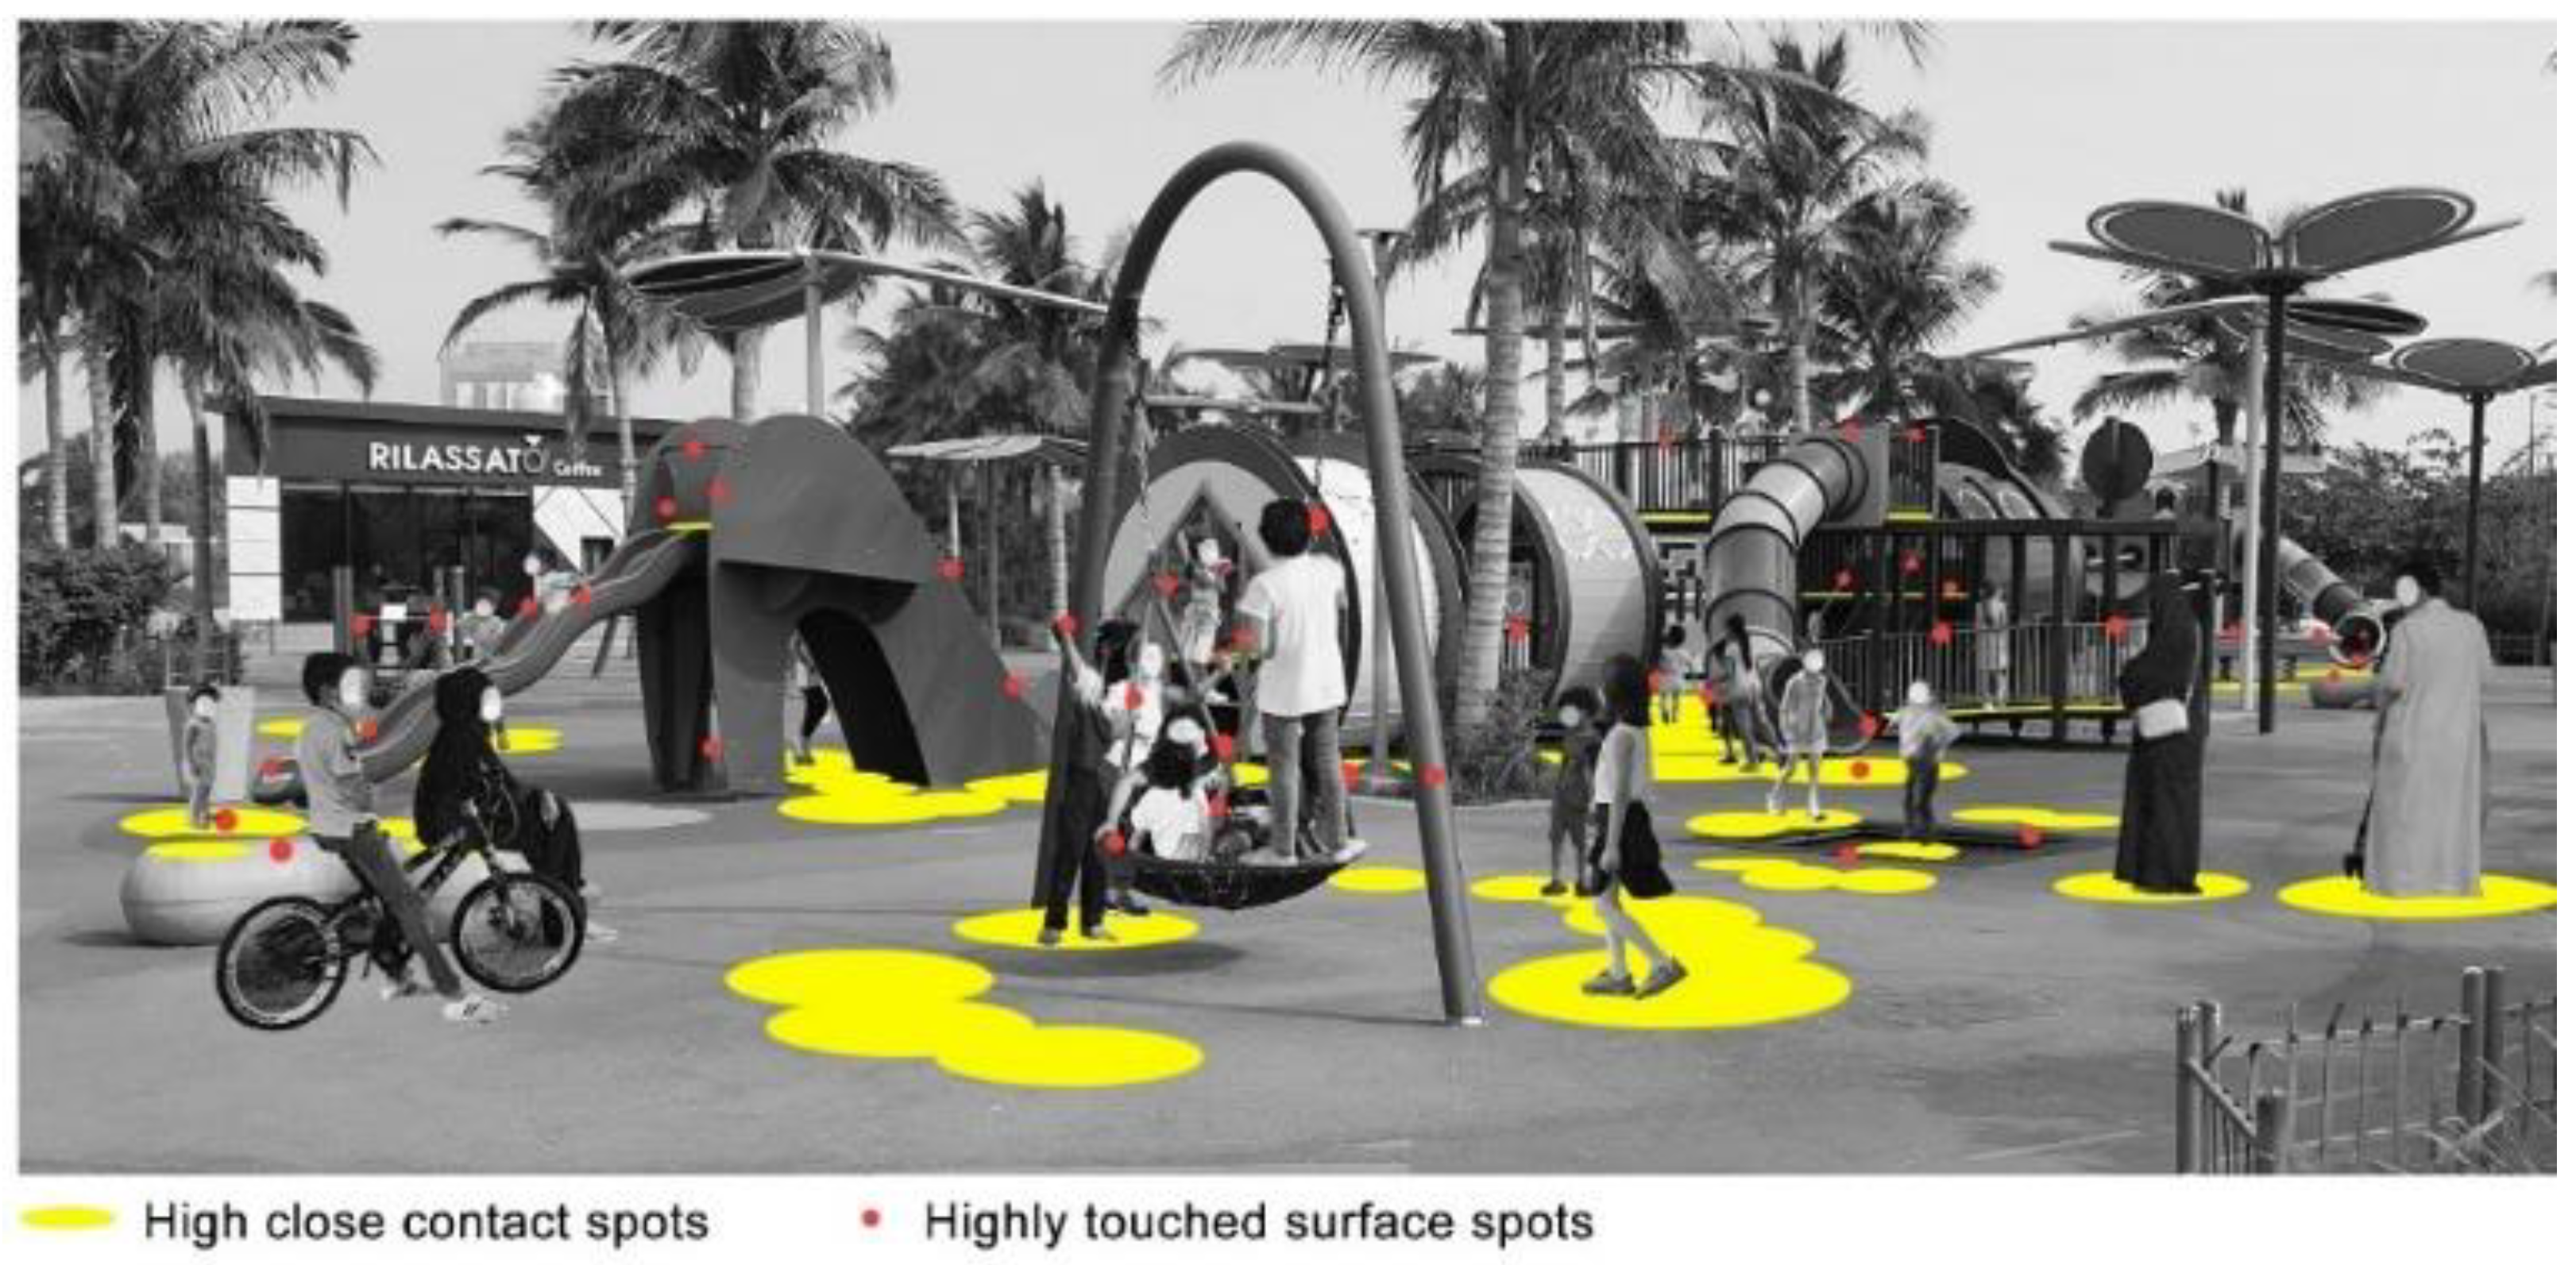
4.2. Data Collected Using Behavioral Tracking

The data collected using the behavioral tracking method were related to three main individual-centered behavioral categories: duration of stay of POST’s users, percentage of POST’s users who were wearing masks, and surface touch frequency by POST’s users (Table 8). Additionally, the locations of the high close contact spots between users and the locations of the most frequently touched spots by users were recorded (Figure 9).

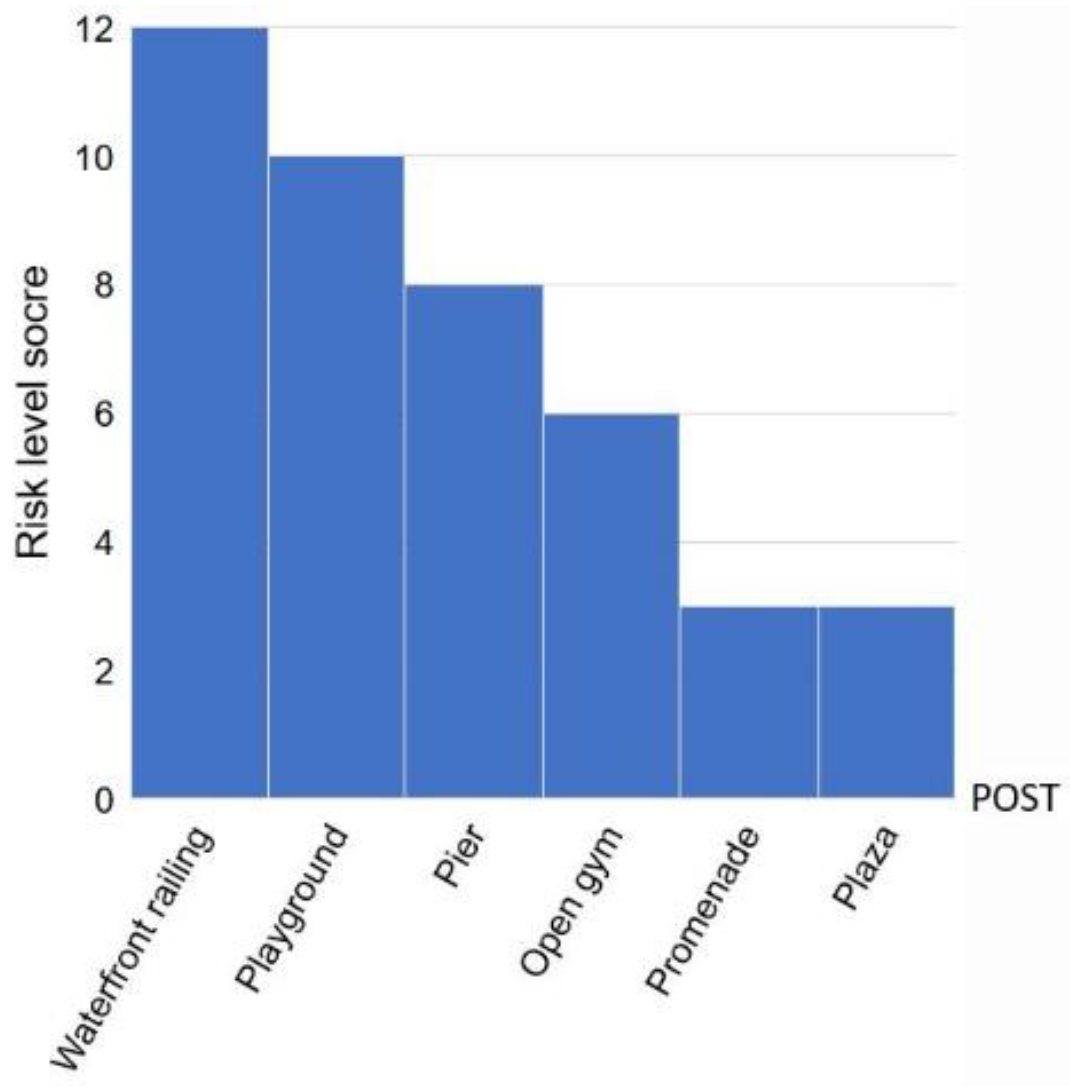
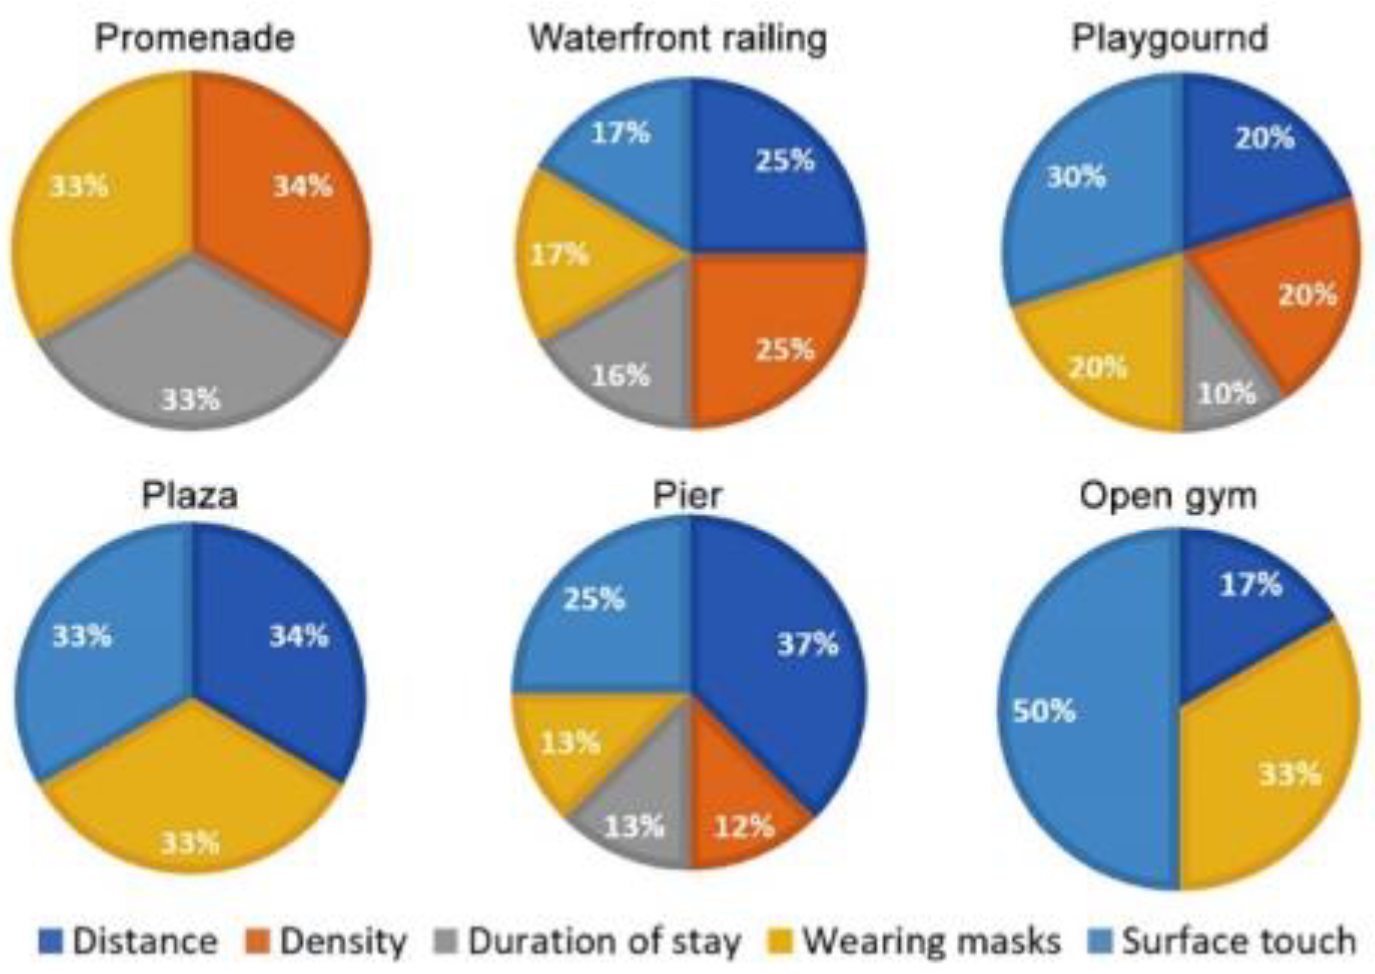
4.3. Identifying the Risk Levels at POSTs Using the Checklist

Finally, the potential risk levels of respiratory illness transmission in the six POSTs of the sample zone were identified using the developed checklist filled out with the data collected and analyzed (Table 9). The order of the POSTs (based on the risk level from highest to lowest): waterfront railing area, playground, pier, open gym, promenade, and plaza (Figure 10). Figure 11 shows the impact of each factor of the checklist on the risk score of the POST:

5. Discussion

While the benefits of using parks are well-proven and documented, the risk of respiratory illness transmission influenced by users’ behaviors at various POSTs remains under-researched. Park managers are increasingly faced with difficult decisions concerning providing public access to outdoor recreational spaces during pandemics, due to the positive association between such accessibility and the increased potential risk of illness transmission. Therefore, park managers need to frequently assess the risks of using various POSTs during pandemics to be able to make informed decisions about public access to parks. This assessment requires understanding the user behaviors (particularly the spatial and temporal behaviors that may increase or decrease the risk of exposure to respiratory illnesses) at the POSTs. This study attempted to compose a practical tool (a checklist) for park managers to assess the risk for transmission of contagious illnesses among POSTs users, decide on meaningful mitigation measures, and monitor the effectiveness of these measures.
For the demonstration purpose, the composed assessment checklist was used to evaluate the potential risk level of getting infected at the prominent POSTs of JWP, based on user behaviors. The collected data were used to fill out the checklist, including five risk assessment factors: user densities, social distancing, duration of stay, wearing masks, and surface touch frequencies. The results of using the checklist show that the transmission risk varies from one POST to another. This provided numerous points of discussion related to how the user behavior may affect the likelihood of respiratory illness transmission in JWP, and how using this assessment checklist could help in managing the visitors during pandemics by lessening the risk of their exposure to infection.

5.1. Risk Assessment of JWP’s POSTs

As seen in Figure 10, the potential risk of illness transmission was found to be varied from relatively high to relatively low at the waterfront railing area, playground, pier, open gym, plaza, and promenade, respectively. The high-risk scores with focusing on the relatively riskiest POSTs are discussed below.
The social distancing of 2 m was, on average, less maintained between the users of the pier (0.8040 m) and the waterfront railing area (0.9124 m) (Table 3). Moreover, the highest user densities were found in those two POSTs (5.9 m2/person in the waterfront railing area, and 9.3 m2/person on the pier) (Table 4). This could be due to the reason that such POSTs attract large numbers of JWP users in semi-confined spaces. In the observations, approximately two-thirds of the users were found to be on the seaward side of the sample zone (about 80% of those were at the pier and waterfront railing area). Additionally, it is found that 76.1% of the users in the waterfront railing area were relaxing (sitting or lying). Such findings confirm those of [39], who found that about 90% of JWP’s visitors prefer sitting, relaxing, and observing the sea. Moreover, this finding is consistent with several other research findings (although about beaches), which indicated that beach users gather in the areas near the waterline [8,40]. Additionally, 85% of the users in the waterfront railing area and 60.7% of the users in the pier were clustered in groups, which increases the potential risk of virus transmission, due to visitors from different households. Refs. [39,41] confirmed that many visitors are from different households who are attracted to JWP for meeting: friends (65%), other family members (61%), or groups of families (25%).
The findings also revealed the low adherence of users to the instructions for wearing masks. Only 22%, 38%, and 40% of the users in the playground, open gym, and waterfront railing area, respectively, were observed wearing masks. The playground and the open gym require high physical exertion, which increases the respiratory rates of users and consequently discourages them from wearing masks. Additionally, the low percentage of users wearing masks in the waterfront railing area increases the potential risk of transmitting the virus. It is particularly crucial when considering that: (a) 55.6% of the users are talking to each other, which increases the chance of virus transmission, (b) the user’s average duration of stay is long (132 min), and (c) 85% of the users (mostly from different households) are sitting in clusters with short social distancing. Such findings confirm other studies which reported similar low percentages of adherence to wearing masks in public spaces. For example, in [42] assessed masks used by the public in outdoor spaces in Toronto, Canada, and Portland, USA. The study observed 18,336 people, and found that only 41.9% were wearing masks. Similarly, in [8] found low mask usage (8.7%) in boardwalk users at Virginia Beach. Unfortunately, such low percentages of adherence to wearing masks are insufficient to eliminate the virus outbreak. As per a study of modelling the effectiveness of respiratory protective devices in reducing influenza outbreak, in [32] found that if more than 80% of a population wear a mask, the elimination of the outbreak with most respiratory protective devices could be achieved.
Observing the touch frequency of surfaces by users indicated two POSTs (playground and open gym) with high risk levels (≥one touch every 1–20 min). Virus transmission due to touching contaminated surfaces remains a potential risk factor for infecting people [43], especially when they belong to less cautious age groups (i.e., children/teenagers). In the playground, 90% of the users were clustered in groups or couples, 55% of the users were children/teenagers, and 93% of the children/teenagers were playing or talking, which could increase the potential spreading of the infection. It is well-known that children of all ages can be infected and can, therefore, spread the virus [44].

5.2. Risk Assessment Tool for Park Managers

The significance of human behavior in controlling the risk of illness transmission was emphasized by many studies. In [45] highlighted the need to have a better understanding of the role of high-risk human behaviors in specific urban spaces in aggravating contagious illnesses. The risk assessment tool (i.e., the checklist) of this study included factors that were proven (if considered) to be effective in hindering contracting contagious illnesses. While violating one factor may not be sufficient to risk people’s health during pandemics or epidemics, the collective force of violating these determinants may lead to fatal outcomes.
The proposed risk assessment tool can be adopted by park managers to take precautionary actions at the relatively high-risk POSTs to mitigate the spatial and temporal user behaviors that may increase the risk of contracting respiratory illnesses. Park managers, with the assistance of park ambassadors and/or CCTV cameras, could use the tool in monitoring users’ adherence to pandemic-related policies and, consequently, adopt data-driven management at the park level. Additionally, the checklist could help the local planning authorities who bear the responsibility of developing and improving all types of parks, to rethink the design of the existing POSTs and plan future ones to lessen the opportunities for users’ risky behaviors. For example, playgrounds can be innovatively designed so that each child can play in a separate space from where they could see and communicate with other children from a safe distance [46]. Another example is that benches can be designed with adjustable planters and dividers to provide isolated seating during pandemics [47].
It is important to mention that the outcome of using the risk assessment checklist of this study might be different if the same methods and checklist are used in other parks worldwide. That is because the transmission dynamics of respiratory illnesses are influenced by several factors including local social/cultural behaviors [48], environmental conditions [49], and space layouts [50], as discussed briefly below.
Culture influences and conditions human behaviors. Thus, personal space (how close a person can stand to colleagues or strangers) varies widely from one culture to another. According to [51], the choice of distance from others is influenced by where a person grew up. They found that the variability of the social distance across cultures can be predicted by temperature (warmer stand closer), age (older stand farther), and gender (women stand closer). Additionally, they found that the Saudi culture, on average, prefers farther interpersonal distances than North and South American, African, Asian, and many European cultures. Accordingly, it became clear that social structure and culture could influence (increase or decrease) the risk of contracting contagious illnesses. As to the environmental conditions that influence the transmission dynamics of respiratory illnesses, in [49] highlighted that COVID-19 transmission is lower in open, hot, and humid areas, which is the case in JWP (temperature averages between 32.1 °C in August, and 23.0 °C in January, while the highest relative humidity is 65.85% in September, and the lowest 55.20% in May) [52]. Regarding the influence of space layout in the transmission of respiratory illnesses, in [50] found that when public open spaces are more open, and ventilation is better, the likelihood of contagion is lower. In [53] argued that better ventilation in outdoor spaces does not necessarily lead to minimizing the risk of exposure if the exposed person is located in the downwind zone of the infected person. Therefore, it is recommended that people in outdoor spaces not only comply with social distancing, but also remain away from angles where wind may carry the virus from nearby infected people to them.
It is also important to mention that viruses mutate constantly, and every time a virus replicates, it has the potential to produce a variant virus that is characterized with higher transmissibility (easiness of spread) [6]. However, because respiratory viruses can be transmitted via known modes of transmission (mentioned in Section 1), which were all considered in the proposed checklist, the checklist’s findings will not be affected due to virus mutations. Additionally, as the proposed checklist can assist in reducing virus spreading, it can help in stopping new variants from emerging.
The proposed framework of this study (including data collection, data analysis, digital mapping, and the risk assessment checklist) is a hybrid system that includes manual and automated processes. Recently, many technological solutions have facilitated automatic observation and data entry using portable or handheld devices which have become increasingly common in behavioral research. However, manual techniques continue to be used because they are highly accessible (unlike many software which was developed within academic environments and rarely commercialized), inexpensive, and relatively effective research tools.

Comparison to Other Similar Frameworks

To compare the proposed framework, a further review of the works by [7,8] was conducted. Those studies have investigated users’ behavior at different park settings to understand the spatial and temporal activities that may influence the transmission of contagious viruses. The aim is to help point to management strategies that park managers can implement to communicate how to reduce the potential for transmission while accessing parks’ POSTs during pandemics. Despite this common goal, the studies are different in terms of technique of data collection, collected human behavior data, results/conclusions, etc. (Table 10).

6. Conclusions

The researcher of this study proposed a risk assessment checklist that can be used by park managers to identify the risk level of contracting a contagious illness at POSTs, based on the spatial and temporal behaviors of the users, that may increase or decrease the risk of exposure to the illness. The risk levels of six POSTs in JWP were assessed by using this checklist. The assessment revealed that the waterfront railing area and playground were the two most risky POSTs, while the plaza and promenade were the least risky POSTs. The risk level of each POST was based on a collective scoring of the five risk factors of the checklist, including social distancing, density, duration of stay, percentage of users wearing masks, and frequency of surface touch by the users.
The checklist can aid park managers to focus on the POSTs with the highest risk, understand the factors that contribute to the risk, and take appropriate mitigative actions through direct and/or indirect management approaches. Additionally, it can help in identifying the best strategies to reduce, replace, or restart activities amidst the lockdown imposed during pandemics. Indeed, applying a full closure to a park that includes various POSTs is disadvantageous when maintaining access to some of those POSTs (with low risk) is possible. Moreover, the results of the checklist may suggest that, in some situations, maintaining accessibility to some parts of a POST can be a better option, as opposed to closing them all (e.g., keeping access to some play equipment in a children’s playground, as opposed to shutting down the whole playground). This would ensure that the residents are not entirely deprived of the mental and physical health benefits of public open spaces during the time of restrictions.
The checklist, with minimal training, can be easily applied by the practitioners. Local authorities and park managers can utilize the proposed checklist to obtain maps of risk levels at different POSTs in their cities and, accordingly, may inform the public.
This study has a number of limitations. It demonstrated how to use the proposed tool in a sample zone from JWP, which represents a particular case within a real-world context. Therefore, the generality of the findings of this case study is limited. Further research would be needed to verify whether findings from this study would be generalizable elsewhere. Additionally, the study did not address the beach POST, because it was closed during the study period. The researcher looked for other beaches in JWF, but all were closed as well. This points to a future direction for researching this missing part and other various POSTs elsewhere. Moreover, the behavioral mapping and tracking methods used in this study were labor- and time-intensive, in terms of collecting data from the field and transferring it from paper to database for digital mapping and analysis. The researcher will consider using more technology in similar future research. For example, UAV may be used (after getting approval of the competent authorities) to collect large amounts of data, with higher accuracy, and less time and effort. Additionally, results yield from using the proposed system can be compared with the feature extraction techniques to show effectiveness of the proposed system. Moreover, future research may explore how to integrate the results revealed from using the checklist with decision support systems to automatically provide optimal mitigations when facing a pandemic. Finally, there might still be indeterminate factors that are not covered by the checklist, so further research is needed to identify those factors and to improve the checklist accordingly.

Funding

This research was funded by the General Research Program 2022 of the Deanship of Scientific Research, King Abdulaziz University, Jeddah, Saudi Arabia (Grant No. 247536).

Institutional Review Board Statement

Not applicable.

Data Availability Statement

Not applicable.

Acknowledgments

I thank the Deanship of Scientific Research, King Abdulaziz University, Jeddah, Saudi Arabia for the financial support. Additionally, I thank Nawaf Alhajaj, Amer Habibullah, and LA Mohammed Bamousa for their comments and advice. Moreover, I thank Fayzah Alsayed, Omar Daghistani, and the students of the Master of Landscape Architecture program at King Abdulaziz University for their support in the field investigations.

Conflicts of Interest

The author declares no conflict of interest.

References

  1. Pasanen, T.P.; White, M.P.; Wheeler, B.W.; Garrett, J.K.; Elliott, L.R. Neighbourhood blue space, health and wellbeing: The mediating role of different types of physical activity. Environ. Int. 2019, 131, 1–11. [Google Scholar] [CrossRef]
  2. Gascon, M.; Zijlema, W.; Vert, C.; White, M.P. Outdoor blue spaces, human health and well-being: A systematic review of quantitative studies. Int. J. Hyg. Environ. Health 2017, 220, 1207–1221. [Google Scholar] [CrossRef]
  3. Dzhambov, A.M.; Lercher, P.; Browning, M.H.E.M.; Stoyanov, D.; Petrova, N.; Novakov, S.; Dimitrova, D.D. Does greenery experienced indoors and outdoors provide an escape and support mental health during the COVID-19 quarantine? Environ. Res. 2021, 196, 1–12. [Google Scholar] [CrossRef]
  4. Pouso, S.; Borja, Á.; Fleming, L.E.; Gómez-Baggethun, E.; White, M.P.; Uyarra, M.C. Contact with blue-green spaces during the COVID-19 pandemic lockdown beneficial for mental health. Sci. Total Environ. 2021, 756, 1–12. [Google Scholar] [CrossRef]
  5. Pan, J.; Bardhan, R.; Jin, Y. Spatial distributive effects of public green space and COVID-19 infection in London. Urban For. Urban Green. 2021, 62, 1–15. [Google Scholar] [CrossRef]
  6. Slater, S.J.; Christiana, R.W.; Gustat, J. Recommendations for Keeping parks and green space accessible for mental and physical health during COVID-19 and other pandemics. Prev. Chronic Dis. 2020, 17, E59. [Google Scholar] [CrossRef]
  7. Miller, Z.D.; Freimund, W.; Dalenberg, D.; Vega, M. Observing COVID-19 related behaviors in a high visitor use area of Arches National Park. PLoS ONE 2021, 16, e0247315. [Google Scholar] [CrossRef]
  8. Kane, B.; Zajchowski, C.A.; Allen, T.R.; McLeod, G.; Allen, N.H. Is it safer at the beach? Spatial and temporal analyses of beachgoer behaviors during the COVID-19 pandemic. Ocean Coast Manag. 2021, 205, 1–9. [Google Scholar] [CrossRef]
  9. Leung, N.H.L. Transmissibility and transmission of respiratory viruses. Nat. Rev. Microbiol. 2021, 19, 528–545. [Google Scholar] [CrossRef]
  10. Parshina-Kottas, Y.; Saget, B.; Patanjali, K.; Fleisher, O.; Gianordoli, G. This 3-D simulation shows why social distancing is so important. The New York Times, 14 April 2020, p. 1. Available online: https://www.nytimes.com/interactive/2020/04/14/science/coronavirus-transmission-cough-6-feet-ar-ul.html (accessed on 1 October 2020).
  11. WHO—World Health Organization. Coronavirus Disease (COVID-19) Advice for the Public. Available online: https://www.who.int/emergencies/diseases/novel-coronavirus-2019/advice-for-public (accessed on 4 September 2021).
  12. Airhihenbuwa, C.; Iwelunmor, J.; Munodawafa, D.; Ford, C.; Oni, T.; Agyemang, C.; Mota, C.; Ikuomola, O.; Simbayi, L.; Fallah, M.; et al. Culture matters in communicating the global response to COVID-19. Prev. Chronic Dis. 2020, 17, E60. [Google Scholar] [CrossRef] [PubMed]
  13. Airhihenbuwa, C. Healing Our Differences: The Crisis of Global Health and the Politics of Identity; Rowman & Littlefield: New York, NY, USA, 2006. [Google Scholar]
  14. Hall, E.T. The Hidden Dimension; Doubleday: New York, NY, USA, 1966. [Google Scholar]
  15. Zhao, S.; Stone, L.; Gao, D.; Musa, S.S.; Chong, M.K.C.; He, D.; Wang, M.H. Imitation dynamics in the mitigation of the novel coronavirus disease (COVID-19) outbreak in Wuhan, China from 2019 to 2020. Ann. Transl. Med. 2020, 8, 1–14. [Google Scholar] [CrossRef] [PubMed]
  16. Bechtel, R.; Zeisel, J. Observation: The world under a glass. In Methods in Environmental and Behavioral Research; Marans, R., Bechtel, R., Michelson, W., Eds.; Van Nostrand Reinhold: New York, NY, USA, 1987; pp. 11–40. [Google Scholar]
  17. Sommer, R.; Sommer, B. A Practical Guide to Behavioral Research: Tools and Techniques, 5th ed.; Oxford University Press: New York, NY, USA, 2002; pp. 63–81. [Google Scholar]
  18. KLA—Kamphans Landscape Architecture. Waterfront Development. Available online: https://www.kla-kamphans.com/waterfrontdevelopment (accessed on 18 January 2021).
  19. Jeddah’s seaside resorts to attract 2 million tourists. Saudi Gazette, 3 August 2017. Available online: https://saudigazette.com.sa/article/514370 (accessed on 4 March 2022).
  20. Jeddah Municipality. Jeddah Waterfront. Available online: https://www.jeddah.gov.sa/Projects/RW/index.php (accessed on 18 January 2021).
  21. Arab News. Jeddah’s North Corniche Project 80% Complete: Mayor. Available online: https://www.arabnews.com/node/1122956/saudi-arabia (accessed on 13 February 2021).
  22. Akhbaar24. The Director of the Jeddah Waterfront Project Explains the Mechanism for Controlling Vandals. Available online: https://akhbaar24.argaam.com/article/detail/370178 (accessed on 4 January 2022).
  23. Manning, R.E. Studies in Outdoor Recreation: Search and Research for Satisfaction, 3rd ed.; Oregon State University Press: Corvallis, OR, USA, 2011. [Google Scholar]
  24. Alsherbini, R. COVID-19: Jeddah Seafront Shut Down. World GULF. Available online: https://gulfnews.com/world/gulf/saudi/covid-19-jeddah-seafront-shut-down-1.1591775565905 (accessed on 2 December 2021).
  25. GASTAT—General Authority for Statistics. Hajj Statistics 2019–1440. Available online: https://www.stats.gov.sa/sites/default/files/haj_40_en.pdf (accessed on 12 July 2021).
  26. GASTAT—General Authority for Statistics. Umrah Statistics 2019–1440. Available online: https://www.stats.gov.sa/sites/default/files/umrah_2019_a-15-3.pdf (accessed on 12 July 2021).
  27. Alajlan, S.A.; Alhusseini, N.K.; Asdaq, S.M.B.; Mohzari, Y.; Alamer, A.; Alrashed, A.A.; Alamri, A.S.; Alsanie, W.F.; Alhomrani, M. The impact of lockdown strategies on the basic reproductive number of coronavirus (COVID-19) cases in Saudi Arabia. Saudi J. Biol. Sci. 2021, 28, 4926–4930. [Google Scholar] [CrossRef] [PubMed]
  28. Saudi Press Agency. Saudi Arabia Imposes 24-Hour Curfew on Riyadh, Tabuk, Dammam, Dhahran, Hafouf, Jeddah, Taif, Qatif and Khobar, Interior Ministry Announces. Available online: https://www.spa.gov.sa/viewstory.php?lang=en&newsid=2071013 (accessed on 23 October 2021).
  29. Chu, D.K.; Akl, E.A.; Duda, S.; Solo, K.; Yaacoub, S.; Schünemann, H.J. Physical distancing, face masks, and eye protection to prevent person-to-person transmission of SARS-CoV-2 and COVID-19: A systematic review and meta-analysis. Lancet 2020, 395, 1973–1987. [Google Scholar] [CrossRef] [PubMed]
  30. IPM—Institute of Place Management. Proposing the Lower Bounds of Area Needed for Individuals to Social Distance across a Range of Town Centre Environments; IPM Working Paper Series; Manchester Metropolitan University: Manchester, UK, 2021; Available online: https://www.highstreetstaskforce.org.uk/resources/details/?id=dd575f47-8996-413f-8376-e8cf9c0e82b8 (accessed on 15 July 2021).
  31. KolHaCovid. COVID-19 Exposure Risk. Available online: https://kolhacovid.com/article/covid-19-exposure-risk (accessed on 22 January 2021).
  32. Yan, J.; Guha, S.; Hariharan, P.; Myers, M. Modeling the effectiveness of respiratory protective devices in reducing influenza outbreak. Risk Anal. 2019, 39, 647–661. [Google Scholar] [CrossRef] [PubMed]
  33. Pitol, A.K.; Julian, T.R. Community transmission of SARS-CoV-2 by surfaces: Risks and risk reduction strategies. Environ. Sci. Tech. Lett. 2021, 8, 263–269. [Google Scholar] [CrossRef]
  34. NOAA—National Centers for Environmental Information. Jeddah Weather Averages. Available online: https://www.ncei.noaa.gov (accessed on 3 January 2022).
  35. Google. (n.d.). Google Maps Typical Traffic of Jeddah’s Corniche Road. Available online: https://www.google.com/maps/@21.6118359,39.1013262,2069m/data=!3m1!1e3!5m1!1e1 (accessed on 10 October 2021).
  36. Ittelson, W.H.; Rivlin, L.G.; Proshansky, H.M. The use of behavioral maps in environmental psychology. In Environmental Psychology: People and Their Physical Setting, 2nd ed.; Proshansky, H., Ed.; Holt, Rinehart & Winston: New York, NY, USA, 1976; pp. 340–351. [Google Scholar]
  37. Ng, C.F. Behavioral mapping and tracking. In Research Methods for Environmental Psychology; Gifford, R., Ed.; John Wiley & Sons, Ltd.: Chichester, UK, 2016; pp. 29–51. [Google Scholar]
  38. Patel, A.; Waters, N. Using Geographic Information Systems for Health Research. In Application of Geographic Information Systems; Alam, B.M., Ed.; IntechOpen: London, UK, 2012; pp. 303–320. [Google Scholar]
  39. Qudah, R.; Ragab, T.; Shokry, M. Deriving urban design principles for Jeddah Corniche developments: User-preferences approach. In Proceedings of the IOP Conference Series: Earth and Environmental Science, Chulalongkorn University, Bangkok, Thailand, 24–25 April 2019; Volume 385. [Google Scholar] [CrossRef]
  40. Cumberbatch, J.; Moses, J. Social carrying capacity in beach management in Barbados. J. Coastal Res. 2011, 61, 14–23. [Google Scholar] [CrossRef]
  41. Mostafa, L. Urban and social impacts of waterfronts development, case study: Jeddah Corniche. Procedia Environ. Sci. 2017, 37, 205–221. [Google Scholar] [CrossRef]
  42. Atzema, C.L.; Mostarac, I.; Button, D.; Austin, P.C.; Javidan, A.P.; Wintraub, L.; Li, A.; Patel, R.V.; Lee, D.D.; Latham, N.P.; et al. Assessing effective mask use by the public in two countries: An observational study. BMJ Open 2021, 11, 1–7. [Google Scholar] [CrossRef]
  43. CDC—Centers for Disease Control and Prevention. Scientific Brief: SARS-CoV-2 Transmission. Available online: https://www.cdc.gov/coronavirus/2019-ncov/science/science-briefs/sars-cov-2-transmission.html#anchor_1619805200745 (accessed on 8 October 2021).
  44. Calvani, M.; Cantiello, G.; Cavani, M.; Lacorte, E.; Mariani, B.; Panetta, V.; Parisi, P.; Parisi, G.; Roccabella, F.; Silvestri, P.; et al. Reasons for SARS-CoV-2 infection in children and their role in the transmission of infection according to age: A case-control study. Ital. J. Pediatr. 2021, 47, 1–10. [Google Scholar] [CrossRef]
  45. Li, B.; Peng, Y.; He, H.; Wang, M.; Feng, T. Built environment and early infection of COVID-19 in urban districts: A case study of Huangzhou. Sustain. Cities Soc. 2020, 66, 1–10. [Google Scholar] [CrossRef]
  46. Hitti, N. Rimbin is an “Infection-Free” Playground Concept Designed to Look Like Water Lilies. dezeen. Available online: https://www.dezeen.com/2020/05/19/rimbin-playground-concept-coronavirus-design (accessed on 1 September 2021).
  47. Kamel, A. Sensible Social Distancing Solutions for Covid-19 Recovery. Green Furniture Concept. Available online: https://greenfc.com/stories/sensible-social-distancing-solutions-for-covid-19 (accessed on 10 September 2021).
  48. Squazzoni, F.; Polhill, J.G.; Edmonds, B.; Ahrweiler, P.; Antosz, P.; Scholz, G.; Chappin, É.; Borit, M.; Verhagen, H.; Giardini, F.; et al. Computational models that matter during a global pandemic outbreak: A call to action. Jasss J. Artif. Soc. S 2020, 23, 4298. [Google Scholar] [CrossRef] [Green Version]
  49. Correa-Araneda, F.; Ulloa-Yáñez, A.; Núñez, D.; Boyero, L.; Tonin, A.M.; Cornejo, A.; Urbina, M.A.; Díaz, M.E.; Figueroa-Muñoz, G.; Esse, C. Environmental determinants of COVID-19 transmission across a wide climatic gradient in Chile. Sci. Rep. 2021, 11, 9849. [Google Scholar] [CrossRef] [PubMed]
  50. Niu, Q.; Wu, W.; Shen, J.; Huang, J.; Zhou, Q. Relationship between built environment and COVID-19 dispersal based on age stratification: A case study of Wuhan. Int. J. Environ. Res. Public Health 2021, 18, 7563. [Google Scholar] [CrossRef]
  51. Sorokowska, A.; Sorokowski, P.; Hilpert, P.; Cantarero, K.; Frackowiak, T.; Ahmadi, K.; Alghraibeh, A.M.; Aryeetey, R.; Bertoni, A.; Bettache, K.; et al. Preferred interpersonal distances: A global comparison. J. Cross Cult. Psychol. 2017, 48, 577–592. [Google Scholar] [CrossRef] [Green Version]
  52. Climate-data.org (n.d.). Climate Jeddah—Saudi Arabia. Available online: https://en.climate-data.org/asia/saudi-arabia/makkah-region/jeddah-764388/ (accessed on 28 November 2021).
  53. Yang, X.; Yang, H.; Ou, C.; Luo, Z.; Hang, J. Airborne transmission of pathogen-laden expiratory droplets in open outdoor space. Sci. Total Environ. 2021, 773, 145537. [Google Scholar] [CrossRef] [PubMed]
Figure 1. Location and zones of JWP.
Sustainability 15 00904 g001
Figure 2. The distribution of prominent POSTs in the zones of JWPs, and the selected sample zone.
Sustainability 15 00904 g002
Figure 3. The POSTs of the sample zone (Fisher zone).
Sustainability 15 00904 g003
Figure 4. Average users’ number in the sample zone on weekdays and weekends.
Sustainability 15 00904 g004
Figure 5. Typical traffic on Corniche Road at three selected times on weekdays and weekends. The sample zone is highlighted by a dashed rectangle.
Sustainability 15 00904 g005
Figure 6. Schema of the research methodology.
Sustainability 15 00904 g006
Figure 7. Distribution of the users’ behavioral categories in the sample zone. (a) gender, (b) age groups, (c) status, (d) physical activity levels, (e) physical activity types, and (f) number of users per behavioral category.
Sustainability 15 00904 g007aSustainability 15 00904 g007b
Figure 8. ArcGIS’s Kernel Density smoothed by (a) 15 m, and (b) 2 m search radii.
Sustainability 15 00904 g008
Figure 9. Example for identifying the high close contact and surface touch spots in a playground.
Sustainability 15 00904 g009
Figure 10. Risk levels of respiratory illness transmission at the sample zone’s POSTs, according to the assessment checklist.
Sustainability 15 00904 g010
Figure 11. Influence of the assessment checklist’s factors on the risk score of the sample zone’s POSTs.
Sustainability 15 00904 g011
Table 1. The developed risk assessment checklist.
Risk CategoryRisk FactorRisk Level and ScorePOST
1. Close contact between users1.1 Average distance between POST’s users
(m)
None (>2) = 0
Low (>1.5–2) = 1
Medium (1–1.5) = 2
High (<1) = 3
1.2 Average density of POST’s users
(m2/person)
None (>12) = 0
Low (>9–12) = 1
Medium (6–9) = 2
High (<6) = 3
1.3 Average duration of stay of POST’s users
(min.)
None (<15) = 0
Low (15–<120) = 1
Medium (120–<360) = 2
High (≥360) = 3
1.4 Average percentage of wearing masks among POST’s usersNone (80–100%) = 0
Low (50–79%) = 1
Medium (20–49%) = 2
High (0–19%) = 3
2. Surface touch by users2.1 Average surface touch frequency by POST’s users
(Touch every x min.)
None (No touch) = 0
Low (One touch every >240) = 1
Medium (One touch every 21–239) = 2
High (≥one touch every 1–20) = 3
Risk score (out of 15)
Table 2. Behavioral categories and their corresponding codes.
Observation CategoryCodeDefinition
GenderMaleM*
FemaleF *
Age
Group
Child/TeenagerctLooks <18 years old
AdultadLooks ≥18 and <60 years old
ElderlyelLooks ≥60 years old
StatusAloneoneWhen lonely and isolated
CoupletwoTwo individuals (same or opposite gender)
GroupgrA group of >2 individuals
Physical
activity level
Lyingly*
Sittingsit*
Standingsta*
Walkingwal*
Runningrun*
Physical activity typeExercisingexeTraining in an athletic equipment
Playingplay*
Talkingtalk*
ObservingobsWhen contemplating, looking to the sea, way, or people.
Otheroth*
* Self-explanatory.
Table 3. Mean distance between users and their spatial patterns in each POST.
POSTObserved Mean DistanceExpected Mean DistanceNearest Neighbour RatioSpatial PatternCritical Value
(z-Score)
Significance Level
(p-Value)
Likelihood the Pattern Could Be Result of Random Chance
Promenade4.30473.64251.1818Dispersed2.93050.0034<1%
Waterfront railing area0.91241.21820.7489Clustered−3.08440.0020<1%
Playground1.11511.44390.7723Clustered−4.54780.0000<1%
Plaza1.94832.81340.6925Clustered−14.26010.0000<1%
Pier0.80401.52660.5267Clustered−14.79650.0000<1%
Open gym1.59673.06670.5207Clustered−4.06610.0000<1%
Table 4. User density at each POST.
POSTArea (m2)PersonDensity (m2/Person)
Promenade37687153.1
Waterfront railing area13892345.9
Playground9091267.2
Plaza747223631.7
Pier24892679.3
Open gym12793437.6
Table 5. Cross-tabulation between the gender category and status and physical activity level categories.
Behavioral CategoryGenderTotalSustainability 15 00904 i001
FemaleMale
StatusAlone3.30%4.20%7.50%
Couple9.40%12.70%22.10%
Group40.10%30.40%70.40%
Physical
activity level
Lying1.1%0.4%1.5%Sustainability 15 00904 i002
Running0.2%0.7%0.9%
Sitting27.0%16.8%43.8%
Standing11.1%15.0%26.2%
Walking13.3%14.3%27.6%
Table 6. Cross-tabulation between the age group category and status, physical activity level, and physical activity type categories.
Behavioral categoryAge GroupTotalSustainability 15 00904 i003
AdultChild/TeenagerElderly
StatusAlone6.9%0.6%0.0%7.5%
Couple18.8%2.2%1.0%22.1%
Group41.5%23.4%5.5%70.4%
Physical Activity LevelLying1.3%0.2%0.0%1.5%Sustainability 15 00904 i004
Running0.9%0.0%0.0%0.9%
Sitting27.7%10.8%5.2%43.8%
Standing17.9%7.4%0.9%26.2%
Walking19.3%7.9%0.4%27.6%
Physical Activity TypeExercising0.8%0.9%0.0%1.7%Sustainability 15 00904 i005
Observing19.4%4.0%1.2%24.6%
Other5.0%4.2%0.6%9.8%
Playing0.2%10.3%0.0%10.5%
Talking41.7%6.9%4.7%53.3%
Table 7. Cross-tabulation between the status category and physical activity level and physical activity type categories.
Behavioral CategoryStatusTotal
AloneCoupleGroup
Physical Activity LevelLying0.1%0.2%1.2%1.5%Sustainability 15 00904 i006
Running0.0%0.9%0.0%0.9%
Sitting0.9%5.8%37.0%43.8%
Standing3.3%7.6%15.3%26.2%
Walking3.2%7.6%16.9%27.6%
Physical Activity TypeExercising0.1%0.8%0.8%1.7%Sustainability 15 00904 i007
Observing4.5%6.1%14.0%24.6%
Playing0.5%0.9%9.1%10.5%
Talking1.9%13.1%38.2%53.3%
Other0.4%1.1%8.3%9.8%
Table 8. Duration of stay, percentage of users wearing masks, and surface touch frequency (averaged) at each POST.
Behavioral Category (Averaged)User’s Average Duration of StayAverage Percentage of Users Wearing MasksAverage of Surface Touch Frequency
Promenade43 min62%No touch
Waterfront railing area132 min44%One touch every 21–239 min
Playground22 min22%≥one touch every 1–20 min
Plaza10 min60%One touch every >240 min
Pier26 min55%One touch every 21–239 min
Open gym7 min38%≥one touch every 1–20 min
Table 9. Risk assessment using the composed checklist.
Risk CategoryRisk FactorRisk Level and ScorePOST
PWPLPZPRO
1. Close contact between users1.1 Average distance between POST’s users
(m)
None (>2) = 0
Low (>1.5–2) = 1
Medium (1–1.5) = 2
High (<1) = 3
1.2 Average density of POST’s users
(m2/person)
None (>12) = 0
Low (>9–12) = 1
Medium (6–9) = 2
High (<6) = 3
1.3 Average duration of stay of POST’s users
(min.)
None (<15) = 0
Low (15–<120) = 1
Medium (120–< 360) = 2
High (≥360) = 3
1.4 Average percentage of users wearing masks among POST’s usersNone (80–100%) = 0
Low (50–79%) = 1
Medium (20–49%) = 2
High (0–19%) = 3
2. Surface touch by users2.1 Average surface touch frequency by POST’s users
(touch every x min.)
None (No touch) = 0
Low (One touch every >240) = 1
Medium (One touch every 21−239) = 2
High (≥one touch every 1−20) = 3
Risk score (out of 15)31210386
P: Promenade, W: Waterfront railing area, PL: Playground, PZ: Plaza, PR: Pier, and O: Open gym.
Table 10. A comparison of the proposed technique and other similar ones.
Compared ItemProposed FrameworkSimilar Frameworks
[7][8]
Location of study areaJWP, Saudi ArabiaArches National Park, UT, USA.Virginia Beach, VA, USA
Size of study areaAbout 38,000 m2About 220 m2About 12,000 m2
Technique of data collectionBehavioral mapping and tracking
(Paper-based recording supported with mobile phone photography and video recordings)
Motion sensor cameras Open-source webcam and UAV
Date of data collectionNov. 2021–Feb. 2022July, 2020June and July 2020
Collected human behavior dataGender, age group, status, physical activity level, physical activity type, distance between users, users’ density,
users’ duration of stay, mask-wearing, and surface touch frequency
Number of groups, group size, facial coverings (mask or bandana) and encounters within 1.83 m of other groups.Physical distancing between beachgoers
Results/conclusionThe risk level of respiratory illness transmission at each examined POST was identified as a comparable number. Park managers should focus on the POSTs with the highest risk, understand the factors that contribute to the risk, and take appropriate mitigative actions. The POST’s assessment should be conducted periodically.Encounters increase
as the number or the size of visitors’ groups increases. Park managers should continue to monitor the compliance with pandemic safety measures and encourage visitors to avoid making large groups.
Usage patterns: concentrated use of the beach adjoining shoreline above high tide, with one third of the landward adjacent upper beach vacant.
Disclaimer/Publisher’s Note: The statements, opinions and data contained in all publications are solely those of the individual author(s) and contributor(s) and not of MDPI and/or the editor(s). MDPI and/or the editor(s) disclaim responsibility for any injury to people or property resulting from any ideas, methods, instructions or products referred to in the content.

