Article

Is Cycling Safe? Does It Look like It? Insights from Helsinki and Barcelona

by
Margarita Martínez-Díaz
1,* and
Rosa Arroyo
2
1
Barcelona Innovative Transportation (BIT), UPC-BarcelonaTech, 08034 Barcelona, Spain
2
Transport Department, School of Civil Engineering, Universitat Politècnica de València, 46022 Valncia, Spain
*
Author to whom correspondence should be addressed.
Sustainability 2023, 15(2), 905; https://doi.org/10.3390/su15020905
Submission received: 29 November 2022 / Revised: 21 December 2022 / Accepted: 29 December 2022 / Published: 4 January 2023
(This article belongs to the Special Issue Road Safety and Better Mobility in Sustainable Urban Transport)

Abstract

:
Cycling constitutes a clean, healthy, and low-cost mode of transport. Therefore, the promotion of cycling is currently one of the main goals of administrations around the word. Former studies have shown that safety perception plays a fundamental role in the acceptance of bikes as a habitual mode of transport. In this context, this research aims to determine which variables and actions can give rise to this feeling of safety and, therefore, collaborate in the modal shift towards a more sustainable mobility. For this purpose, different strategies have been developed in two different contexts, Helsinki and Barcelona, using two different methodologies, namely expert interviews and analysis of survey data. Particularly, the methodology of analysis used includes descriptive statistics and path analysis. Results point out that safety perception highly depends on trip purpose, as significant differences are observed for daily users compared to those who cycle for sport reasons. Demographic characteristics (age, gender, etc.) and use patterns are also associated with different perceptions of safety and different behaviors. However, for any cyclist, the quality of the available infrastructure significantly influences his/her safety perception. Thus, the provision of good quality and well-structured cycling infrastructure is the most important initiative to promote cycling.

Graphical Abstract

1. Introduction

In recent years, mainly as a consequence of global warming and the high levels of pollution suffered in many cities around the world, mobility, and in particular urban mobility, has undergone a positive revolution [1,2]. This revolution was accelerated by the COVID-19 pandemic, as it became clear (i) that if road traffic decreased, the air was cleaned, noise was reduced, and even fauna and flora were reborn in some cities and (ii) that most of these cities had been designed to facilitate the transit of motor vehicles, at the expense of reducing space for citizens. While at the end of the last century and the beginning of the current one, the leading topics in the field of mobility were autonomous vehicles or flying drones, in the last decade, the terms “sustainable mobility”, “friendly mobility”, “soft modes of transport”, and “multimodality”, among others, have been in the spotlight of most administrations. The role that technology can play in achieving better mobility is not relegated, but it becomes a tool to be applied when necessary and not an end in itself, as it could be perceived in the past. Among other measures, some local administrations are looking to implement the 15-min city model, so that access to major activities is feasible on foot or using soft modes of transport, including scooters. Other more dispersed cities are working to coordinate these same models for last-mile trips with medium/long distance public transport services. Both the safe coexistence of the different means of transport within cities and their seamless coordination so that they allow any distance to be covered are still challenges to be solved in most territories [1,3,4].
Cycling fits perfectly into any of the above terms representing current trends in mobility. It constitutes a clean and healthy, low-cost mode of transport that, if properly integrated, can be part of a mobility chain that includes other means of transport [5]. This is why many administrations have implemented or promoted bike-sharing rental systems [2], have deployed bike lanes in their territories, carry out communication campaigns to promote cycling, or legislate to protect cyclists from, above all, motorized means of transport. Despite these common efforts, the degree of success of these measures varies widely: while in some cities (e.g., Utrecht, Munster, Antwerp, Copenhagen, Hangzhou) cycling has become a common and majority mode of transport, in others (e.g., Hong Kong, Chicago, Madrid, etc.), the modal share of cycling is still very low [6]. Many researchers ([2,7], etc.) have been interested in this subject and have shed light on the possible causes for these differences. Additionally, there are many possible influential variables analyzed and the methodologies used for such analyses. Among these variables are those related to the configuration of the city itself (size, location of activities, orography, etc.), the existing cycling infrastructure (dedicated or not, length, location, design in plan and elevation, etc.), the existing alternative transport offer (e.g., quality of public transport), the weather, etc. User-related variables are also considered, ranging from socio-demographic factors to previous cycling experience and expertise, sensitivity to climate change, driving behavior, risk tolerance, etc. [2]. The large number of variables involved, as well as their variability depending on the context, make it difficult to carry out any research without limitations and whose results can be generally extrapolated. The positive side of this fact is that any additional study implies a contribution to the state of knowledge.
In this context, this article starts from the premise that the perception of safety or, conversely, the fear of having an accident while cycling, play a fundamental role in, respectively, the greater or lesser acceptance of bikes as a habitual mode of transport [
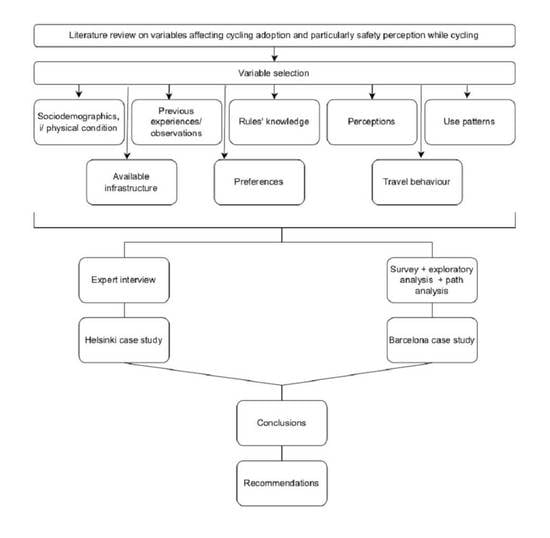
8]. Therefore, the objective of this study is, on the one hand, to verify this hypothesis and, on the other hand, to determine which variables and actions can give rise to this feeling of safety and, therefore, collaborate in the modal shift towards this sustainable mode of transport. This analysis has been carried out in two different contexts, Helsinki and Barcelona, and using two different methodologies, namely expert interviews and path analysis. This combination of contexts and methodologies has allowed interesting conclusions to be drawn, which can help administrations in their effort to promote cycling.
The rest of this paper is organized as follows: Section 2 contains a literature review on the factors influencing cycling and cyclists’ perceptions and behaviors; Section 3 introduces the two methodologies used in this research, that were respectively applied to the case studies explained in Section 4. Then, the results of both data analyses are included in Section 5 and discussed with more detail in Section 6. Finally, the main conclusions of this research are drawn in Section 7, where some limitations and possible topics for future research are also highlighted.

2. Literature Review

In some small cities and towns around the world, bicycles have been one of the most widely used means of transport for many years. In contrast, their introduction as a regular mode of transport is more recent in other areas, and it is mainly linked to the fight against pollution and the increase in congested traffic situations [2,3,5,6]. Administrations try to improve cities’ quality of life, among others devoting more space to soft modes of transportation [4]. Therefore, they launch sensibilization campaigns aimed at changing travel patterns towards sustainability. Worldwide, an increasing number of citizens positively react to these messages and adopt bikes as a healthy, cheap, and sustainable mode of transport. However, overall, there is still much to do so that bike use rate resembles individual car or public transport use rates. In fact, even cyclists seem to be divided into two groups: first, those that do not consider bikes as a “normal” transportation mode, but as a means to do sport, and frequently use private cars for their daily trips, and second, those that conversely see bikes as another natural means and do not usually travel with public transportation or private cars [9].
Ref. [10] performed a comprehensive review of cycling behavior across countries and citizens with very different features. Particularly, they compared the results of several city, regional, and national travel surveys from 17 countries across of all continents, launched between 2009 and 2019. The Netherlands, Japan, and Germany stood out as those countries with the highest cycling level, mainly because of the contribution of people living in cities. In these and other areas with high bike use, trip purpose was both related to commuting and to other activities (shopping, leisure, etc.). Conversely, commuting was the main goal of bike use in other areas with lower cycling levels. It was found that women’s cycling was determinant for these differences, that is, women made as many or more trips by bike than men in high cycling areas (with a modal split of 7% or higher) and much less in those areas with low cycling rates. Average distances were similar all along the surveyed areas, being of 2–3 km. Regarding age, people older than 60 years were in both cases underrepresented, while children younger than 16 years had a significant representation among cyclists in high cycling areas. The authors concluded that these high cycling areas had managed to make cycling inclusive, that is, attractive and feasible for users of all genders and ages. In this sense, they claimed the need for not only providing commuters with safe corridors, but also children in their routes to school. Finally, they reasoned that not only city centers, but also neighborhoods, should be adapted to be cycling-friendly.
Although certain boundary conditions certainly help, there is no magic recipe for rapidly increasing the rate of cycling. In fact, several and varied factors are behind people’s higher or lower adoption of bikes. For example, many studies have found a relationship between people’s perception of safety, which is at the same time linked to their behavior while cycling, and their bike intensity of use. Ref. [11] assessed cyclists’ risk perception and its potential change along the different seasons, which could influence the modal choice. They launched a survey in Trondheim (Norway) and used structural equation modeling to analyze the data. Results indicated that risk perception was very linked to the decision whether to use the bike and with which frequency during the winter, but not in other seasons. Respondents perceived the same probability of an accident during the whole year and also considered its possible severity invariant. However, their feeling of worry, which is the result of an individual’s cognitive assessment of risk, attitudes toward traffic rules, risk tolerance, and safety priority, was higher during the winter months. Using the answers to the same survey, ref. [12] investigated the effect of factors such as general attitudes toward traffic safety, risk perception, worry, risk tolerance, safety priority, and accident involvement on cyclists’ risk-taking behavior. The latter was divided into two main categories, namely the violation of traffic rules, and causing conflicts with other road users when cycling. Results showed that the most influent factors were attitudes, risk perception, and accident involvement. Particularly, the frequency of traffic rule violations was associated with pragmatic attitudes toward them, as well as to safety priority. For their part, disagreement with cycling traffic rules or with their enforceability turned out to be linked to the frequency of cyclists’ conflicts with other road users. This was also the case for risk perception and accident involvement. The latter, however, did not affect the frequency of rule violations when cycling. The authors warned of the need for awareness campaigns targeting cyclists as the main agents to protect themselves and the others. They further pointed out that such campaigns should treat cyclists as any other mobility agents and not as vulnerable users. For the particular case of two-lane rural roads, ref. [13] found that younger cyclists had the riskier behavior and the lowest risk perception. It was also confirmed that users aware of traffic rules behave safer.
For their part, ref. [14] asked 1064 cyclists and 1070 non-cyclists to answer their Cycling Behavior Questionnaire (CBQ, [15]), finding that their self-reported and proxy-reported behaviors regarding riding errors, traffic violations, etc. were very different. Non-cyclists took cyclist behaviors as much riskier than cyclists themselves, which was seen as a possible cause of conflictive interactions between users of different mobility modes. Like ref. [12], these authors claimed the need for rising behavioral awareness among bike users and not only putting the spotlight on other mobility agents, usually car drivers, when trying to avoid accidents. Using the same survey, ref. [7] performed Chi-square independence tests trying to find those reasons that encourage and discourage people from cycling, both in general and depending on their trips, and including those factors linked to previous experiences. The most decisive encouraging factors were physical health and fitness (38%), environmental awareness (14%), economy (13%), and time savings (10%). Conversely, risk perception (17%), unfavorable weather conditions (17%), and lack of security related to thefts (16%) were the most relevant discouraging factors. The authors concluded that the decision whether or not to travel by bike is the result of an analysis of pros and cons. In any case, cycling is identified as having health benefits. Additionally, focusing on the 1064 cyclists, who had a mean age of 32.83 years, ref. [16] tried to infer which factors were the main cause of accident among them. They developed structural equation models showing that these factors were their perception of risk and their individual tendency to risky behaviors, their level of knowledge of traffic norms and their cycling intensity, i.e., the number of hours per unit time they cycled, which leads to objective more exposure. It was also demonstrated that age played an important role. For example, younger cyclists with high cycling intensity were more prone to risky behaviors. This could explain their more frequent involvement in accidents. Ref. [17] also assessed with these data (61.2% of the 1064 cyclists were males and 38.8% females) potential differences in risky and positive riding behaviors linked to gender. The authors chose a set of demographics, psychosocial, and bike use-related variables as potential predictors and used a multigroup structural equation modeling approach for the analysis. Results showed that some variables, namely hourly intensity, psychological distress, and level of knowledge of traffic rules were good predictors of risky behaviors for both genders. However, age and risk perception were no significant behavioral predictors for women. Regarding the predictors of positive behaviors, age was useless for all cyclists. Psychological distress played a fundamental role for females, while cycling intensity, knowledge of traffic rules, and risk perception were more important for male cyclists. Overall, it was demonstrated that different variables should be used to predict cyclists’ behavior depending on their gender. The usefulness of the CBQ to assess both risky and positive riding behaviors of cyclists in different countries, contributing to assess and improve cycling safety from the human factors approach, has been well proven [18]. For example, the CBQ was also used by ref. [19] to assess the differences of cycling behavior among three emerging cycling countries with different levels of development. A total of 1094 inhabitants from Australia, China, and Colombia participated in the study. For all countries, cyclists reported more frequent positive behaviors (i.e., maneuvers or initiatives aimed at cycling safe) than risky behaviors. Particularly, Australian cyclists reported more positive behaviors and fewer violations than cyclists from the other countries, which could be a consequence of the cycling’s boundary conditions, namely the quality of the infrastructure and the implemented policies. Regarding gender, males confessed to engaging in risky behavior and to being involved in accidents more often than females. Similar relations were detected when comparing the behaviors of younger and older cyclists. Moreover, very interestingly, trust was shown to play a role, as frequent cyclists reported more frequent risky riding.
In the next studies, the influence of the available infrastructure and the subsequent interactions of cyclists with other mobility agents on cyclists’ safety perception and/or behavior were analyzed in detail. Ref. [20] launched two related surveys in France, respectively addressed to cyclists and car drivers, in order to analyze their particular perception of crash risk in bike–car interactions. As expected, cyclists showed a higher risk perception when interacting with cars than with other cyclists, but this risk perception was even higher for car drivers. Cycling or driving experience in terms of km travelled as well as the perceived control of the interaction diminished the perceived risk. Regarding peer-to-peer interactions, perceived risk was again higher for car drivers than for cyclists. For their part, ref. [21] conducted a survey in Berlin with questions referring to factors such as the street type and the speed limit, the type of bike facility (lane or track, location and segregation, if any, width, pavement surface, and lateral buffers) and collected data from almost 14,000 respondents. After analyzing them statistically, results indicated that cycling tracks (i.e., bike lanes between a car parking area and the walkway) were perceived as safer than cycling lanes, which in any case were seen as better than not having dedicated facilities. It was also demonstrated that, as expected, physical separations from cars, great width and colored, eye-catching surfaces contributed to a higher safety perception. Overall, those factors linked to actual safety were shown to also affect the subjective safety perception. Ref. [22] also aimed to analyze cyclists’ risk perception regarding two particular types of potential accidents: those involving a motor vehicle and those involving only individual riders. They recruited nearly 2000 cyclists over 55 years from the Netherlands, and over 40 years from Flanders, Brussels, and Wallonia. Results showed that 60% of the respondents perceived bicycle–motor vehicle crashes as the main cause of cyclists’ hospitalization, especially in the Belgian areas and if they had had such a previous experience. However, experience with bike-only accidents in cyclists over 60 years caused the opposite feeling. Despite these general trends, slight differences were found across the different regions, which were associated to the type of bike facility: the more the exposure to/interaction with car traffic, the higher the risk perception. Considering that practice has demonstrated that, no matter the modal split, i.e., if the number of frequent bike users, single-bicycle crashes are related to more frequent and more severe injuries of cyclists than bicycle–motor vehicle crashes, measures aimed at raising the awareness of the risk of single-bicycle crashes and at avoiding such crashes should be implemented.
Real safety is different from safety perception. However, some authors have tried to find a relationship between both and, additionally, to detect those factors that make cyclists prone to damage or crashes among them and with other mobility users. Ref. [23] aimed at looking for the factors behind the accident rate of cyclists related with aberrant behaviors. To this end, they developed the Chinese Cycling Behavior Questionnaire. They gathered responses of 547 participants and used exploratory and confirmatory factor analyses as key methodologies. These authors found that four particular factors, namely rule and aggressive violations, ordinary violations, personal control errors, and distractions explained almost 50% of the total variance. Except for control errors, the rest were more common among males. Age was a differential factor, younger cyclists being more prone to irresponsible behaviors. Additionally, multiple regression analyses showed a relationship between both violations and distractions and the number of self-reported crashes. For their part, ref. [24] studied the role of safety concerns, both perceived and real, in the adoption of cycling as a transportation mode. They chose a population with a high level of cyclists, Finland, and launched among them four questionnaires, the Cycling Behavior Questionnaire (CBQ), Cyclist Risk Perception and Regulation Scale (RPRS), Cyclist Anger Scale (CAS), and Cyclist Aggression Expression Inventory (CAX). Finnish cyclists reported very few errors and violations, and high levels of knowledge of traffic rules. Aggressions were uncommon, and anger mostly resulted from interactions with motor vehicles. In fact, allocating enough separation between cyclists’ tracks and regular traffic lanes was pointed out as key to reduce the crash risk while cycling. Promoting risk awareness among those riders with riskier behaviors could also contribute to this goal.
Other authors mainly addressed actual safety of cyclists. For example, ref. [25] tried to overcome the lack of reliable cycling exposure data when analyzing safety and risks among cyclists. They performed a literature review including 20 papers that proposed different methods and parameters to measure cycling exposure and analyzed their findings. Retrospective studies were focused on major bicycle accidents, whereas prospective studies included all types of accidents. The former highlighted differences regarding gender and age, men suffering more accidents than women and older people more injuries than middle-aged cyclists. Not enough data of cyclists under 18 years old were available. As expected, darkness led to more accidents. Additionally, neither helmets nor flashy clothing reduced the risk of being involved in an accident; nor did experience. Conversely, higher drivers–cyclists awareness as well as an appropriate and well-maintained, if possible dedicated, infrastructure would improve bicycle safety. For their part, ref. [26] investigated the impact of cyclists’ age and gender on the risk of crash, statistically analyzing the data collected by the Spanish Traffic Administration between 1999 and 2009. Results showed that, in spite of their gender, cyclists younger than 30 years old and older than 65 years old had the highest accident risk. In between, the exposure rate ratio decreased with the age. Adding data from two more years (2010 and 2011), ref. [27] refined the previous study. They used decomposition and quasi-induced exposure methods to obtain the contributions of exposure, risk of collision, and fatality rate to the mortality ratios, considering gender and age. It was found that death rates increased with age, and that this fact had a clear relationship with the fatality rate. However, it was the risk of a collision that acted as main component of increased death rates among younger cyclists. Death rates were higher for men for all ages. These rates increased with the age, exposure being the main component of this increase, followed by fatality. Overall, young male cyclists were found to be the group with higher risk of dying in a crash.
As for safety perception, the available infrastructure also influences actual safety. Ref. [28] assessed the relationship between key infrastructural and human factors present in cycling, including self-reported experience, with crashes. Descriptive statistics (means, standard deviations) and Pearson’s (bivariate) correlational analyses determined that associations were significant. Additionally, age, riding intensity, risky behaviors, and problematic user/infrastructure interactions arose as good predictors of road crashes among cyclists. Ref. [29] wanted to find out why some American cities were found safer for cyclists than others. They used multilevel, longitudinal, negative binomial regression models to analyze accident data over 13 years from 12 large American cities, which compressed more than 17,000 fatalities and 77,000 severe injuries. They concluded that the availability of bike facilities, especially protected separated lanes, was the main factor leading to safety among cyclists. Additionally, a high-density network of these facilities also improved safety for other mobility agents, as it involves a traffic calming effect. However, these authors did not find the link between higher numbers of cyclists and greater safety that can be found in other works in the literature. For their part, ref. [30] analyzed the influence on the built environment on cyclist injury severity in car–bike crashes. Their study was performed gathering built environment features of Seattle and using bike crash data from 2004 to the beginning of 2013, which was provided by the Seattle Department of Transportation (SDOT). After generating a generalized ordered logit model and a generalized additive model, the authors concluded that injury severity was negatively associated with employment density and, conversely, this association was positive for the case of the poster speed limit or the involved vehicle’s size. Cyclists wearing reflective clothing were less likely to be injured, as well as cyclists driving in streets with good lightning. Age was found to play a role, older cyclists suffering more severe injury. Ref. [31] used the Great London bike sharing data from 2012 to 2013 to analyze the role of the infrastructure and land use in bicycle crash exposure and frequency. They developed random parameter negative binomial models that indicated that bike crash frequency was positively correlated to road density, commercial area, proportion of elderly, male and white race, and median household income. For their part, ref. [32] retrospectively analyzed the forensic autopsies of 25 bicyclists (23 men and 2 women), which were performed from 1999 to 2018 by the Department of Legal Medicine at Dokkyo Medical University School of Medicine and the Department of Legal Medicine at Shiga University of Medical Science, in Japan. In all cases, cyclists died because of self-inflicted accidents as falls and obstacle collisions, i.e., no other actors were present. The most significant finding was that alcohol was present in 52% of the cyclists, the mean blood concentration being 1.59 mg/mL, and that no one wore helmet. Their mean age was 63.7 years, which could have influenced their lack of reflexes and also their chances of survival after suffering a serious injury. These factors could also be behind accidents with interactions (i.e., collisions with other mobility users), which are sometimes associated to the lack of a good infrastructure without further analyses.
The above studies shed light on a number of factors that may positively influence the perceived safety of cyclists, as well as the actual safety, and thus lead to a higher rate of adoption and use of cycling as a usual mode of transport. In this context, interactions with other mobility agents, be they other cyclists, motor vehicles, pedestrians, scooters, etc., play an important role. And these interactions depend to a large extent on the existing cycling infrastructure. That said, other factors extrinsic and intrinsic to users, may also have a significant effect. The weight of these factors is different across the existing studies, which makes it necessary to further investigate these relationships. That said, this article allows comparing the extent to which these variables influence the perception of safety and the frequency of cycling in two cities with very different characteristics and among whose inhabitants there are also clear socio-cultural differences. This is done applying two very different methodologies. It also assesses if the importance of the existence of infrastructure is influenced by other variables.

3. Methodology

This research includes the use of two very different methodologies, which have been applied to two different case uses: expert interviews and exploratory and path analysis of survey data. Thus, quantitative and qualitative methods are implemented in this research.

3.1. Method 1: Expert Interview

The first applied methodology was expert interview. This is a method of qualitative empirical research widely used in social analyses [33]. It aims at exploring or collecting data about a specific field of interest and can provide important insights as long as it is well implemented in its three main stages: (i) the expert selection, (ii) the design of the interview, and (iii) the interpretation and summary of the responses. In the first stage, some criteria must be imposed so that someone can be accepted as expert. Additionally, even when related to the same topic, interviews to experts of different backgrounds, i.e., with different approximations to the target topic, are desirable [34]. The design of the interview must be carefully addressed, as it must combine a reasonable duration with the obtaining of enough information. The existence of some common questions addressed to all experts is positive, as it allows for comparisons and debate. However, ad hoc questions addressed to particular experts can provide valuable additional information. Supplementary questions often arise spontaneously during the interview. Therefore, a certain amount of extra time should be included in the calculation of the total interview time. In addition, the interviewer should be trained to use this methodology and, preferably, be quite knowledgeable about the central topic under investigation. As with surveys, questions must be made without introducing any type of bias. Finally, the interpretation and/or summary of the information should be made by an expert in the topic, here, the researchers. This process is usually long and time-consuming, but delegating this task to non-experts could undo the efforts made in the previous phases, e.g., if subjective opinions are unintentionally introduced or important information is lost.
All these good practices have been followed in this research, in which 9 experts were interviewed for approximately 1 h.

3.2. Method 2: Exploratory and Path Analysis of Survey Data

The second applied methodology combined quantitative with qualitative analyses. First, a survey was designed in Google Forms and launched online. This step followed similar rules to the design of the interviews. The most relevant questions of a bigger set were chosen in order to obtain the necessary information but trying not to make a very long survey that might discourage people from responding. An attempt was made to include at least one question for each of the variables highlighted in the literature review as important for cycling adoption and safety. Each of the questions was carefully analyzed in order to remove any kind of bias. Once checked and tested, the survey was launched online through personal and institutional social media. Additionally, the link to the survey was sent to particular people or collectives that could help to promote it, e.g., cyclist associations.
Once the survey was closed and the data were gathered, a basic exploratory analysis was done in order to obtain a first overview of the results. Afterwards, Mplus software, developed by the company Muthén and Muthén (Los Angeles, CA, USA), was used to implement the technique of path analysis (PA). This method, boosted in the second half of the past century, is a forerunner and subset of structural equation modeling. It allows the effects of a set of variables acting on a specific issue to be discerned and evaluated through multiple causal pathways. Basically, PA is founded on a closed system of nested relationships among variables that are represented statistically by a series of structured linear regression equations [35]. It is therefore based on similar hypotheses to linear regression, but some additional restrictions are included to describe the allowable pattern of relations among variables. These are embodied in a path diagram, a type of directed graph, indicating arrows the directions of these relationships.

4. Case Studies and Available Data

The aforementioned methodologies have been applied to two different European big cities, Helsinki and Barcelona, respectively in the north and south of the continent. The objective behind this decision was to enable a comparison of results between cities with different boundary conditions (e.g., culture and social uses, climate, etc.) and to extract generalizable conclusions.

4.1. Case Study 1: Helsinki

The first methodology was applied to Helsinki. After several iterations, nine experts on cycling were chosen to be interviewed. Table 1 contains the basic data of all interviewees. Their expertise on cycling was different, i.e., not only did they use the bike in their personal lives, but they were engaged with this means of transport from different points of view. These personal approaches matched in all cases with one or several of the dimensions of the integrated cycling policy model proposed by [36], which is represented in Figure 1. This model contains the main variables that influence the boundary conditions of cycling in a city, leaving aside aspects intrinsic to the users, which were in any case addressed during the interviews. These took place online and were recorded, which allowed for a better post-processing of the information.

4.2. Case Study 2: Barcelona

The second methodology was applied to the city of Barcelona. First, the questionnaire consisted of 37 questions: 1 was to control that only people cycling in Barcelona answered the survey, 5 asked about sociodemographic data, 1 about respondents’ knowledge of cycling rules, 8 about previous experiences related to cycling, 3 about the available infrastructure, 1 about preferences for cycling, 7 about perceptions while/related to cycling, 4 about use patterns, and 5 about respondents’ behavior as cyclists. Finally, 2 more questions with open answer were included so that respondents could include suggestions/claims aimed at improving the boundary conditions for cycling in Barcelona. In order to reach as many responses as possible, the questionnaire was launched in the late summer of 2022 in two languages, Spanish and Catalan. The translated version can be found in Appendix A. After applying a cleaning process, 205 valid responses, 139 in Spanish and 66 in Catalan, were ready to be analyzed at the beginning of October of 2022. Table 2 contains the basic sociodemographic data of all respondents. More men than women answered the survey, but both genders have an acceptable representation. The share of ages, education level, average income, and physical condition among the respondents is also adequate. The groups with less responses in each category were those of very young cyclists, cyclists with only basic education, and cyclists with a high average income. Most of the respondents stated that they were in good or normal physical condition.
The next step consisted in performing an exploratory analysis of the data. Table 3 contains an overview of the responses to the questions related to use patterns, Table 4 shows responses to the questions about knowledge of cycling rules and behavior as cyclists and Table 5 includes the information about the available infrastructure in the respondents’ usual itineraries. Finally, Table 6 shows the share of some answers related to users’ preferences and perceptions, which are assessed in more detail during the path analysis.
As it can be seen in Table 3, the sample includes an adequate representation for different users in terms of frequency of cycling. The percentage of sporadic users reached 27%, while the rest of the sample reported cycling at least 1–2 days per week. Next, the average distance travel ranged from less than 1 km to more than 10 km. As it was expected in habitual cyclists, almost 50% of the sample reported an average travelled distance higher than 10 km. Considering the purpose of the trip, 66.7% of the trips corresponded to sport activities while 17.9% were related to commuting to work or to study.
Table 4 shows revealed user behaviors: 28.9% of respondents admitted that they only knew fundamental cycling rules, while 26.9% declared to have learnt these rules in the past, although they ignored if these regulations are currently obsolete. Thus, only 40.2% of the participants declared that their knowledge of cycling rules was updated. On the other hand, 59.5% of the sample reported a usual compliance with traffic regulations for bicycles and 26.5% declared permanently complying with the rules. Similar behaviors can be found for signaling maneuvers while cycling and respect for road signs, as it can be seen in Table 4. Lastly, regarding cycling behavior in absence of bike lanes, 74% of participants cycled mostly on the road, whereas 14.7% preferred to use sidewalks.
Considering the availability of cyclist infrastructure, 12.3% of respondents stated the coverage of bike lanes in their usual itinerary was complete or almost complete, 39.2% found it in a great extent, and 27.4% perceived the coverage as medium. These figures show, overall, a high amount of bike lane infrastructure for the sample of the survey. The location of bike lanes in their itinerary was mostly on the road (46.8%) or both on the road and on the sidewalk (35%).
Answers about preferences, perceptions, and influence of scenarios while cycling are included in Table 6. The preferred bike infrastructure was segregated on the roadway (46.5%), followed by no need for dedicated infrastructure (19.2%) and segregated lanes no matter the type (11.7%). Next, while cycling on the roadway, 36% of the sample declared that they felt safe, while for 22.4% of participants, safety perceptions in this case depended on the speed of vehicles close to them or on the lane width (19.7%). Last, 52.2% of respondents reported no effect of dedicated infrastructure on their safety perception, whereas 39.9% declared a limited effect with only small modifications on the route in order to find it.
After performing the former exploratory analysis, a hypothesis was made about the model that could govern the relationships between the different variables considered in the survey. This model was elaborated by the authors after several iterations, based on the state of the art and their own engineering criteria on the subject. Figure 2 shows the initial model used, which was introduced in the Mplus software to test its goodness, applying the PA method. The significance level accepted was 10%.
As can be deduced from Figure 2, the hypothesis put forward in this research was the following: we believe that socio-demographic factors, as well as the available infrastructure, together with cyclists’ knowledge of the rules and previous experiences by themselves or acquaintances (e.g., cycling accidents suffered or observed) influence cyclists’ preferences about the infrastructure and, also, their perceptions. The latter refer to their feeling of safety when cycling, but also to their feeling of being respected by other mobility agents, by administrations and by laws. In turn, these perceptions may influence users’ greater or lesser degree of adoption of cycling as a mode of transport, and their cycling behavior. As seen in the literature review, the state of the art would also support the acceptance of variants of this initial model. For example, some research claims that cycling patterns influence the perceptions and preferences of cyclists. Without denying the possibility of such a relationship, the authors of this article postulated that the model in Figure 2 was more feasible.

5. Data Analyses

5.1. Helsinki Highlights

As explained above, a base interview was prepared containing several common questions that were asked to all the participants. Some of these questions were the following:
  • What is cycling for you?
  • In which areas can changes be made to encourage more cycling?
  • In which areas do you see special needs or differences in requirements?
  • Do you think cycling in Helsinki/Finland is inclusive?
  • To what extent do you think the infrastructure devoted to cycling influences traffic safety? And safety perception and, therefore, cycling adoption?
  • Critical situations can occur between cyclists and vehicles, between cyclists and users of other micromobility systems that share the same infrastructure, as well between cyclist and pedestrians. Which actions are being taken to reduce these conflict interactions? All cities have tried to regulate them, what were the premises in Helsinki and is there still room for improvement in this respect?
  • How do you think do regulations frame the (safety) perception of cycling?
  • Is any regulation particularly problematic? Would you change any existing regulation or add any missing one?
Additionally, other particular questions were prepared for each interviewee, depending on his/her expertise or position. In any case, each interview was unique and often had to be redirected. If an interviewee was particularly interested in talking about one specific topic, no objection was made, since it was probably on that topic that he/she could contribute the most. Table 7 includes the topics related to cycling about which each interviewee spoke in more depth.
As it can be observed, the topics of greater interest were infrastructure planning, the need to re-design cities, and how to ensure the coexistence of micromobility with soft modes of transportation. Interviewees agreed that Helsinki, like many other cities, had been designed with the private car in mind. The cycling infrastructure in the city has a wide coverage but lacks continuity in some areas. Hence, experts agreed on the need for planning to promote modal shift. In other words, planning that ensures that there is an adequate cycling infrastructure covering the most demanded origin-destination routes. The improvement of the current infrastructure could, in the opinion of the experts, penalize private vehicle users. They all saw this fact as a way to force a necessary modal shift. In any case, the experts also agreed on the need to optimize the coexistence of cycling, especially with walking, but also with other modes of micromobility such as scooters. With regard to infrastructure, it was not so much the location of the bicycle lane that was important to them, but the fact that it is of the right size (width) and dedicated. Because of the particular climatic casuistry, they all also agreed on the need to improve the maintenance of bike lanes in winter.
In addition, some experts called for the need to include social perspectives (e.g., income level, education level, age, physical condition) in the planning of bicycle infrastructure and, generally, in its promotion, so that it can become the usual mode of transport for the widest possible spectrum of the population. However, it must be highlighted that gender issues were not considered key by any of the experts. Even those who did address this issue did so from a social rather than an engineering point of view: they did not believe that there was a need to include a gender perspective in mobility planning, and more specifically in bicycle mobility, but rather they thought that it was necessary to focus on social policies to ensure an equal distribution of roles. One expert commented, for example, that rather than redefining mobility so that women’s mobility patterns (more frequent, shorter, and off-peak trips), associated with family or home care, were well served, it was necessary to seek to change or distribute these mobility patterns. In other words, what they found necessary was the share of such mobility patterns (and, therefore, or the related tasks) between genders, alternately. The only specific need for women that was mentioned was to improve the comfort of the saddles, especially in the bike-sharing systems run by the administrations, a need linked solely to a physiological feature.
Regarding the current legislation, all experts believed it was sufficient. Moreover, several stressed their view that cyclists are mobility agents like any others, should therefore be protected at the same level as others, and should also be required to contribute to road safety. A point of general agreement was to rule out measures such as making it compulsory to wear a helmet when riding a bicycle. They believed that this type of regulation contributes to the perception of cycling as a risky mode of transport and, thus, undermines its adoption.

5.2. Barcelona Results

The following tables show the final results of the path analysis. Table 8 shows the causal relationships between variables included in the model that resulted to be significant. For its part, Table 9 shows the existing correlations among variables. The rest of the variables and relationships hypothesized in the initial model (Figure 2) resulted to be non-significative. According to the PA methodology, it cannot be stated that these relationships definitely do not exist. It can only be said that they were not found in the analyzed sample.
According to the results, and not considering correlations, the final model resulting from the PA is represented in Figure 3. The solid arrows represent positive relationships, i.e., the value of the dependent variable increases when the value of the primary variable increases. The dashed arrows represent negative relationships, i.e., the dependent variable decreases when the primary variable increases.

6. Discussion

The above provided results demonstrate the complexity of determining which factors can actually contribute to modal shift towards sustainable mobility, particularly, towards cycling. Basically, they demonstrate the need to focus on the human factor, which involves many more challenges than, for example, technological or economic issues.
One of the main insights that can be drawn from the interviews with the Finnish experts is that, in Helsinki, cyclists are perceived as any other mobility agent, with rights and obligations. Moreover, in general, no distinction is made between different profiles of cyclists, e.g., on the basis of gender or age. As for any other mobility agent, it is demanded that they have adequate infrastructure, but it is accepted that they need to coexist with other users, e.g., motor vehicles, scooters, pedestrians, etc. In this sense, what is most demanded with regard to infrastructure is its continuity and quality, but more in terms of dimensions and cleanliness (as mentioned, the need for better maintenance during the winter months was a unanimous request by all the experts interviewed) than for it to be segregated and isolated from traffic. They also appealed to the individual responsibility of the cyclist (like that of any other road user) and did not see the need to implement laws to particularly protect cyclists. This idea had been already found in the literature [12,14]. One idea shared by all the experts was that the simple fact that the rate of bicycle use increases, that is, that there are more cyclists, is the best protective measure that can be put into practice.
Regarding the case study of Barcelona, more particular (and different) results were found. As it can be observed in Figure 3 and Table 8, many relationships ventured in the hypothesized model have been confirmed by the analysis. Regarding non-significant relations, the model was not able to demonstrate that they exist in reality with the sample and data available.
Let us focus on perceptions first. For example, those people that confess that the existence of adequate infrastructure does influence their use of bicycles are positively associated with the coverage of this infrastructure in their routes, with their highest education level and with the level of severity of any accident suffered by an acquaintance. This perception is, conversely, negatively associated with the level of knowledge of cycling rules. All these relationships can be seen as coherent. People with high education levels or those who have indirectly suffered (or observed) accidents involving cyclists may be more aware of the dangers of cycling without the adequate infrastructure. Therefore, its existence could condition their travel patterns, as already shown in [21]. In addition, if there is ample coverage of bike lanes on their route, they can experiment for themselves the advantages these involve. As for this perception being associated with a lower awareness of the rules, it may be due to a belief that the motor vehicle still has absolute priority in cities and even a consequent feeling of lack of protection. That is, the more people rely on the infrastructure, the less they think specific rules to protect cyclists are necessary and, therefore, the less they are updated on them.
With regard to the perception of being cyclists supported by administrations, it is positively associated with the infrastructure coverage and negatively with the use of bikes to do sport. Something similar happens with the perception of cyclists’ rights being respected. However, this perception has another negative association, particularly with an acquaintance’s accident severity. Both positive associations with the infrastructure coverage are also coherent, as providing with the adequate infrastructure is one of the supportive measures of administrations that empower cyclists, namely, a kind of right that it fulfilled. The negative associations of these perceptions with the sportive use of bikes could be due to the fact that this use implies special requirements/preferences when compared to the use of the bicycle as a regular mode of transport. Normally, people who use bicycles for sport do so outside city centers and they tend to make long journeys at high average speeds. As the infrastructure coverage is usually lower in these areas and speeds are mostly regulated (restricted), these people could have a feeling of not being supported. Their specific needs should be taken into account. For possibly the same reasons ventured, the former associations with the infrastructure coverage (positive) and with the use of bikes to do sport (negative) are also associated with the perception of being the legislation appropriate and enough to promote cycling and ensure safety. Additionally, this perception is positively related to the existence of bike lanes on the roadway. Probably, people who ride bicycles on the road are the most confident that current legislation protects them.
Regarding use patterns, both the frequency of cycling and the average distance covered are negatively associated with the perception of having the available infrastructure an influence on the use of the bike. This is probably due to the fact that cycling experience makes riders feel safer, despite the boundary conditions and objective facts, as it has been already found in the literature [2,7,20]. Thus, perceived safety could be influenced by the use of the infrastructure and the development of cycling capabilities and personal confidence. Additionally, the distance is negatively associated with the perception of being supported by the administrations. People that have long routes are more prone to cycle in areas that have no or unappropriated infrastructure or in which the boundary conditions (e.g., traffic) are not ideal. These bad experiences could explain their feeling that the authorities do not support cyclists enough.
For its part, the compliance with the signaling while cycling is positively associated with the perception of being the cycling patterns affected by the available infrastructure. This relationship could imply that people who are aware of the risks involved in cycling (as in other modes of transportation) and try, thus, to cycle using an ad hoc infrastructure, give more importance to regulatory compliance. Similar relationships were found in [17].
Focusing on the bike lane location, the preference for those located on the sidewalk is positively associated with the female gender and negatively associated with the income. The opposite associations are found for the preference for bike lanes located on the roadway. The preference for a bike lane between the sidewalk and a row of parked vehicles is positively associated with the female gender and the income, and negatively with the physical condition. Therefore, females and people with average to low physical condition seem to prefer segregated lanes separated from motorized traffic. The role of physical condition was already proven in [7]. It is more difficult to understand results regarding the income. It could be hypothesized that high income people have better bikes and, thus, they feel safer despite the location of bike lanes.
Finally, the average distance covered by bike has been found to be correlated with the frequency of cycling and with the perceptions of being cyclist’s rights respected and current legislation appropriate. These latter perceptions are at the same time correlated between them.

7. Conclusions

In this article, two parallel investigations were carried out in two cities, Helsinki and Barcelona, with a different cyclist tradition, respectively using a qualitative and a quantitative methodology. The combination of these two research approaches allows highlighting the key aspects that, everywhere, need to be considered first in order to promote cycling.
The first conclusion to highlight is that the provision of an adequate infrastructure is the most effective measure to promote the use of the bicycle. However, the forced and random layout of bike lanes in cities can even be counterproductive. Spatial and temporal planning is necessary to make it possible to have a cycling infrastructure with continuity between the main origin–destination routes, with adequate dimensions and layout and duly maintained. The implementation of additional measures such as calming traffic or separating it from said infrastructure is positive, but not decisive. In fact, cyclists trust more in the objective security that can be derived from such quality infrastructure than in the benefits that could be derived from the implementation of laws specifically designed to protect them.
Second, although certainly the perception of safety when traveling by bicycle is different according to gender, age, or experience, the greatest differentiation is given depending on the purpose of bicycle use. The perceptions and preferences of people who cycle for sport differ from those who use the bike on a daily basis as a usual means of transport, either for any purpose or to access only part of their activities. This second group is the one that should be at the center of urban planning, in accordance with the objective of promoting a modal shift.
Finally, perceived safety should be also considered in the promotion of cycling. For example, taking into account that those people with higher cycling experience feel safer during their trips, training on cycling capabilities in order to improve personal confidence is recommended.
This study has limitations, mainly related to the sample sizes used in both methodologies. Results should be only considered qualitatively. In addition, other variables that, according to the literature, may influence the greater or lesser adoption of bicycles should be included in further analyses and different cultural environments might be addressed. Finally, in the specific case of the initial PA model defined, it would be interesting to see how the results would vary based on other hypotheses of the relationship between variables that can also be found in the literature.

Author Contributions

Conceptualization, methodology, and formal analysis, M.M.-D. and R.A.; writing—original draft preparation, M.M.-D.; writing—review and editing, M.M.-D. and R.A. All authors have read and agreed to the published version of the manuscript.

Funding

This research received no external funding.

Institutional Review Board Statement

Not applicable.

Informed Consent Statement

Informed consent was obtained from all subjects involved in the study.

Data Availability Statement

The data used to perform this research are kept by the authors, who may transfer them for academic use in particular cases and with the permission of the participants.

Acknowledgments

We would like to thank Lisa Nienaber for her help with the expert interviews in Helsinki and Oscar Moreno for his collaboration with the development and launch of the survey in Barcelona.

Conflicts of Interest

The authors declare no conflict of interest.

Appendix A

Next, the translated version of the survey is provided:
SECTION 1: SOCIODEMOGRAPHICS
1.
Please choose your age:
a.
Under 18 years old
b.
Between 18 and 25 years old
c.
Between 26 and 50 years old
d.
More than 50 years old
2.
Please choose your gender:
a.
Male
b.
Female
c.
Non-binary
d.
Prefer not to answer
3.
Which is your average net income?
a.
Less than 1000€
b.
Between 1000 and 2000€.
c.
Between 2000 and 3000€
d.
More than 3000€
e.
I prefer not to answer
4.
Which is your highest education level?
a.
Basic Education
b.
Bachelor
c.
Professional education
d.
University degree
e.
Master’s/Doctorate
f.
I prefer not to answer
5.
How is your physical condition?
a.
Bad
b.
Fair
c.
Fair
d.
Good
e.
Very good
f.
I prefer not to answer
6.
Which is your postal code?
SECTION 2: TRAVEL PATTERNS
7.
In the last few months, have you cycled around the metropolitan area of Barcelona?
a.
Yes
b.
No
8.
How many days a week do you cycle?
a.
7
b.
Between 5 and 6
c.
Between 3 and 4
d.
Between 1 and 2
e.
Sporadic use (less than 1 day per week)
9.
When you travel by bicycle, how far do you usually ride?
  • More than 10 km
  • Between 8 and 10 km
  • Between 5 and 8 km
  • Between 3 and 5 km
  • Between 1 and 3 km
  • Less than 1 km
10.
For what purpose do you use your bicycle?
  • Commuting to work/study
  • Sport use
  • Running errands
  • As usual transportation (for everything)
  • Others
SECTION 3: TRAVEL BEHAVIOR
11.
To what degree do you know the rules of the road that affect bicycling?
  • I know them all and keep an eye out for updates
  • I learned them at the time but I am not sure if there have been any changes
  • I know the fundamentals
  • I don’t know them
12.
To what degree do you comply with traffic regulations affecting bicycle use?
  • Always
  • Almost always
  • Sometimes
  • Almost never
  • Never
13.
Do you indicate in any way the maneuvers you are going to make?
  • Always
  • Almost always
  • Sometimes
  • Almost never
  • Never
14.
Do you respect road signs, traffic lights, stop signs, and others?
  • Always
  • Almost always
  • Sometimes
  • Almost never
  • Never
15.
Where there are no bike lanes you usually circulate on:
  • Mainly on the sidewalk
  • Equally on the sidewalk and on the roadway
  • Mainly on the roadway
16.
Have you ever had an argument with someone because you are a cyclist?
  • Yes, with another cyclist, while riding, because we had a conflict
  • Yes, with a pedestrian, while riding, because we had a conflict
  • Yes, with a motor vehicle, while riding, because we had a conflict
  • Yes, with a scooter, while driving, because we had a conflict
  • Yes, talking about the rights of cyclists
  • No
  • Others
SECTION 4: AVAILABLE INFRASTRUCTURE
17
What is the bike lane coverage on your usual route?
  • On all or almost all of the route
  • On a considerable amount of the route
  • Low amount of bike lane on the route
  • Virtually none or none in its entirety
18.
In what position do you find the bike lane sections located?
  • Mainly on the sidewalk
  • Equally on the sidewalk and on the roadway
  • Mainly on the roadway
SECTION 5: PREFERENCES
19.
Which bike lane layout do you prefer?
  • Segregated on the sidewalk
  • Segregated on the roadway
  • Segregated between the sidewalk and the row of parked cars
  • No preference: any segregated lane gives me confidence
  • I have no preference: I drive with confidence even if there is no segregated lane.
SECTION 6: PERCEPTIONS
20.
Does the existence of segregated lanes have any influence on your cycling?
  • Yes, I modify my route slightly so that I can ride in segregated lanes for most of my trip
  • Yes. I only cycle if I will be able to cycle in segregated lanes for the whole of my journey
  • No. I use my bicycle for my desired route regardless of the available infrastructure
21.
When you ride in a segregated lane on the road, do you feel safe?
  • Yes
  • Depends on the speed of the vehicles in the adjacent lane
  • Depends on the number and size of vehicles traveling in the adjacent lane
  • Depends on the width of the bike lane
  • I am somewhat nervous
  • I feel quite or very unsafe
22.
Whether or not you feel safe riding a bicycle depends mainly on (multiple choice allowed)
  • The infrastructure (existence of bike lanes and their quality).
  • The number of cyclists sharing the infrastructure
  • My interaction with other mobility users (pedestrians, scooters, motor vehicles), i.e., their proximity, their speed, their number.
  • External conditions: weather, light level, etc.
  • Personal conditions: my physical and mental state
  • Others
23.
When you ride in the bike lane, are there often lane encroachments by other modes?
  • Yes, by pedestrians
  • Yes, by individual mobility vehicles (electric scooters, single-wheeled vehicles)
  • Yes, by traditional vehicles
  • Yes, by oncoming cyclists or cyclists trying to overtake abruptly
  • No
24.
Please look at the following images and answer the following question (images for each possible answer were provided): which situation do you consider to be the riskiest for cyclists?
  • Circulation in a traffic circle
  • Crossing at a pedestrian crossing
  • Car incorporations in the pedestrian crossing sequence, bicycle lane
  • Interaction zones with urban transport, bus, streetcar and others.
  • Others
25.
Do you believe that your rights as a cyclist are respected?
  • With some exceptions, yes
  • Sometimes
  • Almost never
26.
Do you think that local institutions, such as the city council or the metropolitan area, protect you adequately?
  • Yes
  • Quite a lot, but there is room for improvement
  • Not enough
  • Very little
27.
Do you think that the current legislation protects cyclists sufficiently?
  • Yes
  • Quite a lot, but there is room for improvement
  • Not enough
  • Very little
SECTION 7: EXPERIENCES
28.
Have you ever had an accident while cycling?
  • Yes
  • No
29.
If yes, to what extent?
  • Severe
  • Moderate
  • Mild
  • There were no injuries
30.
If yes, who else was involved?
  • A bicyclist
  • A motor vehicle
  • A scooter
  • A pedestrian
  • No one else
31.
If yes, where were you riding?
  • On the roadway
  • On the sidewalk
  • On a segregated lane on the roadway
  • On a segregated lane on the sidewalk
32.
Do you know anyone who has been involved in an accident?
  • Yes
  • No
33.
If yes, to what extent?
  • Severe
  • Moderate
  • Mild
  • There were no injuries
34.
If yes, who else was involved?
  • A bicyclist
  • A motor vehicle
  • A scooter
  • A pedestrian
  • No one else
35.
If yes, where was this person riding?
  • On the roadway
  • On the sidewalk
  • On a segregated lane on the roadway
  • On a segregated lane on the sidewalk
SECTION 8: OPEN ANSWER QUESTIONS
36.
If you had the power, what would you do to improve the safety of cyclists? Open answer question
37.
Other objections/comments (Open answer question).

References

  1. Borghetti, F.; Colombo, C.G.; Longo, M.; Mazzoncini, R.; Cesarini, L.; Contestabile, L.; Somaschini, C. 15-Min Station: A Case Study in North Italy City to Evaluate the Livability of an Area. Sustainability 2021, 13, 246. [Google Scholar] [CrossRef]
  2. Eren, E.; Uz, V.E. A review on bike-sharing: The factors affecting bike-sharing demand. Sustain. Cities Soc. 2020, 54, 101882. [Google Scholar] [CrossRef]
  3. Ignaccolo, M.; Inturri, G.; Cocuzza, E.; Giuffrida, N.; Le Pira, M.; Torrisi, V. Developing micromobility in urban areas: Network planning criteria for e-scooters and electric micromobility devices. Transp. Res. Procedia 2022, 60, 448–455. [Google Scholar] [CrossRef]
  4. Useche, S.; O’Hern, S.; Gonzalez-Marin, A.; Gene-Morales, J.; Alonso, F.; Stephens, A.N. Unsafety on two wheels, or social prejudice? Proxying behavioral reports on bicycle and e-scooter riding safety—A mixed-methods study. Transp. Res. Part F Traffic Psychol. Behav. 2022, 89, 168–182. [Google Scholar] [CrossRef]
  5. Büchel, B.; Marra, A.D.; Corman, F. COVID-19 as a window of opportunity for cycling: Evidence from the first wave. Transp. Policy 2022, 116, 144–156. [Google Scholar] [CrossRef]
  6. Global Bicycle Index. Luko. Available online: https://de.luko.eu/en/advice/guide/bike-index/ (accessed on 23 November 2022).
  7. Useche, S.A.; Montoro, L.; Sanmartin, J.; Alonso, F. Healthy but risky: A descriptive study on cyclists’ encouraging and discouraging factors for using bicycles, habits and safety outcomes. Transp. Res. Part F Traffic Psychol. Behav. 2019, 62, 587–598. [Google Scholar] [CrossRef]
  8. Akar, G.; Fischer, N.; Namgung, M. Bicycling Choice and Gender Case Study: The Ohio State University. Int. J. Sustain. Transp. 2013, 7, 347–365. [Google Scholar] [CrossRef]
  9. Arroyo, R.; Ruiz, T.; Mars, L.; Rasouli, S.; Timmermans, H. Influence of values, attitudes towards transport modes and companions on travel behavior. Transp. Res. Part F Traffic Psychol. Behav. 2020, 71, 8–22. [Google Scholar] [CrossRef]
  10. Goel, R.; Goodman, M.; Aldred, R.; Nakamura, R.; Tatah, L.; Garcia, L.M.T.; Zapata-Diomedi, B.; de Sa, T.H.; Tiwari, G.; de Nazelle, A.; et al. Cycling behaviour in 17 countries across 6 continents: Levels of cycling, who cycles, for what purpose, and how far? Transp. Rev. 2022, 42, 58–81. [Google Scholar] [CrossRef]
  11. Kummeneje, A.M.; Olaussen, E.; Rundmo, T. Seasonal variation in risk perception and travel behaviour among cyclists in a Norwegian urban area. Accid. Anal. Prev. 2019, 124, 40–49. [Google Scholar] [CrossRef]
  12. Kummeneje, A.M.; Rundmo, T. Attitudes, risk perception and risk-taking behaviour among regular cyclists in Norway. Transp. Res. Part F Traffic Psychol. Behav. 2020, 69, 135–150. [Google Scholar] [CrossRef]
  13. López, G.; Arroyo, R.; García, A. Structural Equation Approach to Analyze Cyclists Risk Perception and Their Behavior Riding on Two-Lane Rural Roads in Spain. Sustainability 2021, 13, 8424. [Google Scholar] [CrossRef]
  14. Useche, S.A.; Gene-Morales, J.; Siebert, F.W.; Alonso, F.; Montoro, L. “Not as Safe as I Believed”: Differences in Perceived and Self-Reported Cycling Behavior between Riders and Non-Riders. Sustainability 2021, 13, 1614. [Google Scholar] [CrossRef]
  15. Useche, S.A.; Montoro, L.; Tomás, J.M.; Cendales, B. Validation of the Cycling Behavior Questionnaire: A tool for measuring cyclists’ road behaviors. Transp. Res. Part F Traffic Psychol. Behav. 2018, 58, 1021–1030. [Google Scholar] [CrossRef]
  16. Useche, S.A.; Alonso, F.; Montoro, L.; Esteban, C. Explaining self-reported traffic crashes of cyclists: An empirical study based on age and road risky behaviors. Saf. Sci. 2019, 113, 105–114. [Google Scholar] [CrossRef]
  17. Useche, S.A.; Montoro, L.; Alonso, F.; Tortosa, F.M. Does gender really matter? A structural equation model to explain risky and positive cycling behaviors. Accid. Anal. Prev. 2018, 118, 86–95. [Google Scholar] [CrossRef]
  18. Useche, S.A.; Alonso, F.; Boyko, A.; Buyvol, P.; Castañeda, I.; Cendales, B.; Cervantes, A.; Echiburu, T.; Faus, M.; Feitosa, Z.; et al. Cross-culturally approaching the cycling behaviour questionnaire (CBQ): Evidence from 19 countries. Transp. Res. Part F Traffic Psychol. Behav. 2022, 91, 386–400. [Google Scholar] [CrossRef]
  19. Li, X.; Useche, S.; Zhang, Y.; Wang, Y.; Oviedo-Trespalacios, O.; Haworth, N. Comparing the cycling behaviours of Australian, Chinese and Colombian cyclists using a behavioural questionnaire paradigm. Accid. Anal. Prev. 2022, 164, 106471. [Google Scholar] [CrossRef]
  20. Chaurand, N.; Delhomme, P. Cyclists and drivers in road interactions: A comparison of perceived crash risk. Accid. Anal. Prev. 2013, 50, 1176–1184. [Google Scholar] [CrossRef]
  21. Stülpnagel, R.; Binnig, B. How safe do you feel?—A large-scale survey concerning the subjective safety associated with different kinds of cycling lanes. Accid. Anal. Prev. 2022, 167, 106577. [Google Scholar] [CrossRef]
  22. Schepers, P.; Geus, B.; van Cauwenberg, J.; Ampe, T.; Engbers, C. The perception of bicycle crashes with and without motor vehicles: Which crash types do older and middle-aged cyclists fear most? Transp. Res. Part F Traffic Psychol. Behav. 2020, 71, 157–167. [Google Scholar] [CrossRef]
  23. Wang, C.; Zhang, W.; Feng, Z.; Sze, N.; Xu, J.; Zhang, X.; Wang, K.; Huang, W.; Luo, Y. Aberrant behaviours in relation to the self-reported crashes of bicyclists in China: Development of the Chinese Cycling Behaviour Questionnaire. Transp. Res. Part F Traffic Psychol. Behav. 2019, 66, 63–75. [Google Scholar] [CrossRef]
  24. O’Hern, S.; Willberg, E.; Fink, C.; Useche, S. Relationships among Bicycle Rider Behaviours, Anger, Aggression, and Crashes in Finland. Safety 2022, 8, 18. [Google Scholar] [CrossRef]
  25. Vanparijs, J.; Int Panis, L.; Meeusen, R.; de Geus, B. Exposure measurement in bicycle safety analysis: A review of the literature. Accid. Anal. Prev. 2015, 84, 9–19. [Google Scholar] [CrossRef]
  26. Martínez-Ruiz, V.; Jiménez-Mejías, E.; Luna-del-Castillo, J.D.D.; García-Martín, M.; Jiménez-Moleón, J.J.; Lardelli-Claret, P. Association of cyclists’ age and sex with risk of involvement in a crash before and after adjustment for cycling exposure. Accid. Anal. Prev. 2014, 62, 259–267. [Google Scholar] [CrossRef]
  27. Martínez-Ruiz, V.; Jiménez-Mejías, E.; Amezcua-Prieto, C.; Olmedo-Requena, R.; Luna-Del-Castillo, J.D.D.; Lardelli-Claret, P. Contribution of exposure, risk of crash and fatality to explain age- and sex-related differences in traffic-related cyclist mortality rates. Accid. Anal. Prev. 2015, 76, 152–158. [Google Scholar] [CrossRef]
  28. Useche, S.; Montoro, L.; Alonso, F.; Oviedo-Trespalacios, O. Infrastructural and Human Factors Affecting Safety Outcomes of Cyclists. Sustainability 2018, 10, 299. [Google Scholar] [CrossRef] [Green Version]
  29. Marshall, W.E.; Ferenchak, N. Why cities with high bicycling rates are safer for all road users. J. Transp. Health 2019, 13, 100539. [Google Scholar] [CrossRef]
  30. Chen, P.; Shen, Q. Built environment effects on cyclist injury severity in automobile-involved bicycle crashes. Accid. Anal. Prev. 2016, 86, 239–246. [Google Scholar] [CrossRef]
  31. Ding, H.; Sze, N.N.; Li, H.; Guo, Y. Roles of infrastructure and land use in bicycle crash exposure and frequency: A case study using Greater London bike sharing data. Accid. Anal. Prev. 2020, 144, 105652. [Google Scholar] [CrossRef]
  32. Takeda, A.; Koh, M.; Nakanishi, T.; Hitosugi, M. Differences in severity of injuries between motorcyclist and bicyclist fatalities in single vehicle collisions. J. Forensic Leg. Med. 2020, 71, 101917. [Google Scholar] [CrossRef] [PubMed]
  33. Döringer, S. The problem-centred expert interview. Combining qualitative interviewing approaches for investigating implicit expert knowledge. Int. J. Soc. Res. Methodol. 2021, 24, 265–278. [Google Scholar] [CrossRef]
  34. Kaiser, R. Qualitative Experten Interviews: Konzeptionelle Grundlagen und Praktische Durchführung, 1st ed.; Springer: Wiesbaden, Germany, 2014. [Google Scholar]
  35. Lleras, C. Path Analysis. In Encyclopedia of Social Measurement, 1st ed.; Kempf-Leonard, K., Ed.; Elsevier: Amsterdam, The Netherlands, 2005. [Google Scholar]
  36. Anaya-Boig, E. A framework proposal for a research-connected cycling policy innovation. In Cycling Societies, 1st ed.; Routledge: London, UK, 2021; Chapter 2. [Google Scholar]
Figure 1. Dimensions of the integrated cycling policy model [36], categorized by the authors as an initial hypothesis for the interviews.
Sustainability 15 00905 g001
Figure 2. Initial proposal for the model.
Sustainability 15 00905 g002
Figure 3. Final model according to the path analysis (correlations not represented).
Sustainability 15 00905 g003
Table 1. Basic data of the interviewed experts.
ExpertOccupation 1Dimension of Expertise
1 (female)Urban Environment Department, City of HelsinkiGovernance, Regulations
2 (male)Finnish Cycling FederationGovernance, Cultural movements in favor of cycling
3 (female)Helsinki Region Cyclists’ assoc.Governance, Communication, Cultural movements in favor of cycling
4 (female)Non-profit cycling advocateRegulations, Governance, Cultural movements
5 (male)Cycling classes for immigrantsTraining, Communication
6 (female)Network of Cycling MunicipalitiesTraining, Governance, Cultural movements
7 (male)Traffic Engineer at Urban Environment Division City of HelsinkiInfrastructure, Planning instruments, Regulations
8 (male)Traffic planner at the Urban Environment Division, City of Helsinki. Member of the Bicycle planning teamInfrastructure, Planning instruments, Regulations
9 (female)Academy research fellowCultural movements, Communication
1 Position or institution related to cycling: it may not be the interviewee’s primary occupation.
Table 2. Sociodemographic data of the respondents.
SociodemographicCategoriesPercentages (%)
GenderFemale30.2
Male68.4
No binary0.0
Prefer not to answer1.4
AgeUnder 18 years old6.0
From 18 to 25 years old18.1
From 26 to 50 years old41.9
Over 50 years old34.0
Highest education levelBasic education7.0
High School13.4
Professional training16.3
Bachelor38.6
Master/PhD23.3
Average incomeBelow 1000 €20.0
Between 1000 and 2000 €31.6
Between 2001 and 3000 €24.2
More than 3000 €10.2
Prefer not to answer14.0
Physical conditionVery good17.2
Good39.7
Normal35.8
Under average5.9
Bad1.4
Table 3. Use patterns of the respondents.
Use PatternCategoriesPercentages (%)
Frequency of cycling (days a week)Sporadic27.0
1–221.4
3–427.7
5–616.7
77.2
Average distance travelled (km)<14.7
1–39.5
3–513.4
5–810.4
8–1011.9
>1050.1
Use purposeCommuting to work/studies17.9
Errands6.2
Usual transport6.2
Sport66.7
Other uses3.0
Table 4. Revealed user behavior of the respondents.
User BehaviorCategoriesPercentages (%)
Knowledge of the cycling rulesAll and updated40.2
I’ve learnt them but I don’t know if they are updated26.9
Only the fundamental ones28.9
No4.0
Compliance with traffic regulations for bicyclesAlways26.5
Usually59.5
Sometimes10.9
Hardly ever1.6
No1.5
Signaling maneuvers when cyclingAlways36.7
Usually40.9
Sometimes14.9
Hardly ever3.9
No3.6
Respect for road signs for cyclistsAlways40.7
Usually47.1
Sometimes9.9
Hardly ever1.6
No0.7
Cycling when there are no bike lanesMostly on the sidewalk14.7
Mostly on the road74
On the sidewalk and on the road11.3
Table 5. Available infrastructure in the respondents’ usual routes.
Available InfrastructureCategoriesPercentages (%)
Coverage of bike lanes in the usual itineraryComplete or almost12.3
In a great part39.2
Medium27.4
Almost inexistent or inexistent21.1
Type of bike lanes in the usual itineraryMostly on the sidewalk18.2
Mostly on the road46.8
On the sidewalk and on the road35.0
Table 6. Examples of respondents’ answers to questions about their preferences, perceptions, and influence of the boundary conditions while cycling.
Examples of Preferences, Perceptions and Influence of the Boundary ConditionsCategoriesPercentages (%)
Preferred bike infrastructureSegregated on the sidewalk14.2
Segregated on the roadway46.5
Segregated between the sidewalk and a row of parked vehicles8.4
Segregated, no matter the type11.7
No need of dedicated infrastructure19.2
Safety perception while cycling on the roadwaySafe36.0
Depending on the speed of the near vehicles22.2
Depending on the number and size of near vehicles8.8
Depending on the lane width19.7
Always a bit nervous7.3
Unsafe6.0
Effect of the existence of dedicated infrastructure on bike useGreat. Ad hoc modification of the route.7.9
To a certain extent. Only slight modification of the route39.9
No effect52.2
Table 7. Topics covered in more detail by each expert.
ExpertTopics
1Regulations, infrastructure planning
2Infrastructure planning, need to redesign cities, coexistence of micromobility with soft modes of transportation, gender gap (safety perception, travel patterns)
3Regulations (esp. helmets), infrastructure planning, gender perspective
4Regulations, infrastructure planning, need to redesign cities, coexistence of micromobility with soft modes of transportation, inclusive mobility, cyclists as victims or culprits
5Infrastructure planning, need to redesign cities
6Infrastructure planning, need to redesign cities
7Regulations, infrastructure planning, need to redesign cities, coexistence of micromobility with soft modes of transportation, inclusive mobility
8Regulations, infrastructure planning, need to redesign cities, coexistence of micromobility with soft modes of transportation, inclusive mobility
9Inclusive mobility
Table 8. Significative outputs of the path analysis: dependencies.
VariablesEstimateStandard
Error (s.e.)
Estimate/s.e.p-Value
Variables with effects on the contribution of the existence of dedicated lanes on cycling (P_lane)
Education level0.0760.0382.0040.045
Acquaintance’s accident severity0.0910.0531.7160.086
Rules knowledge−0.1460.062−2.3550.019
Bike lane coverage0.2520.0485.2960.000
Variables with effect on the perception of cyclists’ rights being addressed (P_right)
Acquaintance’s accident severity−0.1900.057−3.3300.001
Bike lane coverage0.1270.0562.2720.023
Cycling for sporting purposes−0.2490.120−2.0780.038
Variables with effect on the perception of cyclists’ being supported by Administrations (P_admon)
Bike lane coverage0.4370.2052.1340.033
Cycling for sporting purposes−0.7310.369−1.9780.048
Variables with effect on the perception of laws being appropriate to protect cyclists(P_leg)
Bike lance coverage0.2350.0872.7010.007
Cycling for sporting purposes−0.6020.186−3.2370.001
Bike lane located on the road−0.4130.156−2.6410.008
Variables that influence the frequency of cycling (Days)
P_lane−0.3280.148−2.2170.027
Variables that influence the usual distance cycled (Distance)
P_lane−0.7140.202−3.5300.000
P_admon−1.0260.271−3.7780.000
Variables that influence cyclists’ compliance with the signaling
P_lane0.1500.0921.6250.104
Variables that influence the preference of segregated lanes on the sidewalk
Female1.1480.5881.9520.051
Income−0.4870.262−1.8490.065
Variables that influence the preference of segregated lanes on the roadway
Female−0.9780.395−2.4740.013
Income0.2990.1422.1050.035
Variables that influence the preference of segregated lanes between the sidewalk and a row of parked cars
Female1.2240.5482.2310.026
Income0.5530.3261.6940.090
Physical condition−0.7510.295−2.5470.011
Table 9. Significative outputs of the path analysis: correlations.
VariablesEstimateStandard Error (s.e.)Estimate/s.e.p-Value
Correlations with Distance
Days0.5370.1513.5460.000
P_leg.0.2790.1411.9850.047
P_right0.1540.0931.6670.096
Correlations with P_leg.
P_right0.2420.054.8730.000
Disclaimer/Publisher’s Note: The statements, opinions and data contained in all publications are solely those of the individual author(s) and contributor(s) and not of MDPI and/or the editor(s). MDPI and/or the editor(s) disclaim responsibility for any injury to people or property resulting from any ideas, methods, instructions or products referred to in the content.

