Article

A Study of the Spatial Mechanism of Financial Agglomeration Affecting Green Low-Carbon Development: Evidence from China

1
School of Economics and Management, Nanjing Forestry University, Nanjing 210037, China
2
Business School, Jiangsu Normal University, Xuzhou 221116, China
*
Author to whom correspondence should be addressed.
Sustainability 2023, 15(2), 965; https://doi.org/10.3390/su15020965
Submission received: 28 November 2022 / Revised: 24 December 2022 / Accepted: 1 January 2023 / Published: 5 January 2023

Abstract

:
China has stepped into the assertive stage of transforming the economic development mode and economic growth momentum, while green and low-carbon development is undoubtedly the way to promote high-quality economic development in the new period. As the core of modern economic growth, the spatial scale concentration of finance plays a crucial role in the development of economic transformation. In this paper, the SBM-GML production index method was used to measure the green low-carbon development level of 30 provinces in China from 2003 to 2019. It also empirically examines the impact and effect of financial agglomeration on green low-carbon development from a two-dimensional perspective of time and space using a systematic generalized matrix and a spatial dynamic panel model. At the same time, the spatial spillover effects of financial agglomeration were measured using a partial differential approach combined with the mediating effect model to reveal the path of financial agglomeration on green low-carbon development. It was found that, firstly, financial agglomeration achieves green low-carbon, and high-quality development through economic growth, industrial structure upgrading, and technological innovation improvement. It also achieves the enhancement of green, low-carbon development through the dual improvement of green technological progress and green technological efficiency. Second, financial agglomeration can enhance the green low-carbon development of neighboring regions; the positive effect of financial agglomeration has a significant positive spatial spillover. Third, the relationship between financial agglomeration and green low-carbon development shows a significant inverted U-shaped relationship, i.e., short-term promotion and long-term inhibition; at present, financial agglomeration, as a whole, has not crossed the critical value but still has a promotional effect on green low-carbon development. Finally, this article points out that in order to effectively promote green, low-carbon development, China needs to continuously promote the formation and optimization of financial agglomeration and make concerted efforts in economic growth, industrial structure upgrading, and technological progress.

1. Introduction and Review of the Literature

Since its reform and opening up, China’s economy has maintained a high rate of growth while inevitably bringing about serious resource and environmental problems due to its sloppy economic growth. Behind China’s achievements and the industrial boom is the environmental problem of excessive greenhouse gas emissions leading to global warming. According to the 2020 EPI Report released by Yale University and other institutions, China ranks 120th in environmental performance among the 180 countries that participated, with air quality and pollution emissions ranking 137th and 91st, respectively. At this critical period of China’s high-quality economic development, the 19th Party Congress pointed out the need to “implement the strictest ecological environmental protection system”, and the 20th Party Congress emphasized that “we must firmly establish and practice the concept that green water and green mountains are the silver mountain of gold, and plan development from the perspective of the harmonious coexistence of man and nature.“ This undoubtedly reflects China’s determination to pursue green development. At the same time, China is actively making Chinese contributions to global climate governance and has made a solemn commitment to the international community to “reach the peak of carbon, carbon neutrality”, which is a clear direction for further actively and steadily promoting low-carbon development. So, how to plan development on the height of achieving the harmony between humans and nature, how to maintain economic growth while effectively reducing energy consumption, and achieving green and low-carbon quality development means that dealing with one of the issues is undoubted of great practical significance.
At the same time, Industry “4.0” has set off a revolution of intelligent transformation in the global industrial sector, integrating manufacturing more closely with the Internet of Things and service networks [1], which facilitates more efficient exchange and flow of information, factors, technologies, and knowledge, and emphasizes higher requirements for the quality of labor and other factors [2]. In the context of industrial “4.0”, industrial agglomeration, as a concentrated and efficient spatial development model, will obviously be more conducive to enterprises optimizing resource allocation and sharing knowledge and technology spillovers, ultimately bringing about improved production efficiency [3]. Financial agglomeration is a special kind of industrial agglomeration, and the agglomeration form presented is industry-dependent, which is key to the allocation and combination of regional capital factors and plays an important role in the economic development and production efficiency of a region. Then, in today’s highly emphasized green and low-carbon development, it is of great practical significance whether the financial agglomeration form can become a new engine of green and low-carbon high-quality development.
The current academic research on industrial agglomeration and production efficiency is broadly based on Marshall’s [4] external economic theory as the framework in progress. Whether it is Hoover’s theory of scale economy, Lesch’s theory of industrial location, Perus’ theory of growth poles, Schumpeter’s theory of technological innovation, or Porter’s theory of industrial clusters, they all take the external economic theory as the framework and generally believe that the economies of scale brought by industrial agglomeration can not only make enterprises share infrastructure and labor force but also can bring technology and knowledge spillover, thus promoting the improvement of production efficiency. Numerous foreign and domestic scholars have also used the above theory as a basis and have empirically tested the productivity enhancement effect of industrial agglomeration [5,6,7,8]. In addition, in subsequent related studies, most of the studies on industrial agglomeration and production efficiency have also been developed around the above theoretical mechanisms for localized expansion, modification, or verification.
Since Slow proposed the total factor productivity (TFP) research paradigm in the framework of neoclassical economics, TFP has been widely used as an important indicator of production efficiency and economic growth quality because it excludes the degree of optimization of resource allocation other than all tangible factors of production [9,10]. As a special industry, the financial industry not only has the functions of general industrial agglomeration but also has the special characteristics of financial resources—the greater mobility of factor endowment—and is thus more likely to bring economic as well as knowledge spillover, which in turn can promote the improvement of production efficiency faster [11]. This is mainly because the agglomeration of the financial industry promotes the inflow of regional capital elements, and the accumulation of capital elements brings investment behaviors that promote the development of the region from various aspects such as medical care, education, and environment, thus driving the high-quality development of the region. For example, perfect infrastructure will increase the accessibility and attractiveness of the region. Factors such as labor force and FDI are more likely to flow into regions with perfect infrastructure [12], which in turn provide an effective supply to industrial development, and the flow of factors has knowledge spillover and technology spillover effects, which help promote the level of innovation, thus contributing to the improvement of regional development. In addition, infrastructure investment reduces the cost of labor mobility, bridges the information divide, and helps alleviate poverty. Conversely, regions with insufficient infrastructure have difficulty attracting more factors of production and face insufficient financial support as well as low labor mobility and higher unemployment rates [13,14,15].
Therefore, the impact of financial agglomeration on TFP has been of great interest to academics. Academics have mainly focused on the linear or nonlinear relationships of financial agglomeration on total factor productivity in different industries such as manufacturing, finance, and cultural industries [16,17,18]. However, the crude economic development model based on high investment and high output, despite bringing higher output growth and the expansion of economic aggregates, has neglected economic efficiency and inevitably brought about serious environmental problems. The important impact of environmental issues and climate change on economic growth has been well documented; environmental issues may affect land and forest areas, agricultural output, tourism income, transport infrastructure, the health of the population, etc. [19]. However, TFP does not include environmental pollution, a non-desired output, in the evaluation of economic growth and output performance, thus distorting the evaluation of economic performance, which is not in line with the “win-win” requirement of ecological protection and economic growth, and cannot achieve green, low-carbon, and high-quality development. Therefore, the green total factor productivity (hereafter referred to as GTFP), which incorporates energy and environmental constraints into the economic growth accounting framework, overcomes the shortcomings of traditional TFP and better characterizes the real level of production efficiency and economic growth quality of a region or country [20,21].
It must be acknowledged that academic research results on the financial agglomeration of GTFP are more abundant. Their research findings are mainly in the following three areas: first, the promotion view. This view mainly believes that financial agglomeration can reduce financial transaction costs and enhance resource allocation efficiency through spillover and diffusion effects, thus playing a positive role in the development of a green economy in local and neighboring regions [22]. The second is the suppression view. This view mainly believes that the further increase in the agglomeration level, causes excessive competition within financial institutions and finally produces a spatial crowding out effect on GTFP [23]. Third, the nonlinear view. This view mainly believes that the impact of financial agglomeration depends on the sum of positive and negative effects, mainly related to the degree of agglomeration, and roughly follows Williamson’s [24] view that agglomeration promotes productivity at the beginning and inhibits it at the end [25], and some scholars believe that there is a “U”-shaped, threshold effect between the two [26,27]. However, there are still some shortcomings regarding the impact of financial agglomeration on GTFP: First, few scholars have discussed whether financial agglomeration in the context of dual carbon can promote green transformation in economic development, and the transmission mechanism has not been thoroughly examined.
Additionally, the previous studies are limited to the direct impact of financial agglomeration on GTFP and have not yet conducted in-depth tests on the transmission mechanism. Second, except for a few examples in the literature, such as Shao (2022) [28], most studies ignore the possible spatial dependence characteristics of GTFP. Third, the Williamson hypothesis emphasizes the binding role of agglomeration level on production efficiency, but empirical studies on financial agglomeration are relatively scarce.
In view of this, this paper expands and refines the existing research in three ways: first, the inclusion of carbon emissions, environmental pollution, and energy factors into the total factor productivity growth measurement framework clearly allows for a more accurate assessment of the green and low-carbon transition development approach. Using the super-efficient-non-expectation Malmquist production index method (SBM-Malmquist) to calculate and decompose the GTFP of each province in China from 2003 to 2019, we explore in detail whether financial agglomeration has contributed to the green low-carbon transition in a dual-carbon context. Second, the different contributions of financial agglomeration to green low-carbon development through economic growth, industrial structure upgrading, and technological innovation are comprehensively examined, and the nonlinear relationship between financial agglomeration and GTFP is examined based on the Williamson hypothesis. Third, considering the possible spatial spillover effects of GTFP and its determinants, this paper adopts a spatial dynamic panel model to analyze the spatial spillover effects of financial agglomeration on GTFP and its action paths from both time and space perspectives.

2. Mechanism Analysis and Research Hypothesis

2.1. The Mechanism of the Role of Financial Agglomeration on GTFP

The neoclassical economic growth theory argues that economic growth needs proximate drivers, including physical capital, technological progress, and other factors. In the context of environmental constraints, the neoclassical economic growth theory can also explain the growth drivers of China’s green low-carbon development in the context of dual carbon, i.e., the improvement of green low-carbon development comes directly from the improvement of factor allocation and technological progress. This paper argues that financial agglomeration will influence the direct and fundamental factors of green low-carbon development through the combination of the economy of scale effect, structural effect, and technological innovation effect and then promote green low-carbon development. Its influence mechanism mainly has the following three kinds.
First, the economy of scale effect. Financial agglomeration can drive down the overall production costs in the region through the reduction of unit production and transportation costs as well as enterprise operation costs; it further bring about a significant increase in the expected output, which ultimately promotes green low-carbon development. On the one hand, the agglomeration of financial institutions in a specific region accumulates a large amount of idle capital and attracts a large number of financial resources through capital accumulation, which promotes the improvement of regional financial literacy, generates the effect of economies of scale, and reduces unit production costs and transaction costs [29]. On the other hand, financial agglomeration increases the liquidity of financial markets, deepens cooperation among financial institutions, helps to reduce the operating costs of enterprises, improves the efficiency of resource and management allocation, and plays an important role in promoting economic growth [30,31]. Additionally, financial agglomeration can also provide financial security for the construction of infrastructure, such as road transport, as well as public services, which can effectively reduce unit transportation costs, promote the inflow of labor factors, and increases regional competitiveness.
However, once financial resources are gathered to a certain extent, the spatial congestion effect caused by excessive agglomeration will hinder the development of advantages brought by the agglomeration effect. The carrying capacity of regional space is limited and, with too much concentration on labor, population, energy, and industry, will exceed a load of regional space, leading to problems such as the rise of production factor prices and production costs, etc. Moreover, multiple degrees of financial agglomeration will lead to negative externalities in the infrastructure and public service carrying capacity which will lead to resource mismatch and other phenomena, which is not conducive to the improvement of production efficiency. In addition, the disorderly competition caused by excessive agglomeration will also reduce the allocation efficiency of resources and hinder the improvement of production efficiency [32,33], which is not conducive to green and low-carbon development.
Second, structural effects. Financial agglomeration can promote green and low-carbon development through industrial structure upgrading. The economies of scale generated by financial agglomeration can provide the necessary funds for industrial structure upgrading. Additionally, the profitability of financial resources will make capital gradually invest in sectors with high profitability or high growth, forcing low value-added and high-polluting economic agents to transform or transfer their industries, which will lead to the rationalization of industrial structure. The structural effect of financial agglomeration not only makes the proportion of high-value-added enterprises and tertiary industries rise but also strengthens this factor flow effect and promotes the industrial structure to become more advanced. It promotes the reduction in regional pollution emissions, the improvement of production efficiency, and the enhancement of green and low-carbon development [34].
Third, the technological innovation effect. Financial agglomeration can attract more innovation factors such as knowledge, technology, and talents to gather within the scope, and the concentration of innovation factors and a better regional innovation system will, in turn, further enhance the progress and diffusion of green technology in the region, thus contributing to green low-carbon development. In addition, the geographical concentration of the financial industry increases the breadth of market interactions among related enterprises within and between industries and brings about the “low-cost” or “zero-cost” spillover of explicit, tacit knowledge and technology among related enterprises. In this way, the “low-cost” knowledge and technology spillover effectively improves the technological innovation ability and technological progress of enterprises in the region and brings a positive feedback mechanism—forming a repeated innovation knowledge spillover and accumulation reinforcement effect, and finally, the regional overall improvement of the technological innovation level is achieved. Especially in the context of Industry 4.0, the digitalization of production and information systems, system automation, automatic data exchange, and other features can lead to a more effective flow of factors [1], while the overflow of knowledge and technology can better promote the integration of new generation information technology with different industries and promote the development of industries in the direction of intelligence, informationization, greening, service, and globalization. Further, the overall improvement of the technological innovation level not only promotes the improvement of overall regional production efficiency but also promotes the improvement of overall regional green and low-carbon development by sharing and improving green production technologies [34,35].
In general, financial agglomeration promotes green, low-carbon development through moderate economies of scale, structural effects, and technological innovation effects. However, excessive agglomeration can lead to congestion effects that hinder its development.

2.2. Spatial Spillover of Financial Agglomeration

Krugman [36] states that factor agglomeration in the region affects neighboring regions through its spillover effect but this effect is constrained by distance as well as other factors. Thus, in the process of agglomeration activities occurring, the factor endowments of two neighboring regions will generate cross-regional flows of resources, making them economically relevant. Therefore, in the process of financial industry agglomeration, financial agglomeration may not only affect only the industries or enterprises in the region, but even affect the adjacent regional industries or enterprises. On the one hand, as a market-driven industry, the financial industry will proceed through the stage of agglomeration to diffusion. The diffusion stage is the “trickle effect”, which is mainly manifested by the core area’s radiation to the surrounding areas through technology spillover, knowledge spillover, and industrial transfer [37]. On the other hand, in terms of enterprises, under the promotion of market competition and economies of scale, the superior enterprises will transfer their factor endowments to the surrounding underdeveloped provinces through the spillover effect so as to gain more profits. In this way, the surrounding underdeveloped provinces can receive various resource endowments brought by the radiation of developed provinces, thus driving the development of their regional economies.

3. Models, Variables and Typical Fact Analysis

3.1. Variables Selection

3.1.1. Explanatory Variable: Green Low Carbon Development (GTFP)

The green total factor productivity (GTFP), which is measured by including energy factors, environmental pollution, and carbon dioxide emissions in the performance evaluation system, can obviously better measure the productivity, economic quality, and green low-carbon development of a region or country. Obviously, it can better measure the production efficiency, economic quality, and green low-carbon development of a region or country, so this paper uses GTFP to proxy green low-carbon development. Since the super-efficient SBM model introduces slack variables into the function, thus improving the robustness of the results, and the GML (global Malmquist–Luenberger) index overcomes the drawbacks of the ML index in solving, this paper uses the SBM-GML method to measure GTFP and decompose it into GTC and GEC, with the following equations:
Taking each city as a production decision-making unit D M U , a = ( a 1 , a m ) , (a is a type of input), b = ( b 1 , b n ) (b is a type of expected output), and c = ( c 1 , c j ) (c is a type of unexpected output) are all included in the decision-making unit. Under the condition that the scale returns remain unchanged, the SBM directional distance function is as follows:
ρ   =   min 1 1 m i m s a x i 0 1 + 1 s 1 + s 2 ( k = 1 s 1 s k b b k 0 + l = 1 s 2 s 1 c c l 0 )
s . t . a i 0 = j = 1 n λ j a j + s i a , i ;
s . t . b k 0 = j = 1 n λ j b j s k b , k ;
s . t . c l 0 = j = 1 n λ j c j + s l c , l ;
s . t . s i a 0 , s k b 0 , s l c 0 , i , k , j , l
ρ indicates the efficiency value of the role uni, s a R m and s c R s 2 represent the excess of input and unexpected output, and s b R s 1 represents the shortage of expected outputs. m , s 1 , s 2 they, respectively, represent the number of corresponding variables.
G M L t , t + 1 ( a t , b t , c t , a t + 1 , b t + 1 , c t + 1 ) = 1 + D G ( a t , b t , c t ) 1 + D G ( a t + 1 , b t + 1 , c t + 1 ) = 1 + D t ( a t , b t , c t ) 1 + D t + 1 ( a t + 1 , b t + 1 , c t + 1 ) · 1 + D G ( a t , b t , c t ) 1 + D t ( a t , b t , c t ) · 1 + D t + 1 ( a t + 1 , b t + 1 , c t + 1 ) 1 + D G ( a t + 1 , b t + 1 , c t + 1 ) = G E C t , t + 1 × G T C t , t + 1
D G ( α , β , c ) = max β b + β b , c β c P G ( a ) represents all directional distance functions that depend on the global production possibility set P G ( a); G M L t , t + 1 represents the change in the green total factor production efficiency of role units in two adjacent phases during the study period. GTFP can be decomposed into two parts: the technical change indicator (GTC) and the efficiency change indicator (GEC)
The specific input-output indicators of GTFP are as follows.
(1) Indicators of input variables: first, labor input. The number of people in each province at the end of the year is used to express. Second, energy input. The quantity of coal and other fuels used is used. Third, capital stock. It is expressed using a fixed asset investment but considering that the source of data in this paper is the flow indicator, this paper converts it into a stock indicator by the perpetual inventory method. The specific formula is:
K i , t = I i , t + K i , t 1 ( 1 δ )
where K is the capital stock, δ is the depreciation rate, and I is the total asset formation in the year. Among them, the depreciation rate in this paper adopts Zhang Jun’s 9.6% [38], and the calculation method also refers to its process.
(2) Output variable indicators. Output indicators include the expected output and non-expected output. First, expected output. In addition, the GDP of this paper was obtained according to its method. Second, non-desired output. The undesired outputs include the number of carbon emissions, industrial sulfur dioxide, wastewater, and solid waste emissions by province.

3.1.2. Core Explanatory Variable: Financial Agglomeration Level (FAGG)

The mainstream method of measuring industrial agglomeration in the established literature is location entropy. As for locational entropy, some scholars use the locational entropy of some financial industries, such as the banking industry, to indicate the financial agglomeration level of a region or province, but this cannot reflect the overall financial agglomeration level of a region. Therefore, this paper uses the method of comprehensive measurement to calculate the location entropy of a region. The specific calculation formula is as follows:
F A G G i j = L i j / G D P i j / Σ L j / Σ G D P j
where L i j and G D P i j denotes the value added and the gross value of the financial industry in the province i in year j, Σ L i j and Σ G D P i j denotes the value added and gross value of the financial industry nationwide in year j. The specific data are obtained from the WIND database. In addition, if the locational entropy value is greater than 1, the province’s financial industry is considered to have a relative advantage in the country, and vice versa; if the locational entropy is less than 1, the province’s financial industry is at a relative disadvantage in the country.

3.1.3. Control Variables

(1) Financial expenditures (GS). The government’s financial support in public services, especially in infrastructure construction and the provision of urban public goods, plays an important role in the productivity and economic development level of cities. In this paper, we use the public budget fiscal expenditure as a proportion of the current year’s GDP to indicate the level of regional fiscal expenditure.
(2) Environmental regulation (ECO). Considering that environmental regulation has a certain influence on the output indicators in GTFP, the selection of environmental regulation indicators in this paper draws on the idea of Shangguan Xueming [39] and selects three indicators of industrial wastewater, soot, and carbon dioxide emissions, and formulates them into the environmental regulation indicators in this paper by the entropy weight method.
(3) Human capital (LNHM). Human capital can provide intellectual support for a region and is, therefore, a key element for the economic development of a region. Moreover, it has been pointed out in the literature that human capital has an impact on the efficiency of production and R&D, so this paper uses the logarithm of years of education per capita over the age of six to express this.
(4) Physical investment (INV). The development of the economy and the improvement of efficiency cannot be achieved without the continuous support of capital and physical goods, and the most expressive physical goods are fixed investments. In this paper, we use the proportion of the social fixed asset investment to GDP in the year to measure its level.
(5) Urbanization rate (URBAN). Considering that the urbanization process has a great influence on China’s economic development, the urbanization rate is chosen as the control variable in this paper, and the most general form of the urbanization rate of the population is adopted to represent the level of urbanization in China.

3.1.4. Mediating Variables

Based on the previous analysis, the mediating variables were selected as follows.
(1) Scale variable (LNS). Considering that the most intuitive effect of economies of scale is the change in the output scale, we used the output scale as the scale variable. In this paper, the real GDP of each province was the logarithm of output size as a proxy variable.
(2) Structural variable (IS). The structural effect brought by financial agglomeration can promote the upgrading of industrial structures. The most common form of industrial structure upgrading, namely, industrial upgrading (is), is used in this paper to express the value added to the tertiary industry and the secondary industry.
(3) Technology variable (INOV). Since the most direct expression of the technological innovation effect is the improvement in the regional innovation level, this paper uses technological progress (INOV) to represent the technological variable. For the setting of the variable, this paper draws on the method of Hu [40] to select the logarithm of the total number of patents granted in each province to represent.

3.2. Data Sources

This paper uses the statistical data of 30 sample provinces in China from 2003 to 2019, mainly from the China Urban Statistical Yearbook, China Regional Economic Statistical Yearbook, and China Environmental Statistical Yearbook, and some data are supplemented by provincial statistical yearbooks, and the missing data are processed by an interpolation method to finally obtain the panel data of 30 sample provinces. In addition, when measuring GTFP using relevant indicators, this paper draws on the method of Qiu Bin [41] et al., which multiplies GTFP cumulatively, and the specific steps are to multiply GTFP cumulatively with 2001 as the base period, while the decomposition terms are also multiplied cumulatively in this paper. The descriptive statistics of the variables are shown in Table 1.

3.3. Model Setting

Considering that the cross-regional flow of factor endowments makes green low-carbon development present certain spatial correlations, this paper analyzes the possible spatial correlation of GTFP by introducing a spatial econometric model. The optimal model of the article was found to be a spatial lag model through LM as well as Robust LM tests, so the benchmark model of financial agglomeration and green low-carbon development was constructed by drawing on the modeling idea of Sun Zhenqing et al. [42] as:
G T F P = ρ W G T F P i t + δ 1 G T F P i t 1 + δ 2 F A G G i t + δ 3 X i t + ε i t
In addition, in order to study the intrinsic mechanism of the financial agglomeration affecting GTFP, this paper, therefore, includes green technological progress as well as green technological efficiency into the examination and similarly constructs the model as:
G T C = ρ W G T C i t + δ 1 G T C i t 1 + δ 2 F A G G i t + δ 3 X i t + ε i t
G E C = ρ W G E C i t + δ 1 G E C i t 1 + δ 2 F A G G i t + δ 3 X i t + ε i t
F A G G i t is a core explanatory variable and represents the level of financial agglomeration in each province; G T F P is an explanatory variable that represents the level of green development. g t c , gec represents green technological progress and green technological efficiency; W is the spatial weight matrix, reflecting the spatial connection between different regions. W G T F P i t , W G T C i t , W G E C i t is the spatial lag term; G T F P i t 1 , G T C i t 1 , G E C i t 1 is the time lag term for the lagged period. X i t is the set of control variables and ε i t is a random perturbation term.
Although spatially lagged dynamic panel models examine explanatory variables in two dimensions of time and space, the use of traditional regression methods for them leads to the problem of dynamic bias in the models. To alleviate the endogeneity problem, this paper uses the systematic GMM developed by Arellano [43] to estimate the spatial dynamic panel model. In addition, to test the possible nonlinear relationship between financial agglomeration and GTFP and its decomposition term, the squared term of the core explanatory variables is therefore added to the benchmark regression, and the following model is constructed in this paper:
G T F P = ρ W G T F P i t + δ 1 G T F P i t 1 + δ 2 F A G G i t + δ 3 F A G G i t 2 + δ 4 X i t + ε i t
G T C = ρ W G T C i t + δ 1 G T C i t 1 + δ 2 F A G G i t + δ 3 F A G G i t 2 + δ 4 X i t + ε i t
G E C = ρ W G E C i t + δ 1 G E C i t 1 + δ 2 F A G G i t + δ 3 F A G G i t 2 + δ 4 X i t + ε i t
According to previous theoretical analysis, financial agglomeration may affect the efficiency of the green economy through the effect of scale economy, structural effects, and the technological innovation effect:
M i t = δ 1 F A G G i t + δ 2 X i t + ε i t
Eq: M i t denotes the scale variables (LNS), structure variables (IS), and technical variables (INOV). In addition, considering that GTFP involves the influence of both the geographical location as well as economic factors, the nested matrix, namely the economic geography matrix, is adopted.
The spatial weight matrix is set as:
W = σ W eco + ( 1 - σ ) W dis
Among them, 0 < σ < 1 . To simplify the calculation, select σ = 0.5 . W e c o and W d i s denote the economic distance and geographic weight matrix, respectively. Additionally, in this paper, W e c o is constructed by using the inverse of the difference between the two provincial capitals per capita g d p , while it is constructed by using the inverse of the nearest kilometer distance between the two provincial capitals for W d i s .
Meanwhile, this paper examined the spatial correlation of GTFP using the global M o r a n s   I index. Its calculation formula is:
I = n i j W i j × i j W i j x i x ¯ x j x ¯ i x i x ¯ 2
In Equation (9), W i j is the spatial weight matrix, and the spatial matrix of this uses nested matrices. M o r a n s   I [ 1 , 1 ] and M o r a n s   I > 0 indicates that the examined data have a positive spatial correlation and that regional observations tend to cluster; M o r a n s   I < 0 is contrary to this.
In addition, this paper also draws on Lesage and Pace [44] for the estimation of spatial spillover effects by writing the spatial matrix in the form of partial derivatives. Additionally, since this paper is a spatial dynamic panel model, the spillover effects are divided into short-run and long-run, and the equations for the specific effects are as follows.
Short - term   direct   effects = [ I ρ W 1 α 1 k I N ] d ¯
Short - term   indirect   effects = [ I ρ W 1 α 1 k I N ] r s u m ¯
Long - term   direct   effects = { [ ( 1 θ ) I ( ( ρ + γ ) W ] 1 ( α 1 k I N ) } d ¯
Long - term   indirect   effects = { [ ( 1 θ ) I ( ( ρ + γ ) W ] 1 ( α 1 k I N ) } r s u m ¯
where I denotes the unit matrix, which is the nested matrix in this paper, d ¯ and r s u m ¯ represents the operators for calculating the mean of the diagonal elements of the matrix and the row and mean of the non-diagonal elements, respectively; the parameter ρ , θ , γ represents the coefficients of the time, space, and space-time lag effects of the variables.

3.4. Typical Fact Analysis

3.4.1. Time Evolutionary Characteristics of GTFP

The GTFP of each province was measured based on the SBM-GML production index method using input-output indicators of 30 Chinese sample provinces from 2003 to 2019, and its decomposition terms GTC and GEC were included in the study (Table 2).
As can be seen from Table 2, as far as GTFP is concerned, the values of GTFP for all Chinese provinces are greater than one except for 2009, and the growth rate is 2.2% during the sample period, which indicates that GTFP for all Chinese provinces shows a good development trend. Meanwhile, in terms of the general trend of GTFP, China’s GTFP is a “U” shaped development trend that decreases first and then increases slightly. This may be related to the implementation of a green development policy in China. Before the implementation of the green development policy in China, higher resource input brought rapid economic development but brought higher “three waste” emissions and various resource wastes and mismatch, resulting in lower GTFP. However, as the government advocates the concept of green development and implements corresponding policies (e.g., low-carbon pilot), it has led to an increase in GTFP. Secondly, in terms of GTC and GEC: all GTCs in the sample period are greater than one, and the average value is 1.048, which indicates that GTC shows an upward trend; in terms of GEC, except for 2013 and 2019, the rest of the years are less than one, and the average value is 0.978, which indicates that China’s GEC is still in a slightly declining development trend. However, in recent years, GEC has fluctuated more obviously. By East and West, GTFP, GTC, and GEC in each province show a similar evolutionary trend to the full sample, but there are also regional differences. In terms of mean values, GTFP and GTC are greater than one, indicating their upward development trend; however, in terms of the size of regional growth rates, they reflect the characteristics of East > Central > West. In addition, in terms of GEC, although the average value of all regions is less than one, the eastern was is greater than one in 2008, 2013, 2015, and 2019, while the central and western regions are greater than one for only three years, and the overall regional growth rate also reflects the characteristics of east > central > west, which also reflects how the situation of economic development (east > central > west), and uneven economic development has been a long-standing problem in China.
On the whole, GTFP and green technology progress in China’s provinces are in a slightly increasing development trend, while the improvement of green technology efficiency is not obvious. This indicates that the key to improving GTFP is to continue to improve green technological progress while further exploring the potential of green technological efficiency improvement so as to realize a positive pattern driven by the two wheels of GTC and GEC improvement.

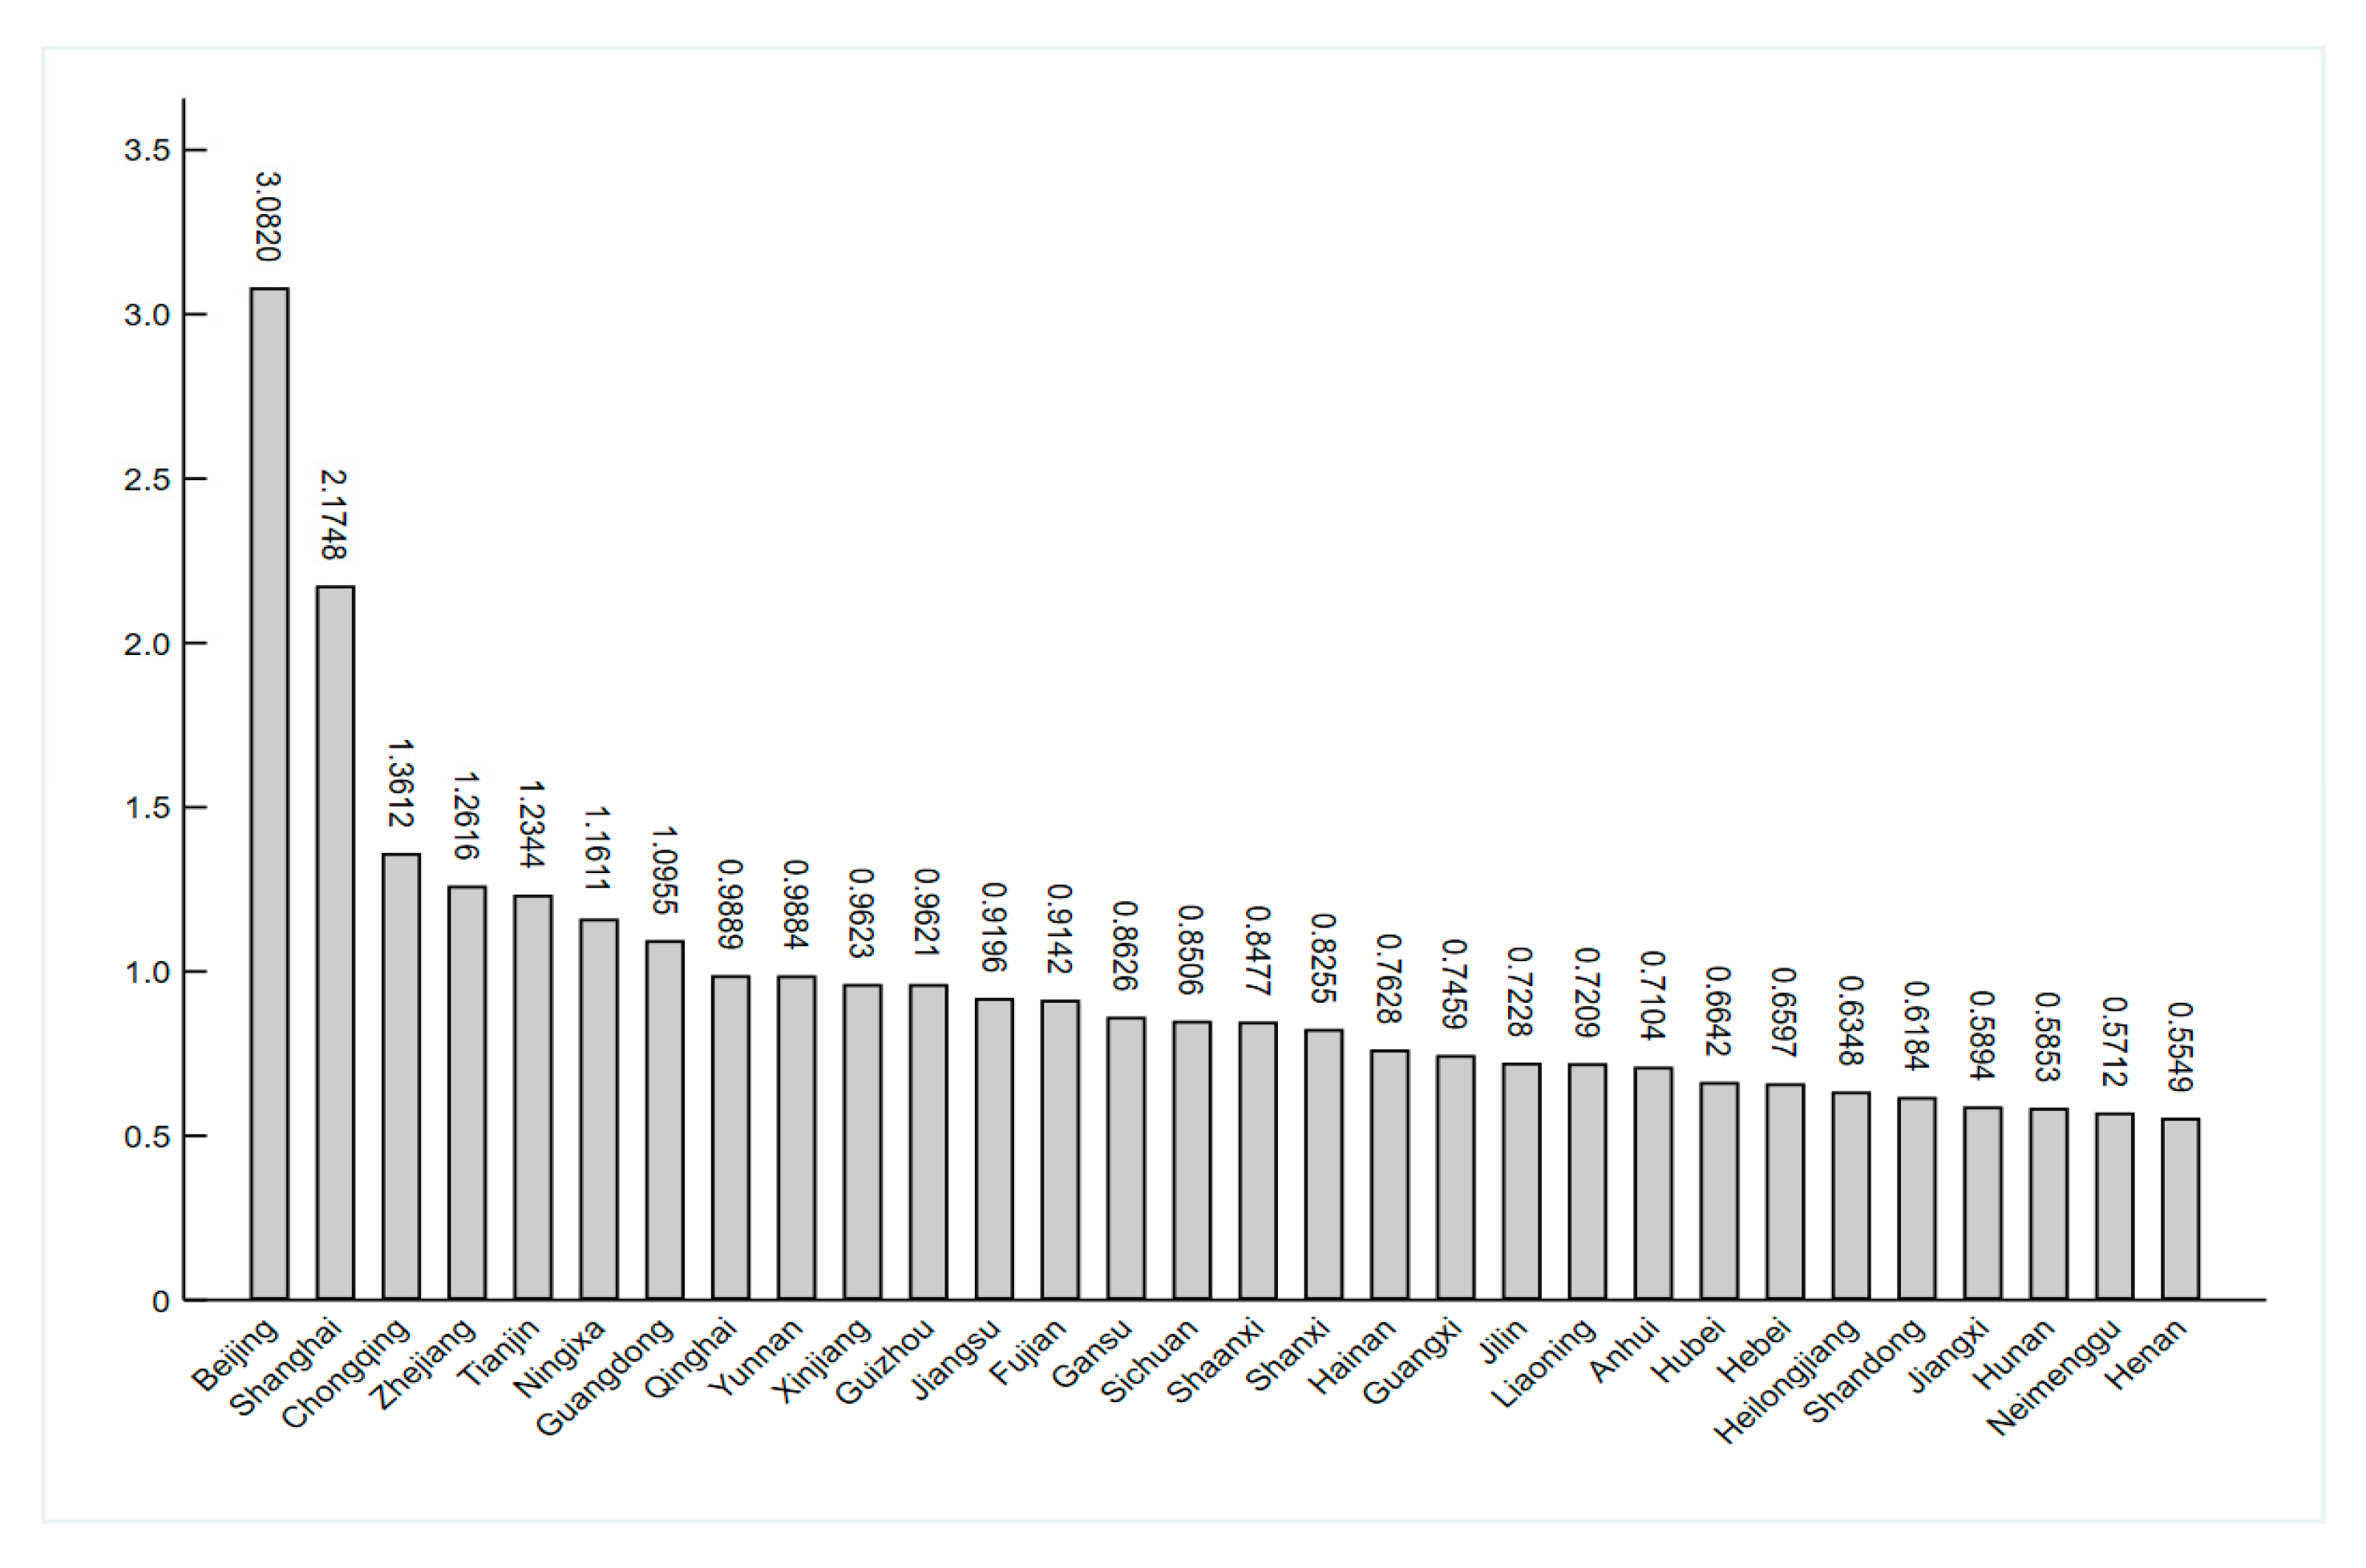
3.4.2. Differences in the Comprehensive Development Level of Provincial Financial Agglomeration (FAGG) in China

Using the data of 30 provinces in China from 2003 to 2019, the FAGG of each province was measured using locational entropy, and also, in order to clearly see the differences in the FAGG development level of 30 provinces in China, the mean value of the FAGG of 30 provinces in China are shown in this paper and sorted by size, and the specific results are shown in Figure 1. The results found that the only provinces with a FAGG level greater than one were Beijing, Shanghai, Chongqing, Zhejiang, Tianjin, Ningxia, and Guangdong, which are the seven provinces, among which Beijing and Shanghai have the largest FAGG scores of 3.0820 and 2.1748, respectively. This indicates that the financial industry agglomeration phenomenon in Beijing and Shanghai is the most obvious and also the most consistent with the actual situation in China, Beijing, and Shanghai, as the financial centers that have been in the financial sector that is in the leading position in China. Inner Mongolia and Henan have the lowest FAGG scores of 0.5712 and 0.5549, respectively, indicating that their FAGG levels are the lowest. Meanwhile, during the sample period, we found that the development level of FAGG in each province varied greatly and was not high in general.
In addition, in order to better distinguish the differences in the comprehensive level of FAGG among the provinces in China, we refer to the method of Changbing Zhang [45] to classify FAGG (Table 3), i.e., using the relationship between the mean value of FAGG (AVG) and the standard deviation (SD) during the sample period, we classified regions into star-type regions (FAGG value greater than AVG + 0.5SD), backward-type regions (FAGG value less than AVG − 0.5 SD) and mediocre regions (FAGG value is in the middle of the above two regions). However, the general opinion on location entropy was that a value greater than one indicated that the industry of the region was in a dominant position nationwide and, vice versa, in a disadvantageous position. Therefore, this paper combines the definition of locational entropy by adding a region, i.e., a relatively advantaged region (whose value is between 1 and AVG + 0.5SD), and resetting the mediocre region (whose value is between AVG − 0.5SD and 1).

4. Measurement Tests and Analysis of Results

4.1. Model Testing

In order to examine the spatial spillover effect comprehensively, the global Moran index test was therefore conducted for the provincial GTFP of 30 provinces in China based on Equation (9). In Table 4: Moran’s I is 0.293 greater than zero and significant at a 1% level of significance, with a z value of 7.946. It can be judged that there is a significant spatial correlation and agglomeration of GTFP levels in 30 sample provinces of China.
Additionally, before performing spatial measures, we first needed to screen the Spatial econometric model to compare two competing models: spatial SLM and spatial SEM. This test is usually conducted by the Robust LM test if the LM test has the same level of significance; the model needs to be Robust LM tested to determine this. As shown in Table 5, the Robust LM test shows that only the spatial SLM model is significant at the 1% level, which indicates that the spatial SAR model is the optimal model for this paper.

4.2. Benchmark Regression

In order to explore the impact of financial agglomeration (FAGG) on GTFP and its decomposition items, this paper used the system GMM to estimate Equations (1)–(3), and the results are shown in Table 6. Two conditions need to be satisfied when using the system GMM estimation at the same time; first, the Arellano Bond sequence correlation test is satisfied, that is, the p-value of AR (1) is less than 0.1, and the p-value of AR (2) is greater than 0.1. As shown in Table 6, AR (1) and AR (2), if all formulas meet the requirements, it indicates that the model selection is effective. Second, the Hansen tool variable validity test needs to be met; that is, the p-value of Hansen is required to be greater than 0.1. Similarly, the p-value of Hansen for the estimated results of all formulas shown in Table 6 is greater than 0.1, which indicates that the selection of tool variables in this paper is effective. To sum up, the estimation results in this paper are reliable.
Column (1) shows the estimation results of financial agglomeration (FAGG) on GTFP, and we can clearly find that the W G T F P i t coefficient is positive and passes the 1% statistical test, indicating that the GTFP of Chinese provinces has significant spatial dependence, and the improvement of GTFP in neighboring provinces can effectively promote the improvement of local GTFP, which also satisfies the new economic geography’s view of economic relevance. Therefore, promoting regional economic integration to weaken transportation and factor allocation costs is beneficial for the improvement of China’s overall GTFP. In addition, strengthening collaborative innovation among regional governments and universities to break down administrative “barriers” or “local protectionism” in resource endowments also helps innovation and knowledge spillover, which in turn leads to the development of overall GTFP. G T F P i t 1 is also significantly positive at the 1% level, which indicates that GTFP has a certain dynamic dependence in the time dimension, i.e., a positive “cumulative reinforcement effect”. Therefore, the improvement of GTFP in China is a long-term process, and economic growth requires not only quantitative accumulation but also qualitative improvement and coordination with the environment, so long-term planning and policy orientation for productivity and the accumulation of innovation factors and talents are the keys to improving GTFP. The coefficient of the core explanatory variable (FAGG), which is the focus of this paper, is significantly positive, which indicates that FAGG significantly contributes to the improvement of GTFP in China. The reason for this may be that the economies of scale generated by the current FAGG not only make the financial market improve continuously but also provide complete funds for the industrial upgrading of financial institutions, which eventually makes the financial system tend to develop with high quality. The high-quality development of the financial system not only requires the selection of financial loans and financing objects to be resource-efficient and green but also requires FAGG to generate technology and knowledge spillover to bring advanced technology and equipment, management models, and improve the phenomenon of resource mismatch. In addition, due to the profitability of financial resources and the restructuring of resources, financial resources flow more to the tertiary industry with high-capacity utilization and low pollution and drive the transfer of high-pollution industries, i.e., FAGG promotes the development of GTFP through its economy of scale effect, structural effect, and technological innovation effects.
Columns (2)–(3) show the estimation results of financial agglomeration (FAGG) on GTC and GEC. The results show that, first, both GTC and GEC have significantly positive lags, which indicates that GTC and GEC have the same “cumulative reinforcement effect”. Therefore, technological progress and improvement in technical efficiency is also a long-term process. Secondly, the coefficient W G T C i t W G E C i t is significantly positive, which also indicates the typical spatial correlation between the two, so it is also important to break the “barriers” of knowledge and technology spillover. Financial agglomeration (FAGG) is significantly positive at the 1% level for both GTC and GEC, suggesting that FAGG has a positive effect on both. This also indicates that GTC and GEC are fundamental factors in the formation of a “two-wheel drive” pattern of green, low-carbon, and high-quality development. Specifically, the reason for FAGG to improve GEC may lie in the technology and knowledge spillover brought by FAGG, which allows enterprises to learn advanced management experience from each other; thus, promoting the internal reform of enterprises and breaking the constraints of unreasonable institutions and other factors on technical efficiency, and at the same time, promoting the flow of factor endowments to green development industries to rationalize the industrial structure, which eventually promotes GEC improvement. The reason for the positive effect of FAGG on GTC may be that the economies of scale brought by FAGG can provide financial support for the introduction of green technology research and development or advanced equipment and promote the improvement of GTC through the introduction of advanced equipment or innovative research and development, while the knowledge spillover brought by FAGG is also beneficial to the improvement of the overall technology level. It eventually brings about the improvement of GTC. In addition, since this paper decomposes GTFP using the GML index thus, it is also important to further discuss the heterogeneity of whether FAGG has a greater impact on GTC or GEC. In terms of the impact coefficient, the coefficient of FAGG on GTC is 0.0329, while that on GEC is 0.0291. This difference indicates that FAGG in space strengthens the exchange and sharing of talents, technology, energy, and management, which promotes GTC more directly, such as the introduction of advanced equipment or advanced production technology, which has a more intuitive effect on the improvement of GTC, than the promotion of the improvement of GEC. The process of promoting the improvement of GEC often involves the allocation of production factors such as enterprise management, and the improvement of its allocation efficiency is often not so direct, while the GEC caused by factor integration or the reconfiguration effect is relatively insufficient, which makes the promotion of FAGG on GTC more effective.

4.3. Measurement of Spatial Spillover Effect

According to LeSage and Pace, this paper decomposes the spatial effects of financial agglomeration (FAGG) into direct effects and indirect effects. Then, in this paper, the direct effect refers to the effect of FAGG in a region on the change in GTFP in the region, and the direct effect contains a spatial feedback mechanism, i.e., after the FAGG affects the change of GTFP in the region, the GTFP in the region affects the GTFP in the neighboring regions in a circular process; the indirect effect refers to the effect of FAGG on the change in GTFP in the neighboring regions. In addition, since this paper is a spatial dynamic panel model, the effect of the time dimension is considered as, in this case, the direct and indirect effects that exist in the long and short term. The short-term effect examines the short-term immediate impact of FAGG on GTFP, while the long-term effect reflects the long-term impact of the time-lagged effect.
Because the system GMM estimation cannot measure the spatial spillover effect, this paper uses the maximum likelihood method to measure the spillover effect. Table 7 shows the effect estimation results of Equations (10)–(13). On the whole, first of all, under the nested weight matrix, whether short-term or long-term, the coefficient of direct effect is always greater than the short-term effect, which obviously conforms to the analytical thinking of financial geography and new economic geography theory. That is, the external spillover effect will be subject to the impact of traffic costs and factor liquidity. Secondly, it can be seen that in the short term, the direct effect coefficient is 0.00798, which passed the 5% statistical test, while the indirect effect coefficient is positive but not significant, which indicates that in the short term, FAGG significantly promotes green GTFP in the region but does not have significant spatial spillovers. Finally, in the long run, the direct effect coefficient is positive and passes the 5% statistical test. Similarly, the short-term coefficient is positive and passes the 10% statistical test. This shows that in the long run, FAGG can not only promote the improvement of local GTFPs but also drive the development of GTFPs in the surrounding provinces through positive spatial spillovers. The impact of FAGG on GTFP in the surrounding areas mainly reflects the following two aspects: the first aspect is the spatial positive feedback mechanism. Because GTFP has a positive spatial correlation, that is, the concentration of financial institutions in this region promotes the local GTFP, while the promotion of GTFPs in this region drives the development of GTFPs in adjacent regions. The second aspect is the “trickle-down effect” of FAGG. With the improvement of FAGG to a certain extent, the FAGG drives the transfer of local resource endowment, radiates the surrounding areas, and promotes the development of the financial industry in the surrounding provinces. In this way, with the development of the financial industry in neighboring provinces and the agglomeration, the level of GTFP in regions can be improved.

4.4. Non-Linear Relation Test

Considering the complexity of the productivity effect of industrial agglomeration, this study further investigates the nonlinear relationship between financial agglomeration (FAGG) and GTFP in combination with the Williamson hypothesis. At the same time, we also added the decomposition term of GTFP to observe the possible nonlinear correlation between the two. This study can more accurately grasp the impact mechanism of FAGG on GTFP growth. Therefore, we added the square term of FAGG to Formula (1)–(3), namely Formula (4)–(6). The regression results are shown in Table 8.
It can be seen that the primary coefficient of FAGG is significantly positive, and the second coefficient is significantly negative, indicating that it is conducive to the promotion of GTFP, GTC, and GEC in the short term, but has an inhibitory effect in the long term; that is, the relationship between FAGG and GTFP, GTC and GEC is “inverted U”. It also shows that Williamson’s hypothesis exists in the financial industry, that is, when FAGG reaches a certain extent, the negative effects of FAGG begin to appear, and the carrying capacity of infrastructure and public services decreases due to excessive financial industry agglomeration, which leads to the “congestion effect” and resources mismatch, and finally inhibits the improvement of production efficiency. In addition, the intensification of the competition brought by economies of scale will also lead to vicious competition among enterprises and environmental pollution, further hindering the growth of GTFP. Further, we calculated the critical value or inflection point from positive to negative. The critical value of FAGG to GTFP is 1.087, while the average value of FAGG during the sample period is 0.968, which is less than its critical value, indicating that FAGG still has some room to improve GTFP. At the same time, the critical values of FAGG on green technology progress and green technology efficiency are 1.723 and 1.964, respectively, which are far less than the adjacent values, indicating that FAGG alone has a large space to improve both, especially green technology efficiency. This result also shows that the current FAGG in China plays a positive role in promoting China’s GTFP.

4.5. Robustness Check

4.5.1. Test of Matrices in Different Spaces

Because the regression results of spatial metrology are restricted by different spatial matrices, in order to ensure the accuracy of the results, this paper uses spatial matrices with different weights and makes a robustness test based on the system GMM method (Table 9). The results show that under the three spatial weight matrices, the coefficient direction of the main variables has not changed and has passed the significance test, which shows that the estimation results in this paper are reliable.

4.5.2. Panel Quantile Test

Because the benchmark model in this paper is a spatial dynamic panel model, the spatial spillover effect and the lag period of the explained variable are calculated. So when using traditional estimation methods, is the impact of financial agglomeration (FAGG) on GTFP robust? In addition, due to the unbalanced distribution of China’s GTFP and FAGG, group regression can be carried out under such circumstances. However, because the provincial panel is used in this paper, there is a small sample size problem, and group regression may lead to a bias in the empirical results. The advantage of quantile regression is that it can fully reflect the relationship between variables and reduce the impact of extreme values on coefficient estimation. Based on this, this paper uses panel quantiles to verify the robustness of regression results. The selected quantiles are 10%, 25%, 50%, 75%, and 90%. See Table 10 for specific estimation results. Table 10 (1)–(5) shows the regression results of different quantiles. The results show that except for 10% of the quantiles of FAGG, the impact coefficients of other quantiles on GTFP are positive and pass the significance test, which once again shows the accuracy of this research conclusion.

5. Mechanism Inspection

Based on the above theoretical analysis, this paper refers to the construction of the intermediary effect model to deeply study the impact of the economies of scale, structural effects, and technological innovation effects of financial agglomeration (FAGG) on GTFP.
Columns (1)–(3) in Table 11, respectively, report the estimated results of the equation when the scale variable (output scale), structural variable (industrial structure upgrading), and technical variable (technological progress) are the three intermediary variables. It can be seen that FAGG is significantly positive in the three equations, indicating that FAGG can expand the scale of output, improve industrial upgrading, and promote technological progress. Specifically, the expansion of the output scale brought by economies of scale results in the reduction in the production cost per unit output and in the improvement of production efficiency, thus promoting the improvement of GTFP. The optimization of the industrial structure can bring about lower pollution emissions and higher production efficiency, thus promoting the promotion of GTFP; technological progress is an important factor in the improvement of GTFP. It can improve the unreasonable input and output in the production process, such as carbon emissions and other pollution emissions, through the reallocation of factor endowments. Therefore, it is of great significance to GTFP.

6. Conclusions and Suggestions

Under the background of “carbon neutral and carbon peaking”, this paper attempts to include carbon dioxide, energy factors, and environmental pollution factors in the measurement of total factor productivity and introduces the green, low-carbon, and high-quality development theory characterized by GTFP into the analysis framework of financial agglomeration and production efficiency while using an SBM-GML production index method to calculate and decompose the GTFPs of 30 provinces in China from 2003 to 2019. At the same time, using the system GMM and spatial dynamic panel model, this paper reveals the impact and effect of financial agglomeration on GTFP from the perspective of time and space and investigates the nonlinear relationship between financial agglomeration and GTFP based on the Williamson hypothesis. In addition, we measured the spillover effect of financial agglomeration by using a partial differential method and, combined with the intermediary effect model, deeply analyzed the path of financial agglomeration to GTFP. The conclusions are as follows. First, the current financial agglomeration in China can significantly promote the growth of GTFP and achieve the overall improvement of GTFP through the dual improvement of GTC and GEC. Second, financial agglomeration improves GTFP through economies of scale, structural effects, and technological innovation effects. That is, GTFP is improved mainly through economic growth, industrial structure upgrading, and technological innovation. Third, financial agglomeration can not only promote the upgrading of local GTFPs but also promote the upgrading of neighboring GTFPs; that is, the positive effect of financial agglomeration has significant spatial spillover. Fourth, a significant inverse “U” relationship between financial agglomeration and GTFP indicates short-term promotion and long-term inhibition; at present, financial agglomeration as a whole has not crossed the critical value; that is, it still promotes GTFP.
Based on the research conclusions, the following policy recommendations are proposed in this study. First, in the process of promoting the formation of financial agglomeration, local governments should adopt local policies, combine market mechanisms with national and local government policy guidance, vigorously develop financial industry agglomeration, and integrate the value chain and industrial chain of the financial industry to strengthen the function of financial agglomeration effects so as to better promote high-quality economic development with GTFP growth as the core power. The key to implementing the policy according to local conditions is first, under the guidance of the “double cycle development pattern”, to improve the relevant policies and supporting measures of the financial industry in the cluster area and systematically grasp the weak links in the life process of the financial industry. Second, the government should closely combine its own resource advantages and factor endowment conditions with the national development plan to formulate a top-level design for the development of the financial industry, further promote the financial supply-side reform, promote the diversified development of the financial industry, and form a diversified financial industry cluster. Second, while focusing on the scale economy effect of financial agglomeration to improve GTFP, we cannot ignore its structural effect and technological innovation effect to promote GTFP. In this regard, while promoting financial diversification and agglomeration, we should deeply explore the role of industrial structure upgrading and technology in promoting production efficiency and the energy conservation and emission reduction effect characterized by the reduction in the unexpected output. The key lies in first increasing the introduction of advanced equipment and high-tech talents to drive the technological upgrading of domestic industries and the development of clean technologies. Second, promote the supply-side structural reform, and guide more funds generated by financial agglomeration to flow into the tertiary industry with low pollution costs, energy conservation, and high production efficiency so as to further optimize the industrial layout. Third, in addition to the continuous impact of financial agglomeration on the regional GTFP, the spatial spillover effect also exists significantly in the long term. Based on this situation, neighboring regions should strive to break down the regional barriers to the free flow of factors, improve the infrastructure construction between regions, and eliminate the barriers to industrial flow mechanisms caused by factors such as transportation and factor mobility to the greatest extent so as to better play the positive spillover effect of financial agglomeration.

Author Contributions

Conceptualization, T.Q. (Tianshu Quan); methodology, T.Q. (Tianshu Quan); software, T.Q. (Tianshu Quan)and T.Q. (Tianli Quan); validation, T.Q. (Tianshu Quan); formal analysis, T.Q. (Tianshu Quan); resources, T.Q. (Tianshu Quan) and T.Q. (Tianli Quan); data curation, T.Q. (Tianshu Quan)and T.Q. (Tianli Quan); writing—original draft preparation, T.Q. (Tianshu Quan); writing—review and editing, T.Q. (Tianshu Quan); visualization, T.Q. (Tianshu Quan); supervision, T.Q. (Tianli Quan); project administration, T.Q. (Tianshu Quan); funding acquisition, T.Q. (Tianshu Quan). All authors have read and agreed to the published version of the manuscript.

Funding

This research was supported by the General Program of National Social Science Fund (21BGL167): Research on the Green Benefit Sharing Mechanism of Ecological Protection in the Yangtze River Basin (2021–2024); Additionally, the National Social Science Fund Major Program (21&ZD101): Research on the Realization Path and Policy System of High Quality Development of China’s Food Industry.

Institutional Review Board Statement

Not applicable.

Informed Consent Statement

Not applicable.

Data Availability Statement

The data presented in this study are available on request from the corresponding authors, Tianshu Quan, upon reasonable request.

Acknowledgments

We would like to show our gratitude for the valuable comments and suggestions from the handling editor and anonymous reviewers on the earlier draft of this paper. As usual, the authors are responsible for any remaining omissions.

Conflicts of Interest

No potential conflict of interest were reported by the authors.

References

  1. Hejduková, P.; Kureková, L.; Krechovská, M. The measurement of industry 4.0: An empirical cluster analysis for EU Countries. Int. J. Econ. Sci. 2020, IX, 121–134. [Google Scholar] [CrossRef]
  2. Grześkowiak, A. Soft skills and earnings: Evidence from a nationwide survey in Poland. Int. J. Econ. Sci. 2020, IX, 102–120. [Google Scholar] [CrossRef]
  3. Qu, C.; Shao, J.; Shi, Z. Does financial agglomeration promote the increase of energy efficiency in China? Energy Policy 2020, 146, 111810. [Google Scholar] [CrossRef]
  4. Marshall, A. The Principles of Economics. In History of Economic Thought Books, 8th ed.; Macmillan: London, UK, 1992. [Google Scholar]
  5. Forni, M.; Paba, S. Knowledge Spillovers and The Growth of Local Industries. 2001. Available online: https://ssrn.com/abstract=282575 (accessed on 30 October 2022).
  6. Dupont, V. Do geographical agglomeration, growth and equity conflict? Pap. Reg. Sci. 2007, 86, 193–213. [Google Scholar] [CrossRef]
  7. Arimoto, Y.; Nakajima, K.; Okazaki, T. Sources of productivity improvement in industrial clusters: The case of the prewar Japanese Silk-reeling Industry. Reg. Sci. Urban Econ. 2014, 46, 27–41. [Google Scholar] [CrossRef]
  8. Lu, R.; Ruan, M.; Reve, T. Cluster and co-located cluster effects: An empirical study of six Chinese city regions. Res. Policy 2016, 45, 1984–1995. [Google Scholar] [CrossRef]
  9. He, R.; Baležentis, T.; Štreimikienė, D.; Shen, Z. Sustainable green growth in developing economies: An empirical analysis on the belt and road countries. J. Glob. Inf. Manag. (JGIM) 2021, 30, 1–15. [Google Scholar] [CrossRef]
  10. Dellink, R.; Chateau, J.; Lanzi, E.; Magné, B. Long-term Economic growth projections in the shared socioeconomic pathways. Glob. Environ. Chang. 2017, 42, 200–214. [Google Scholar] [CrossRef]
  11. Banica, G.C.; Constantin, D.L.; Profiroiu, A.; Dimian, M. Regional convergence from the perspective of factor mobility and technological change. Econ. Comput. Econ. Cybern. Stud. Res. 2007, 41, 167–177. [Google Scholar]
  12. Varahrami, V.; Vajari, A.N. FDI, Government budget and efficiency of public infrastructure capital. Int. J. Econ. Sci. 2019, VIII, 148–158. [Google Scholar] [CrossRef]
  13. Kurekova, L.; Hejdukova, P. Multilevel Research of Migration with a Focus on Internal Migration. Int. J. Econ. Sci. 2021, X, 87–103. [Google Scholar] [CrossRef]
  14. Hromada, E.; Cermakova, K. Financial unavailability of housing in the Czech Republic and recommendations for its solution. Int. J. Econ. Sci. 2021, X, 47–58. [Google Scholar] [CrossRef]
  15. Pojar, J.; Macek, D.; Heralová, R.S.; Vitásek, S. Advances in costs optimization methods—Key study of maintenance and restoration of cultural heritage. Int. J. Econ. Sci. 2022, XI, 163–178. [Google Scholar] [CrossRef]
  16. Wang, H.; Zhang, Y.; Liu, Z.; Liu, R.; Li, K. The impact and mechanisms of the shanghai pilot free-trade zone on the green total factor productivity of the Yangtze River delta urban agglomeration. Environ. Sci. Pollut. Res. 2022, 29, 40997–41011. [Google Scholar] [CrossRef] [PubMed]
  17. Qian, Y.; Liu, J.; Forrest, J.Y.L. Impact of financial agglomeration on regional green economic growth: Evidence from China. J. Environ. Plan. Manag. 2022, 65, 1611–1636. [Google Scholar] [CrossRef]
  18. Xie, R.; Fu, W.; Yao, S.; Zhang, Q. Effects of financial agglomeration on green total factor productivity in Chinese cities: Insights from an empirical spatial Durbin model. Energy Econ. 2021, 101, 105449. [Google Scholar] [CrossRef]
  19. Pala, A. The Relation between Climate Change and Economic Growth: The Investigation The Regional Differences with RCM Model in EU-28 Countries. Int. J. Econ. Sci. 2020, IX, 135–155. [Google Scholar] [CrossRef]
  20. Cheng, Z.; Li, L.; Liu, J. Natural resource abundance, resource industry dependence and economic green growth in China. Resour. Policy 2020, 68, 101734. [Google Scholar] [CrossRef]
  21. Song, K.; Bian, Y.; Zhu, C.; Nan, Y. Impacts of dual decentralization on green total factor productivity: Evidence from China’s economic transition. Environ. Sci. Pollut. Res. 2020, 27, 14070–14084. [Google Scholar] [CrossRef]
  22. Feng, Y.; Zou, L.; Yuan, H.; Dai, L. The spatial spillover effects and impact paths of financial agglomeration on green development: Evidence from 285 prefecture-level cities in China. J. Clean. Prod. 2022, 340, 130816. [Google Scholar] [CrossRef]
  23. Yuan, H. Financial agglomeration and green development: A two-dimensional perspective based on level and efficiency. Sci. Res. Manag. 2019, 40, 126–143. [Google Scholar]
  24. Williamson, J.G. Regional Inequality and the Process of National Development: A Description of the Patterns. Econ. Dev. Cult. Change 1965, 13, 1–84. [Google Scholar] [CrossRef]
  25. Yuan, H.X.; Liu, Y.B.; Feng, Y.D. How does financial agglomeration affect green development Efficiency? Empirical analysis of SPDM and PTR models considering spatio-temporal double fixation. Chin. J. Manag. Sci. 2019, 27, 61–75. [Google Scholar]
  26. Wen, Y.; Zhao, M.; Zheng, L.; Yang, Y.; Yang, X. Impacts of financial agglomeration on technological innovation: A spatial and nonlinear perspective. Technol. Anal. Strateg. Manag. 2021, 35, 17–29. [Google Scholar] [CrossRef]
  27. Wu, D.; Tong, X.; Liu, L.; Wang, J. Do regional financial resources affect the concentration of high-end service industries in Chinese cities? Financ. Res. Lett. 2021, 42, 101935. [Google Scholar] [CrossRef]
  28. Shao, S.; Fan, M.; Yang, L. Economic restructuring, green technology progress and China’s low-carbon transformation and development—An empirical study based on the perspective of overall technological frontier and spatial spillover effect. Manag. World 2022, 38, 24. [Google Scholar]
  29. Rod, A.; Čermáková, K. Retail banking in the Czech Republic—A comparison of consumer prices between 2011 and 2014. Int. J. Econ. Sci. 2016, V, 42–54. [Google Scholar] [CrossRef]
  30. Nkoro, E.; Uko, A.K. Foreign Direct Investment and Inclusive Growth: The Role of the Financial Sector Development. Int. J. Econ. Sci. 2022, XI, 144–162. [Google Scholar] [CrossRef]
  31. Liao, G.; Yao, D.; Hu, Z. The spatial effect of the efficiency of regional financial resource allocation from the perspective of internet finance: Evidence from Chinese provinces. Emerg. Mark. Financ. Trade 2020, 56, 1211–1223. [Google Scholar] [CrossRef]
  32. Färe, R.; Grosskopf, S.; Lovell, C. Production Frontiers; Cambridge University Press: Cambridge, UK, 1994. [Google Scholar]
  33. Martinus, K.; Suzuki, J.; Bossaghzadeh, S. Agglomeration Economies, Interregional Commuting and Innovation in the Peripheries. Reg. Stud. 2020, 54, 776–788. [Google Scholar] [CrossRef]
  34. Huang, D.; Chen, G. Can the Carbon Emissions Trading System Improve the Green Total Factor Productivity of the Pilot Cities?—A Spatial Difference-in-Differences Econometric Analysis in China. Int. J. Environ. Res. Public Health 2022, 19, 1209. [Google Scholar] [CrossRef] [PubMed]
  35. Yang, H.; Li, L.; Liu, Y. The effect of manufacturing intelligence on green innovation performance in China. Technol. Forecast. Soc. Chang. 2022, 178, 121569. [Google Scholar] [CrossRef]
  36. Krugman, P. Increasing Returns and Economic Geography. J. Political Econ. 1991, 99, 483–499. [Google Scholar] [CrossRef]
  37. Zheng, Y.; Cheng, Y.; Li, L. Factors affecting regional economic synergy in China–based on research on high-tech industry. IEEE Access 2019, 8, 14123–14133. [Google Scholar] [CrossRef]
  38. Zhang, J.; Wu, G.; Zhang, J. The estimation of China’s provincial capital stock: 1952–2000. Econ. Res. J. 2004, 10, 35–44. [Google Scholar]
  39. Shangguan, X.; Ge, B. Digital finance, environmental regulation and high-quality economic development. Mod. Financ. Econ. J. Tianjin Univ. Financ. Econ 2021, 41, 84–98. [Google Scholar]
  40. Zongyi, H.; Yi, L. Dual effects and threshold characteristics of financial development on environmental pollution. China Soft Sci. 2019, 7, 68–80. [Google Scholar]
  41. Qiu, B.; Yang, S.; Xin, P. Research on FDI technology spillover channels and China’s manufacturing productivity growth: An analysis based on panel data. World Econ. 2008, 8, 20–31. [Google Scholar]
  42. Sun, Z.; Gu, W.; Cheng, X. Research on the Interaction between Innovation Spillover and Regional Green All Factors—Based on DEA-ESDA Empirical Analysis. Sci. Technol. Manag. Res. 2022, 42, 62–69. [Google Scholar]
  43. Arellano, M.; Bover, O. Another Look at the Instrumental Variable Estimation of Error-Components Models. J. Econom. 1995, 68, 29–51. [Google Scholar] [CrossRef] [Green Version]
  44. Lesage, J.P.; Pace, R.K. Introduction to Spatial Econometrics; Chapman and Hall/CRC: Boca Raton, FL, USA, 2009. [Google Scholar]
  45. Zhang, C.; Wang, X.; Gu, Z. An Empirical Test of the Impact of Financial Agglomeration on High Quality Economic Development—Based on Provincial Panel Data from 2005 to 2019. Ind. Technol. Econ. 2021, 40, 99–109. [Google Scholar]
Figure 1. Comprehensive development level of FAGG in China by province. (Figure 1 is drawn by the author).
Sustainability 15 00965 g001
Table 1. Descriptive statistics of variables.
VariablesSampleSizeMeanMinMax
GTFP5101.02180.03360.93001.2380
GTC5101.04770.06160.74701.6130
GEC5100.97820.05990.62601.3670
FAGG5100.96780.54220.40894.9602
GS5100.31840.18760.08491.0650
ECO5100.53370.52980.00002.5853
LNHM5102.15950.11511.79852.5401
INV5100.71910.30460.18471.9014
URBAN5100.52460.14410.24770.8960
LNS5108.95271.03355.894811.0556
IS5101.15720.62540.52715.2340
LNINOV5109.17671.68714.317513.1757
Table 2. Growth rate of GTFP and its decomposition term.
YearFull SampleEastMiddleWest
GTFPGTCGECGTFPGTCGECGTFPGTCGECGTFPGTCGEC
20031.0281.0470.9861.0271.0320.9951.0191.0970.9391.0361.0261.012
20041.0311.0640.9711.0421.0870.9621.0321.0420.9901.0201.0570.966
20051.0221.0350.9881.0291.0480.9831.0181.0240.9941.0171.0290.989
20061.0221.0500.9741.0371.0610.9781.0081.0400.9701.0191.0460.974
20071.0291.0730.9591.0431.0920.9571.0121.0520.9621.0261.0690.960
20081.0171.0210.9961.0251.0231.0011.0031.0200.9831.0181.0181.001
20090.9981.0340.9661.0171.0360.9820.9781.0310.9490.9941.0330.962
20101.0101.0530.9621.0321.0480.9850.9931.0790.9281.0011.0400.963
20111.0111.0690.9511.0211.0840.9571.0111.0630.9511.0021.0590.946
20121.0081.0510.9621.0181.0530.9731.0041.0490.9571.0001.0490.953
20131.0251.0081.0181.0341.0181.0161.0271.0061.0211.0150.9991.016
20141.0051.0700.9421.0231.0930.9431.0011.0580.9460.9891.0540.938
20151.0151.0300.9871.0261.0201.0121.0121.0350.9771.0051.0360.970
20161.0321.0350.9981.0381.0420.9961.0291.0241.0051.0281.0350.994
20171.0211.0460.9821.0241.0440.9981.0431.0480.9951.0011.0460.957
20181.0461.1060.9531.0451.1560.9201.0551.0880.9721.0391.0680.973
20191.0541.0221.0351.0501.0051.0521.0921.0231.0701.0301.0380.993
Mean1.0221.0480.9781.0311.0550.9831.0201.0460.9771.0141.0410.974
Table 3. Classification of FAGG areas.
TypeProvince
Star type areaBeijing, Shanghai, Chongqing, Zhejiang
Comparative advantage type areasTianjin, Ningxia, Guangdong
Mediocre areasShanxi, Liaoning, Jilin, Jiangsu, Anhui, Fujian, Guangxi, Hainan, Sichuan, Guizhou, Yunnan, Shaanxi, Gansu, Qinghai, Xinjiang
Backward-looking areasHebei, Nei menggu, Heilongjiang, Jiangxi, Shandong, Henan, Hubei, Hunan
Table 4. Spatial auto correlation test.
GTFP
Moran’s I0.274
Moran’s I Statistic7.707
Marginal Probability0.000
Table 5. Robust LM test.
Spatial Lag ModelSpatial Error Model
LM Test31.642 ***26.442 ***
Robust LM Test5.557 ***0.357
Note: * is used to describe significance, *** denotes p ≤ 0.01, ** denotes 0.01 < p ≤ 0.05, * denotes 0.05 < p ≤0.1; Other tables are the same as this table.
Table 6. Benchmark regression.
Explanatory Variable(1)(2)(3)
GTFPGTCGEC
GTFPit-10.0704***(7.40)
WGTFP0.583***(42.59)
FAGG0.0761***(8.12)0.0323***(2.89)0.0291***(6.01)
GTC it-1 0.0243***(3.81)
WGTC 0.0671**(2.72)
GEC it-1 0.0412*(1.81)
WGEC 0.0559***(3.06)
Control variablescontrolControlControl
regionYesYesYes
timeYesYesYes
AR(1)
(p-value)
0.0030.0420.009
AR(2)
(p-value)
0.3080.7480.932
Hansen
(p-value)
0.3820.3510.292
N480480480
Note: t value in brackets. Other tables are the same as this table.
Table 7. Measurement of spatial spillover effects.
Explanatory VariablesShort-Term
Direct Effects
Short-Term Indirect
Effects
Long-Term Direct EffectsLong-Term Indirect
Effects
FAGG0.00798**(2.22)0.000528(0.93)0.00806**(2.22)0.00181*(1.74)
Control variablescontrolControlControlControl
regionYesYesYesYes
timeYesYesYesYes
N480480480480
Table 8. Test of nonlinear relationship.
Explanatory Variable(1)(2)(3)
GTFPGTCGEC
GTFP it-10.123***(6.58)
WGTFP0.512***(18.48)
FAGG0.276***(8.70)0.224***(3.93)0.233**(2.65)
FAGG2−0.127***(−7.48)−0.0650***(−3.64)−0.0593**(−2.67)
GTC IT-1 0.0719**(2.54)
WGTC 0.115**(2.52)
GEC it-1 0.166***(4.62)
WGEC −0.221(−1.50)
Control variablecontrolcontrolcontrol
regionYESYESYES
timeYESYESYES
AR(1)
(p-value)
0.0410.0400.012
AR(2)
(p-value)
0.1070.5160.544
Hansen
(p-value)
0.4760.9530.902
N480480480
Table 9. Robustness test of weight matrices in different spaces.
Explanatory Variable(1)(2)(3)
0–1EconomicsGeography
GTFP it-10.622***(7.96)0.409***(6.26)0.178***(26.66)
WGTFP0.0126***(5.19)0.587***(13.49)0.578***(47.16)
FAGG0.0452***(4.83)0.0295***(5.22)0.0293***(5.34)
Control variablecontrolcontrolcontrol
regionYESYESYES
timeYESYESYES
AR(1)
(p-value)
0.0000.0050.003
AR(2)
(p-value)
0.1490.1070.199
Hansen
(p-value)
0.2140.1940.365
N480480480
Table 10. Quantile test.
Explanatory
Variable
(1)(2)(3)(4)(5)
GTFPGTFPGTFPGTFPGTFP
10%25%50%75%90%
FAGG−0.000648
(−0.12)
0.00945***
(2.93)
0.00745**
(2.26)
0.00794**
(2.51)
0.0106*
(1.72)
Control variablecontrolcontrolcontrolcontrolcontrol
N510510510510510
Table 11. Mechanism inspection results.
Explanatory Variable(1)(2)(3)
LNSISLNINOV
FAGG0.205***(3.96)0.525***(11.94)0.899***(9.37)
Control variablecontrolcontrolcontrol
regionYesYesYes
timeYesYesYes
N510510510
Note: Columns (1)–(3) are ols estimates.
Disclaimer/Publisher’s Note: The statements, opinions and data contained in all publications are solely those of the individual author(s) and contributor(s) and not of MDPI and/or the editor(s). MDPI and/or the editor(s) disclaim responsibility for any injury to people or property resulting from any ideas, methods, instructions or products referred to in the content.

