Article

Quantitative Investigation of Fracture Apertures during Temporary Plugging and Diverting Fracturing

1
School of Petroleum Engineering, China University of Petroleum (East China), Qingdao 266580, China
2
CPOE Research Institute of Engineering Technology, Tianjin 300451, China
3
Petroleum Institute, University of Petroleum-Beijing at Karamay, Beijing 102249, China
*
Author to whom correspondence should be addressed.
Sustainability 2023, 15(20), 14664; https://doi.org/10.3390/su152014664
Submission received: 1 September 2023 / Revised: 6 October 2023 / Accepted: 6 October 2023 / Published: 10 October 2023
(This article belongs to the Special Issue Numerical Analysis of Rock Mechanics and Crack Propagation)

Abstract

:
Oil and gas resources are closely related to daily life and are an important support for the economy of a city or even a country. Hydraulic fracturing is an indispensable technique to economically develop oil and gas resources through creating complex fractures. Temporary plugging and diverting fracturing (TPDF) can generate diversion fractures perpendicular to the initial fractures and enhance the stimulated area. The aperture of the diversion fractures determines its conductivity and the oil/gas production. However, it is difficult to evaluate the aperture of the diversion fracture due to the complex physical process of hydraulic fracturing. This work established a fluid–solid fully coupled simulation model to investigate the fracture aperture influenced by various factors during TPDF. The model can simulate the propagation of the initial fracture and the diversion fracture. Various factors include the tight plug’s permeability, the tight plug’s length, Young’s modulus, rock tensile strength, in situ stress contrast, the leak-off coefficient of the fracture surface, and fluid injection rate. The results show that the aperture of the previous fracture can be enlarged, and the aperture of the diversion fracture can be decreased by the tight plug. The aperture at the diversion fracture mouth is much smaller than that along the diversion fracture. Reservoirs with low Young’s modulus values and high rock tensile strength can generate the diversion fracture with a wider aperture. Moreover, increasing the fluid injection rate can effectively increase the fracture mouth aperture. In this way, the risk of screenout can be lowered. This work is beneficial for the design of the TPDF and ensures safe construction.

1. Introduction

Unconventional oil and gas resources are the main part of the world’s energy supply [1]. Unconventional reservoirs are characterized by low permeability and low porosity. There is no natural production due to the low flow rate [2]. Hydraulic fracturing can efficiently promote the oil/gas flow into the wellbore by creating fractures within the reservoirs [3]. However, hydraulic fracture propagation tends to follow the direction of less resistance, and it is difficult to create complex fracture networks. Temporary plugging and diverting fracturing (TPDF) can plug the initial fracture (IF) paths by injecting self-degradable diverters. In this way, the injection pressure can be enhanced, and diversion fractures (DFs) can be created along other paths. The reservoirs can be fully stimulated, and high well production can be obtained. After generating a complex fracture network, the diverters can degrade and flow out to the ground [4]. The degradation rate of the diverters is sensitive to the reservoir fluid and the reservoir temperature. Experts can select suitable diverters for a given reservoir through laboratory tests and control the degradation time of the diverters. Therefore, TPDF is an efficient technique to develop unconventional oil and gas resources economically. During TPDF, the IFs can induce additional stresses, and the apertures of the DFs are highly influenced by the existence of IFs [5]. The fracture aperture determines the effect of the proppant transportation and the conductivity of the propped fractures. Therefore, a quantitative investigation of the fracture aperture is of great value to optimize the design of TPDF technology.
Various models have been established to calculate fracture apertures. Sneddon and Elliott established the model for calculating the aperture of a Griffith fracture under internal pressure [6]. This model considers the stress distribution within an infinite two-dimensional (2D) elastic medium. Penkins et al. reported that the fracture aperture is essentially controlled by fluid pressure drop within the fracture. Fractures with wide apertures can be generated by the high injection rate and viscous fluids. They derived the equations that permit the estimation of fracture apertures for a variety of flow conditions and both for vertical and horizontal fractures [7]. Palmer and Carroll proposed three-dimensional (3D) fracture propagation models to investigate the effect of stress on fracture aperture. The model provides an upper or safe limit for pumping parameters to ensure the transport of the proppant [8]. Morales described a pseudo-3D fracture model that solves the coupled fluid flow and elastic rock deformation during fracture propagation. The fracture aperture was obtained from a plane–strain elasticity solution. The state of proppant transportation was tracked during the treatment [9]. Todd et al. estimated the fracture aperture for arbitrary pressure distribution in porous media. They pointed out that the fluid leak-off, the fluid flow in porous media, and the pressure response should be considered [10]. Guo et al. investigated the aperture of two fractures symmetrically located at the edge of a wellbore subjected to a uniform wellbore pressure. Detailed fracture aperture profiles for various in situ stresses and fracture lengths were obtained. The closed-form solution for the fracture mouth aperture was derived based on dimensional analysis and the superposition principle [11]. To predict the distribution of fractures and the re-initiation pressure of fractures, Shahri et al. provided a semi-analytical workflow considering the near-wellbore stress perturbations, far-field stress anisotropy, and wellbore inclination [12]. Zhang et al. developed a semi-analytical solution for line fracture. The solution is simple to implement and was verified against the finite element calculation [13]. Liu et al. proposed an inversion algorithm. The strains and fracture widths are related through a Green function constructed by the 3D displacement discontinuity method [14]. Xu et al. developed the dynamic fracture aperture prediction model based on the non-Newtonian fluid loss theory. The model was validated by field data. Parametrical analysis was conducted and the effects of flow pattern index, pressure difference, and consistency coefficient on the dynamic fracture aperture were investigated [15]. Therefore, the proposed models can calculate the aperture of a single fracture. However, they cannot consider the fluid–solid coupling effect. Multiple fractures can be generated during TPDF; therefore, the proposed models are unsuitable.
The distribution of the fracture aperture has also been investigated through experimental and numerical methods. True tri-axil hydraulic fracturing experiments have been applied to investigate the fracture geometry, the fluid injection pressure, and the fracture aperture distribution. Zhang et al. proposed a novel experimental process to model the propagation of multiple fractures. Fracture geometry is characterized based on rock splitting and 3D reconstruction technology. The fracture aperture was compressed by the existence of previous fractures [16]. Wu et al. performed numerous triaxial hydraulic fracturing experiments to investigate HF propagation behavior and seven types of HF geometries were observed [17]. Shi et al. conducted a series of large-size HF physical experiments. They investigated hydraulic fracture propagation in block-distributed hydrate-bearing reservoirs. Multiple influencing factors were further analyzed [18]. Chang et al. conducted laboratory fracturing tests investigating hydraulic fracture initiation and propagation under different injection scenarios. They concluded that the cyclic injection method can reduce the breakdown pressure by 24%. Pulse fracturing creates the most complex fracture geometry [19]. Shi et al. performed true triaxial HF experiments on gravel rocks with acoustic monitoring. Their results show that the aperture of penetration fracture is the largest, while the diversion fracture exhibits the smallest width [20]. Wang et al. applied the 3D finite element method (FEM) to determine the fracture aperture influenced by the previous fractures along a vertical well. The effects of the previous fractures can be neglected due to the amount of induced vertical stress being too small [21]. Wu and Olson aim to promote the uniform development of simultaneous multiple-fracture propagation in horizontal wells based on the 3D boundary element method. Fractures can divert and compress each other. Screenout is more likely to occur at the mouth of the inner fractures [22]. Therefore, experimental and numerical methods can investigate multiple fracture propagation and aperture distribution. Fracture aperture is highly influenced by fluid injection rate, fluid viscosity, in situ stresses, and rock types. The influence of the initial fracture on the diversion fracture aperture during TPDF is still unclear.
In conclusion, the pattern of fracture apertures during hydraulic fracturing can be effectively investigated by the theoretical model, the experimental method, and the numerical method. However, the theoretical model can calculate the aperture of a single fracture, not multiple fractures. The size of the experimental samples is limited, and the effects of the boundary condition cannot be neglected. The reported numerical simulations have not considered the effects of the previous fractures perpendicular to the diversion fracture during TPDF. In this work, a 2D fluid–solid coupling model is established. The effects of seven factors on the apertures of the initial and diversion fractures are investigated. The plug model is proposed to simulate the effect of the tight plug, and the propping model is proposed the simulate the effect of the proppant. This work determines the dominant factors that determine the fracture aperture. Moreover, measurements are proposed to lower the risk of screenout.

2. Mathematical Equations

The simulation of hydraulic fracturing is a complex problem because multiple physical processes should be considered, including rock deformation, fracture initiation, fracture propagation, fluid flow within porous media, and fracture flow within the fracture. The controlling equations are referred to by Wang et al. [23]. Moreover, the reliability of the FEM in simulating hydraulic fracturing has been verified by several researchers [24,25,26,27,28].

2.1. Rock Deformation

The rock equilibrium equation can be described by the following equation [23]:
V ( σ ¯ p w I ) δ ε d V = S t δ v d S + V f δ v d V
where t is the surface traction vector per unit area, N/m2; f is the body force vector per unit volume, N/m3; I is the identity matrix, dimensionless; δε is the matrix of virtual strain rate, s−1; δv is the matrix of virtual velocity, m/s; and σ ¯ is the matrix of effective stress, Pa.

2.2. Fluid Flow in Porous Media

The fluid continuity equation within the porous rock can be described as follows:
1 J t ( J ρ w n w ) + x ( ρ w n w v w ) = 0
where J is the volume change ratio of porous media, dimensionless; ρw is the fluid density, kg/m3; nw is the porosity ratio, dimensionless; vw is the seepage velocity of the fluid, m/s; and x is space vector, m.

2.3. Fluid Flow within Fractures

The tangential flow rate qf within hydro-fractures is as follows [23]:
q f = w 3 12 μ p f
where qf is the average fluid velocity, m3/s; w is the fracture width, m; μ is the fluid viscosity, cp; and pf is the fluid pressure within the fracture, Pa.
The fluid continuity equation within the fracture is as follows [23]:
q f w t + q b + q t = 0
where qb and qt are the normal flow velocities at the bottom and top fracture surfaces, respectively, m/s.

2.4. Fracture Initiation Law

The quadratic fracture initiation law is applied to determine the time when the fracture element begins to degrade [23]:
{ t n t n 0 } 2 + { t s t s 0 } 2 + { t t t t 0 } 2 = 1
where t n , t s , t t are the real stresses in the three directions and t n 0 , t s 0 , t t 0 are the corresponding tensile and shear strengths.

2.5. Fracture Propagation Law

The Benzeggagh–Kenane fracture criterion is applied to simulate the fracture propagation state:
G e q u i v C = G I C + ( G I I C G I C ) ( G I I C + G I I I C G I C + G I I C + G I I I C )
where GequivC, GIC, GIIC, and GIIIC are the computed equivalent fracture energy release rate, the tension failure fracture energy release rates, the shear failure under sliding fracture energy release rates, and the shear failure under tearing fracture energy release rate, respectively.

3. Model Establishment and Simulation Methods

3.1. Model Establishment

The more complex the hydraulic fracture, the higher the well production. During TPDF, the initial fracture propagates along the direction of the least resistance (i.e., the direction of the maximum horizontal stress). The self-degradable diverters can effectively plug the initial fracture mouth and enhance the fluid pressure. Then, the subsequent fluid will divert into the diversion fracture and generate a fracture perpendicular to the initial fracture (as shown in Figure 1a). After that, the diverter will degrade and dissolve within the fracturing fluid and flow out on the ground. In this way, the target formation can be fully treated, generating a high oil/gas production rate.
In this work, the finite element based on the cohesive zone model (FEM-based CZM) was applied to establish the simulation model [23]. As shown in Figure 1b, the whole model has 54,000 elements. The red transverse line represents the propagation path of the initial fracture, and the red vertical line represents the propagation path of the diversion fracture. The circular model has a diameter of 60 m and there is a circle wellbore with a diameter of 0.2 m. The central region has fine elements with a size of 0.25, while the boundary region has coarse elements with a size of 3. It can guarantee both the accuracy and the calculation speed. Two sets of initial cracks were pre-set at the wellbore, and the fluid flows into the initial and the diversion fractures smoothly. The whole simulation process includes four steps: balancing the pore pressure and the stress conditions, propagating the initial fracture, plugging and propping the initial fracture, and propagating the diversion fracture. The boundary elements are fixed normal displacement to eliminate rigid body displacement.

3.2. The Propping Effect of the Proppant

The initial fracture is propped after the injection of a large amount of proppant. The propped fracture induces extra stress that compresses the diversion fracture aperture. In this work, a truss model is proposed to simulate the propping effect of the proppant. As shown in Figure 2a, the truss model comprises a series of truss elements. The truss model can avoid the closure of the initial fracture but cannot prevent the initial fracture from opening. During the simulation process, the initial fracture first propagates forward. Then, the initial fracture is plugged, and the truss model is activated to prop the initial fracture. At last, the diversion fracture begins to propagate under the influence of the propped initial fracture.

3.3. The Plugging Effect of the Tight Plug

During TPDF, self-degradable diverters are injected to plug the initial fractures. A tight plug can be formed within the initial fractures. To simulate the plugging effect of the tight plug, this work assumes that when there is no tight plug, fluid flow accords with Reynold’s equation, and when there is a tight plug, fluid flow accords with Darcy’s equation. It defines the diffusive term from Darcy’s equation as equal to the conductivity term in Reynold’s equation:
w 3 12 μ f = k A μ filtrate
where a is the tight plug area; μf is the hypothesized fluid viscosity within the initial fracture; μfiltrate is the fluid viscosity when flowing through the tight plug; and k is the permeability of the tight plug. Equation (7) can be deformed to:
μ f = w 3 μ filtrate 12 k A
The plugging effect of the tight plug can be effectively considered by adjusting the hypothesized fluid viscosity of μf. As shown in Figure 2b, the initial fracture is plugged, and the fluid pressure cannot transfer to the fracture tip. Then, it stops propagating, and the diversion fracture propagates forward.

3.4. Model Input Parameters

Table 1 shows the input parameters corresponding to the reservoir of the Chenghai oilfield, east of China. The vertical depth is about 3700 m with a pore pressure of 37 MPa. The closure pressure is 55 MPa and the reservoir temperature is 147 °C. The reservoir has a porosity of 9.82% and a permeability of 9.83 mD. Hydraulic fracturing is necessary to develop the oil resources economically.

4. Simulation Results

Based on the established model in Figure 1, this work investigates the effects of various factors on the aperture of the initial and diversion fractures. The seven factors include the permeability of the tight plug, the length of the tight plug, Young’s modulus, rock tensile strength, in situ stress, the leak-off coefficient of the fracture surface, and the fluid injection rate.

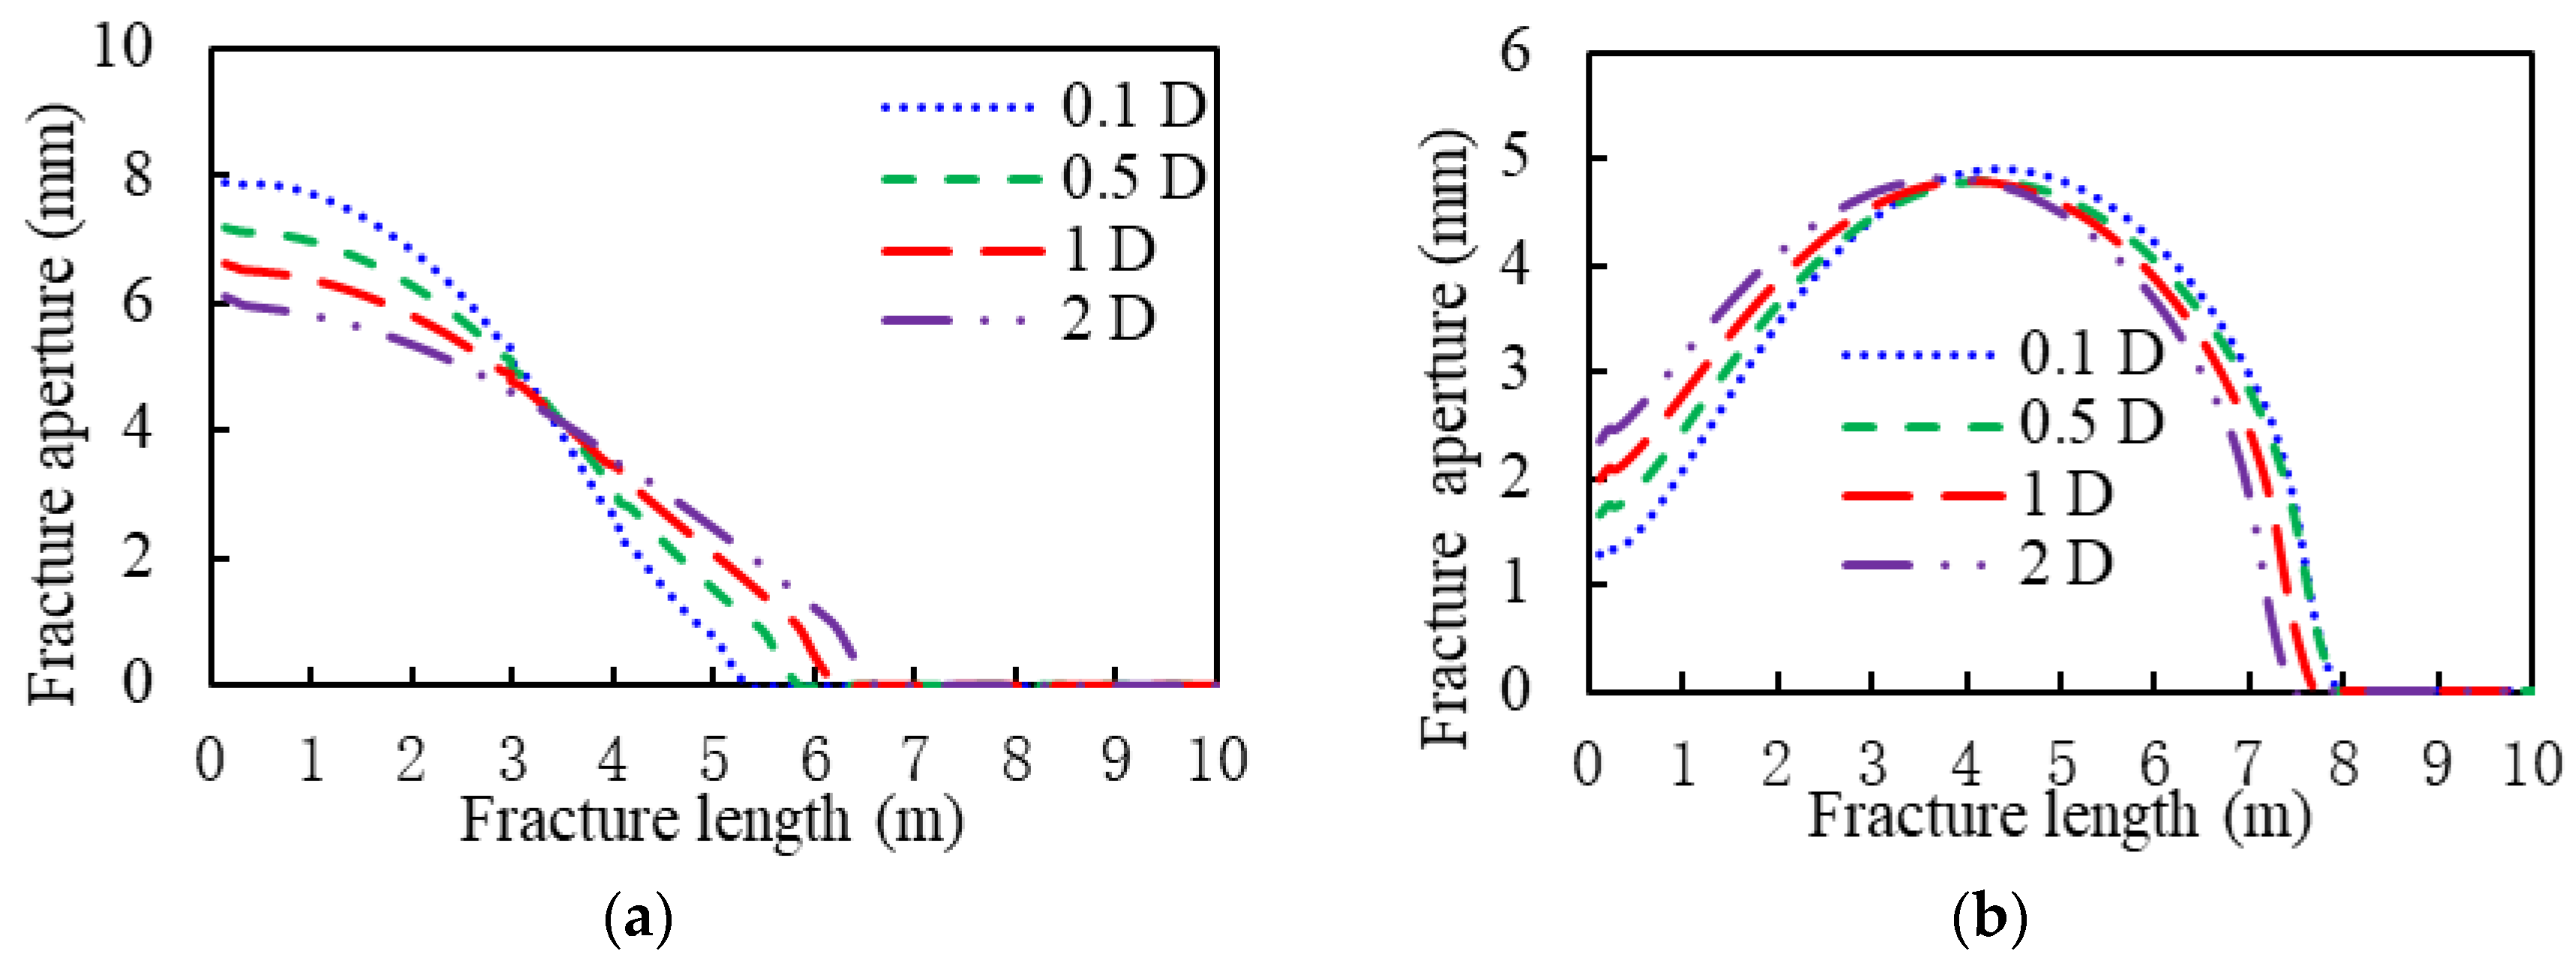
4.1. The Permeability of the Tight Plug

The permeability of the tight plug highly influences the transmission capability of the fluid pressure within the hydraulic fracture. In this part, the permeabilities of the tight plugs were set as 0.1 D, 0.5 D, 1 D, and 2 D, respectively. The other parameters are listed in Table 1. Figure 3 shows the aperture curves of the initial and the diversion fractures. It shows that the aperture at the initial fracture mouth increases with the permeability of the tight plug, and the length decreases with the permeability of the tight plug. The apertures of the initial fractures are, respectively, 7.90 mm, 7.19 mm, 6.63 mm, and 6.10 mm, and the apertures of the diversion fractures are, respectively, 1.28 mm, 1.65 mm, 1.99 mm, and 2.35 mm. The reason for these results is that the transmission efficiency of the fluid pressure increases with the permeability of the tight plug. Then, the initial fracture can be effectively plugged with a low permeability of the tight plug. It increases the fluid pressure, the aperture of the initial fracture, and the circular stresses around the wellbore. In this way, the diversion fracture is compressed and thus the aperture of the diversion fracture decreases.

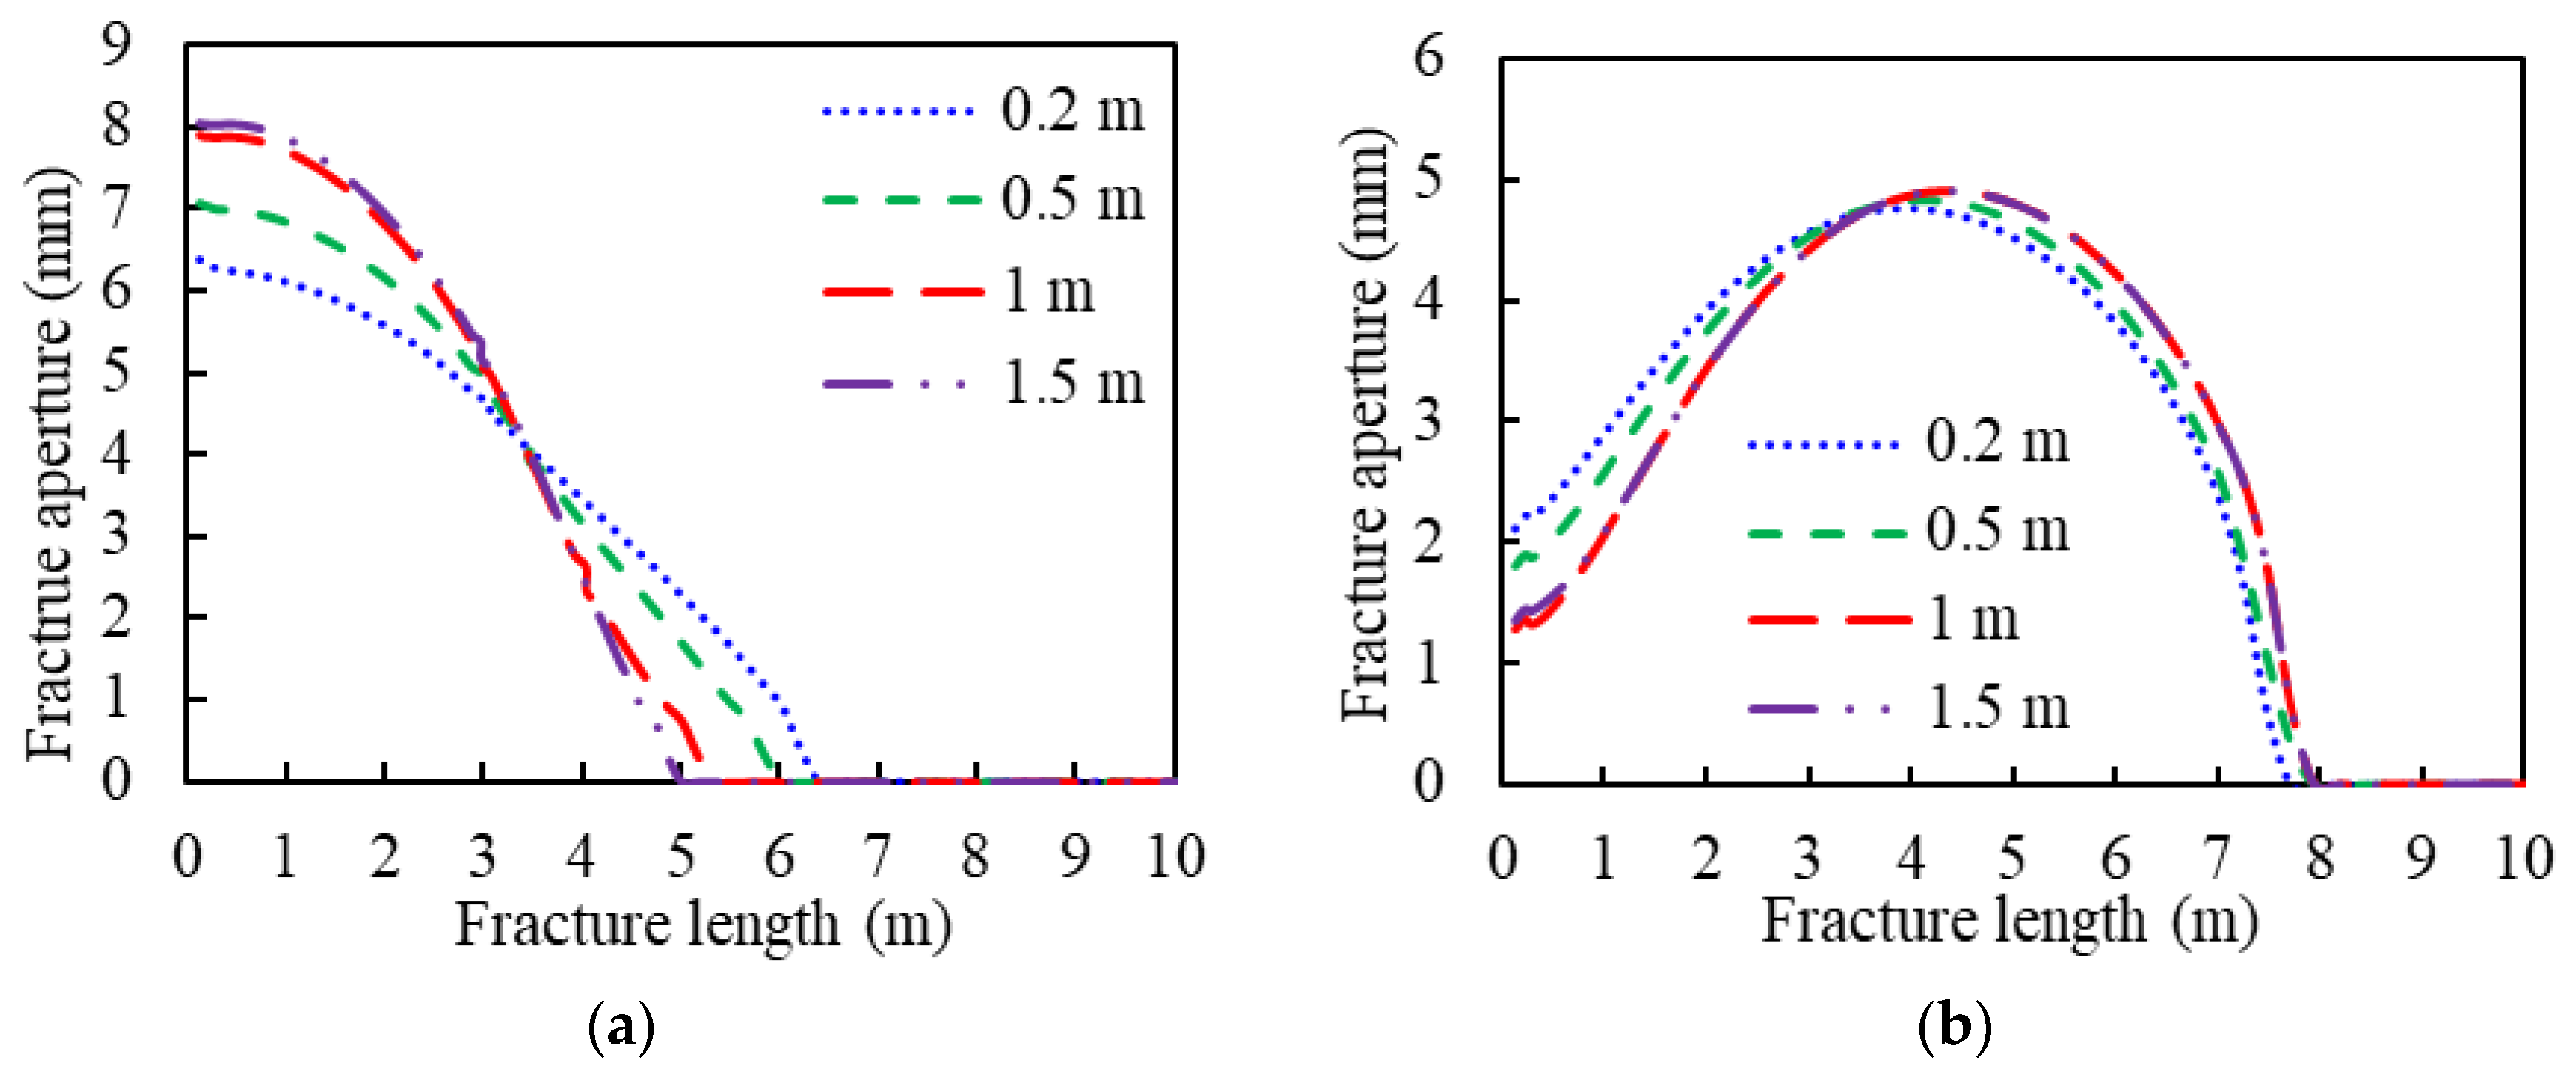
4.2. The Length of the Tight Plug

The dosage of the diverter determines the length of the tight plug. The plugging effect can be enhanced by increasing the length of the tight plug. In this part, the lengths of the tight plugs are set as 0.2 m, 0.5 m, 1 m, and 1.5 m, respectively. The other parameters are listed in Table 1. Figure 4 shows the aperture curves of the initial and the diversion fractures. It shows that the aperture at the initial fracture mouth increases with the length of the tight plug, and the fracture length decreases with the length of the tight plug. The apertures of the initial fractures are, respectively, 6.40 mm, 7.07 mm, 7.90 mm, and 8.05 mm, and the apertures of the diversion fractures are, respectively, 2.12 mm, 1.81 mm, 1.28 mm, and 1.35 mm. The reason for these results is that the fluid pressure cannot pass through the tight plug of a large length. The fluid pressure within the fracture and the fracture mouth aperture are enlarged, which compresses the diversion fracture.

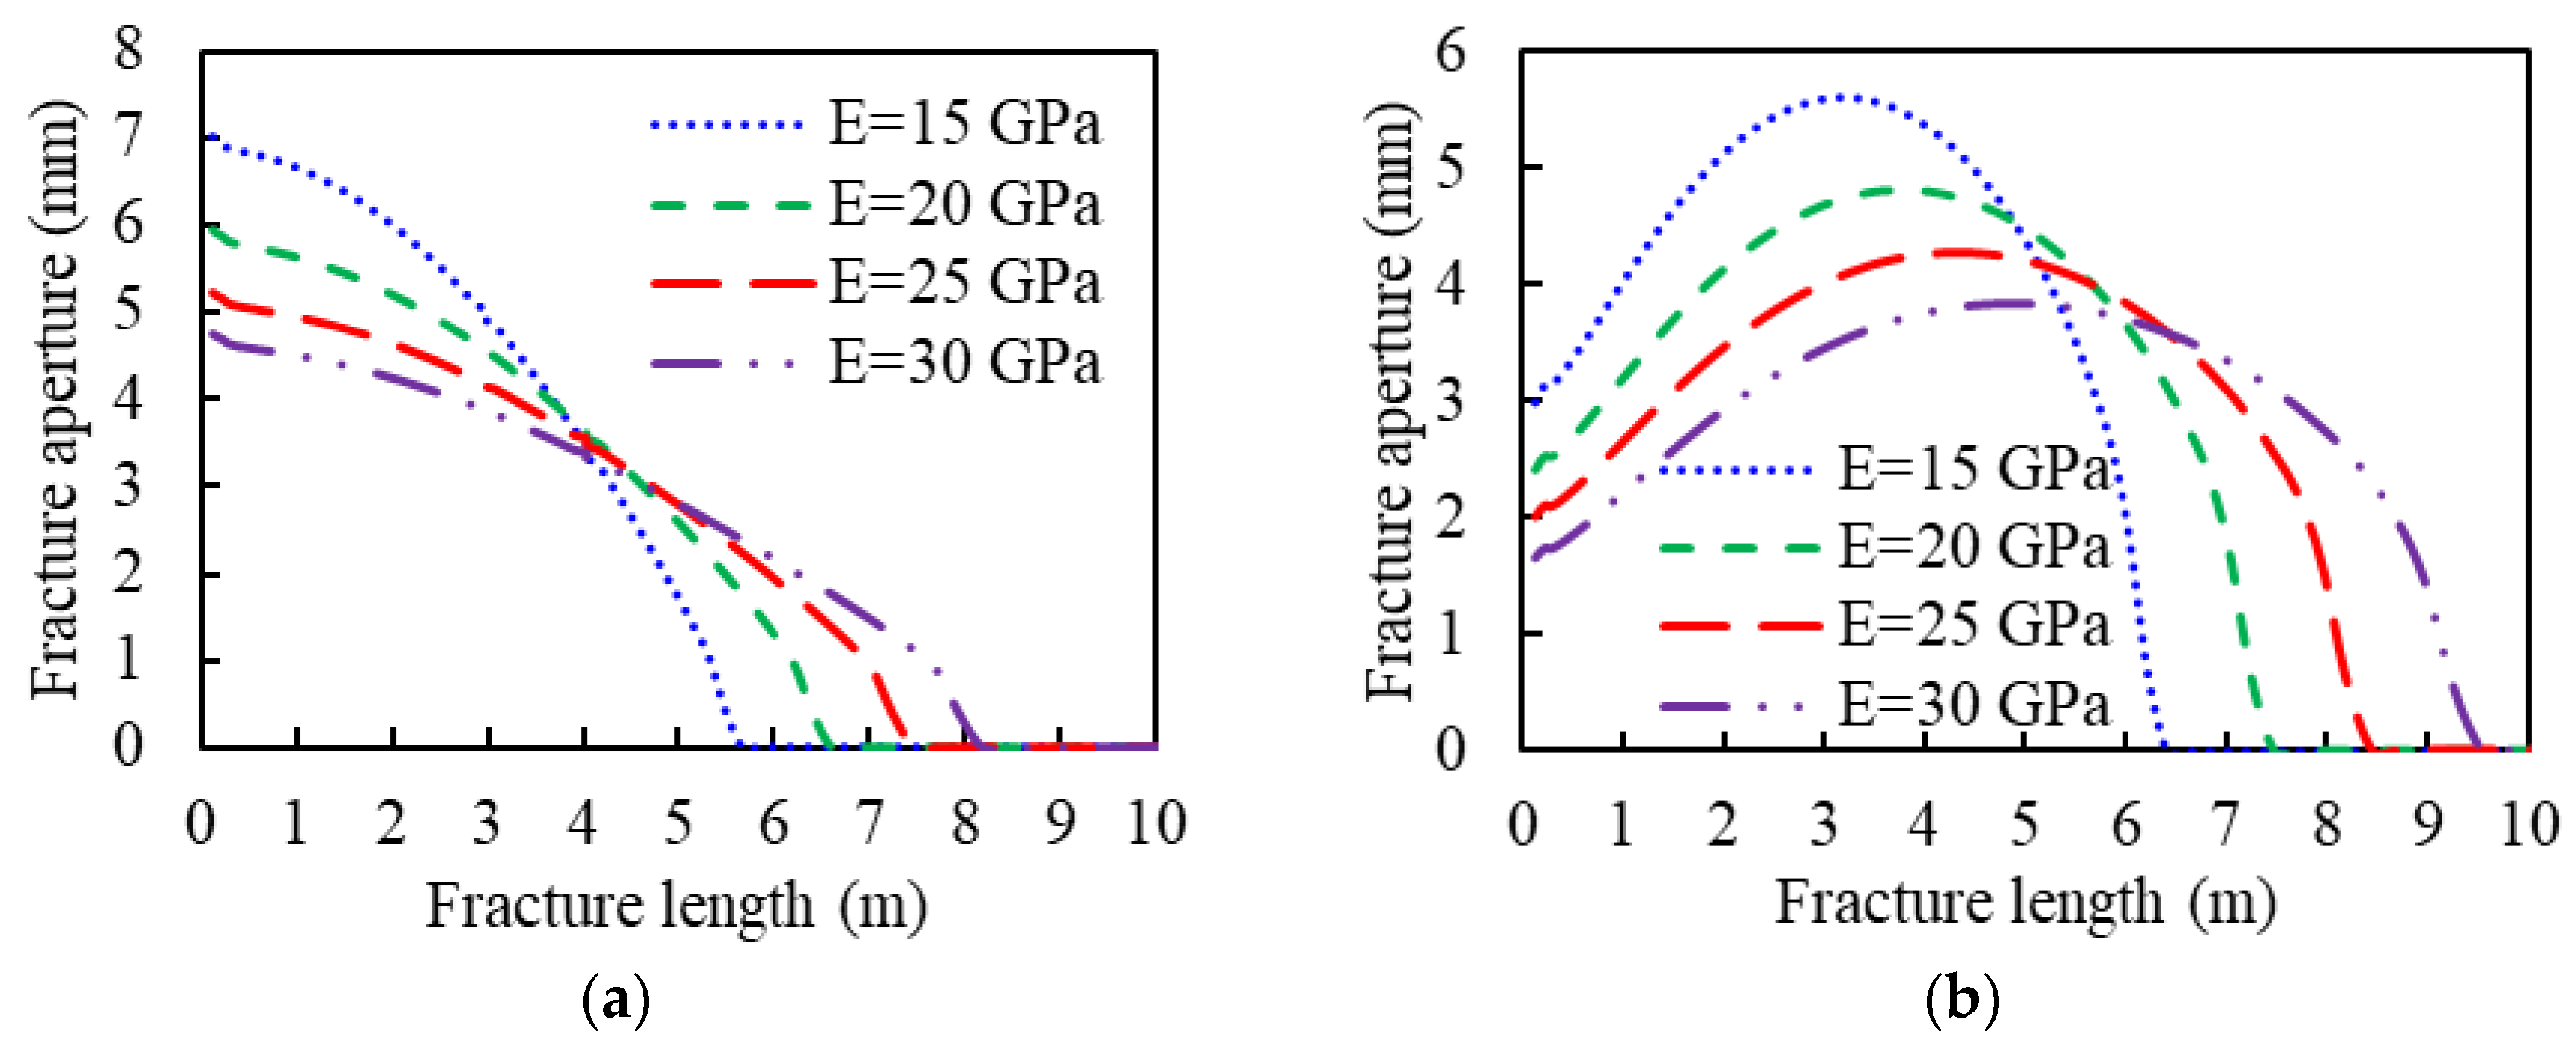
4.3. Young’s Modulus

Young’s modulus determines the rock’s capability of resisting deformation. Reservoirs with high Young’s modulus values will generate fractures with low apertures. In this part, the rock Young’s modulus is set as 15 GPa, 20 GPa, 25 GPa, and 30 GPa, respectively. The other parameters are listed in Table 1. Figure 5 shows the aperture curves of the initial and the diversion fractures. The figure shows that the apertures at the initial and the diversion fracture mouth decrease with the Young’s modulus values, and the lengths of the initial and the diversion fractures increase based on the principle of fluid volume conservation. The apertures of the initial fractures are, respectively, 7.02 mm, 5.95 mm, 5.23 mm, and 4.74 mm, and the apertures of the diversion fractures are, respectively, 2.99 mm, 2.41 mm, 2.00 mm, and 1.65 mm. The reason for these results is that the Young’s modulus dominates the fracture aperture, and the tight plug’s plugging effect further increases the initial fracture’s aperture and decreases the diversion fracture’s aperture.

4.4. Rock Tensile Strength

Rock tensile strength determines the difficulty in creating fractures and highly influences fluid pressure. In this part, the rock tensile strength is set as 2 MPa, 4 MPa, 6 MPa, and 8 MPa. The other parameters are listed in Table 1. Figure 6 shows the aperture curves of the initial and the diversion fractures. It shows that the apertures both at the initial and the diversion fracture mouth increase with rock tensile strength, and fracture length decreases with rock tensile strength based on the principle of fluid volume conservation. The apertures of the initial fractures are, respectively, 4.95 mm, 5.94 mm, 6.57 mm, and 7.50 mm, and the apertures of the diversion fractures are, respectively, 2.25 mm, 2.40 mm, 3.15 mm, and 4.23 mm. In the reservoir with a high rock tensile strength, high fluid pressure is necessary to create a new fracture element, and thus the fracture aperture increases. The tight plug enlarges the initial fracture’s aperture but decreases the diversion fracture’s aperture.

4.5. In Situ Stress Contrast

Hydraulic fracture tends to propagate along the direction of the minimum horizontal stress with high in situ stress contrast. In this part, the in situ stress contrasts are set as 3 MPa, 5 MPa, 7 MPa, and 9 MPa, while the minimum horizontal stress remains constant. The other parameters are listed in Table 1. Figure 7 shows the aperture curves of the initial and the diversion fractures. It shows that in situ stress contrast has a negligible effect on the apertures at the initial and the diversion fracture mouth. The apertures along the diversion fractures have an obvious gap under different stress contrasts. The reason for this effect is that the initial fractures propagate along the direction of the maximum horizontal stress, and the diversion fractures propagate along the direction of the minimum horizontal stress. The aperture of the initial fracture overcomes the minimum horizontal stress, and the aperture of the diversion fracture overcomes the maximum horizontal stress. The constant values of the minimum horizontal stress generate an equal value of the aperture along the initial fracture, and the different values generate the various apertures along the diversion fracture.

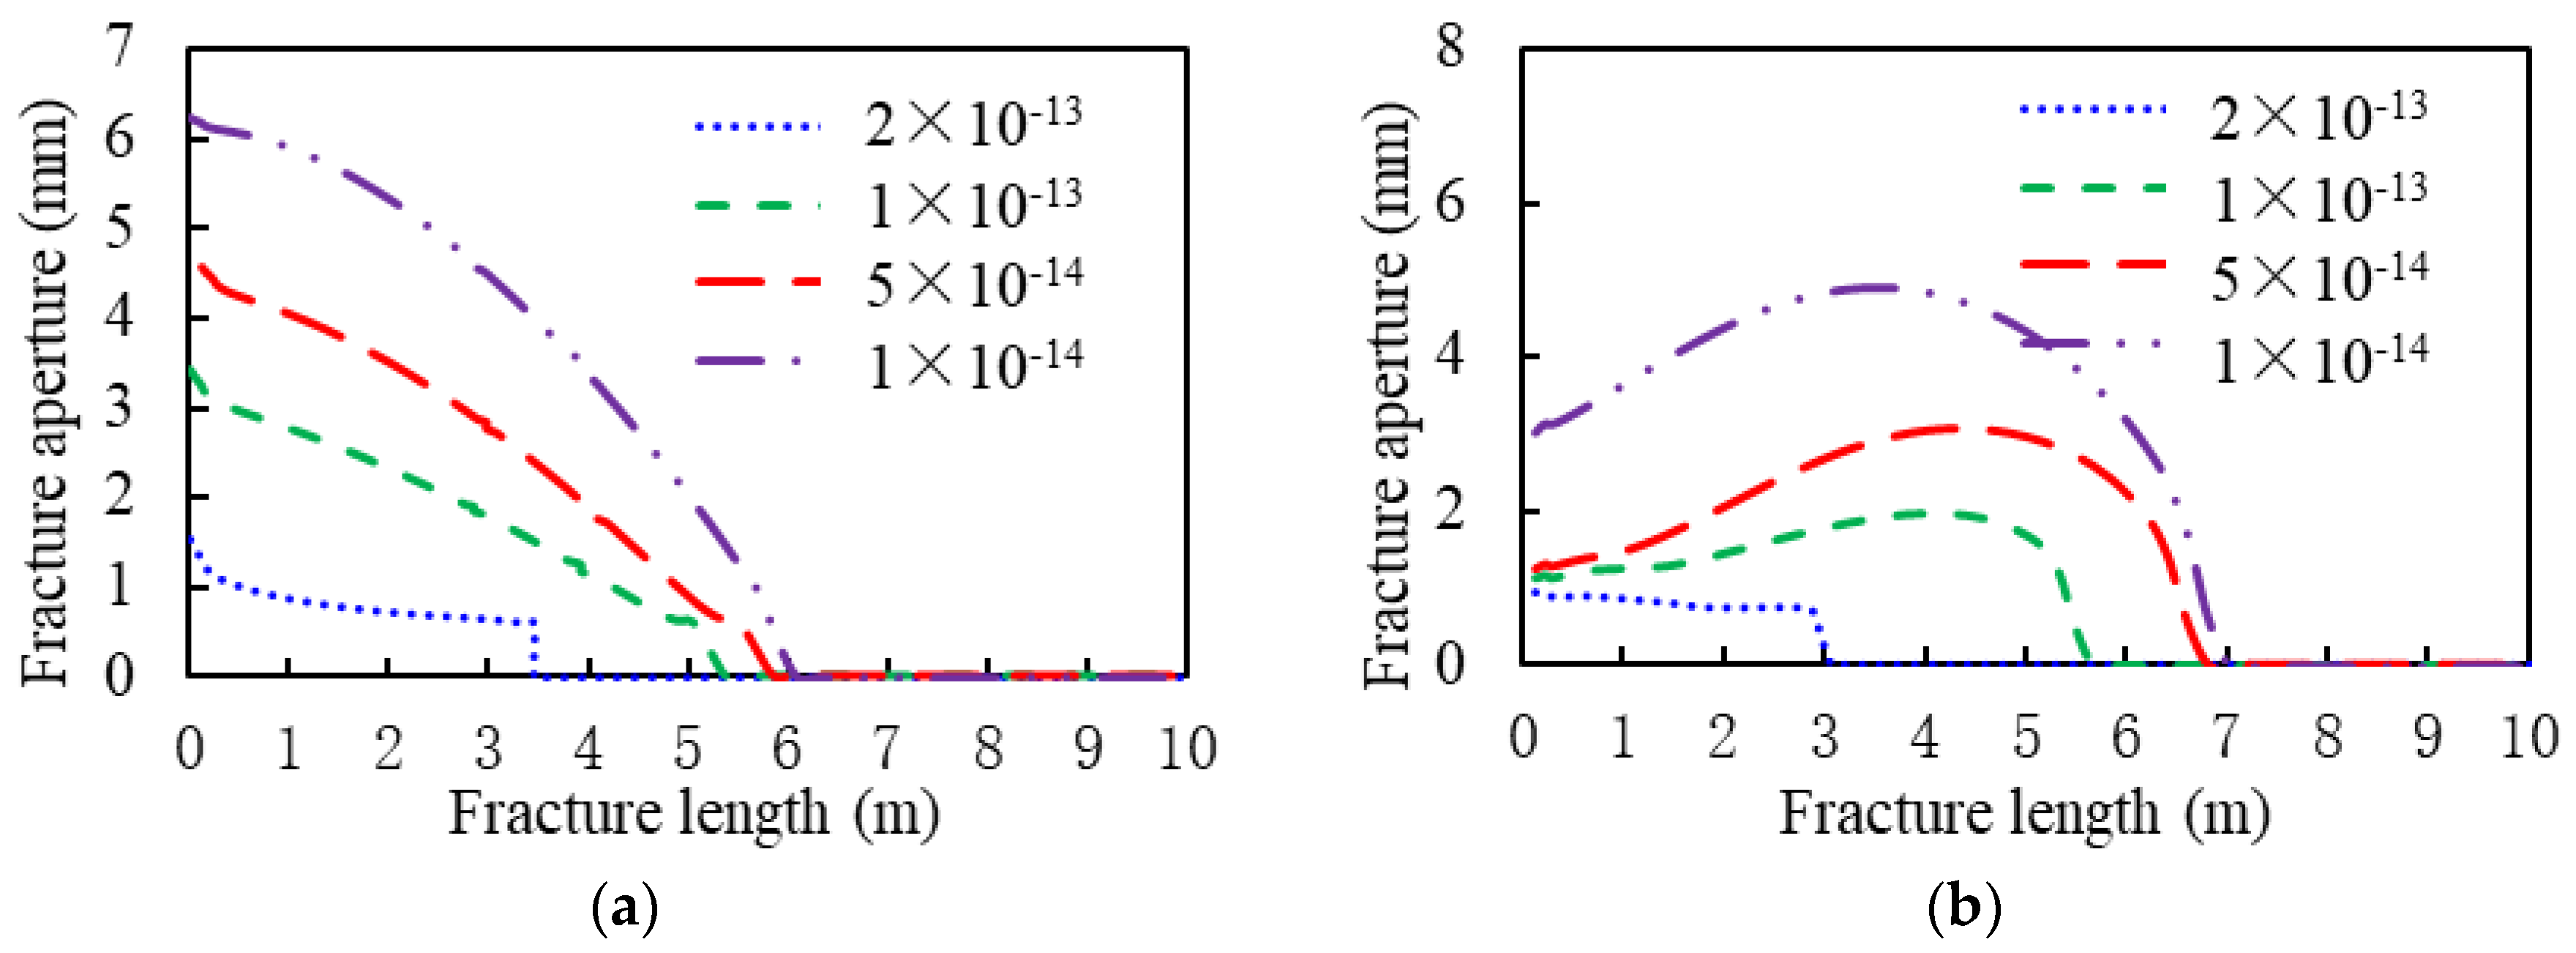
4.6. The Leak-Off Coefficient of the Fracture Surface

The leak-off coefficient of the fracture surface determines the fluid efficiency and the overall fracture volume. The value of the leak-off coefficient can be evaluated by testing the fluid viscosity, the fluid wall-building properties, and the reservoir porosity. In this part, the fluid leak-off coefficients are set as 2 × 10⁻¹³ m/s, 1 × 10⁻¹³ m/s, 5 × 10⁻¹⁴ m/s, and 1 × 10⁻¹⁴ m/s, respectively. The other parameters are listed in Table 1. Figure 8 shows the aperture curves of the initial and the diversion fractures. It shows that the aperture and the length of the two kinds of fractures decrease with the leak-off coefficient of the fracture surface. The apertures of the initial fractures are, respectively, 1.53 mm, 3.42 mm, 4.57 mm, and 6.23 mm, and the apertures of the diversion fractures are, respectively, 0.93 mm, 1.13 mm, 1.25 mm, and 3.03 mm. The reason for these results is that more fluid filters into the reservoir and less fluid is retained within the hydraulic fractures with a high leak-off coefficient. If the fluid pressure is low, narrow fractures are generated.

4.7. Fluid Injection Rate

The fluid injection rate is a key controllable parameter that determines the fracture propagation rate and geometry [29,30,31]. In this part, the fluid injection rates are set as 1 m3/min, 2 m3/min, 4 m3/min, and 6 m3/min, respectively. The other parameters are listed in Table 1. Figure 9 shows the aperture curves of the initial and the diversion fractures. It shows that the apertures of both the initial and the diversion fractures increase with the fluid injection rate. The apertures of the initial fractures are, respectively, 5.58 mm, 5.95 mm, 6.17 mm, and 6.28 mm, and the apertures of the diversion fractures are, respectively, 1.60 mm, 2.41 mm, 3.08 mm, and 3.47 mm. The fluid pressure can be enhanced by increasing the fluid injection rate and thus a high fracture aperture can be obtained. The fracture length remains nearly constant due to the plugging effect of the tight plug. When optimizing the fluid injection rate, the operation safety and the stimulation effect should be considered simultaneously. The injection pressure increases with the fluid injection rate, and the wellbore head has a safe pressure limit. The fracture complexity and aperture can be enlarged by increasing the fluid injection rate. Experts can optimize the fluid injection rate through geology and engineering integration methods.

5. Discussion

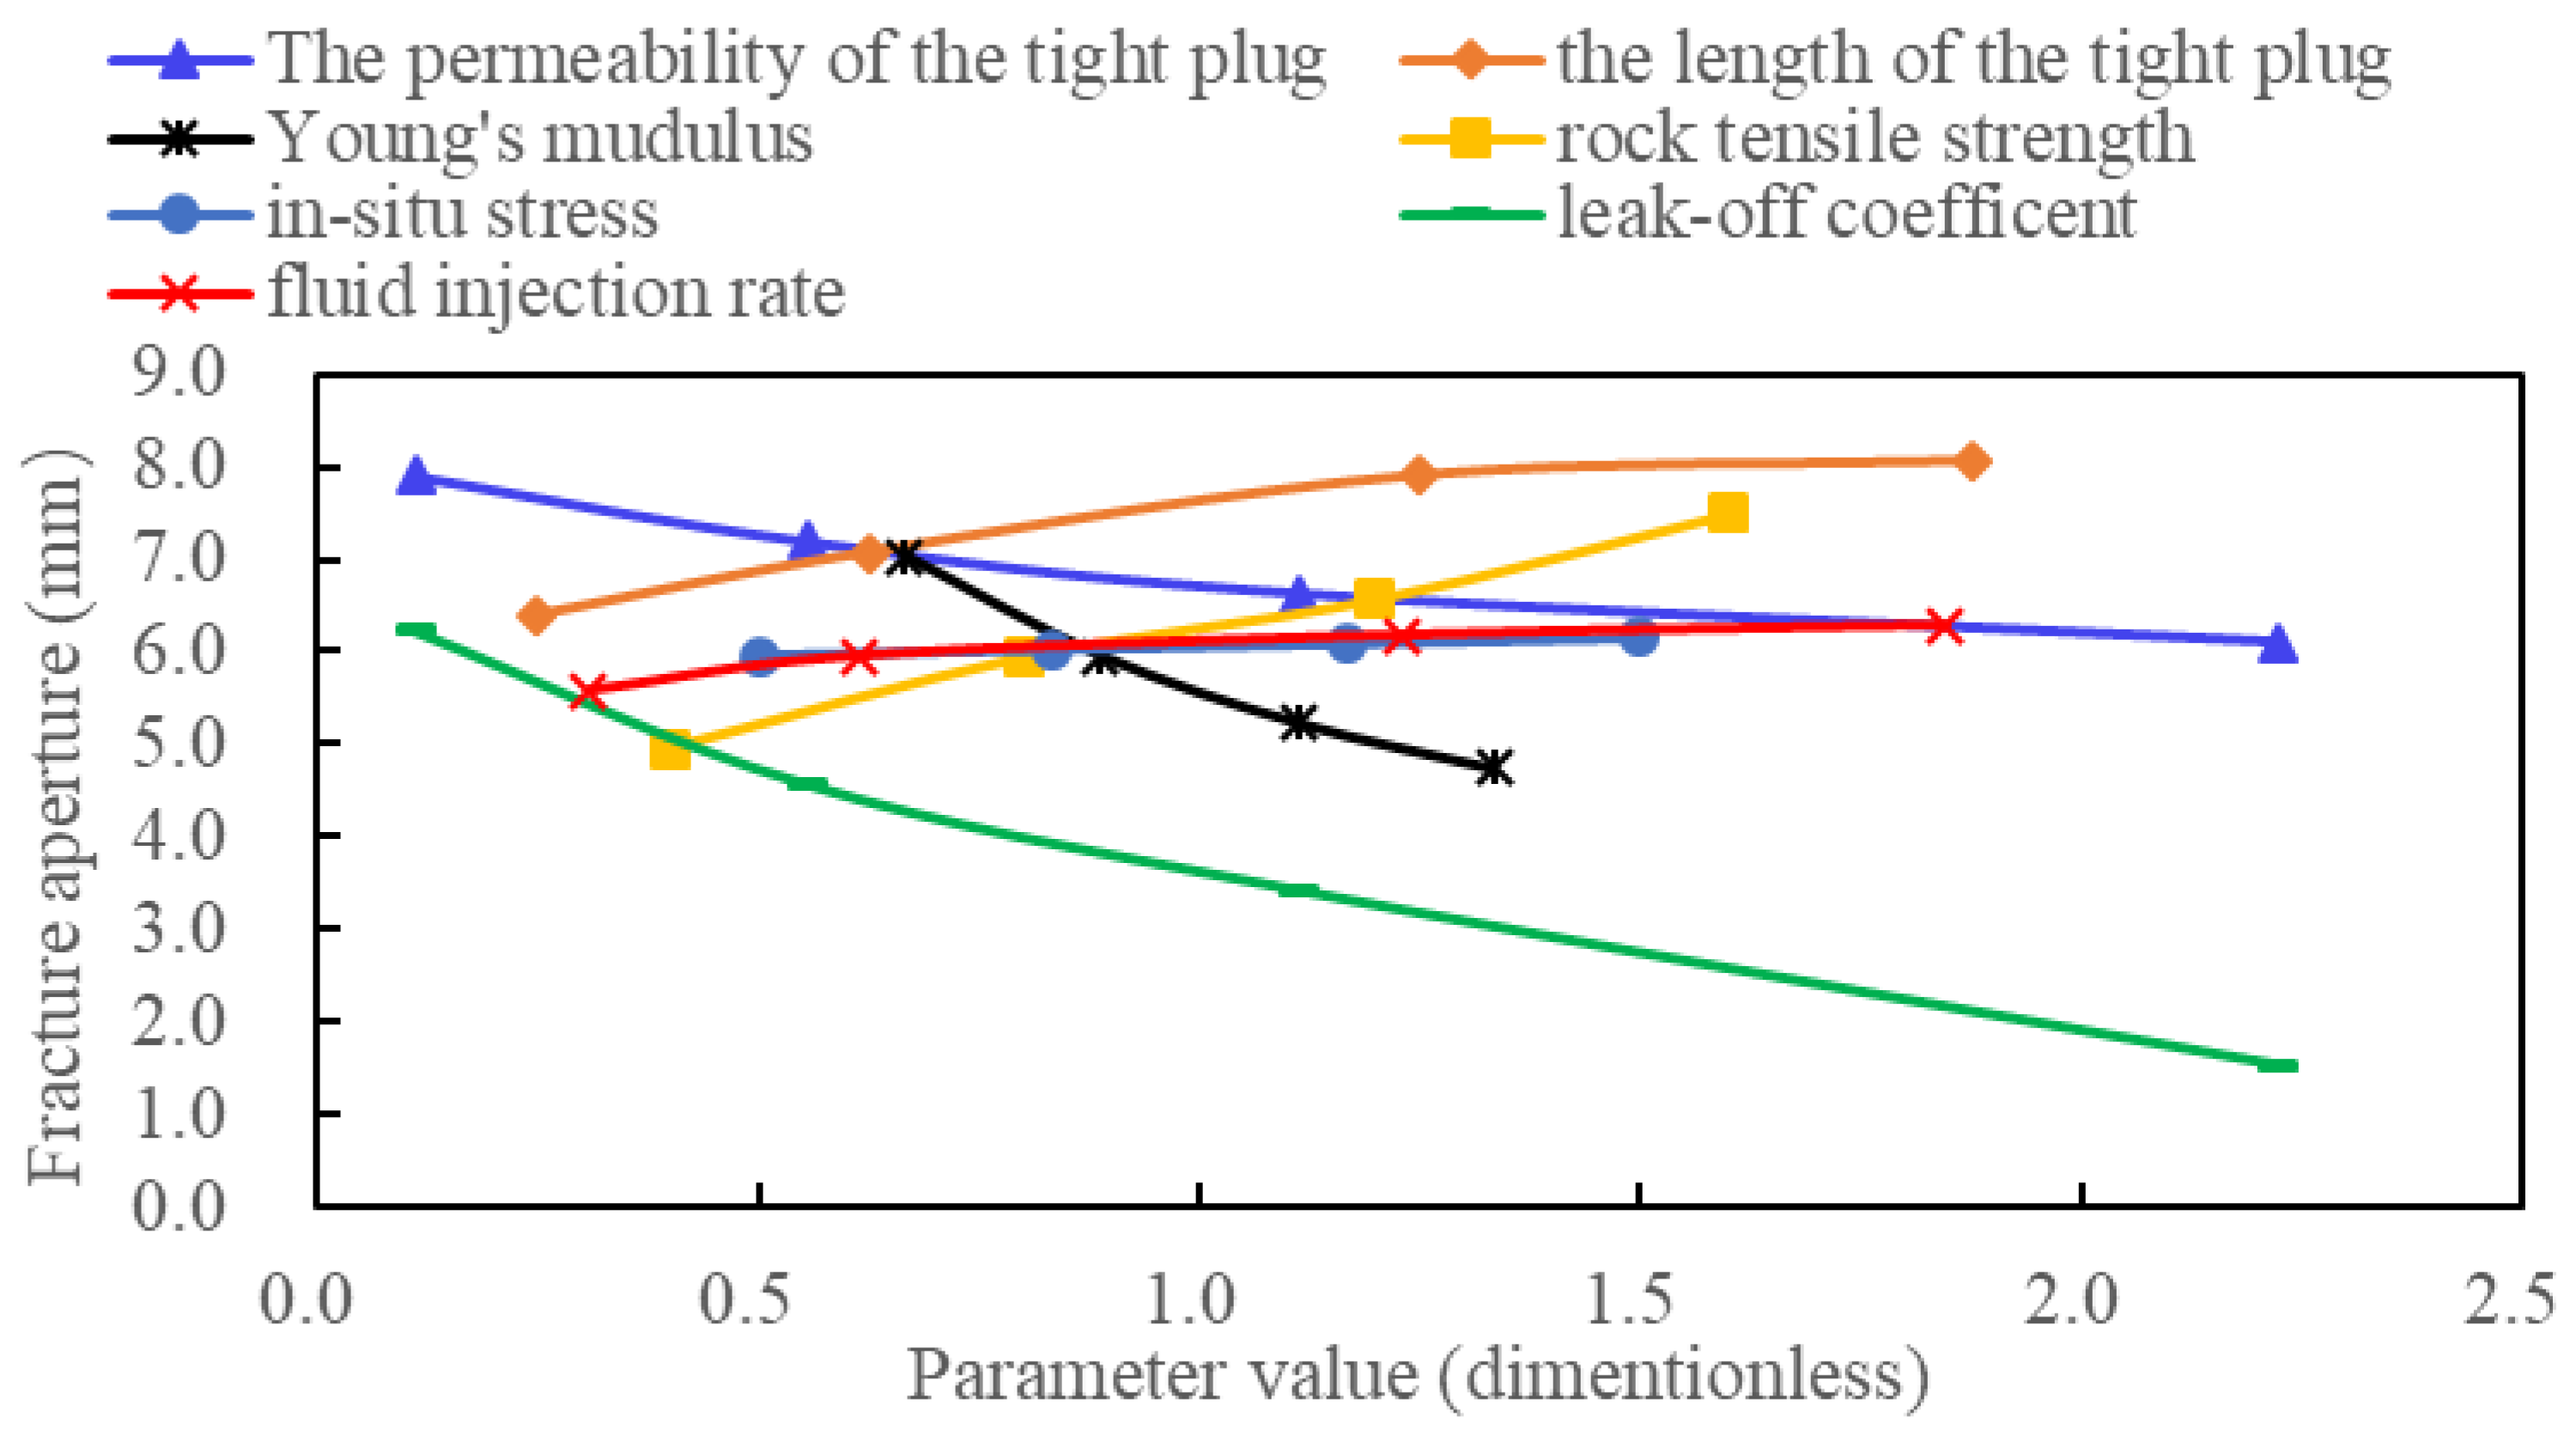
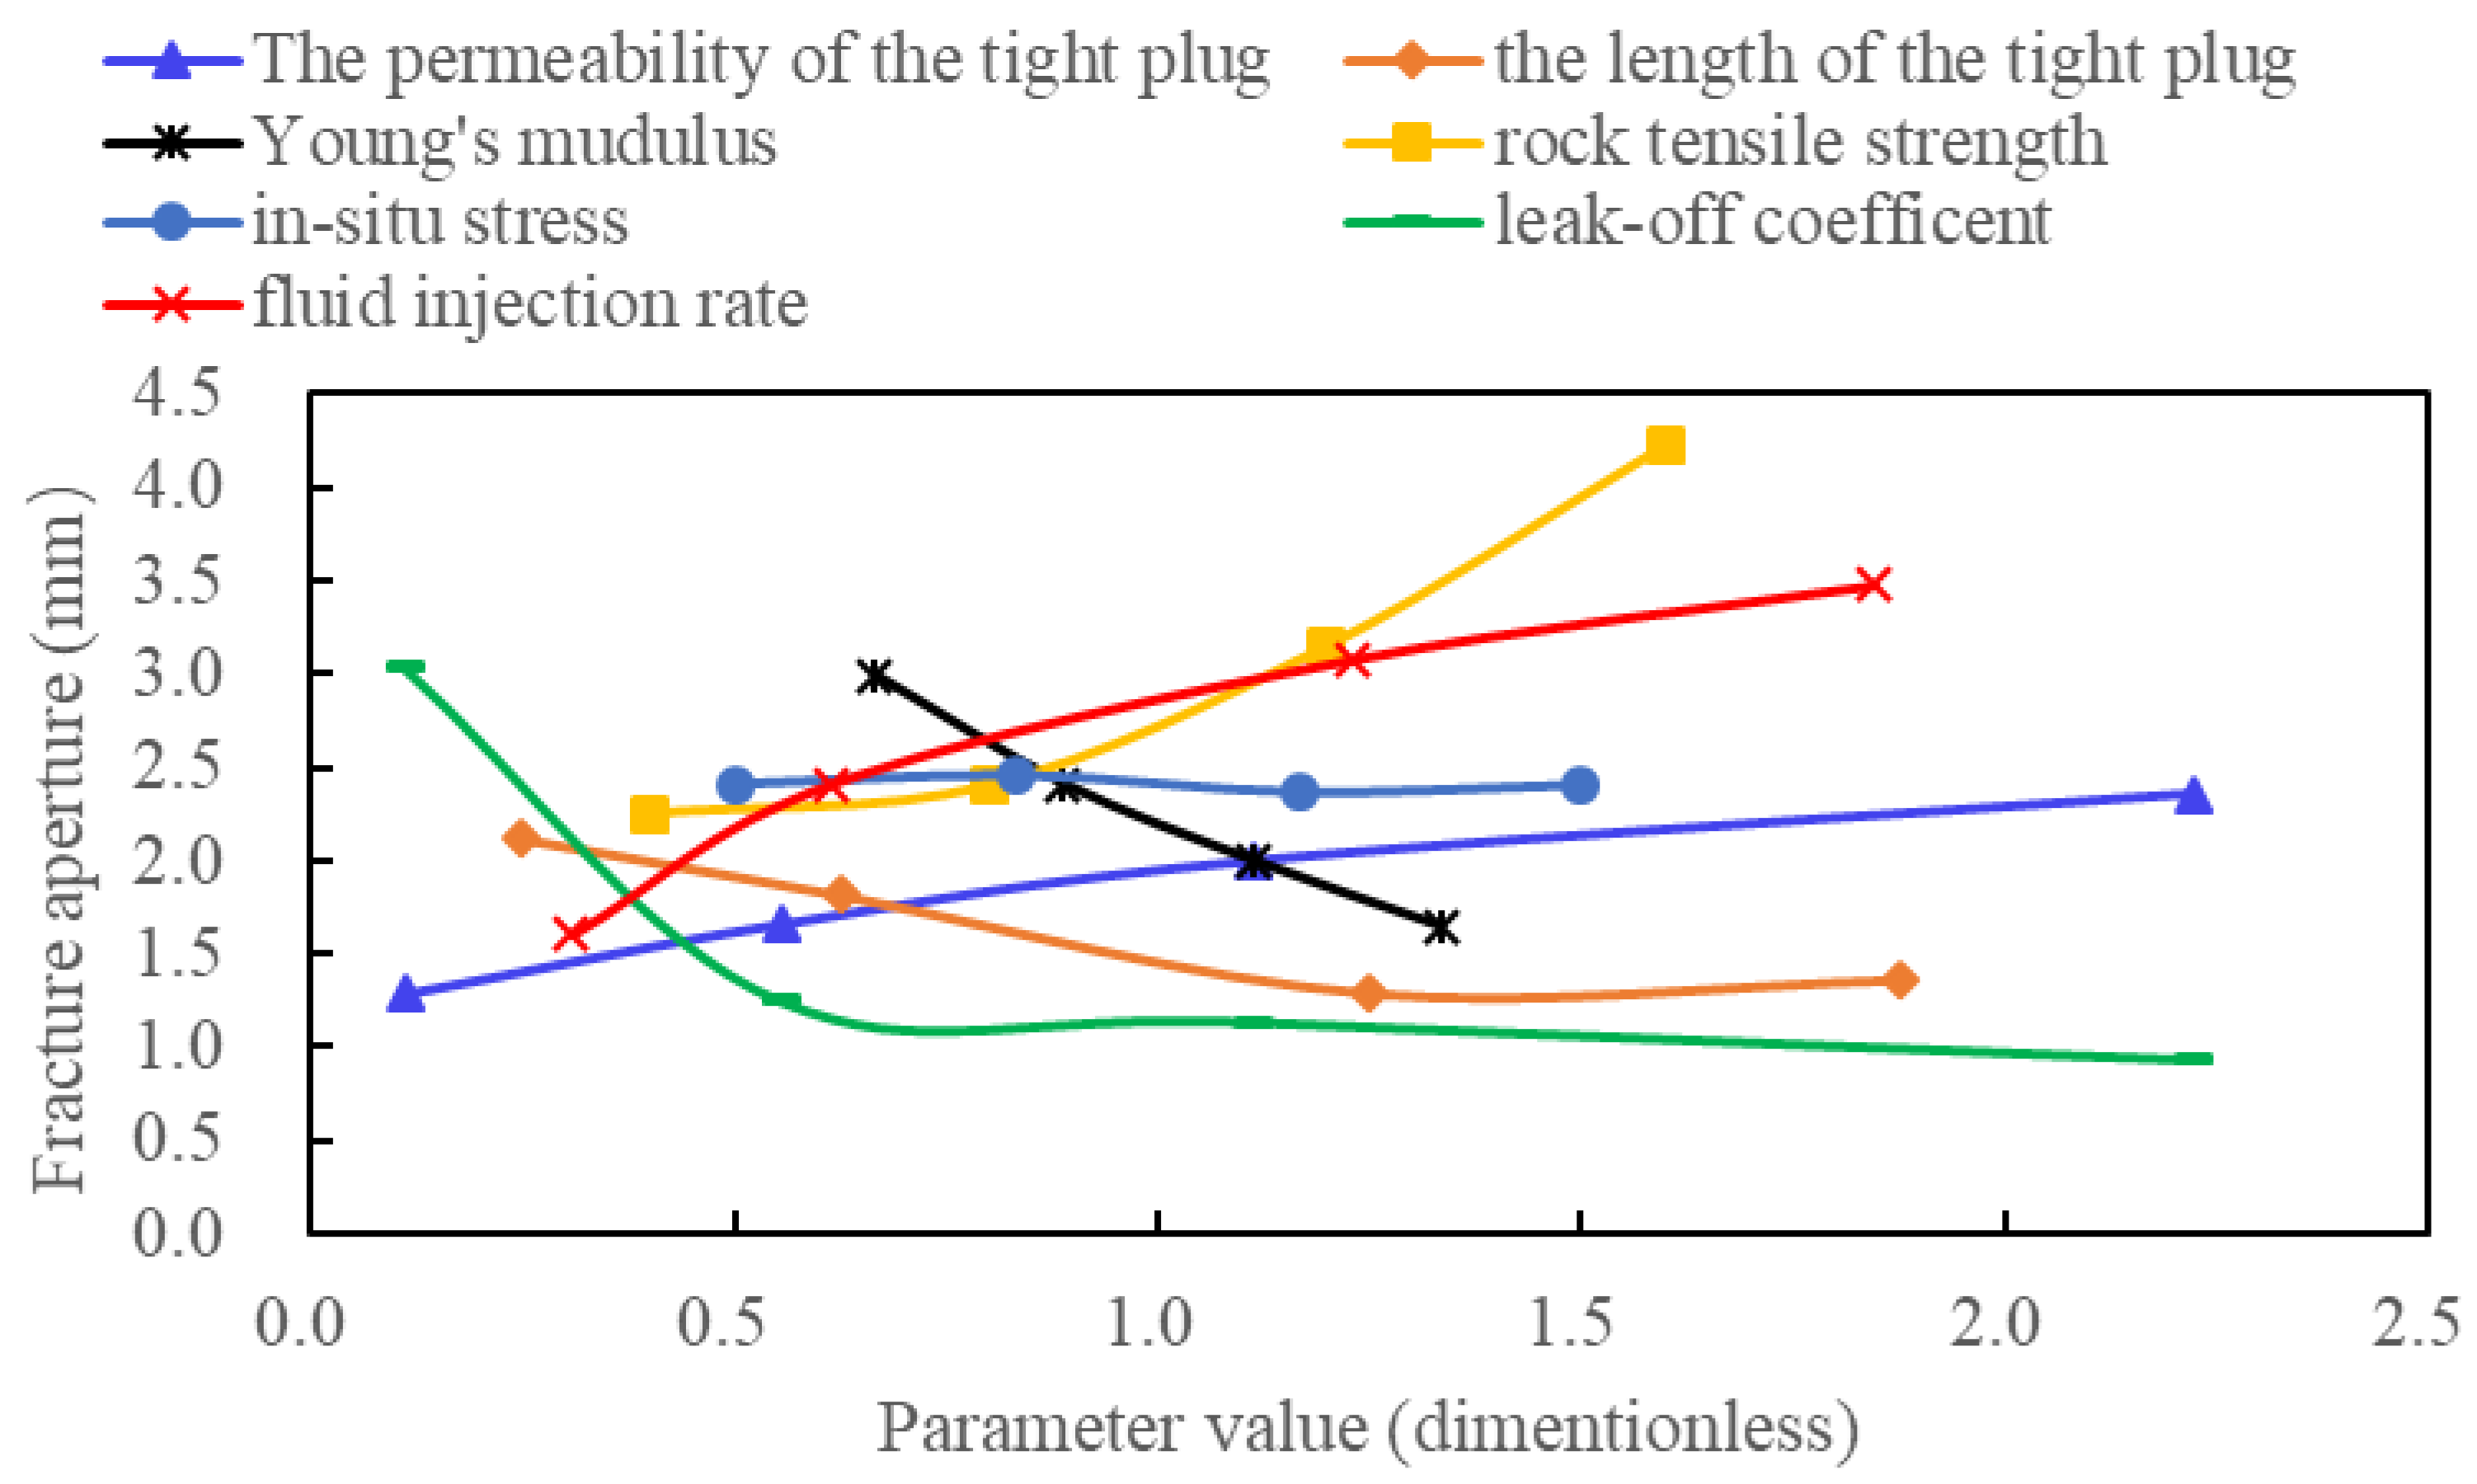
5.1. Multi-Parameter Comparative Analysis

The above seven parameters are normalized to realize the comparative analysis. The four values of each parameter are divided by the average value as follows:
x * = x / x ¯
where x * denotes the normalized value, x denotes the parameter value, and x ¯ denotes the average parameter value.
As shown in Figure 10, the aperture at the initial fracture mouth has a positive correlation with the length of the tight plug, the rock tensile strength, and the fluid injection rate, and it has a negative correlation with the permeability of the tight plug, Young’s modulus, and the leak-off coefficient. By comparing the absolute value of the curve derivative, factors influencing the aperture at the initial fracture mouth can be sorted by sensitivity as follows (strong to weak): Young’s modulus, the leak-off coefficient of the fracture surface, rock tensile strength, the length of the tight plug, the permeability of the tight plug, fluid injection rate, and in situ stress contrast.
As shown in Figure 11, the aperture at the diversion fracture mouth has a positive correlation with the permeability of the tight plug, rock tensile strength, and the fluid injection rate and has a negative correlation with Young’s modulus, the length of the tight plug, and the leak-off coefficient. By comparing the absolute value of the curve derivative, factors influencing the aperture at the diversion fracture mouth can be sorted by sensitivity as follows (strong to weak): Young’s modulus, rock tensile strength, fluid injection rate, the length of the tight plug, the permeability of the tight plug, the leak-off coefficient, and in situ stress contrast.

5.2. The Risk of Screenout

During hydraulic fracturing, a large amount of proppant will be injected to prop the hydraulic fractures. Proppant size determines the propped fracture aperture and the fluid flow rate within the fracture. In the target formation, 40/70 mesh (0.212–0.425 mm) and 30/50 mesh (0.3–0.6 mm) ceramic proppants are selected to overcome the high closure pressure of 55 MPa. The throttling effect occurs when the proppant enters the fracture mouth. The proppants tend to accumulate and plug the fracture mouth. This phenomenon is called screenout. It can be effectively alleviated when the fracture mouth aperture is five times the proppant size. In this work, the safe value of the fracture mouth aperture is 3 mm and the maximum proppant size is 0.6 mm. Based on the simulation results, the aperture at the initial fracture mouth is beyond 3 mm, and the aperture along the initial fracture is larger than the aperture at the mouth. This results in a low risk of screenout. The aperture at the diversion fracture mouth is between 0.9 mm and 4.2 mm, which is much smaller than that along the diversion fracture. Screenout is more likely to occur at the mouth of the diversion fracture. The risk can be lowered when selecting reservoirs with low Young’s modulus values and high rock tensile strength. Moreover, the aperture at the diversion fracture mouth can be enlarged by increasing the fluid injection rate.

6. Conclusions

(1)
The aperture at the initial or the diversion fracture mouth has a positive correlation with the rock tensile strength and the fluid injection rate. It has a negative correlation with Young’s modulus and the leak-off coefficient.
(2)
The aperture at the initial fracture mouth increases with the length of the tight plug and decreases with the permeability of the tight plug. The aperture at the diversion fracture mouth decreases with the length of the tight plug and increases with the permeability of the tight plug.
(3)
Screenout tends to occur at the mouth of the diversion fracture. Moreover, factors influencing the aperture at the diversion fracture mouth can be sorted by sensitivity as follows (strong to weak): Young’s modulus, rock tensile strength, fluid injection rate, the length of the tight plug, the permeability of the tight plug, the leak-off coefficient, and in situ stress contrast.
(4)
Reservoirs with low Young’s modulus values and high rock tensile strength generate wide initial and diversion fractures, ensuring safe proppant transportation at the fracture mouth. Moreover, increasing the fluid injection rate can effectively enlarge the fracture aperture and ensure safe construction.

Author Contributions

Conceptualization, Y.W. and B.W.; Methodology, B.S., T.W. and B.W.; Software, B.S. and Z.H.; Validation, B.S. and B.W.; Formal analysis, Y.W.; Investigation, T.W. and Z.H.; Data curation, Y.W.; Writing—original draft, Y.W., T.W. and B.W.; Writing—review & editing, Z.H.; Supervision, B.W. All authors have read and agreed to the published version of the manuscript.

Funding

This work was funded by the National Natural Science Foundation of China (No. 52104011), the Natural Science Foundation of Xinjiang Uygur Autonomous Region (2022D01B77), and the Karamay Innovative Environment Construction Plan (Innovative Talents) project (NO. 20232023hjcxrc0037).

Conflicts of Interest

The authors declare no conflict of interest.

References

  1. Tong, X.; Zhang, G.; Wang, Z.; Wen, Z.; Tian, Z.; Wang, H.; Ma, F.; Wu, Y. Distribution and potential of global oil and gas resources. Pet. Explor. Dev. 2018, 45, 779–789. [Google Scholar] [CrossRef]
  2. Isaac, O.; Hui, P.; Oni, B.; Samson, F.A. Surfactants employed in conventional and unconventional reservoirs for enhanced oil recovery—A review. Energy Rep. 2022, 8, 2806–2830. [Google Scholar] [CrossRef]
  3. Chen, B.; Barboza, B.; Sun, Y.; Bai, J.; Thomas, H.R.; Dutko, M.; Cottrell, M.; Li, C. A review of hydraulic fracturing simulation. Arch. Comput. Methods Eng. 2021, 29, 1–58. [Google Scholar] [CrossRef]
  4. Zhou, H.; Wu, X.; Song, Z.; Zheng, B.; Zhang, K. A review on mechanism and adaptive materials of temporary plugging agent for chemical diverting fracturing. J. Pet. Sci. Eng. 2022, 212, 110256. [Google Scholar] [CrossRef]
  5. Wang, D.; Zhou, F.; Ge, H.; Shi, Y.; Yi, X.; Xiong, C.; Liu, X.; Wu, Y.; Li, Y. An experimental study on the mechanism of degradable fiber-assisted diverting fracturing and its influencing factors. J. Nat. Gas Sci. Eng. 2015, 27, 260–273. [Google Scholar] [CrossRef]
  6. Sneddon, I.N.; Elliot, H.A. The opening of a Griffith crack under internal pressure. Q. Appl. Math. 1946, 4, 262–267. [Google Scholar] [CrossRef]
  7. Perkins, T.; Kern, L.R. Widths of hydraulic fractures. J. Pet. Technol. 1961, 13, 937–949. [Google Scholar] [CrossRef]
  8. Palmer, I.; Carroll, H.B. Three-dimensional hydraulic fracture propagation in the presence of stress variations. Soc. Pet. Eng. J. 1983, 23, 870–878. [Google Scholar] [CrossRef]
  9. Morales, R. Microcomputer analysis of hydraulic fracture behavior with a pseudo-three-dimensional simulator. SPE Prod. Eng. 1989, 4, 69–74. [Google Scholar] [CrossRef]
  10. Todd, B.; Choudhary, Y.; Bhamidipati, S. Fracture-width estimation for an arbitrary pressure distribution in porous media. In Brasil Offshore; OnePetro: Richardson, TX, USA, 2011. [Google Scholar]
  11. Guo, Q.; Feng, Y.Z.; Jin, Z. Fracture aperture for wellbore strengthening applications. In Proceedings of the ARMA US Rock Mechanics/Geomechanics Symposium, San Francisco, CA, USA, 26–29 June 2011; ARMA: Lee’s Summit, MO, USA, 2011; p. ARMA-11. [Google Scholar]
  12. Shahri, M.; Oar, T.; Safari, R.; Karimi, M.; Mutlu, U. Advanced geomechanical analysis of wellbore strengthening for depleted reservoir drilling applications. In Proceedings of the SPE/IADC Drilling Conference and Exhibition, Fort Worth, TX, USA, 4–6 March 2014; SPE: Richardson, TX, USA, 2014; p. SPE-167976. [Google Scholar]
  13. Zhang, J.; Alberty, M.; Blangy, J. A semi-analytical solution for estimating the fracture width in wellbore strengthening applications. In Proceedings of the SPE Deepwater Drilling and Completions Conference, Galveston, TX, USA, 4–5 September 2016; OnePetro: Richardson, TX, USA, 2016. [Google Scholar]
  14. Liu, Y.; Jin, G.; Wu, K.; Moridis, G. Hydraulic-fracture-width inversion using low-frequency distributed-acoustic-sensing strain data—Part I: Algorithm and sensitivity analysis. SPE J. 2021, 26, 359–371. [Google Scholar] [CrossRef]
  15. Xu, C.; Yang, X.; Liu, C.; Kang, Y.; Bai, Y.; You, Z. Dynamic fracture width prediction for lost circulation control and formation damage prevention in ultra-deep fractured tight reservoir. Fuel 2022, 307, 121770. [Google Scholar] [CrossRef]
  16. Zhang, Z.; Zhang, S.; Zou, Y.; Ma, X.; Li, N.; Liu, L. Experimental investigation into simultaneous and sequential propagation of multiple closely spaced fractures in a horizontal well. J. Pet. Sci. Eng. 2021, 202, 108531. [Google Scholar] [CrossRef]
  17. Xu, W.; Zhao, Y.; Wang, L.; Jiang, F. Experimental investigation of hydraulic fracture propagation behavior in layered continental shale. Energy Rep. 2022, 8, 14362–14373. [Google Scholar] [CrossRef]
  18. Shi, H.; Zhao, H.; Zhou, J.; Yu, Y. Experimental investigation on the propagation of hydraulic fractures in massive hydrate-bearing sediments. Eng. Fract. Mech. 2023, 289, 109425. [Google Scholar] [CrossRef]
  19. Chang, X.; Xu, E.; Guo, Y.; Yang, C.; Hu, Z.; Guo, W. Experimental study of hydraulic fracture initiation and propagation in deep shale with different injection methods. J. Pet. Sci. Eng. 2022, 216, 110834. [Google Scholar] [CrossRef]
  20. Shi, X.; Qin, Y.; Gao, Q.; Liu, S.; Xu, H.; Yu, T. Experimental study on hydraulic fracture propagation in heterogeneous glutenite rock. Geoenergy Sci. Eng. 2023, 225, 211673. [Google Scholar] [CrossRef]
  21. Wang, B.; Zhou, F.; Yang, C.; Wang, D.; Yang, K.; Liang, T. Experimental study on injection pressure response and fracture geometry during temporary plugging and diverting fracturing. SPE J. 2020, 25, 573–586. [Google Scholar] [CrossRef]
  22. Wu, K.; Olson, J.; Balhoff, M.T.; Yu, W. Numerical analysis for promoting uniform development of simultaneous multiple-fracture propagation in horizontal wells. SPE Prod. Oper. 2017, 32, 41–50. [Google Scholar] [CrossRef]
  23. Wang, B.; Zhang, G.; Zhou, F. Insights into the activation characteristics of natural fracture during in-fracture temporary plugging and diverting fracturing. Comput. Geotech. 2023, 162, 105655. [Google Scholar] [CrossRef]
  24. Guo, J.; Zhao, X.; Zhu, H.; Zhang, X.; Pan, R. Numerical simulation of interaction of hydraulic fracture and natural fracture based on the cohesive zone finite element method. J. Nat. Gas Sci. Eng. 2015, 25, 180–188. [Google Scholar] [CrossRef]
  25. Zhang, G.M.; Liu, H.; Zhang, J.; Wu, H.A.; Wang, X.X. Three-dimensional finite element simulation and parametric study for horizontal well hydraulic fracture. J. Pet. Sci. Eng. 2010, 72, 310–317. [Google Scholar] [CrossRef]
  26. Feng, Y.; Gray, K.E. A fracture-mechanics-based model for wellbore strengthening applications. J. Nat. Gas Sci. Eng. 2016, 29, 392–400. [Google Scholar] [CrossRef]
  27. Chen, M.; Zhang, S.; Li, S.; Ma, X.; Zhang, X.; Zou, Y. An explicit algorithm for modeling planar 3D hydraulic fracture growth based on a super-time-stepping method. Int. J. Solids Struct. 2020, 191, 370–389. [Google Scholar] [CrossRef]
  28. Chen, M.; Zhang, S.; Zhou, T.; Ma, X.; Zou, Y. Optimization of in-stage diversion to promote uniform planar multifracture propagation: A numerical Study. SPE J. 2020, 25, 3091–3110. [Google Scholar] [CrossRef]
  29. Li, Q.; Han, Y.; Liu, X.; Ansari, U.; Cheng, Y.; Yan, C. Hydrate as a by-product in CO2 leakage during the long-term sub-seabed sequestration and its role in preventing further leakage. Environ. Sci. Pollut. Res. 2022, 29, 77737–77754. [Google Scholar] [CrossRef]
  30. Li, Q.; Wang, F.; Wang, Y.; Forson, K.; Cao, L.; Zhang, C.; Zhou, C.; Zhao, B.; Chen, J. Experimental investigation on the high-pressure sand suspension and adsorption capacity of guar gum fracturing fluid in low-permeability shale reservoirs: Factor analysis and mechanism disclosure. Environ. Sci. Pollut. Res. 2022, 29, 53050–53062. [Google Scholar] [CrossRef]
  31. Wang, F.; Xiao, Z.; Liu, X.; Ren, J.; Xing, T.; Li, Z.; Li, X.; Chen, Y. Strategic design of cellulose nanofibers@zeolitic imidazolate frameworks derived mesoporous carbon-supported nanoscale CoFe2O4/CoFe hybrid composition as trifunctional electrocatalyst for Zn-air battery and self-powered overall water-splitting. J. Power Sources 2022, 521, 230925. [Google Scholar] [CrossRef]
Figure 1. Illustration of the simulation models: IF denotes the initial fracture and DF denotes the diversion fracture. (a) The schematic diagram of TPDF; and (b) the numerical simulation model.
Sustainability 15 14664 g001
Figure 2. Illustration of the simulation methods. (a) The propping effect; and (b) the plugging effect.
Sustainability 15 14664 g002
Figure 3. The curves of the fracture aperture vs. the length with different permeabilities of the tight plug. (a) The initial fracture; (b) the diversion fracture.
Sustainability 15 14664 g003
Figure 4. The curves of the fracture aperture vs. the length with different lengths of the tight plug. (a) The initial fracture; and (b) the diversion fracture.
Sustainability 15 14664 g004
Figure 5. The curves of the fracture aperture vs. the length with different rock Young’s modulus values. (a) The initial fracture; and (b) the diversion fracture.
Sustainability 15 14664 g005
Figure 6. The curves of the fracture aperture vs. the length with different rock tensile strengths. (a) The initial fracture; and (b) the diversion fracture.
Sustainability 15 14664 g006
Figure 7. The curves of the fracture aperture vs. the length with different in situ stress contrasts. (a) The initial fracture; and (b) the diversion fracture.
Sustainability 15 14664 g007
Figure 8. The curves of the fracture aperture vs. the length with different leak-off coefficients of the fracture surface. (a) The initial fracture; and (b) the diversion fracture.
Sustainability 15 14664 g008
Figure 9. The curves of the fracture aperture vs. the length with different fluid injection rates. (a) The initial fracture; (b) and the diversion fracture.
Sustainability 15 14664 g009
Figure 10. The comparative curves of the initial fracture aperture with different parameters.
Sustainability 15 14664 g010
Figure 11. The comparative curves of the diversion fracture aperture with different parameters.
Sustainability 15 14664 g011
Table 1. Input parameters.
CategoryParameterValue
Rock PropertyYoung’s modulus, E (GPa)25
Poisson’s ratio, v0.22
Permeability, k (mD)0.58
Fracture PropertyTensile strength of HF, σt (MPa)8
Leak-off coefficient (m/s/Pa)1 × 10−14
Tight Plug PropertyPermeability of the tight plug, (mD)500
Length of the tight plug, (m)0.5
In Situ StressMinimum principle horizontal stress, σh (MPa)55
Maximum principle horizontal stress, σH (MPa)60
Fluid ParameterFluid viscosity, μ/(Pa·s)0.1
Injection rate, Q/(m3/min)4
Initial ConditionInitial pore pressure, po/(MPa)37
Void ratio, Φ0.08
Disclaimer/Publisher’s Note: The statements, opinions and data contained in all publications are solely those of the individual author(s) and contributor(s) and not of MDPI and/or the editor(s). MDPI and/or the editor(s) disclaim responsibility for any injury to people or property resulting from any ideas, methods, instructions or products referred to in the content.

