Article

Strategies for Improving the Sustainability of Fare-Free Policy for the Elderly through Preferences by Travel Modes

Department of Urban Planning and Engineering, Yonsei University, Seoul 03722, Republic of Korea
Sustainability 2023, 15(20), 14678; https://doi.org/10.3390/su152014678
Submission received: 4 September 2023 / Revised: 25 September 2023 / Accepted: 9 October 2023 / Published: 10 October 2023

Abstract

:
As Korea provides a fare-free policy for subways only, there are objections to geographical equity, and the need to expand it to the entire public transportation system is being discussed. However, expanding policy scope in line with an aging society will soon pose sustainability problems. Hence, policy changes, similar to that of countries that provide fare-discount policies for the elderly or apply different discount rates for each travel mode, are needed. However, providing the same policies for all cities may differ from the benefits the target group wants. Thus, this study investigated the preference of the elderly living in major cities in South Korea for discount policies by travel mode. The study aims to provide a strategy for choosing the travel mode that should provide discount policies by combining regional and individual attributes. The latent class model is employed to classify stated preference data collected from the survey. The estimation results show a significant preference heterogeneity depending on the level of subway supply by region, and a policy focused on subways would be more reasonable in cities with sufficient subway infrastructure. In addition, providing additional bus discount policies only for trunk lines will help improve sustainability.

1. Introduction

In modern society, convenient travel through transportation facilities must be provided as a fundamental right of citizens. Thus, the nation must provide a minimum level of service to guarantee all citizens this right. This concept, known as Public Service Obligation (PSO), applies to various transport services in many countries through legal or nation-to-provider arrangements. The PSO policy refers to providing services to regions or groups without transportation facilities due to a lack of profitability [1]. The PSO policy aims to improve social equity by redistributing wealth to groups with less access to transportation services [2,3]. Hence, extra subsidies must be provided, and in order to efficiently use national funds, it is necessary to review the degree of PSO achievement by policy, specifically. In the case of Europe, research on PSO policies in air transport is actively being conducted [4,5]. Regarding social equity of public transportation services, research is mainly conducted to evaluate the overall service through indicators such as the Gini coefficient or total demand and supply [6,7]. Recently, research has been conducted on partially reducing the fare-free policy’s scope to improve sustainability [8,9]. However, in Europe, fare discount policies are provided at a similar level for all public transportation modes, but in Korea, they are provided in a particular form for political reasons.
In South Korea, PSOs are fulfilled through fare-free policies for specific groups (elderly, veterans, and disabled) and the provision of extra public transit (bus, railway) lines. The government of South Korea introduced a public transportation fare-free policy in 1984 without a detailed review. This policy was promoted by revising laws on the elderly and global trends, and a similar policy was introduced in the UK in 1997 [10]. At the beginning of the policy introduction, all available public transportation (bus, railway) was provided free of charge. However, at this time, only the railway provides it free of charge. The main reason why the scope of the policy was limited to railways was that, unlike railways, buses provide services from the private sector. Since the nation needed to provide more subsidies, buses operating in the private sector had problems with policy sustainability. On the other hand, most countries, including the UK, are implementing PSO policies for all available public transportation. Moreover, in the case of the UK, it can be seen that the PSO system utilization rate for buses is high under the conditions that both buses and railways are available [11]. Considering the UK’s case, discussing whether South Korea’s PSO system is achieving its purpose, excluding political reasons, is necessary.
In addition, the issue of the system’s sustainability due to an aged society is being discussed. South Korea is an aged society with an elderly population of more than 17%, so it is expected to become a super-aged society soon. Currently, the railway utilization rate of the PSO target group is about 20% of the total users, and the elderly are about 82% of the PSO target group [12]. In addition, the elderly group in Korea is expected to double by 2050 [13], and the PSO target group among railway users is expected to be 43% by a simple calculation. Considering the PSO’s purpose of ensuring that all social classes are guaranteed a “minimum service level” with a limited budget, South Korea’s fare-free policy needs to improve the overall system.
This study reviews the travel behavior of the elderly, who account for most of the fare-free policy target group, and suggests revision directions to improve equity with a limited budget. The preference of the elderly for public transportation mode was investigated through an SP (statement preference) survey. As in the UK’s case, if the elderly prefer buses to subways, PSO subsidy support should be applied differently from the present case. In addition, South Korea offers PSO benefits in six areas where subways are operated, and the level of public transportation (bus and subway) infrastructure in each area is very different. Hence, subsidy policies should be tailored to each region rather than operating on a single criterion. This study applied a latent class model (LCM) that classifies the SP survey results in consideration of individual and regional attributes. As a result, this study proposed improving PSO policies for each region.
The remainder of this paper is organized as follows: Section 2 reviews studies on the definition of equity and the evaluation of equity through travel behavior. Section 3 describes related data and analysis methodology. In Section 4, empirical results and discussions are provided. Finally, the Section 5 discusses the study’s conclusion and future research direction.

2. Literature Review

Redistribution in public transportation policy, horizontal equity, and vertical equity are the first terms mentioned. Vertical equity means that extra subsidies are needed for the socially excluded class regarding accessibility or availability of transportation facilities. Another way to say vertical equity is the redistribution of wealth, and its roots lie in the concept of distributive justice [14].
Vertical equity is divided into three categories: inclusivity, affordability, and social justice [15]. Inclusivity refers to users of various classes being able to use public transportation under the same conditions. It means improving facilities so that all users can conveniently use them. Affordability means that higher subsidies should be provided to groups with lower income levels. Finally, social justice defines groups that need assistance according to social norms. Overall, the group that needs assistance is defined, and equity is evaluated by considering the actual level of assistance provided. However, this research could have pointed out more about horizontal equity between target groups according to the geographical distribution of the target group.
The theory of distributive justice is divided into five categories, each as follows: strict egalitarianism, difference principle of justice, resource-based principles of justice, desert-based theory, and libertarianism [14]. In addition, each theory was reclassified into nine categories by target group (geographic, group, and individual) and by definition of equity (market equity, opportunity equity, and outcome equity).
Among these groups is the category of geographical equity; it was mentioned that “equitable assistance” at the administrative district level should be examined with wariness in the case of the US. A past study pointed out that due to the subsidy policy paid equally to all states, states (Manhattan) with high public transportation utilization rates fail to install planned railway lines [16]. In other words, it should be divided into “geographical market equity”, “geographical opportunity equity”, and “geographical outcome equity”, not just “geographical equity.” First, geographic market equity means that subsidies should be different based on the utilization rate of each region. Next, geographical opportunity equity requires equal subsidies to all regions. Finally, geographical outcome equity means that all regions should provide services equally. Among them, the Manhattan case occurred because geographical equity was evaluated only by geographical opportunity equity.
The fare-free policy is highly related to geographical equity indicators: market equity and outcome equity. First, geographical opportunity equity is more related to infrastructure provision than fare-free policy. Since subsidies for fare-free policies are determined according to the number of users and utilization rates, it is impossible to provide the same level of policy subsidies to all regions. The geographical market equity is an indicator that can be easily achieved if there is no policy limit on the number of uses. Many countries, including South Korea, provide policies without limitations; the higher the utilization rate, the higher the subsidies will be. In addition, discounts are provided by purchasing season tickets in some parts of France (e.g., Navigo Annual Senior Ticket) and Japan, so the higher the utilization rate, the lower the average fare. The geographical outcome equity is typical for countries other than South Korea to be treated separately from the fare-free policy as a matter of policy provision. Since most countries provide the same fare-free policy for all available public transportation, it is essential to provide public transportation infrastructure before the fare-free policy. On the other hand, since South Korea provides a policy limited to railways, this indicator is mainly used for equity evaluation.
In summary, South Korea’s fare policy, available only for specific travel modes, should be applied to various modes to improve geographical outcome equity. However, expanding the policy scope by various travel modes under budget constraints significantly reduces sustainability. Thus, although geographical market equity will be reduced, fare policy will be limited to improve sustainability. Recent studies analyzed equity in terms of total benefits through indicators related to the total discounted amount [17], public transportation usage rate [18], access time [19,20,21,22,23], and mobility [24] according to travel behavior. In particular, the importance of accessibility, such as accessibility to work areas [19,20,21], accessibility to medical facilities [22], and average access time [23], has been pointed out in various studies. On the other hand, the preference of the policy target group for public transportation modes was not significantly identified. Few studies have pointed out the difference in the density of the provision of buses and subways with different accessibility and users’ preferences. Moreover, there are apparent differences between buses and subways regarding the degree of provision and access behavior for boarding. Hence, this study presents a strategy for improving fare policy by investigating the public travel mode that the elderly prefer. Another way to state this concept is that if the same fare-discount policy cannot be applied to all travel modes due to budget constraints, providing more benefits for the modes preferred by the target group would be desirable. Considering this, this study suggests ways to improve the public transportation discount policy in consideration of the characteristics of target groups by region. The survey method and data section are described in the same structure as Figure 1.

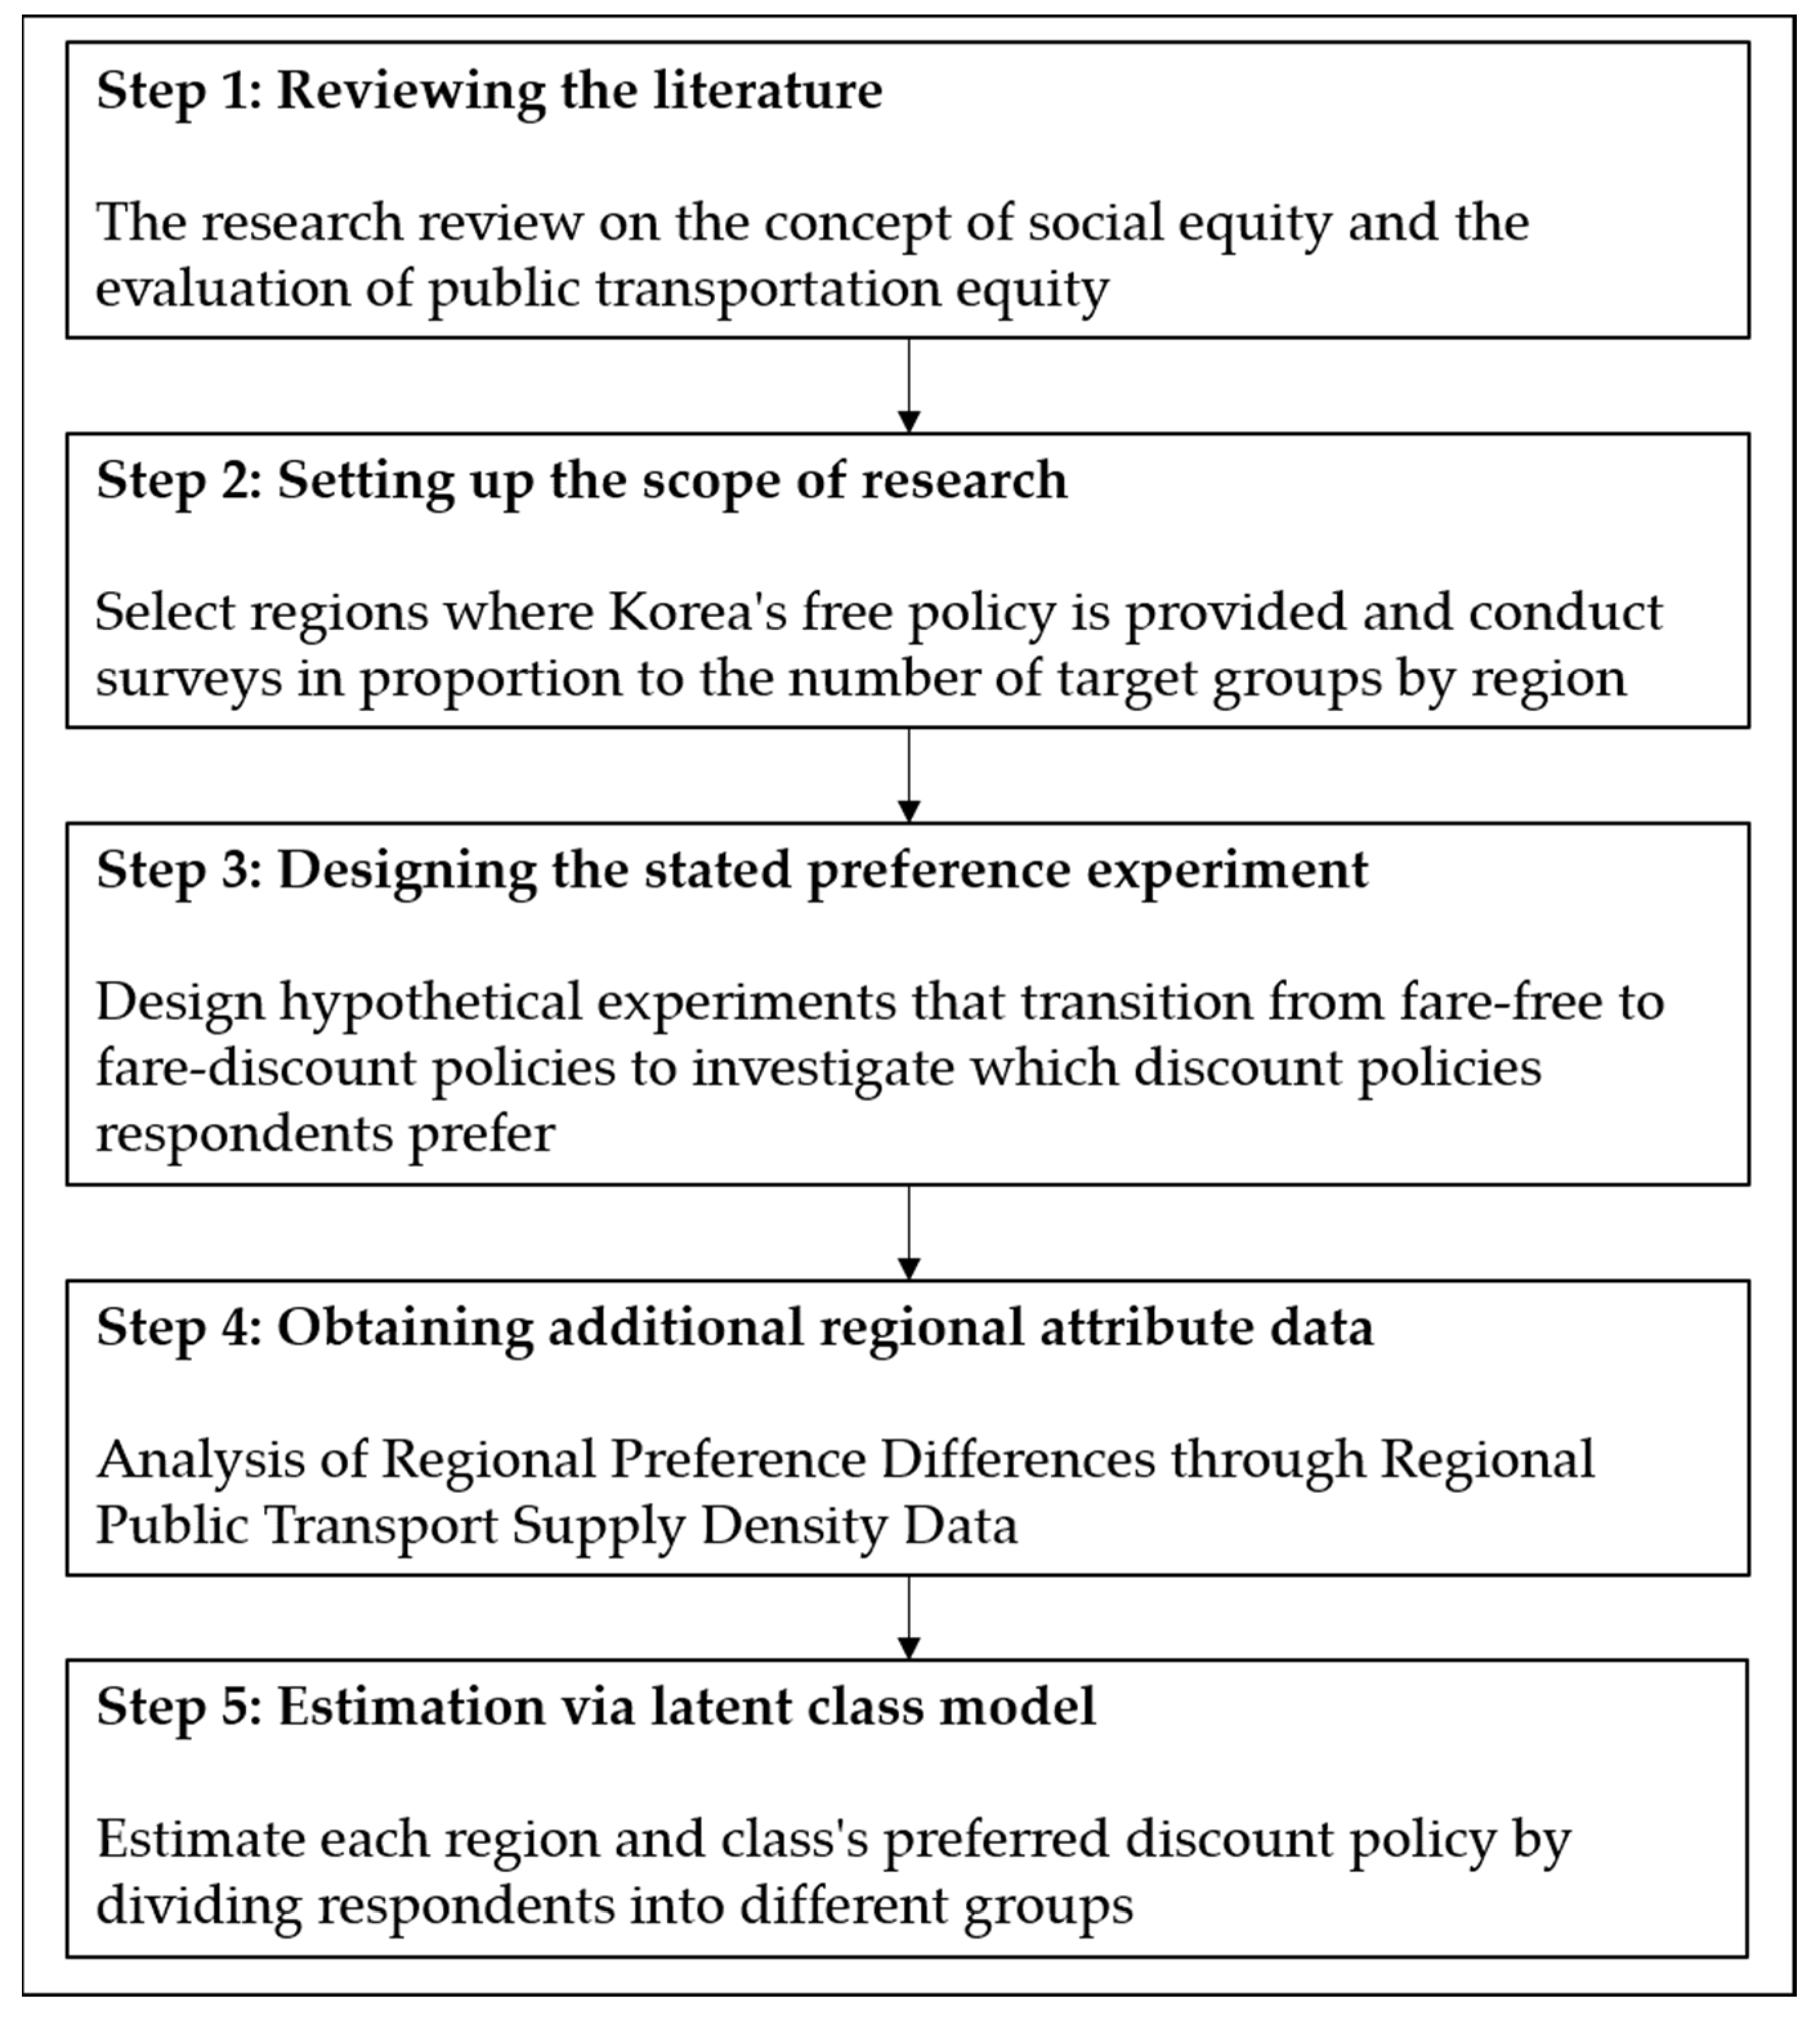
3. Research Method and Data

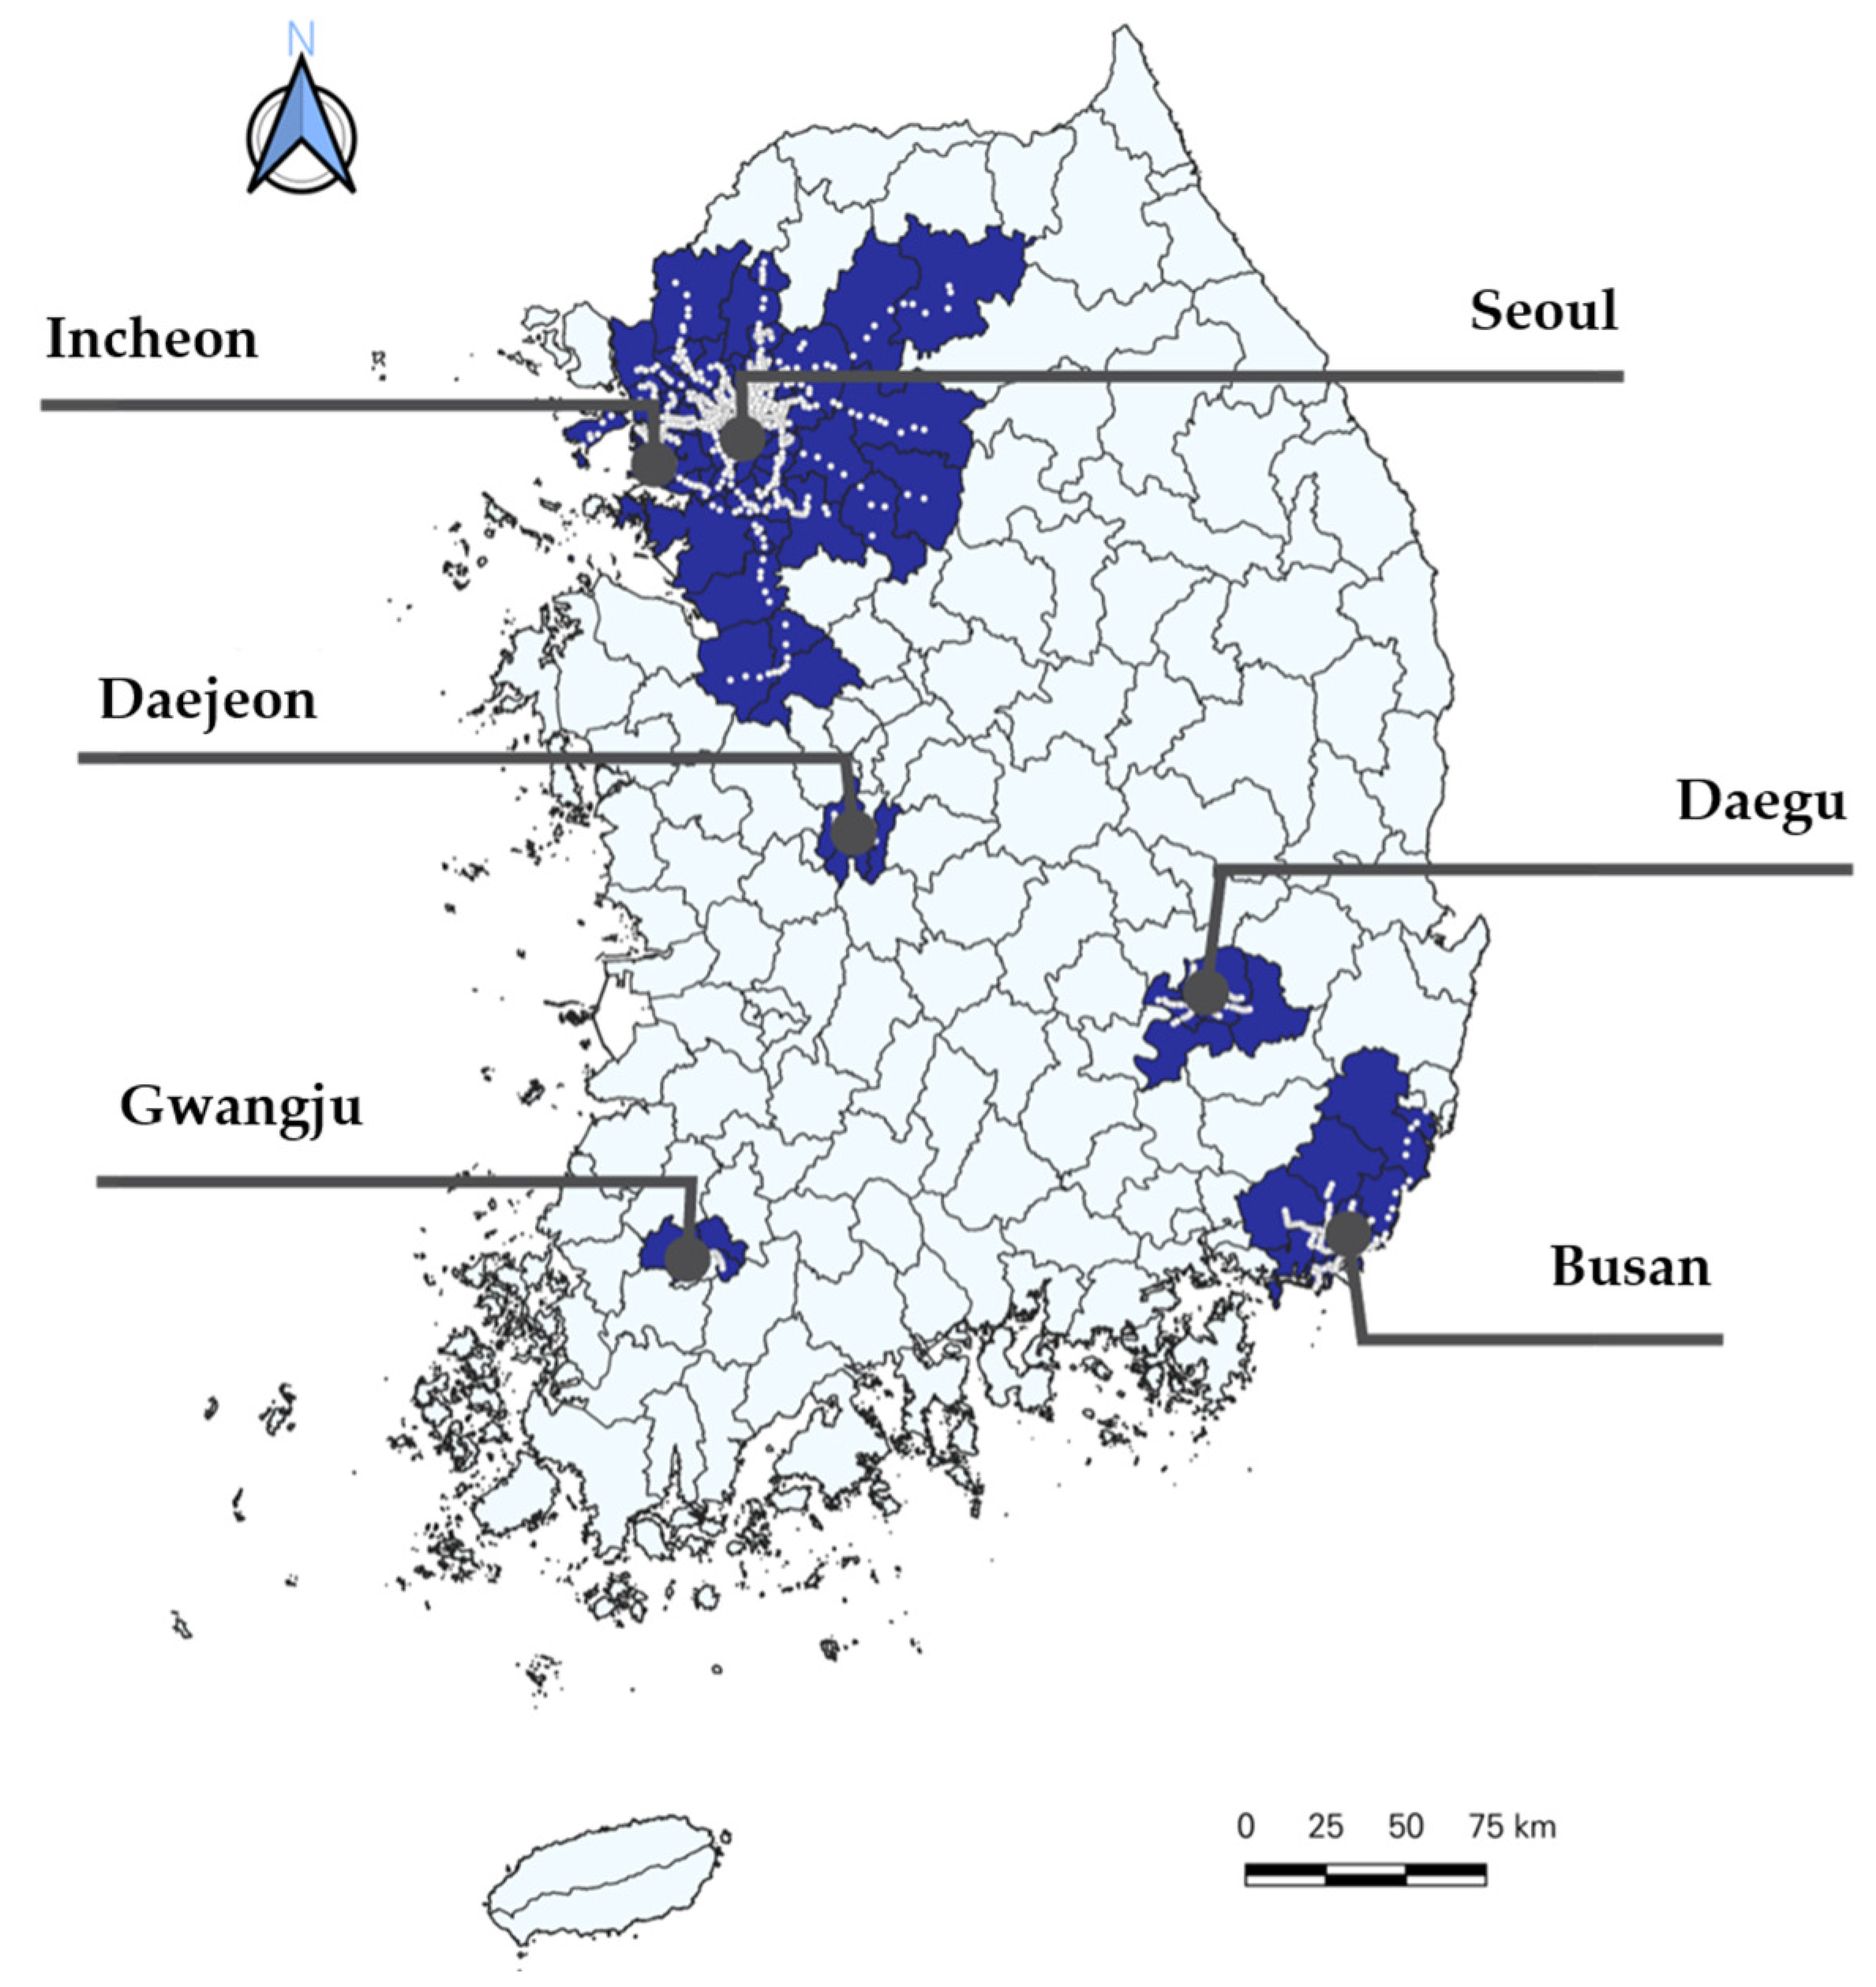
3.1. Data Collection

The purpose of this study is to investigate the preference of the elderly according to changes in fares by public transportation modes (bus, subway). In order to convert the fare-free policy to the fare-discount policy under budget constraints, it is necessary to find out the travel mode to focus on among the two public travel modes. Since South Korea only provides a fare-free policy for the elderly, a SP experiment was designed. The questions include SP experiments and questions about respondents’ socio-demographics. This survey was conducted in face-to-face interviews for two weeks in September 2022, with respondents aged 65 or older living in six cities where the fare-free policy is provided: Seoul, Busan, Daegu, Incheon, Gwangju, and Daejeon (see Figure 2). The survey target is limited because South Korea’s fare-free policy is provided to those aged 65 or older. The sample is stratified to allocate the number of samples according to the population proportion in each region, and 730 samples are eventually collected (see Table 1). At least 30 respondents were required to satisfy statistical significance according to the central limit theorem, and the number of respondents in each attribute category was investigated. However, few respondents over the age of 85 were able to respond to the survey, and few responded with household income exceeding 3020 USD/month. Therefore, both groups were investigated to collect at least 30 individuals, and as a result, statistical significance was met.

3.2. Experimental Design

The SP experiment aims to analyze the elderly preferences for two public travel modes. The alternatives are bus service and subway service. The level of each travel attribute applied to the questionnaire is set to a maximum of four to prevent the total number of cases in the experiment from becoming too large (Table 2). Considering that the survey target group is 65 or older, only three attributes were employed to make the survey as simple as possible.
The hypothetical choice situations are constructed with an orthogonal design that provides situations satisfying attribute level balance and estimating all parameters independently. As a result, 32 hypothetical choice situations are generated and divided into four blocks consisting of eight situations (Table 3).

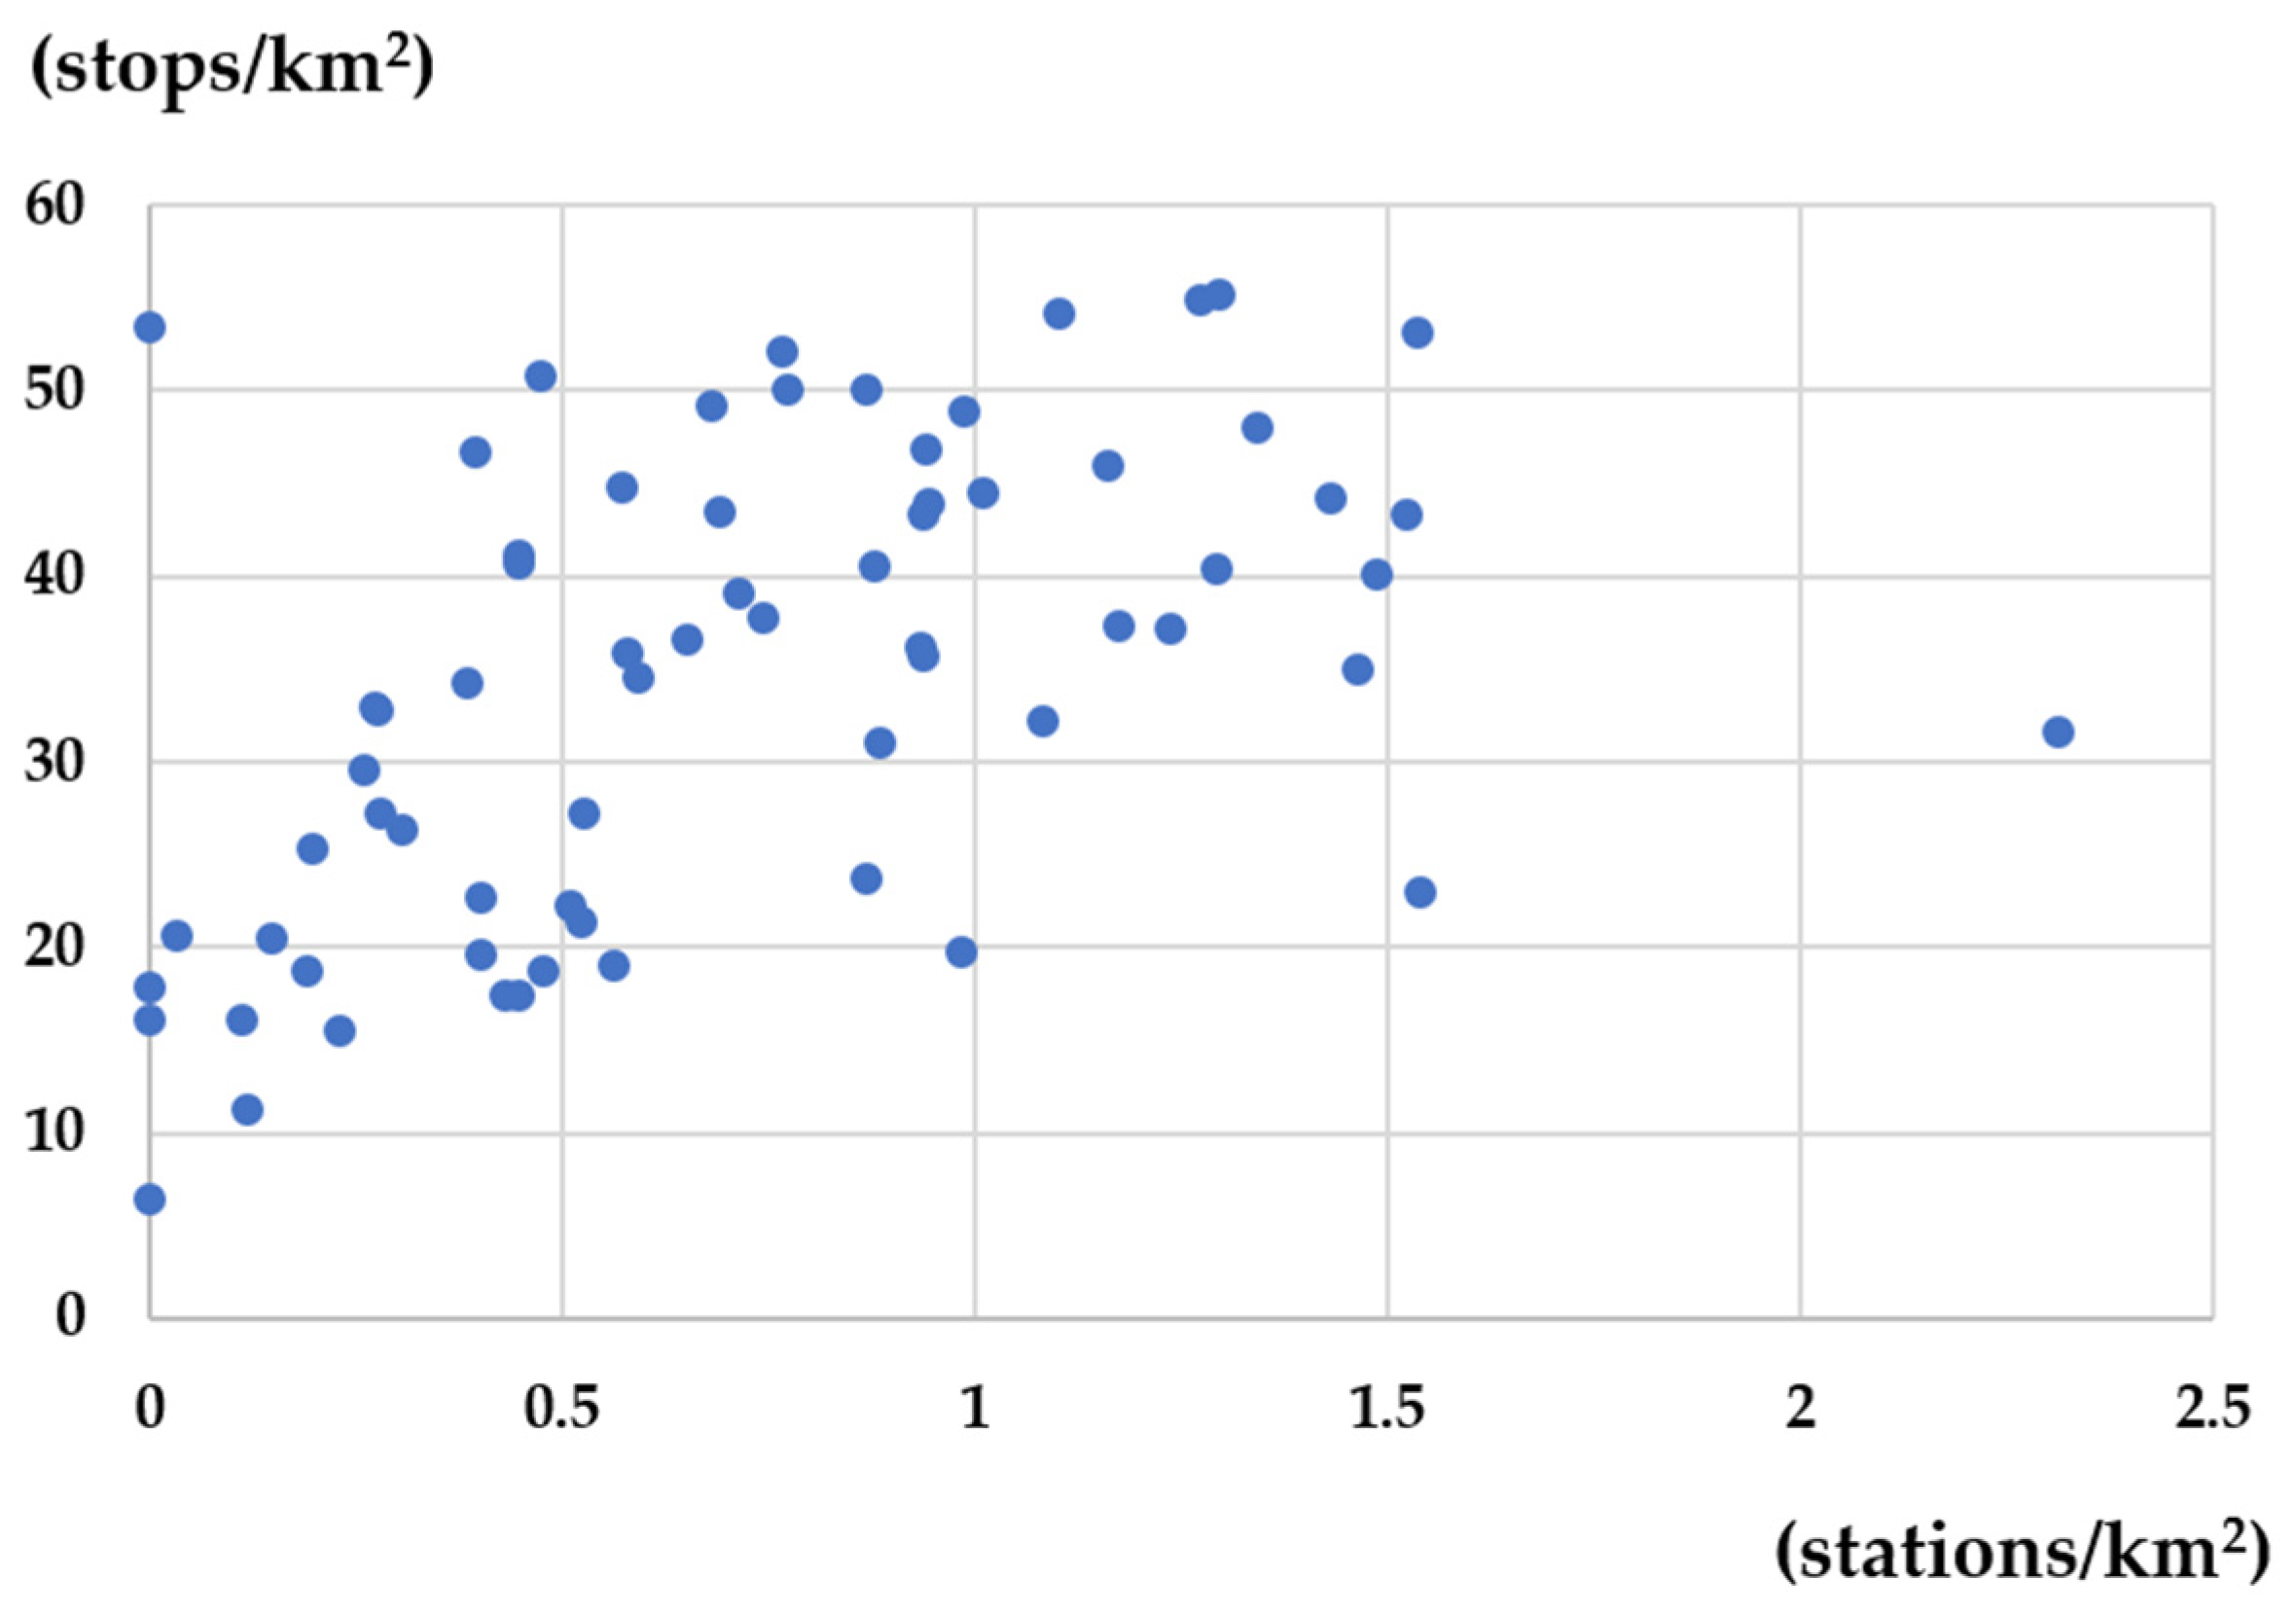
3.3. Public Transportation Infrastructure Levels by Region

The above survey investigates the potential preference for situations where fares change without additional public transportation infrastructure supply. Hence, the infrastructure level by travel modes currently affects stated preferences, and it is necessary to consider additional data in the analysis to compensate for this. This study additionally considered regional attributes through the urban area’s density of public transportation stops. Table 4 shows the distribution of station densities by 25 sub-districts in Seoul, and Table 5 shows the average stop densities in six cities. Table 4 explains that there are various infrastructure levels even within a city, and Table 5 shows that the number of bus stops and subway stations is not linearly correlated. Figure 3 is a scatterplot of the two density indicators, and the Pearson correlation coefficient of the two indicators is 0.507. Moreover, since Gwangju and Daejeon have only one subway line, subway stations are concentrated in some sub-districts. Thus, it is expected that the two density indicators will have different effects on classification, and both are employed for analysis.

3.4. Latent Class Model Configuration

LCM considers heterogeneity, assumes that each individual belongs to a finite group, and is widely employed in various transportation studies [25,26,27]. In particular, the population can be classified flexibly compared to the mixed logit models that assume the distribution of parameters [28], so it is used for various marketing analyses. Therefore, since this study aims to provide flexible policy strategies for each group, LCM was employed for analysis.
Recent LCM studies on public transport preferences are investigating and analyzing various information. In addition to basic traffic information such as travel time, fare, walking time, and number of transfers [29,30], real-time information provision [31] and attitudinal factors of users [32,33] are often investigated in surveys. By contrast, this study focused on reducing confusion among respondents with a simple design because the target group consists of individuals aged 65 or older. The survey was also concisely organized in a recent study on public transport preference for the elderly [34].
The information collected in the stated preference questionnaire is in-vehicle time, out-of-vehicle time, and travel cost, and was adopted as a variable in the discrete choice model part of the LCM. This study assumed that the importance of out-of-vehicle time for buses and subways would be different. The elderly have difficulty accessing the subway because they have to travel underground through stairs or elevators. By contrast, the bus is relatively easy to access because there is no change in the ground level. Thus, out-of-vehicle time was employed as an alternative-specific variable, and the remaining two variables were employed as generic variables. The class membership part consists of four personal attributes and one regional attribute: age, gender, driving status, employment status, and two density indicators. Table 4 summarizes the variables adopted in the LCM model. All attributes employed in the model were analyzed without standardization except dummy variables (gender, driving status, employment status) (see in Table 6).

4. Estimation Results and Discussion

4.1. Estimation Results

The latent class model analysis results were estimated from LatentGold6.0, a software package estimating the latent class model, and the goodness of fit of classification was determined by Log Likelihood (LL), Bayesian Information Criterion (BIC), Consistent Akaike Information Criterion (CAIC), and ρ2. The qualitative fit of models is shown in Table 7, and the optimal model was chosen as the model with the lowest BIC, as pointed out in previous studies [35,36]. Hence, the five-class model with the lowest BIC was chosen as the optimal model.
The estimation results of the discrete choice model part and the class membership model part are shown in Table 8 and Table 9, respectively. As shown in Table 8, most of the coefficients were reasonably derived except for the in-vehicle time of class 3. Class shares are estimated to be over 10%, except for class 5. Most of the membership variables did not reach the significance level of 0.1, but 13 variables significantly affected the classification, including variables estimated to be less than 0.2. In particular, two density indicators, which refer to heterogeneity according to local infrastructure, influenced the classification.

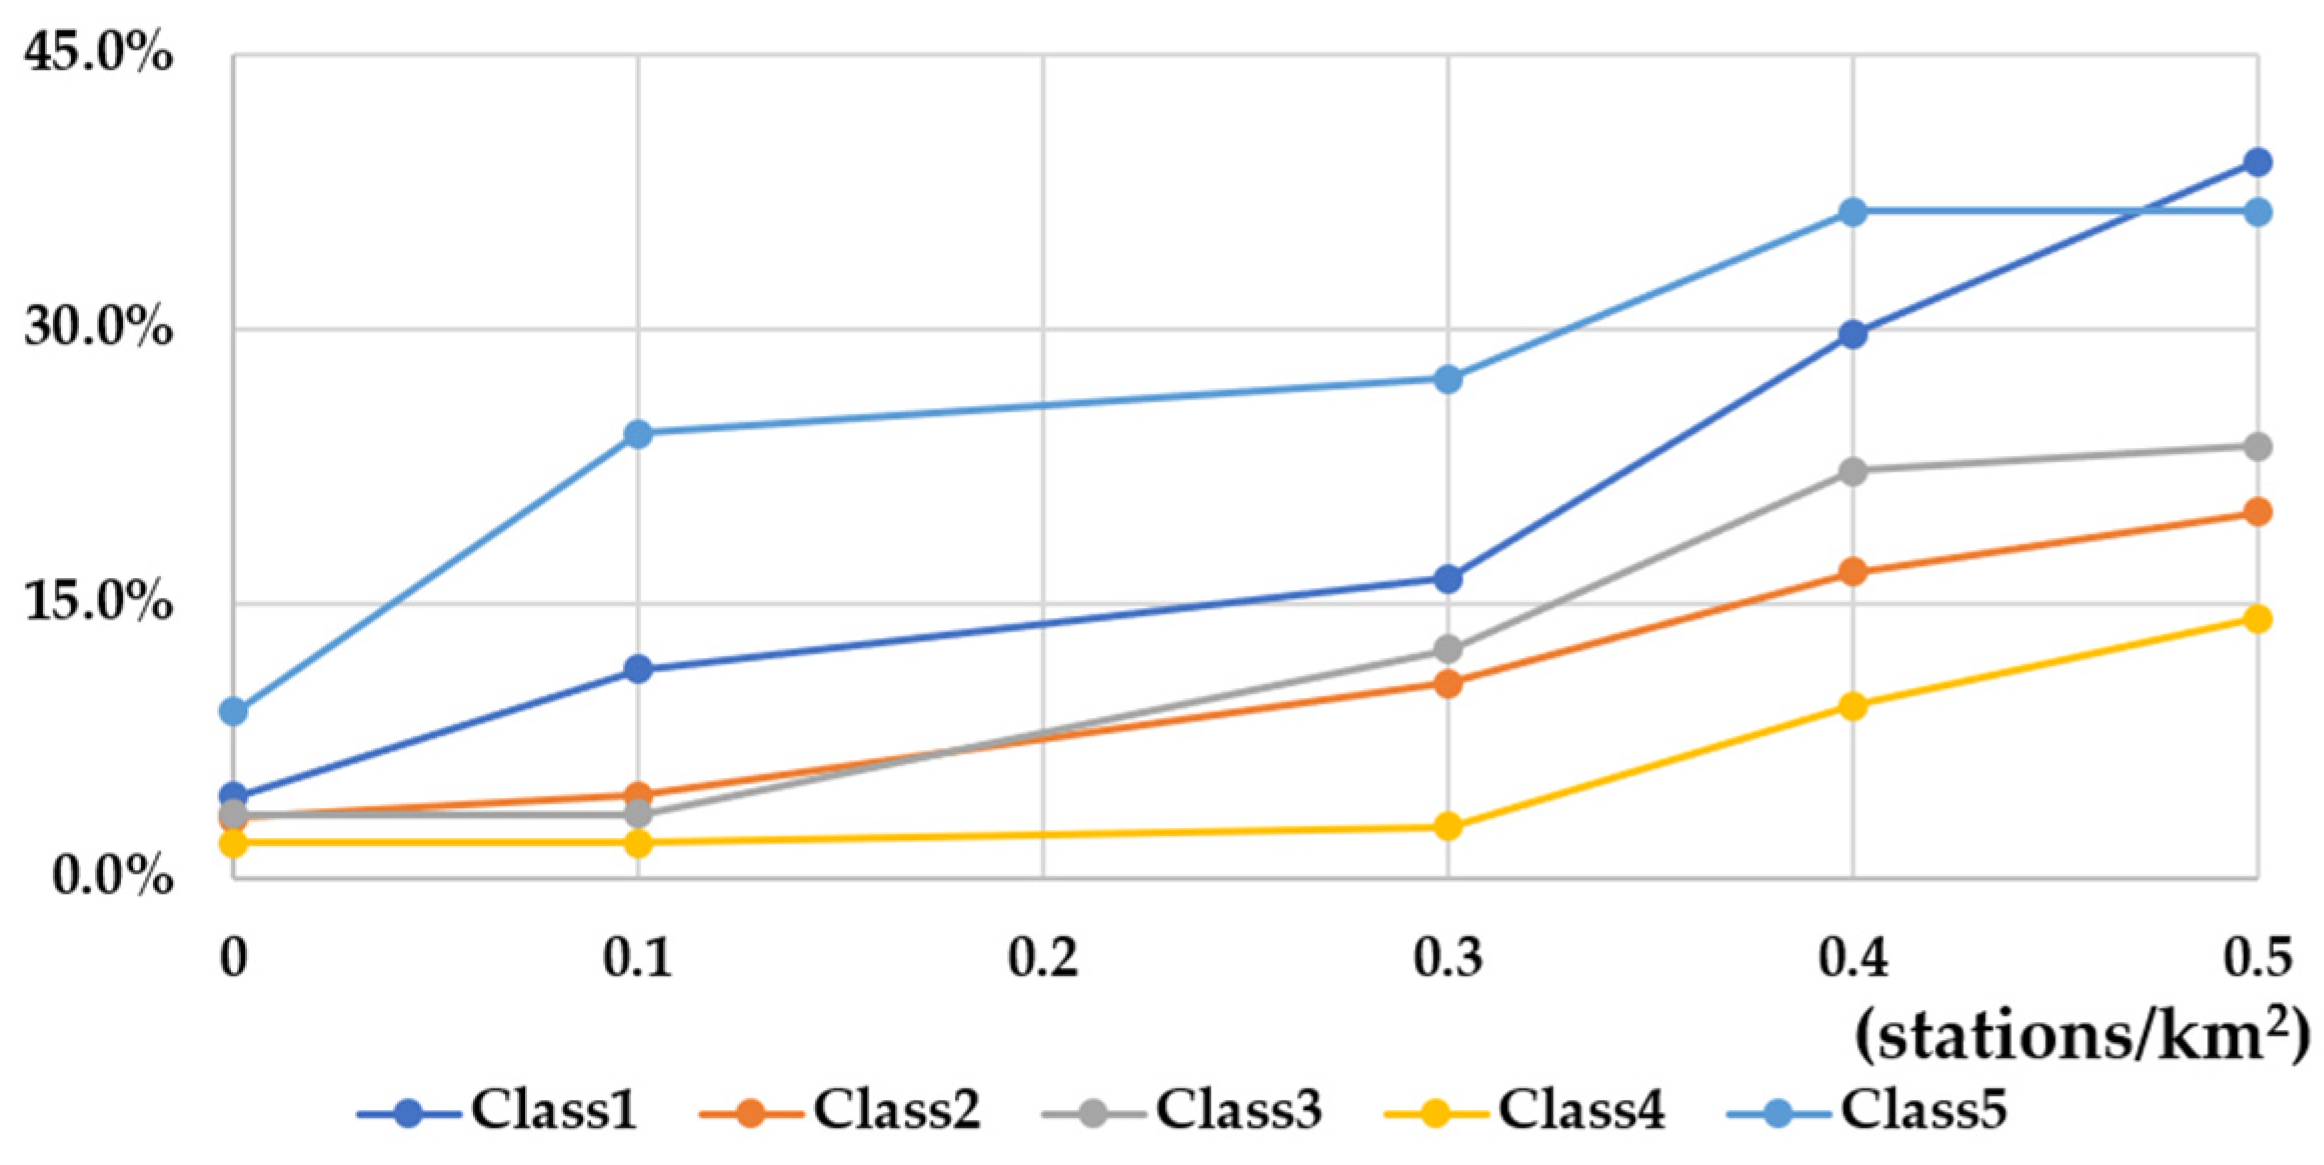
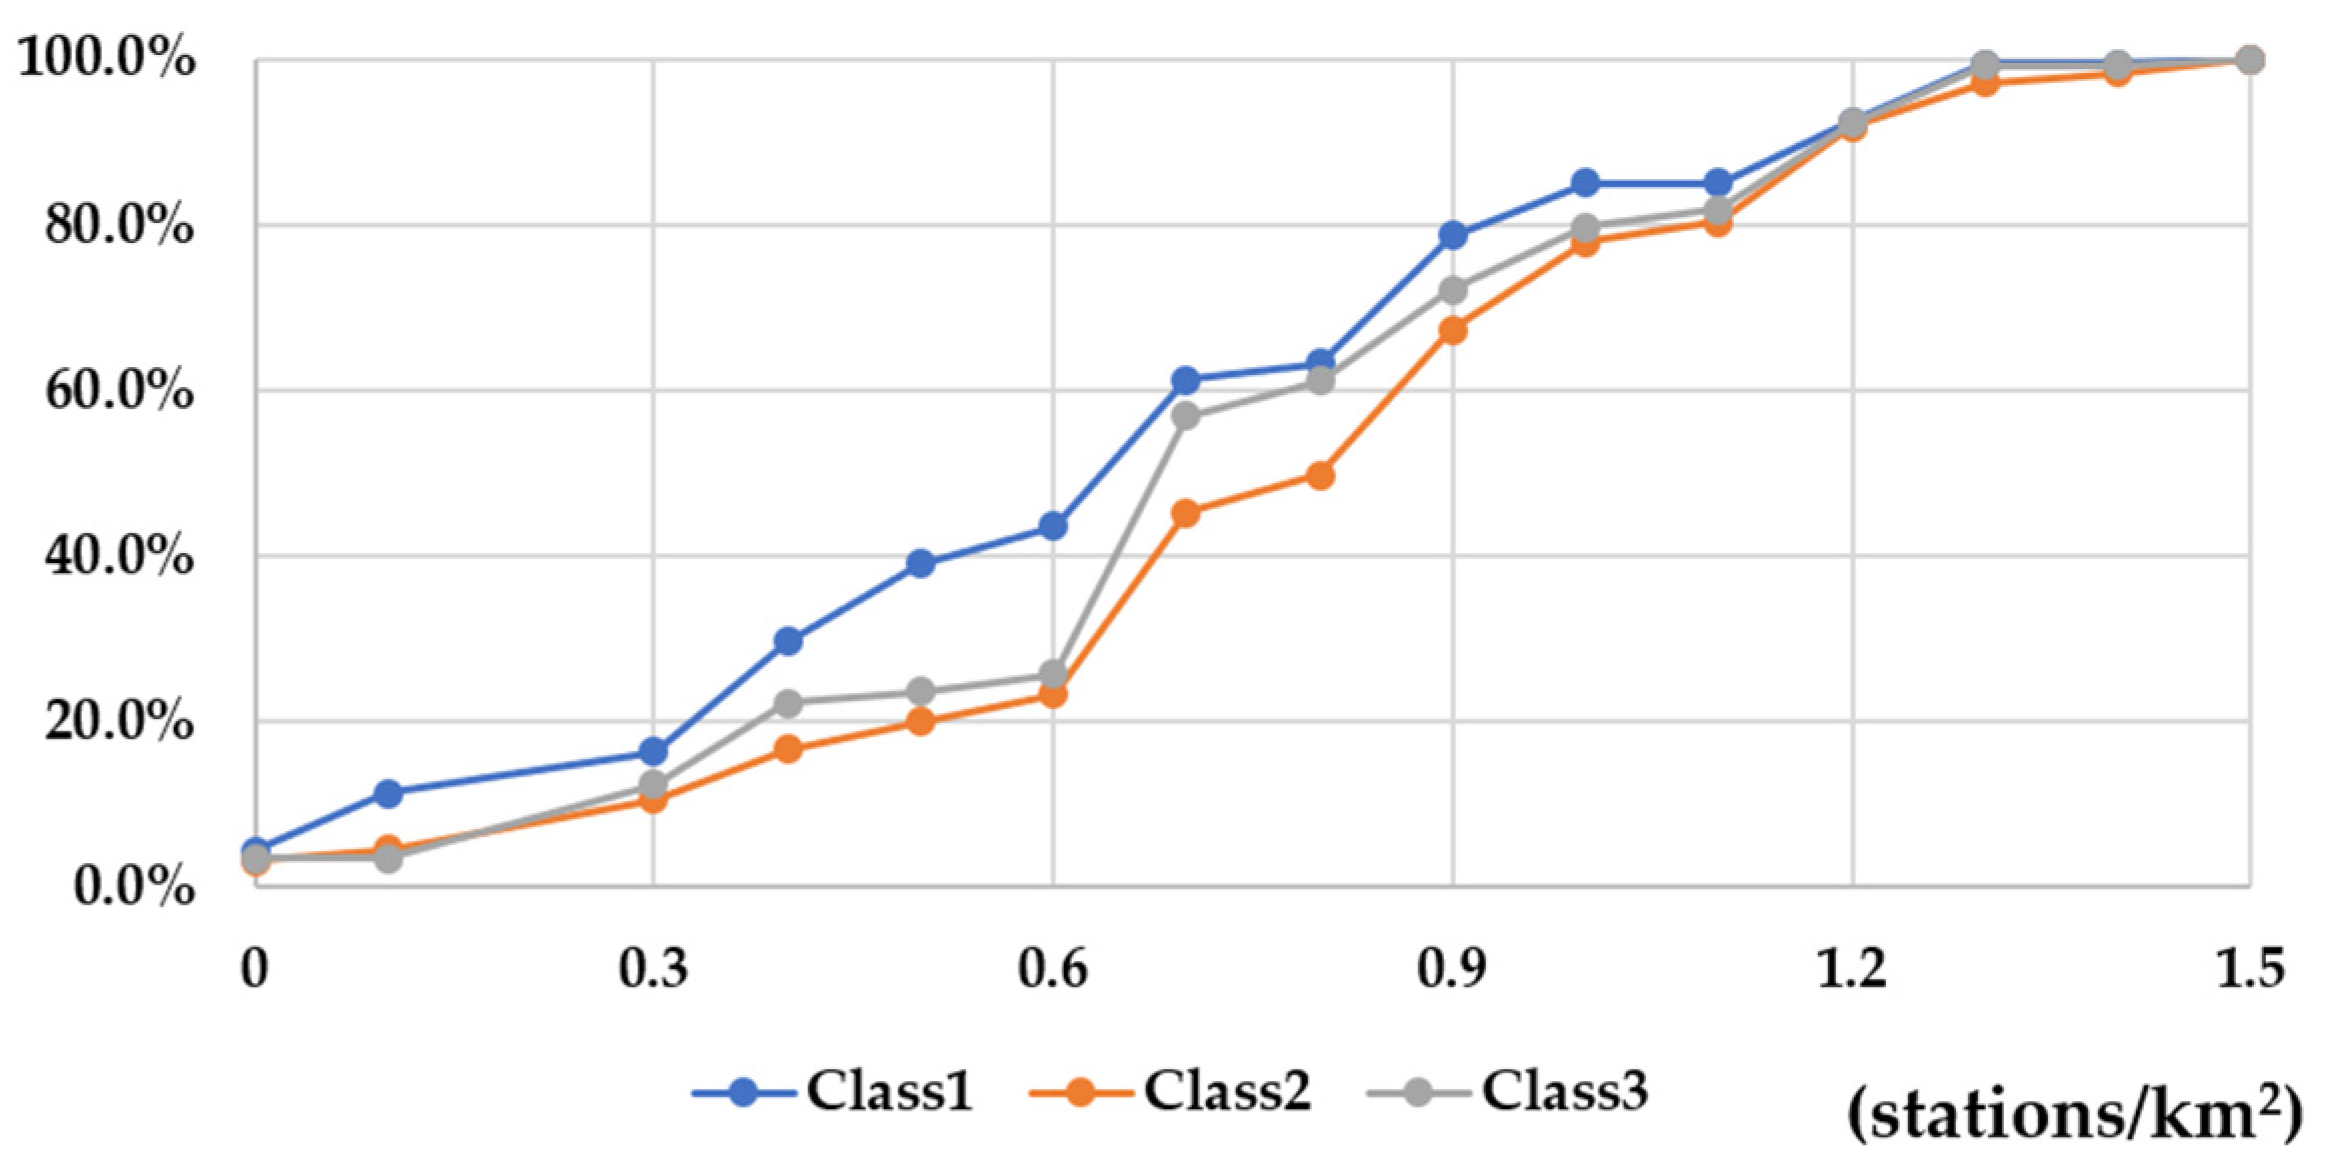
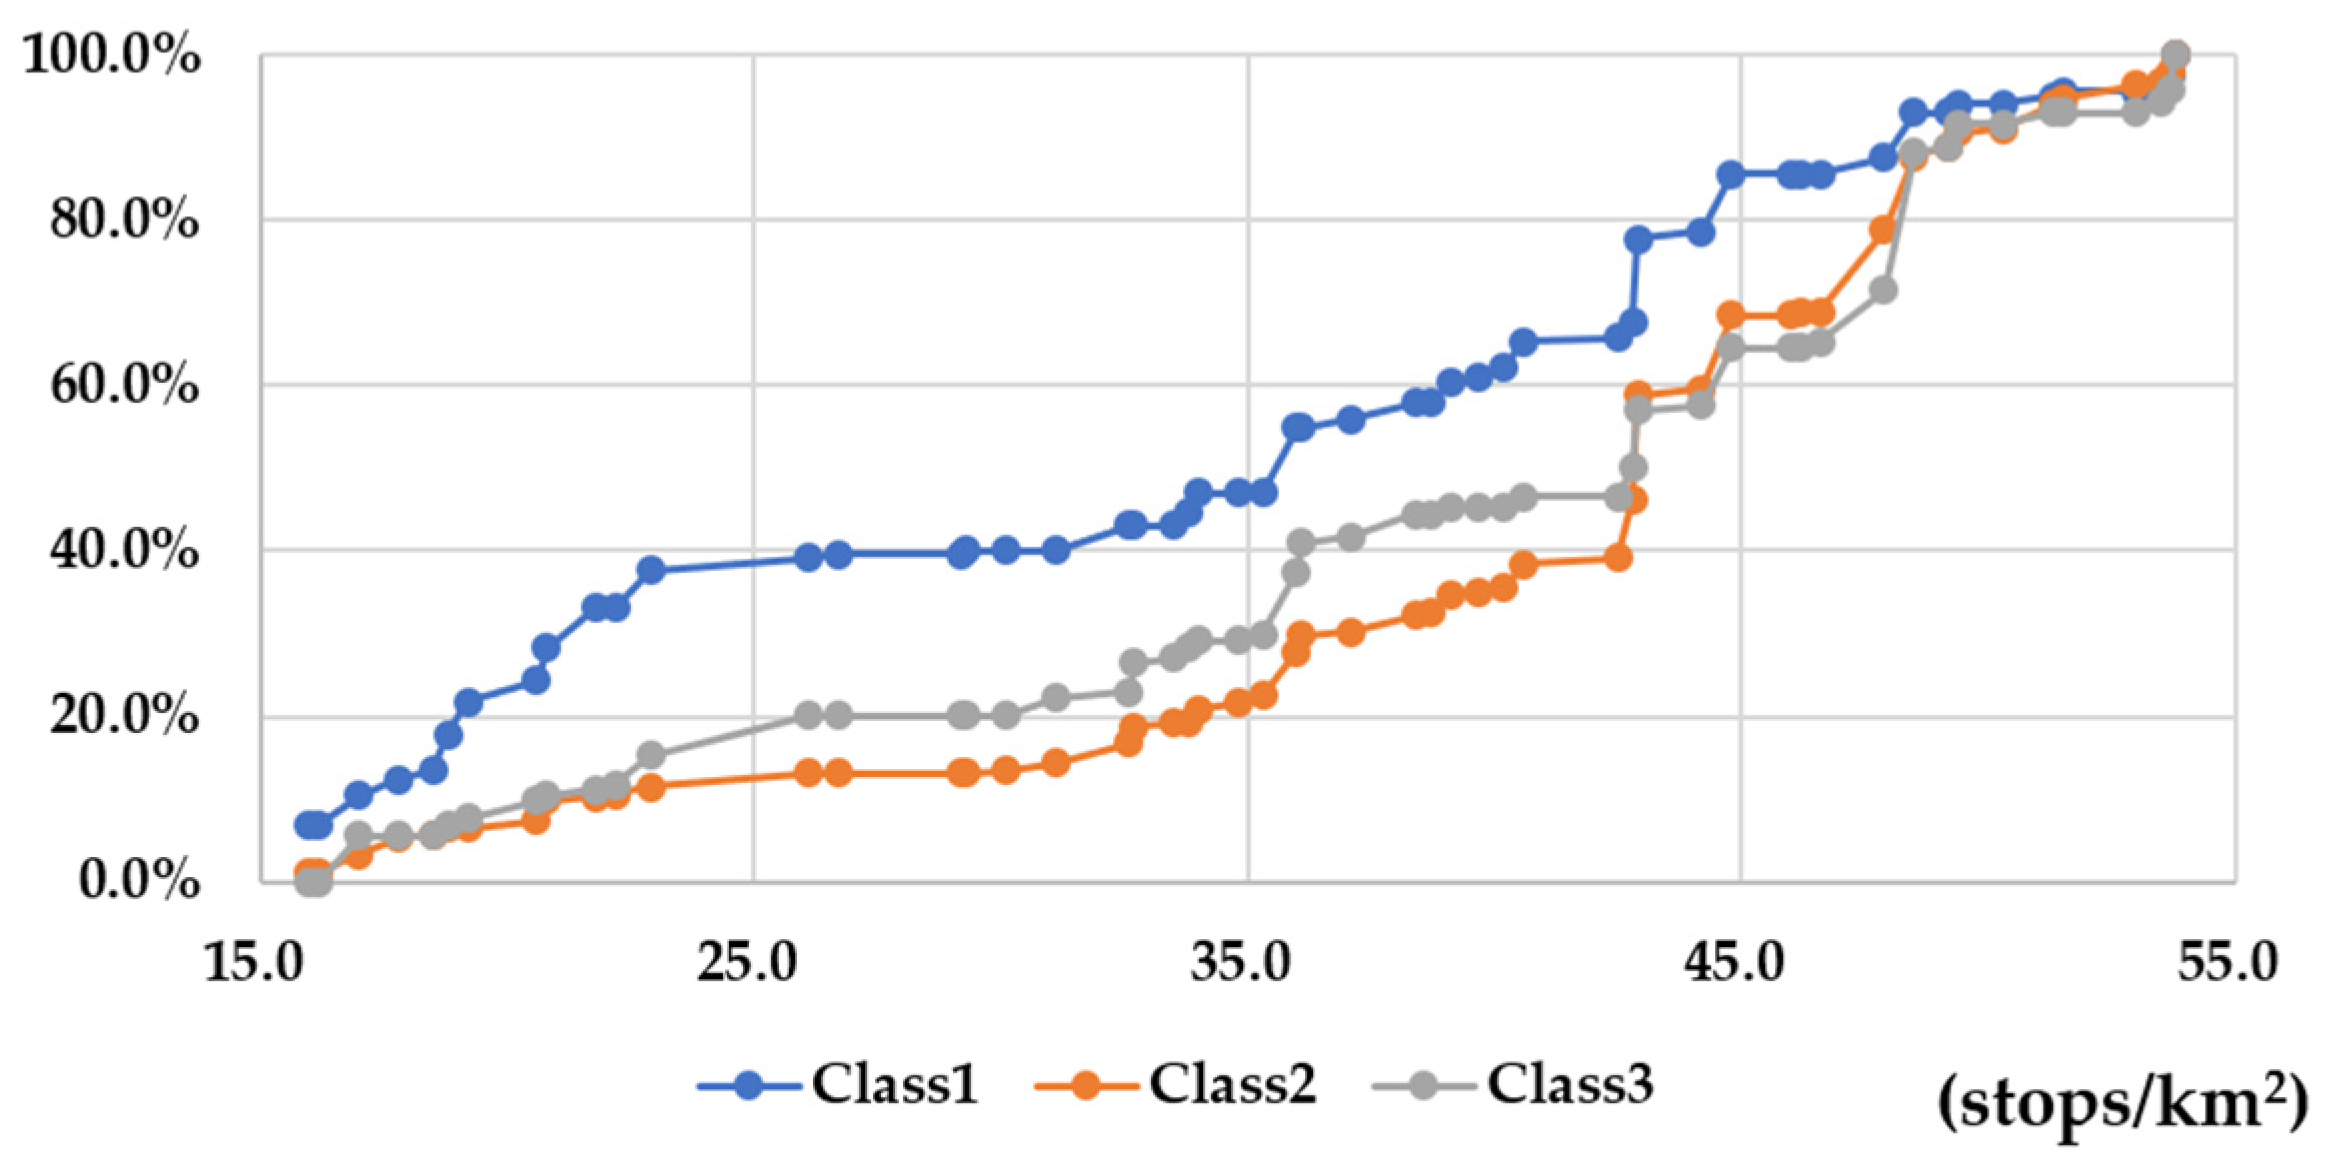
4.2. Findings Based on Regional Attributes

The discrete choice model part’s alternative specific constant indicates that groups except class 5 prefer subways. The strengths of subways, such as travel time reliability and travel safety, are not considered in this study, and had a more significant impact than the inconvenience of access to subways. Figure 4 shows less than 0.5 stations/km2 among the cumulative distribution function for the density of subway stations in five classes. Class 5 prefers buses even if subway fares are lower because the proportion of respondents living in areas with low subway density is higher than that of other classes. Thus, the mode-shifting effect due to the fare discount policy will only be expected after sufficient infrastructure is supplied.
As shown in Table 10, the resistance to the out-of-vehicle time of class 2 leads to the opposite result of the hypothesis of this study. In the following two situations, the effect of extra time on the bus will be more significant than on the subway: The infrastructure of buses and subways is very similar, or the subway infrastructure is better than the bus. The cumulative distribution function of the density indicators of the three classes is shown in Figure 5 and Figure 6. As can be seen from the two figures, class 2 had a higher proportion of respondents living in a high stop and station density than other classes. In addition, as shown in Table 11, the proportion of residents living in Seoul, where the level of public transportation infrastructure distribution is high, was the highest among the three classes. Hence, the effects of out-of-vehicle hours on older people in areas where public transportation is well distributed are almost identical in the two travel modes. By contrast, class 1 and class 3, which are classes with relatively insufficient infrastructure distribution, were consistent with this study’s hypothesis that the influence of out-of-vehicle time on the subway was higher than on the bus. In addition, the ratio of the out-of-vehicle time coefficient of the two traffic modes was similarly derived, and the behavior of the two groups was different in the value of out-of-vehicle time.

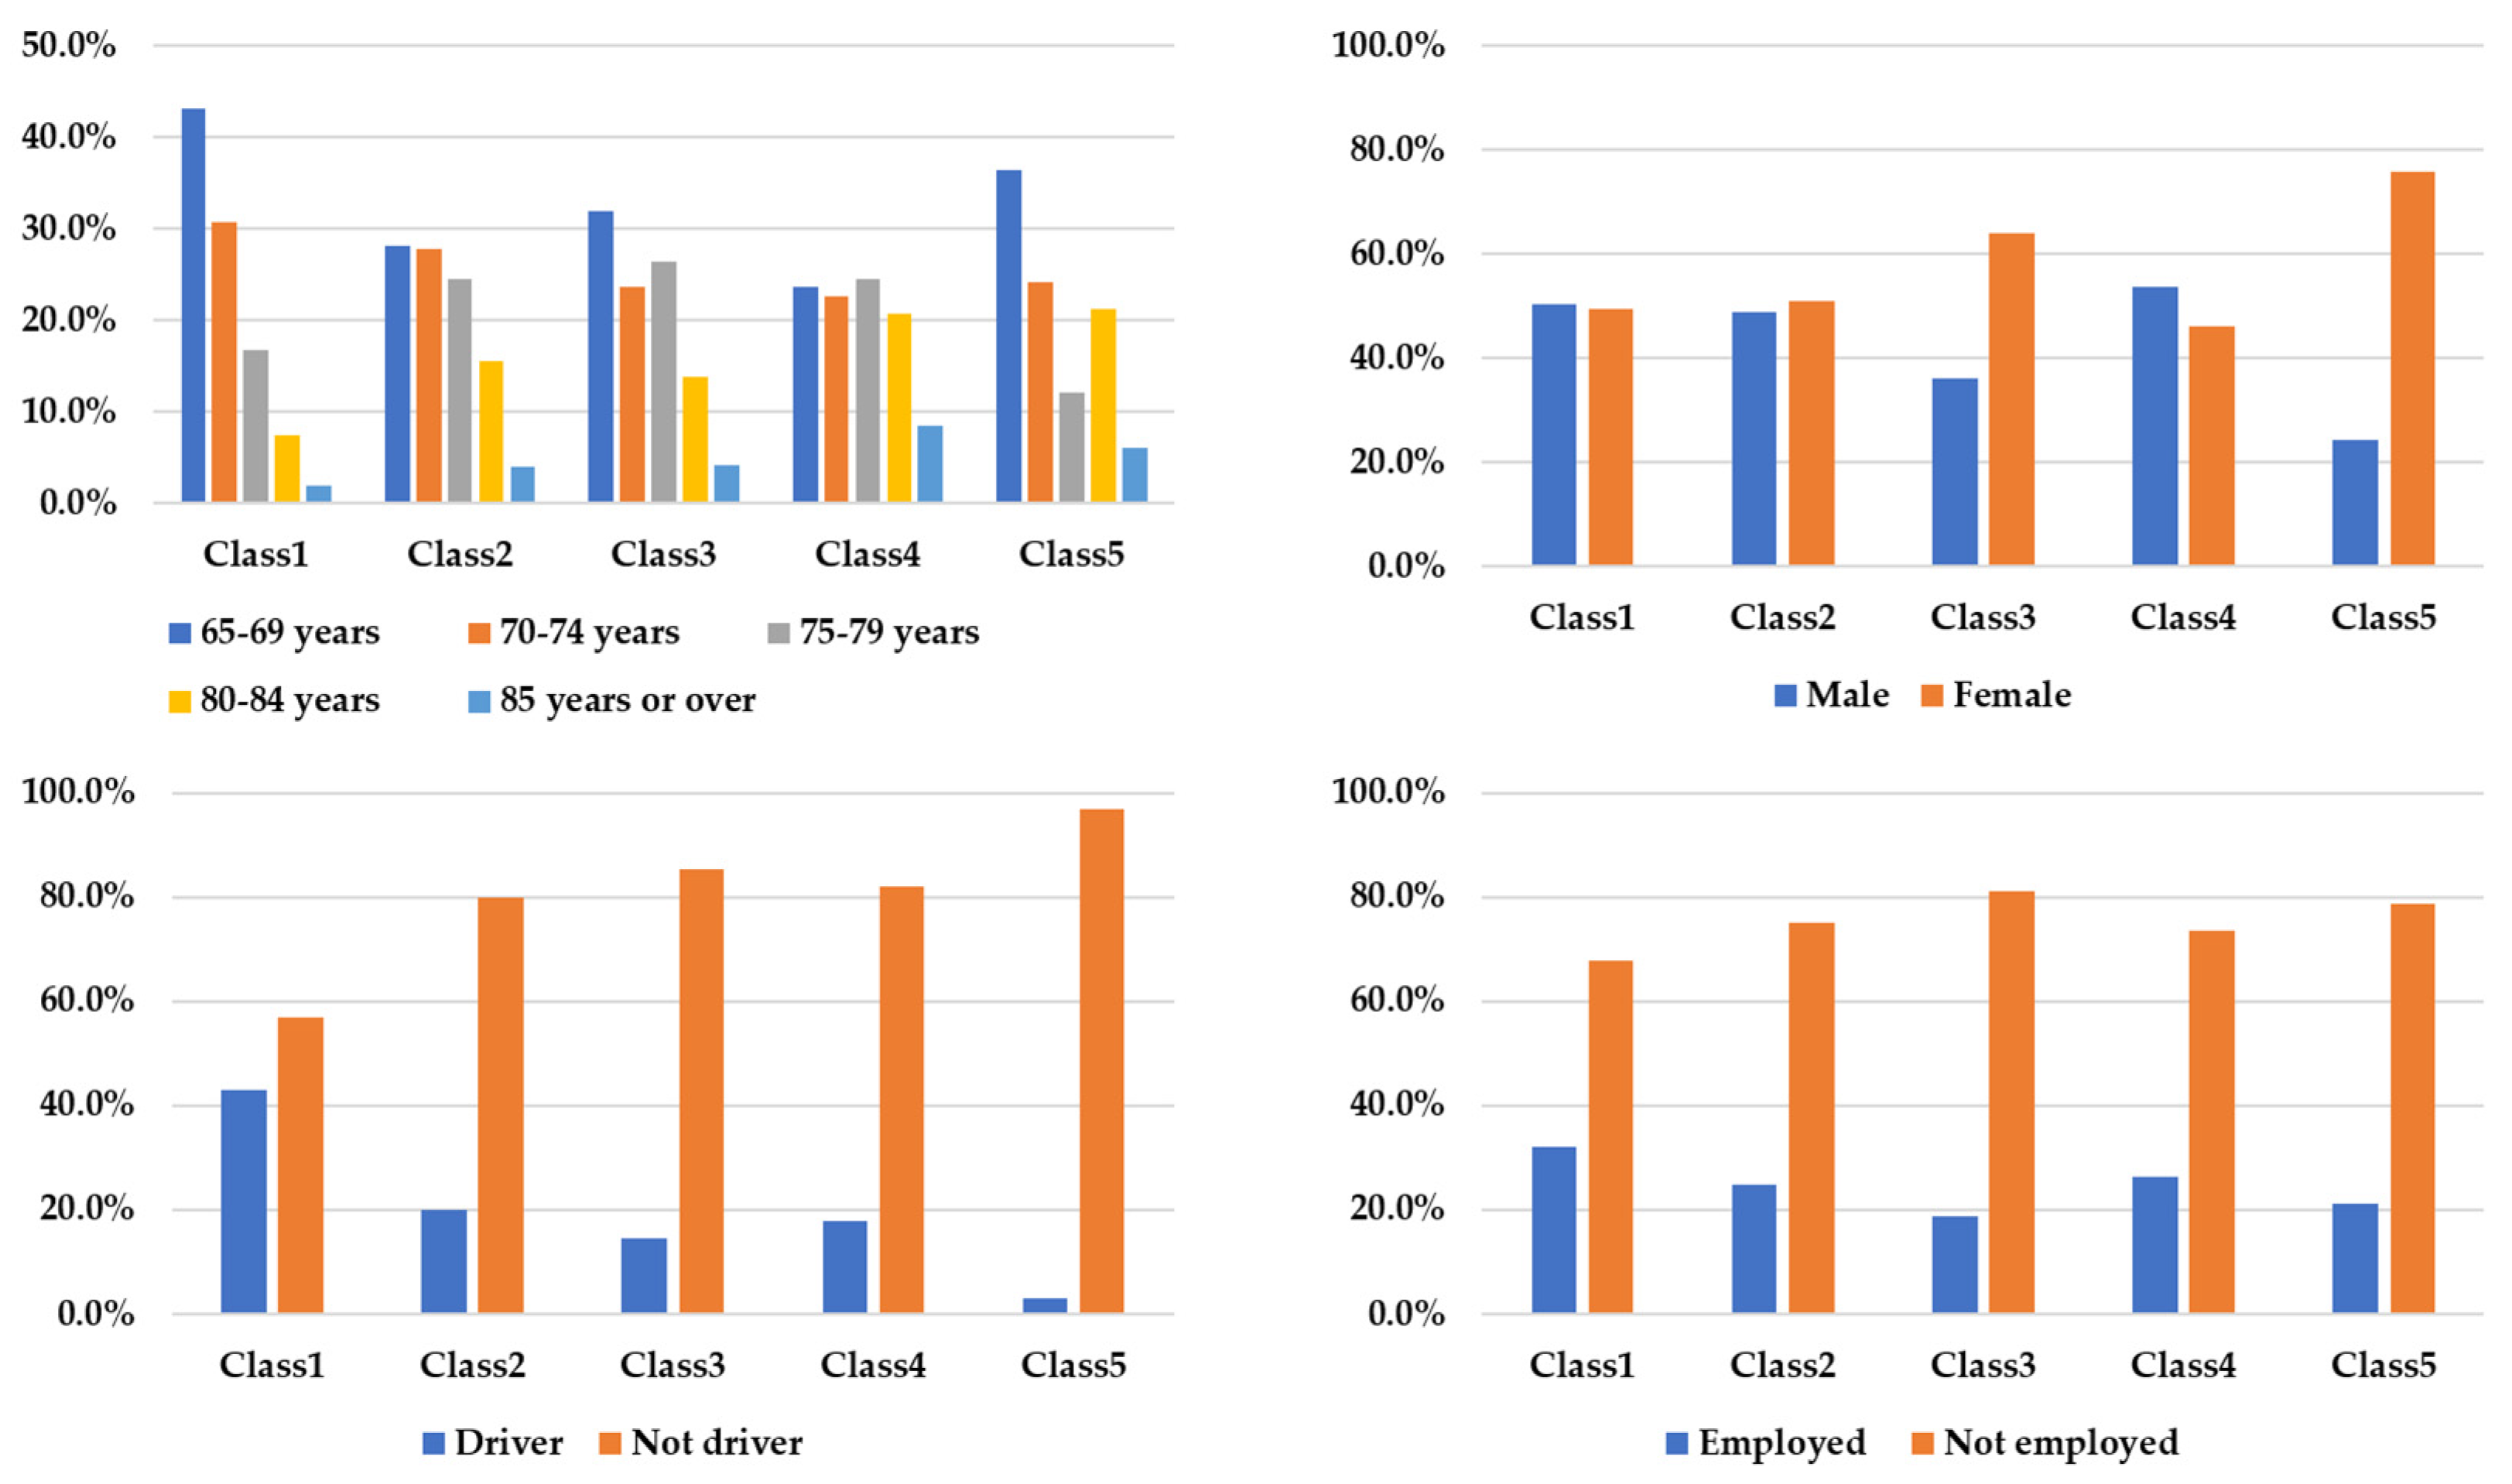
4.3. Findings Based on Personal Attributes

Figure 7 shows the distribution by class for the four attributes employed as membership variables. As shown in the membership part estimation results, there was no significant difference in the employment status distribution. On the other hand, class 3 and class 5 had a remarkably high proportion of females and most of the respondents who drove belonged to class 1. Finally, class 1 had a high distribution in the 65–69-year-old group, and there was no apparent difference in other age groups.
The estimation results for each class are summarized in Table 12. Table 12 refers to the average individual and regional attributes of respondents belonging to each class. The out-of-vehicle time values of class 4 and class 5 were excluded because the estimation results of the discrete choice model part were not significant. Class 1 has a high proportion of drivers and employed people because relatively younger respondents belong to it. On the other hand, class 3 has a personal attribute in contrast to class 1, and the subway density is relatively low. From the comparison between the two classes, the higher the age group, the lower the value of out-of-vehicle time, but the preference between buses and subways does not change significantly. Hence, class 1 and class 3 will mainly appear in cities with better bus infrastructure than subways. Since both classes were estimated to prefer buses, it would be reasonable for cities with these regional attributes to offer higher discount policies for buses rather than subways.
By contrast, class 2, which had many residents in Seoul, showed a different behavior from the above results. In particular, contrasting results were derived from the ratio between out-of-vehicle time coefficients, and it was found that subways were generally preferred. Thus, it would be reasonable for cities with a high subway density to provide discount policies for subways rather than buses.
Overall, the elderly’s preference for each travel mode depends more on regional attributes than personal attributes. In particular, it is inferred that accessibility to each travel mode had a significant influence, and the impact of personal attributes was small compared to regional attributes, although some important results were derived.

4.4. Discussions

Contrary to the assumption of this study that buses would be preferred under the same conditions due to the limitation of moving underground, the results found that the subway was generally expected to be preferred. The physical barriers to moving underground were expected to have a much more significant impact, as studies on the impact of access traffic factors on bus use have shown that physical barriers affect choice [37]. However, physical barriers to subway boarding are expected to be offset by other positive factors, as there have been few studies on the impact of physical barriers on the choice between different travel modes. In addition, there may be a preference for advanced transportation that is difficult to access because the current subway supply density has influenced the choice.

5. Conclusions

5.1. Contributions and Implications

This study proposed strategies for improving the fare-free public transportation policy for the elderly in consideration of personal and regional characteristics. Considering the aging society and budget constraints, a strategy for reforming public transportation welfare policies is essential. In this context, this study noted the preference for public transportation of the elderly and pointed out that regional attributes had a significant impact on choice. Generally, subways are less accessible to the elderly than ordinary users because they have to use stairs or elevators to board. Nevertheless, older people are analyzed to prefer the subway more, so even if the walking access time is longer, they are still likely to use the subway. Thus, focusing on the subway may be a better option than using the welfare budget for various travel modes. In conclusion, I suggest that while areas with excessively poor subway accessibility need to come up with additional fare-discount policies for buses, other areas have sufficient subway fare-discount policies. For example, providing additional discount policies only for trunk line bus routes that connect to the subway can provide sufficient benefits. This strategy is more economical than providing benefits for the entire public transportation system and can improve social equity for areas that receive little subway benefits. Finally, it will benefit the environment as organizing relatively unnecessary bus routes will be possible by concentrating demand for use on primary lines. By deriving the catchment area for the elderly at each subway station through the out-of-vehicle time coefficient in Table 7, the region that requires an additional discount policy can be selected.

5.2. Limitations and Future Research Direction

The regional attributes covered in this study are the density of stations in the urbanized area and the assumption that the stations are evenly distributed is included. Hence, for cities that operate only one or two subway lines, there is an over-estimated limitation in the catchment area of the subway. In future studies, it will be necessary to employ the ratio of the catchment area to the urbanization area as a regional attribute. In addition, a follow-up study will be needed to find out through panel analysis that preference behavior changes as age increases. As mentioned in Section 4, behavioral differences between groups differed significantly according to age, and it is necessary to track whether the younger group has the same behavior as the older group in the future. These follow-up studies can be a significant indicator to improve sustainability by strengthening policy flexibility for future changes. Finally, as mentioned in the discussion section, it is necessary to examine the physical barriers of subways and buses in detail. In the hypothetical experiment of this study, the access time to the two means was expressed in the same words, and it was expected that respondents would empirically understand the physical barriers of the two travel modes. Thus, in future research, it is necessary to investigate and analyze detailed factors such as whether elevators are provided and how many floors underground they should move.

Funding

This research received no external funding.

Institutional Review Board Statement

Not applicable.

Informed Consent Statement

Not applicable.

Data Availability Statement

The research data is unavailable.

Conflicts of Interest

The author declares no conflict of interest.

References

  1. Costa, J.; Alves, T.; Andrade, A.R.; Kalakou, S. Assessing efficiency in public service obligations in European air transport using Data Envelopment Analysis. Case Stud. Transp. Policy 2021, 9, 1783–1809. [Google Scholar] [CrossRef]
  2. Carter, D.R. Our work is never done: Examining equity impacts in public transportation. Transp. Res. Rec. 2021, 2675, 1–9. [Google Scholar] [CrossRef]
  3. Li, W.; Guan, H.; Qin, W.; Ji, X. Collective and individual spatial equity measure in public transit accessibility based on generalized travel cost. Res. Transp. Econ. 2023, 98, 101263. [Google Scholar] [CrossRef]
  4. Paraschi, E.P.; Poulaki, I. Assessing the performance of Public Service Obligations air routes in Greece: A two-stage DEA approach. Transp. Econ. Manag. 2023, 1, 94–103. [Google Scholar] [CrossRef]
  5. Abreu, J.; Fageda, X.; Jiménez, J.L. An empirical evaluation of changes in Public Service Obligations in Spain. J. Air Transp. Manag. 2018, 67, 1–10. [Google Scholar] [CrossRef]
  6. Lee, J.; Kim, J. Social equity analysis of public transit accessibility to healthcare might be erroneous when travel time uncertainty impacts are overlooked. Travel Behav. Soc. 2023, 32, 100588. [Google Scholar] [CrossRef]
  7. Collins, K.; Der Wartanian, R.; Reed, P.; Chea, H.; Hou, Y.; Zhang, Y. Social equity and public transit in the inland empire: Introducing a transit equity analysis model. Transp. Res. Interdiscip. Perspect. 2023, 21, 100870. [Google Scholar] [CrossRef]
  8. Perone, J.S. Advantages and Disadvantages of Fare-Free Transit Policy; University of South Florida: Tampa, FL, USA, 2002. [Google Scholar] [CrossRef]
  9. Tomeš, Z.; Fitzová, H.; Pařil, V.; Rederer, V.; Kordová, Z.; Kasa, M. Fare discounts and free fares in long-distance public transport in central Europe. Case Stud. Transp. Policy 2022, 10, 507–517. [Google Scholar] [CrossRef]
  10. Rye, T.; Mykura, W. Concessionary bus fares for older people in Scotland—Are they achieving their objectives? J. Transp. Geogr. 2009, 17, 451–456. [Google Scholar] [CrossRef]
  11. Freedom Pass Handbook, 2nd ed.; London Councils: London, UK, 2013.
  12. Public Transit Card Data. KoreaTransportation Safety Authority: Gimcheon, South Korea. 2022. Available online: https://stcis.go.kr (accessed on 1 August 2023).
  13. Korean Statistical Information Service (KOSIS). 2022. Available online: https://kosis.kr/eng (accessed on 1 August 2023).
  14. Taylor, B.D.; Tassiello Norton, A. Paying for Transportation: What’s a Fair Price? J. Plan. Lit. 2009, 24, 22–36. [Google Scholar] [CrossRef]
  15. Litman, T. Evaluating Transportation Equity: Guidance for Incorporating Distributional Impacts in Transport Planning; Victoria Transport Policy Institute: Victoria, BC, Canada, 2022. [Google Scholar]
  16. Lawlor, M.J. Federal urban mass transportation funding and the case of the Second Avenue Subway. Transp. Q. 1995, 49, 43–54. [Google Scholar]
  17. Brown, A. Not all fees are created equal: Equity implications of ride-hail fee structures and revenues. Transp. Policy 2022, 125, 1–10. [Google Scholar] [CrossRef]
  18. Linovski, O.; Manaugh, K.; Baker, D.M. The route not taken: Equity and transparency in unfunded transit proposals. Transp. Policy 2022, 122, 77–84. [Google Scholar] [CrossRef]
  19. Claire, P.; Dupont-Kieffer, A.; Palmier, P. Potential accessibility to the workplace by public transit and its social distribution in Lille, France: A scenario-based equity appraisal. Transp. Policy 2022, 125, 256–266. [Google Scholar] [CrossRef]
  20. Sen, S.; Charles, M.B.; Harrison, J.L. Usage-based road pricing and potential equity issues: A study of commuters in South East Queensland, Australia. Transp. Policy 2022, 118, 33–43. [Google Scholar] [CrossRef]
  21. Sun, Z.; John Zacharias, J. Transport equity as relative accessibility in a megacity: Beijing. Transp. Policy 2020, 92, 8–19. [Google Scholar] [CrossRef]
  22. Jin, T.; Cheng, L.; Wang, K.; Cao, J.; Huang, H.; Witlox, F. Examining equity in accessibility to multi-tier healthcare services across different income households using estimated travel time. Transp. Policy 2022, 121, 1–13. [Google Scholar] [CrossRef]
  23. Ghosh, T.; Kanitkar, T.; Srikanth, R. Assessing equity in public transportation in an Indian city. Case Stud. Transp. Policy 2022, 10, 2337–2349. [Google Scholar] [CrossRef]
  24. Zhao, P.; Yu, Z. Investigating mobility in rural areas of China: Features, equity, and factors. Transp. Policy 2020, 94, 66–77. [Google Scholar] [CrossRef]
  25. Zhu, H.; Guan, H.; Han, Y.; Li, W. A Study of Tourists’ Holiday Rush-Hour Avoidance Travel Behavior Considering Psychographic Segmentation. Sustainability 2019, 11, 3755. [Google Scholar] [CrossRef]
  26. Zhang, X.; Guan, H.; Zhu, H.; Zhu, J. Analysis of Travel Mode Choice Behavior Considering the Indifference Threshold. Sustainability 2019, 11, 5495. [Google Scholar] [CrossRef]
  27. Casado-Sanz, N.; Guirao, B.; Attard, M. Analysis of the Risk Factors Affecting the Severity of Traffic Accidents on Spanish Crosstown Roads: The Driver’s Perspective. Sustainability 2020, 12, 2237. [Google Scholar] [CrossRef]
  28. Hensher, D.A.; John, R.M.; Greene, W.H. Applied Choice Analysis; Cambridge University Press: Cambridge, UK, 2015. [Google Scholar]
  29. Zito, P.; Salvo, G. Latent Class Approach to Estimate the Willingness to Pay for Transit User Information. J. Transp. Technol. 2012, 2, 193–203. [Google Scholar] [CrossRef]
  30. Wen, C.-H.; Wang, W.-C.; Fu, C. Latent class nested logit model for analyzing high-speed rail access mode choice. Transp. Res. Part E Logist. Transp. Rev. 2012, 48, 545–554. [Google Scholar] [CrossRef]
  31. Eldeeb, G.; Mohamed, M. Quantifying preference heterogeneity in transit service desired quality using a latent class choice model. Transp. Res. Part A Policy Pract. 2020, 139, 119–133. [Google Scholar] [CrossRef]
  32. Choi, S.; Ko, J.; Kim, D. Investigating commuters’ satisfaction with public transit: A latent class modeling approach. Transp. Res. Part D Transp. Environ. 2021, 99, 103015. [Google Scholar] [CrossRef]
  33. Nguyen, N.T.; Miwa, T.; Morikawa, T. Response to the planned public transport system in Ho Chi Minh City: Analysis of latent classes. Clean Technol. Environ. Policy 2019, 21, 1925–1935. [Google Scholar] [CrossRef]
  34. Liu, J.; Zhong, S.; Huang, Y.; Wang, Z. How does the preference heterogeneity affect the elderly’s evaluation of bus accessibility? Evidence from Guangzhou, China. J. Transp. Health 2021, 22, 101094. [Google Scholar] [CrossRef]
  35. Bozdogan, H. Model selection and Akaike’s information criterion (AIC): The general theory and its analytical extensions. Psychometrika 1987, 52, 345–370. [Google Scholar] [CrossRef]
  36. Wedel, M.; Kamakura, W.A. Market Segmentation: Conceptual and Methodological Foundations, 2nd ed.; Kluwer Academic Publishers: Norwell, MA, USA, 2000. [Google Scholar]
  37. Hess, D.B. Access to Public Transit and Its Influence on Ridership for Older Adults in Two U.S. Cities. J. Transp. Land Use 2009, 2, 3–27. [Google Scholar] [CrossRef]
Figure 1. Conceptual framework.
Sustainability 15 14678 g001
Figure 2. Survey area.
Sustainability 15 14678 g002
Figure 3. The scatterplot of the two density indicators.
Sustainability 15 14678 g003
Figure 4. Cumulative distribution function of subway station density for all classes.
Sustainability 15 14678 g004
Figure 5. Cumulative distribution function of subway station density for three classes.
Sustainability 15 14678 g005
Figure 6. Cumulative distribution function of bus stop density for three classes.
Sustainability 15 14678 g006
Figure 7. The distribution by class for the four attributes.
Sustainability 15 14678 g007
Table 1. Socio-demographics and distribution of sample (N = 730).
VariableCategoryFrequencyDistribution (%)
GenderMale39153.6
Female33946.4
Agebetween 65 to 69 years23932.7
between 70 to 74 years19626.8
between 75 to 79 years 16222.2
between 80 to 84 years10214.0
85 years or over314.3
ResidenceSeoul32945.1
Busan11615.9
Daegu10314.1
Incheon8211.3
Gwangju506.8
Daejeon506.8
Household
income
less than 377.5 USD/month577.8
between 377.5 to 755 USD/month17223.6
between 755 to 1510 USD/month23031.5
between 1510 to 2265 USD/month16122.1
between 2265 to 3020 USD/month669.0
More than 3020 USD/month446.0
Employment
status
Employed20528.1
Unemployed52571.9
Driving
status
Driver17724.2
Not driver55375.8
Note: 1 million KRW = 755 USD.
Table 2. Attribute level.
AttributeLevel
Travel cost (USD)0.3, 0.6, 0.9
In-vehicle time (min)25, 30, 35, 40
Out-of-vehicle time (min)5, 10, 15, 20
Table 3. The example of stated choice experiments.
AttributesBusSubway
Travel cost0.6 USD0.3 USD
In-vehicle time30 min25 min
Out-of-vehicle time20 min20 min
Choice
Table 4. The distribution of density indicators in Seoul.
VariableCategoryFrequencyDistribution (%)
The density of subway stations
in urban areas (stations/km2)
less than 0.5 stations/km2312.0
between 0.5 and 1.0 stations/km21040.0
between 1.0 and 1.5 stations/km2936.0
between 1.5 and 2.0 stations/km228.0
more than 2.0 stations/km214.0
The density of
bus stops
in urban areas (stops/km2)
less than 35 stops/km2416.0
between 35 and 40 stops/km2624.0
between 40 and 45 stops/km2728.0
between 45 and 50 stops/km2520.0
more than 50 stops/km2312.0
Note: Urban area refers to areas requiring systematic development, maintenance, management, and preservation.
Table 5. The density indicators in six cities.
DistrictThe Density of Subway Stations
in Urban Areas (Stations/km2)
The Density of Bus Stops
in Urban Areas (Stops/km2)
Seoul1.04941.202
Busan0.57435.287
Daegu0.48617.715
Incheon0.43828.612
Gwangju0.16317.879
Daejeon0.22727.317
Note: Urban area refers to areas requiring systematic development, maintenance, management, and preservation.
Table 6. Attributes employed in the LCM model.
Attributes
Discrete choice model partIn-vehicle time, out-of-vehicle time, travel cost.
Class membership model partAge, gender, driving status, employment status,
density of subway stations in urban areas, and density of bus stops in urban areas.
Table 7. Quantitative fit of 1–6 latent class membership models.
Number of ClassesNumber of ParametersLLAICBICCAICρ2
15−2974.169 5958.339 5981.304 5963.339 0.340
217−2698.906 5431.813 5509.894 5448.813 0.514
329−2524.673 5107.346 5240.544 5136.346 0.586
441−2465.915 5013.830 5202.145 5054.830 0.651
553−2414.765 4935.530 5178.962 4988.530 0.679
665−2377.192 4884.384 5182.932 4949.384 0.713
Table 8. Estimation results of discrete choice model part.
AttributesClass 1Class 2Class 3Class 4Class 5
Coefficientp-ValueCoefficientp-ValueCoefficientp-ValueCoefficientp-ValueCoefficientp-Value
Constant (Bus)−0.47313 0.029
(*)
−2.23627 0.015
(*)
−1.15786 0.236 −3.59877 0.000
(***)
4.39818 0.016
(*)
Out-of-vehicle time (Bus)
(min)
−0.07001 0.000
(***)
−0.12609 0.003
(**)
−1.06068 0.005
(**)
0.03709 0.189 −0.13042 0.157
Out-of-vehicle time (Subway)
(min)
−0.09516 0.000
(***)
−0.12554 0.042
(*)
−1.46962 0.003
(**)
0.00553 0.390 −0.02889 0.352
In-vehicle time
(min)
−0.03539 0.000
(***)
−0.08819 0.000
(***)
0.80961 0.014
(*)
−0.01411 0.311 −0.10597 0.189
Travel cost
(KRW)
−0.00146 0.000
(***)
−0.01215 0.000
(***)
−0.03457 0.001
(**)
−0.00255 0.000
(***)
−0.00191 0.010
(*)
Class shares31.3%29.5%19.2%15.6%4.4%
Note: *** An estimate whose p-value is less than 0.001. ** An estimate whose p-value is less than 0.01. * An estimate whose p-value is less than 0.05.
Table 9. Estimation results of class membership model part.
AttributesClass 1Class 2Class 3Class 4Class 5
Coefficientp-ValueCoefficientp-ValueCoefficientp-ValueCoefficientp-ValueCoefficientp-Value
Age
(year)
−0.04940 0.191 −0.01926 0.353 −0.03822 0.253 0.00825 0.391 --
Gender
(male = 1)
0.63270 0.202 0.90848 0.0840.45444 0.277 1.05780 0.059--
Driving
status
(driver = 1)
2.63002 0.033
(*)
1.88400 0.111 1.55523 0.172 1.87993 0.117 --
Employment
status
(employed = 1)
−0.44045 0.292 −0.21083 0.370 −0.54581 0.250 0.04605 0.398 --
The density of subway stations in urban areas (stations/km2)1.18972 0.126 1.08453 0.146 0.57986 0.304 2.01482 0.016
(*)
--
The density of bus stops in urban areas (stops/km2)−0.01056 0.361 0.04026 0.0940.03093 0.178 0.02912 0.206 --
Note: * An estimate whose p-value is less than 0.05.
Table 10. Coefficient ratio and out-of-vehicle time values.
Number of ClassesClass 1Class 2Class 3
Out-of-vehicle time (Bus)/Out-of-vehicle time (Sub)0.73569 1.004410.72174
Out-of-vehicle time value (Bus) (USD/hour)2.1900.4731.399
Out-of-vehicle time value (Sub) (USD/hour)2.9760.4711.939
Table 11. Percentage of respondents per city in 3 classes.
DistrictClass 1Class 2Class 3
Seoul28.7%51.0%34.0%
Busan15.8%17.6%17.4%
Daegu13.4%14.3%25.0%
Incheon21.3%6.5%11.8%
Gwangju14.4%2.4%2.8%
Daejeon6.4%8.2%9.0%
Table 12. Summary of characteristics per class.
DistrictClass 1Class 2Class 3Class 4Class 5
Age71.7
(5th)
74.1
(2nd)
73.7
(4th)
75.4
(1st)
74.0
(3rd)
Gender
(male = 1)
0.500.490.360.540.24
Driving status0.430.200.150.180.03
Employment status0.320.250.190.260.21
The density of subway stations in urban areas (stations/km2)0.68
(4th)
0.81
(2nd)
0.76
(3rd)
0.92
(1st)
0.65
(5th)
The density of bus stops in urban areas (stops/km2)17.19
(1st)
11.74
(4th)
13.64
(3rd)
11.57
(5th)
14.06
(2nd)
Out-of-vehicle time value1st3rd2nd--
Class share31.3%29.5%19.2%15.6%4.4%
Disclaimer/Publisher’s Note: The statements, opinions and data contained in all publications are solely those of the individual author(s) and contributor(s) and not of MDPI and/or the editor(s). MDPI and/or the editor(s) disclaim responsibility for any injury to people or property resulting from any ideas, methods, instructions or products referred to in the content.

