Article

A New Hydro-Mechanical Coupling Numerical Model for Predicting Water Inflow in Karst Tunnels Considering Deformable Fracture

1
China Railway Development Investment Group Co., Ltd., Kunming 650200, China
2
Guizhou Transportation Planning Survey & Design Academe Co., Ltd., Guiyang 550081, China
3
College of Civil Engineering, Guizhou University, Guiyang 550025, China
*
Author to whom correspondence should be addressed.
Sustainability 2023, 15(20), 14703; https://doi.org/10.3390/su152014703
Submission received: 3 July 2023 / Revised: 3 October 2023 / Accepted: 5 October 2023 / Published: 10 October 2023

Abstract

:
The accurate prediction of groundwater inflow in tunnels in karst regions has been a difficult problem to overcome for a long time. This study proposes an equivalent fracture model that takes into account unsaturated seepage and fracture deformation to predict tunnel water inflow, which is constructed based on the TOUGH-FLAC3D framework. The proposed model with complete failure mechanisms of fracture, including shear failure and tensile failure, was applied to predict the water inflow of the Jianxing Tunnel in Guizhou Province to verify its effectiveness. The results indicate that the proposed numerical model was found to be comparable to on-site observations in predicting inflow rate. The inflow rate in a fractured network reaches a steady state faster than that in a non-fractured network. There is a significant difference of 100 times between the highest transient rate and the stable rate between the fracture network and the non-fractured model. The excavation-induced stress redistribution resulted in slip fracture occurring within a distance of approximately 8.2 m from the tunnel wall, which can increase the fracture width and in turn increases the amount of water flowing into the tunnel by about 50%. In addition, this paper also analyzes the impact of the factors of fracture density, incline angle, stress anisotropy, and initial fracture width on the inflow rate during tunnel construction. The study emphasizes the significance of considering deformable fractures and provides valuable insights for improving numerical tools for inflow prediction during tunnel construction.

1. Introduction

The vast distribution of karst landforms in the southwestern region of China has brought serious challenges to transportation engineering construction [1,2]. Underground engineering in karst areas often encounters complex geological conditions, with well-developed karst fissures. Due to the construction of underground engineering, causing disturbance to the surrounding rock is inevitable, leading to the continued expansion of karst fissures. If the project is located in a water-rich area, it can also cause piping and confluence, leading to engineering accidents such as water and mud inrush [3,4,5,6,7]. As one of the major geological disasters in tunnel construction, karst water intrusion is characterized by its extreme suddenness, fast evolution of the disaster, and large impact range, ranking among the top geological disasters in terms of fatalities and occurrences in major tunnel accidents, both domestically and internationally. For example, the water and mud inrush accidents in the Yesanguan tunnel, as well as the collapse and water inrush accidents in the Xiangshan tunnel, all caused casualties and huge economic losses [8]. Therefore, analyzing the formation mechanism of karst water inrush disasters, mastering the safety critical conditions, and accurately predicting karst water inrush are important prerequisites for ensuring the safety of engineering construction. Moreover, As pronounced by ’Transforming Our World: The 2030 Agenda for Sustainable Development’, the disaster reduction is important content in sustainable development. Establishing a model for water inflow prediction in tunnels is critical for disaster reduction during tunnel construction.
Water inflow prediction in tunnels with complex geological conditions and construction disturbances is the most challenging issue in practical construction process [9]. Over the past two decades, numerous studies have been conducted to predict tunnel water inflow using different methods, including in situ observation analysis [10,11,12], large-scale model test [13,14,15,16], and numerical simulation [17]. For observation analysis, the main popular methods in practical engineering include the Goodman method [17], Raymer method [11], IMS method [10], etc. However, these methods only perform well under uniform isotropic seepage and stable flow conditions. When faced with complex geological environments such as faults, joints, and fractures, their prediction results are often unsatisfactory. Physical models can accurately reveal the inherent mechanism of water inrush disasters in tunnels, but they have strict size and boundary condition limitations, as well as high testing costs and long time consumption, which hinder their application in practical engineering [18]. In addition, with the development of artificial intelligence technology in recent years, many machine learning models have also been applied to water inflow prediction, such as artificial neural networks [19], support vector machines [20], gaussian process regression [21], etc. Although data-driven methods can achieve good prediction results, they rely on good data quality, and models often have strong randomness and cannot reflect the mechanism of tunnel water inrush, making it difficult for the prediction results to be convincing. Numerical simulation can effectively overcome the aforementioned shortcomings and achieve the accurate prediction of water inflow while revealing the mechanism of tunnel water inflow. At present, a large number of researchers are committed to this research work.
Numerical models for water inflow in tunnel construction can be categorized into three main categories: the continuous uniform method [22,23,24], the discrete fracture network (DFN) [25,26], and the equivalent discrete fracture network (EDFN) [27,28]. The continuous medium approach is commonly used to study water seepage in formations with homogeneous properties, where the properties of a porous medium, including many solid particles and pores, are homogenized and quantified within a representative unit volume [29]. However, as the tunnel traverses the fractured rock mass, the fracture network becomes the main conduit for controlling the water inflow in the tunnel. The fracture network characteristics can be modeled using explicit fracture and matrix elements in the discrete fracture network (DFN) model. Although the DFN model provides highly accurate results, the computational effort increases exponentially with the complexity of the geological structure. To balance computational consumption and accuracy, researchers have proposed several enhanced DFN (EDFN) models. For instance, Michael et al. [18] evaluated the timing and intensity of precipitation-induced tunnel inflow based on an EDFN model. Wei et al. [23] proposed an EDFN model to study the problem of steady seepage with free surfaces. However, previous research work has not adequately considered the mechanical response to fracture stress redistribution in tunnel construction.
This paper presents a new hydro-mechanical model to predict water inflow during tunnel construction based on an equivalent fracture network. The model takes into account fracture deformation caused by shear and tensile failure, as well as unsaturated flow within the fractures. The Jianxing Tunnel in Guizhou was used as a case study to demonstrate the effectiveness of the proposed model. Furthermore, the effects of fracture density, incline angle, stress anisotropy, and initial fracture width were analyzed through sensitivity analysis. The main innovation points of this paper are as follows: (1) a completely constitutive model including shear failure and tensile is integrated for fractures, and (2) unsaturated flow is considered in fracture networks.

2. Governing Equation

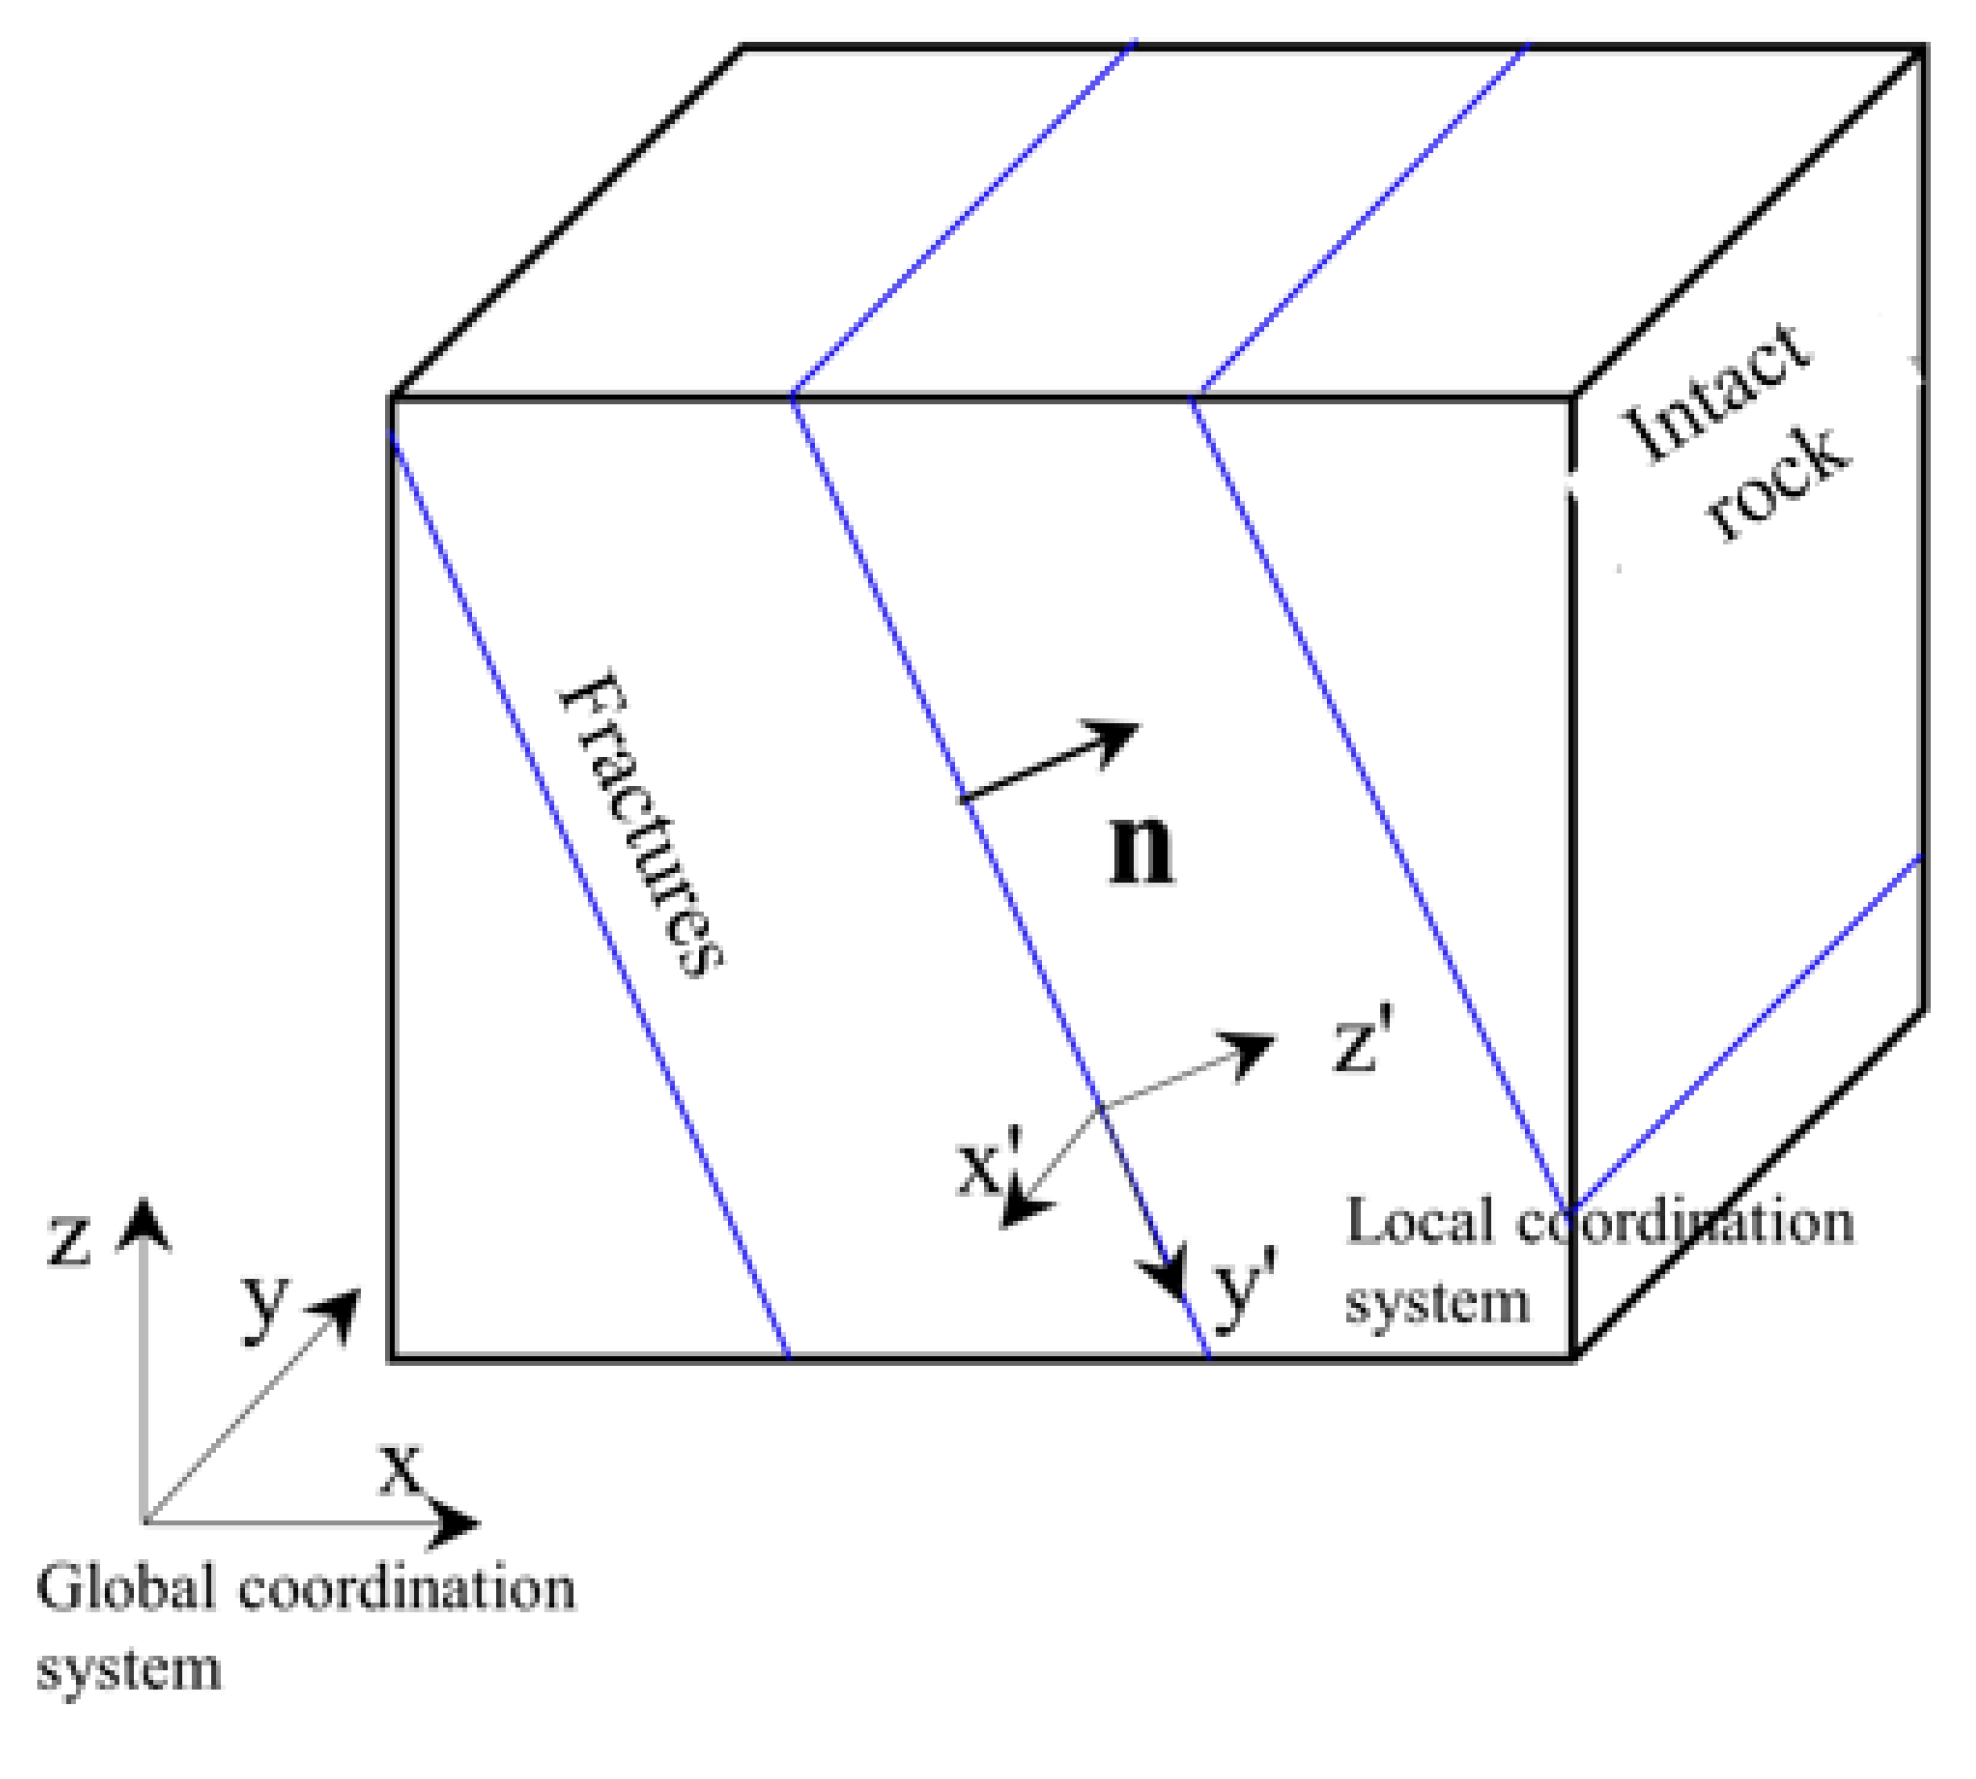
2.1. Mechanical Response

In this work, the fracture network is quantified through the porous medium, with permeability distributed mainly along the fracture direction. To model this behavior, the mechanical response of the porous medium was solved using the linear elastic theory, which is governed by the following important equilibrium and geometric equations.
σ i j , j + ρ g i = ρ v i t
ε i j = 1 2 t v i , j + v j , i
where σ is the stress (Pa); ρ is the density (kg/m3); g is the gravity (N/kg); v i is the steady of grid point (m/s); t is the time (s); and ε is the strain (-).
The relationship between effective stress and pore pressure ( p ) in a representative volume of the region can be expressed as
σ i j = σ i j α b p δ i j
where σ i j is the effective stress (Pa); p is the pore pressure (Pa); α b is the biot coefficient (-). α b p δ i j is the contribution of pore pressure on effective stress. The linear elastic constitutive equation is given in Equation (4).
ε k l = C k l i j σ i j
Here, C k l i j is a 4-order compliance tensor (1/Pa).
In the discrete model, elements are divided into intact and fractured elements. Intact rocks consist of pure matrix, while fracture elements consist of intact rocks and fractures. As shown in Figure 1, fractures are represented by two-dimensional planes containing information on location, topology, etc. In the fracture element, the deformation on the fracture and intact rock should be considered, and the total strain accumulated in the intact rock and fracture is shown below.
ε = ε I + ε f
ε I   a n d   ε f are strain on matrix and fractures, respectively. Correspondingly, the elastic flexibility tensor of the fractured rock is equal to the sum of the intact rock and the fracture.
C k l i j = C k l i j I + C k l i j f
The elastic compliance tensors of intact rock C k l i j I and fractures C k l i j f are given in Equations (7) and (8), respectively.
C k l i j I = [ ( 1 + ν ) δ i k δ j l ν δ i j δ k l ] E
C k l i j f = n = 1 m n k n L l J n D J L L L i n n j n S f
where D J L is stiffness tensor (Pa); L is the cosine of the angle between global and local direction (-); n is the normal direction vector (-); S f = A/V(m) is the fracture spacing; A is the area of fracture plane (m2); V is the volume of fracture host element (m3); i, j, k and l are subscripts in global system (x-y-z); and J and L are subscripts in local system (x′-y′-z′).

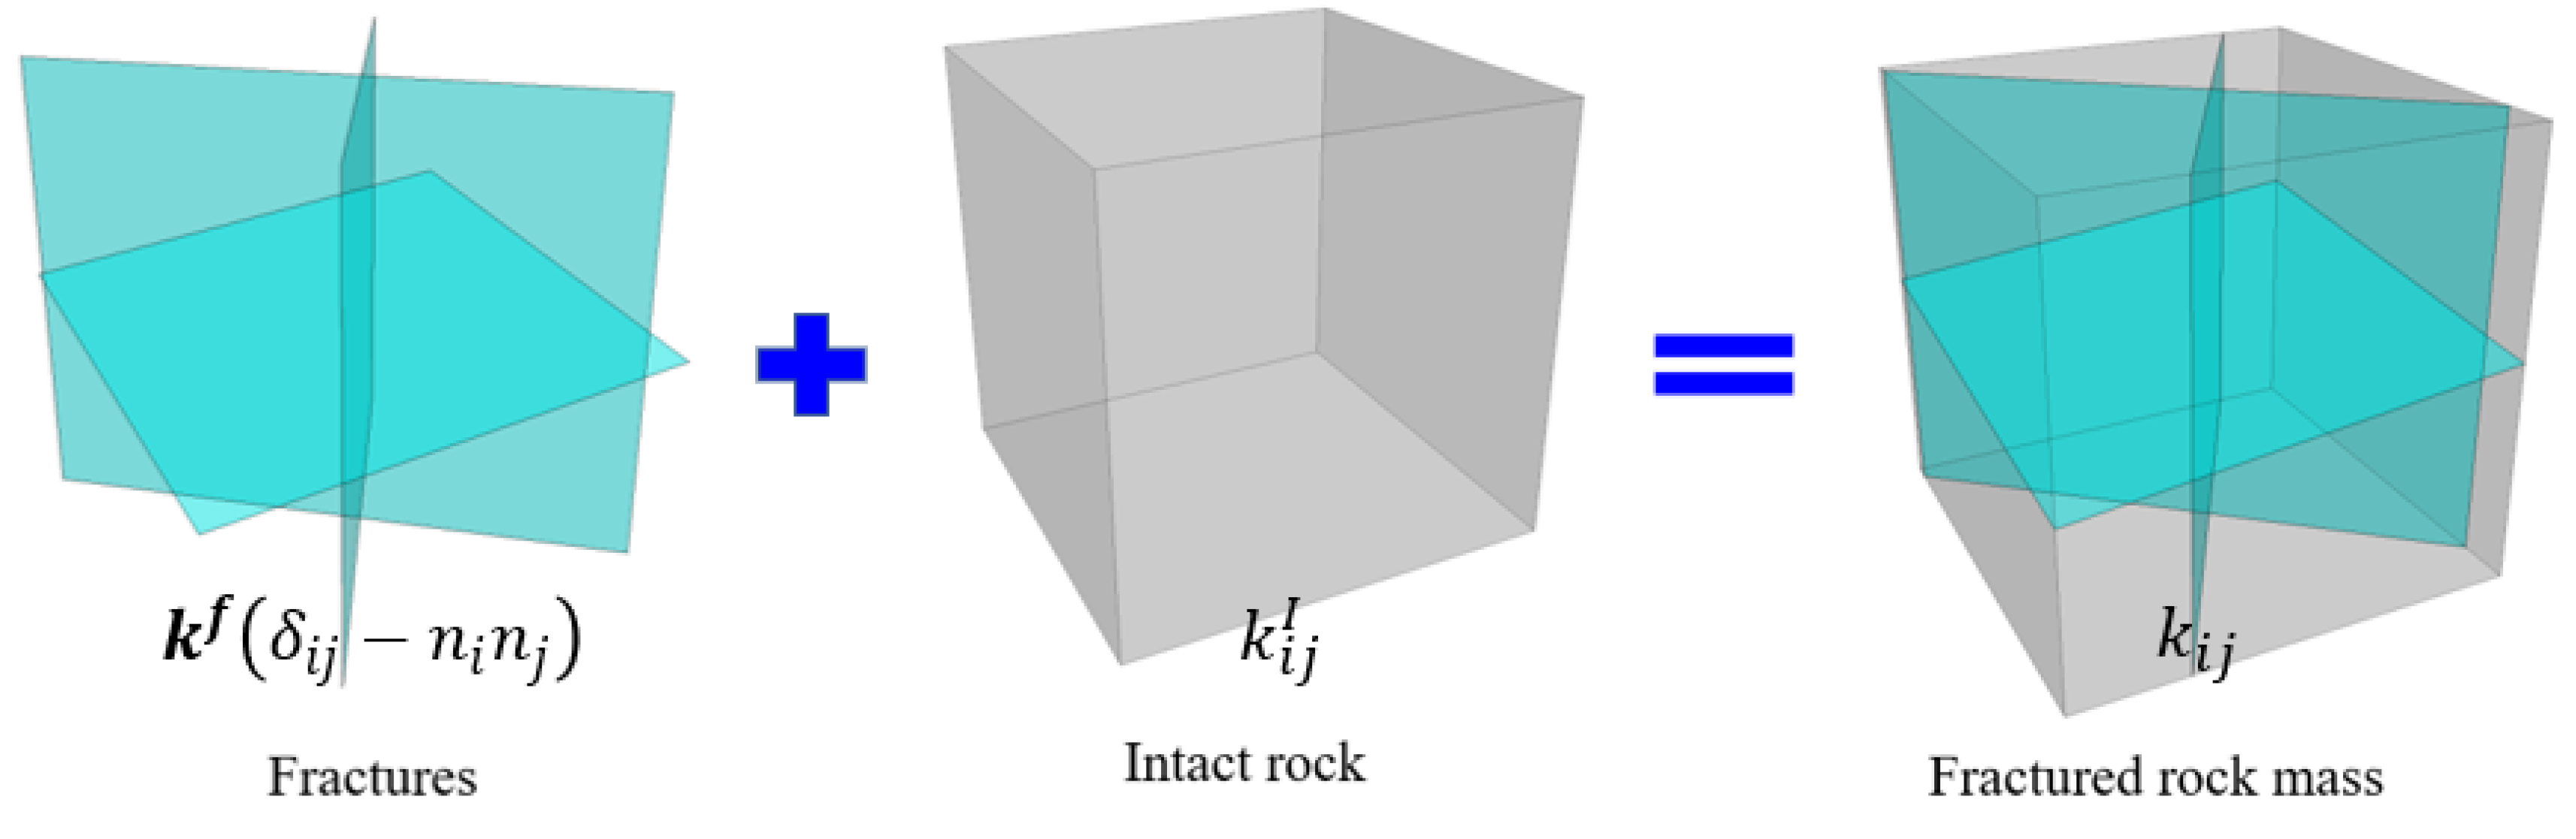
2.2. Constitutive Model for Fracture

The excavation of tunnels results in a redistribution of stresses in the surrounding rock, which is a key factor contributing to the variation in fracture width. When the normal compressive stress exceeds the fracture pressure, the fracture remains in contact; when the normal compressive stress is less than the fracture pressure, the fracture opens. Even when fractures are in contact, they remain somewhat conductive due to their roughness. The width of the contact zone fracture can be mathematically described using a hyperbolic function [30,31].
w = w i n i a σ n b + σ n
where w i n i is the initial fracture aperture under zero stress (m); σ n is the effective stress in normal direction (Pa). a and b are two parameters for fractures. The normal stiffness k n is deduced by the derivative of the effective stress with respect to fracture width.
k n = σ n w = b + σ n 2 a b
Under purely tensile or compressive stresses, the increase in fracture width increment can be estimated according to Equation (11).
w n = σ n k n                                             σ n > 0 a b σ n b + σ n 2                           σ n 0
As depicted in Figure 2, stress redistribution occurring during excavation leads to slip in the fissures surrounding the tunnel, resulting in an increase in fracture width under dilatation.
Shear expansion is another important mechanism for fracture width variation. Shear failure criteria are as follows:
f = a b s τ C + σ n t a n φ
Here, τ is the maximum shear stress on fracture (Pa); C is the cohesion of fracture (Pa); and φ is the friction angle (°). Once the shear failure occurs, the slip induced fracture width increment is calculated by Equation (13).
w d i l = u p l a s t a n ψ
Here, w d i l is the fracture width due to dilation (m); u p l a s is the shear displacement (m); ψ is the dilation angle of fracture (°). Total fracture width increment is given in the following:
Δ w = w n + w d i l

2.3. Unsaturated Flow

During tunnel construction, fractures provide high inflow channels for gushing water. As the overburden rock of the tunnel is directly connected to the atmosphere, fractures near the surface are particularly susceptible to unsaturated flow. This study takes into account both liquid and gas phase fluid flows in the fractures. The fractured rock mass is equivalent to a porous medium. In each control volume, the unsaturated flow is controlled by the mass exchange equation in Equation (15), where M κ is the mass per volume, F κ is the mass flux, and n is normal direction.
d d t V n   M κ d V n = Γ n   F κ · n d Γ n + V n   q κ d V n
where V n is the control volume (m3); Γ n is the boundary of control volume (m2); and q κ is the sink source (kg/s). The mass source and mass flux can be written as shown in Equations (16) and (17).
M κ = ϕ β S β ρ β X β κ
F κ = β X β κ ρ u β = β X β κ k k r β ρ β μ β p β ρ β g
where the κ denotes components, namely water–air in this work; β indicates the phase, liquid, and gas phase in this work; ϕ is the porosity (-); S β is the saturation of phase β (-); X β κ is the fraction of component κ in phase β (-); ρ β is the density of mixture in phase β (kg/m3); k is the permeability (m2); k r β is the relative permeability of mixture ion phase β (-); μ β is the viscosity of mixture in phase β (Pa·s); u β is fluid velocity (m/s); and g is gravity.
Fractures provide a high flux channel for fluids and the permeability of fractured element is determined by the fractures. Referring to Zhou et al. [32], the power law method was used to estimate permeability. As shown in Figure 3, the permeability of a fractured rock mass is equal to the sum of the permeability of the fractured and intact rock masses, as shown in Equation (18).
k i j = k i j I + k i j f = k i j I + n = 1 m 1 S f w 3 12 δ i j n i n j
Fracture deformation increases the porosity of the fracture body, approximated by:
ϕ = ϕ I + 1 V n = 1 m w A
where δ i j = 1             i f   i = j 0           i f   i j and n i and n j are the components of normal direction unit vector of fractures (-); A is the area of fractures plane (m2); V is the volume of fractured element (m3); and ϕ I is the origin porosity of intact rocks. These equations are formulated as finite difference method form, which is solved by using Newton iteration.

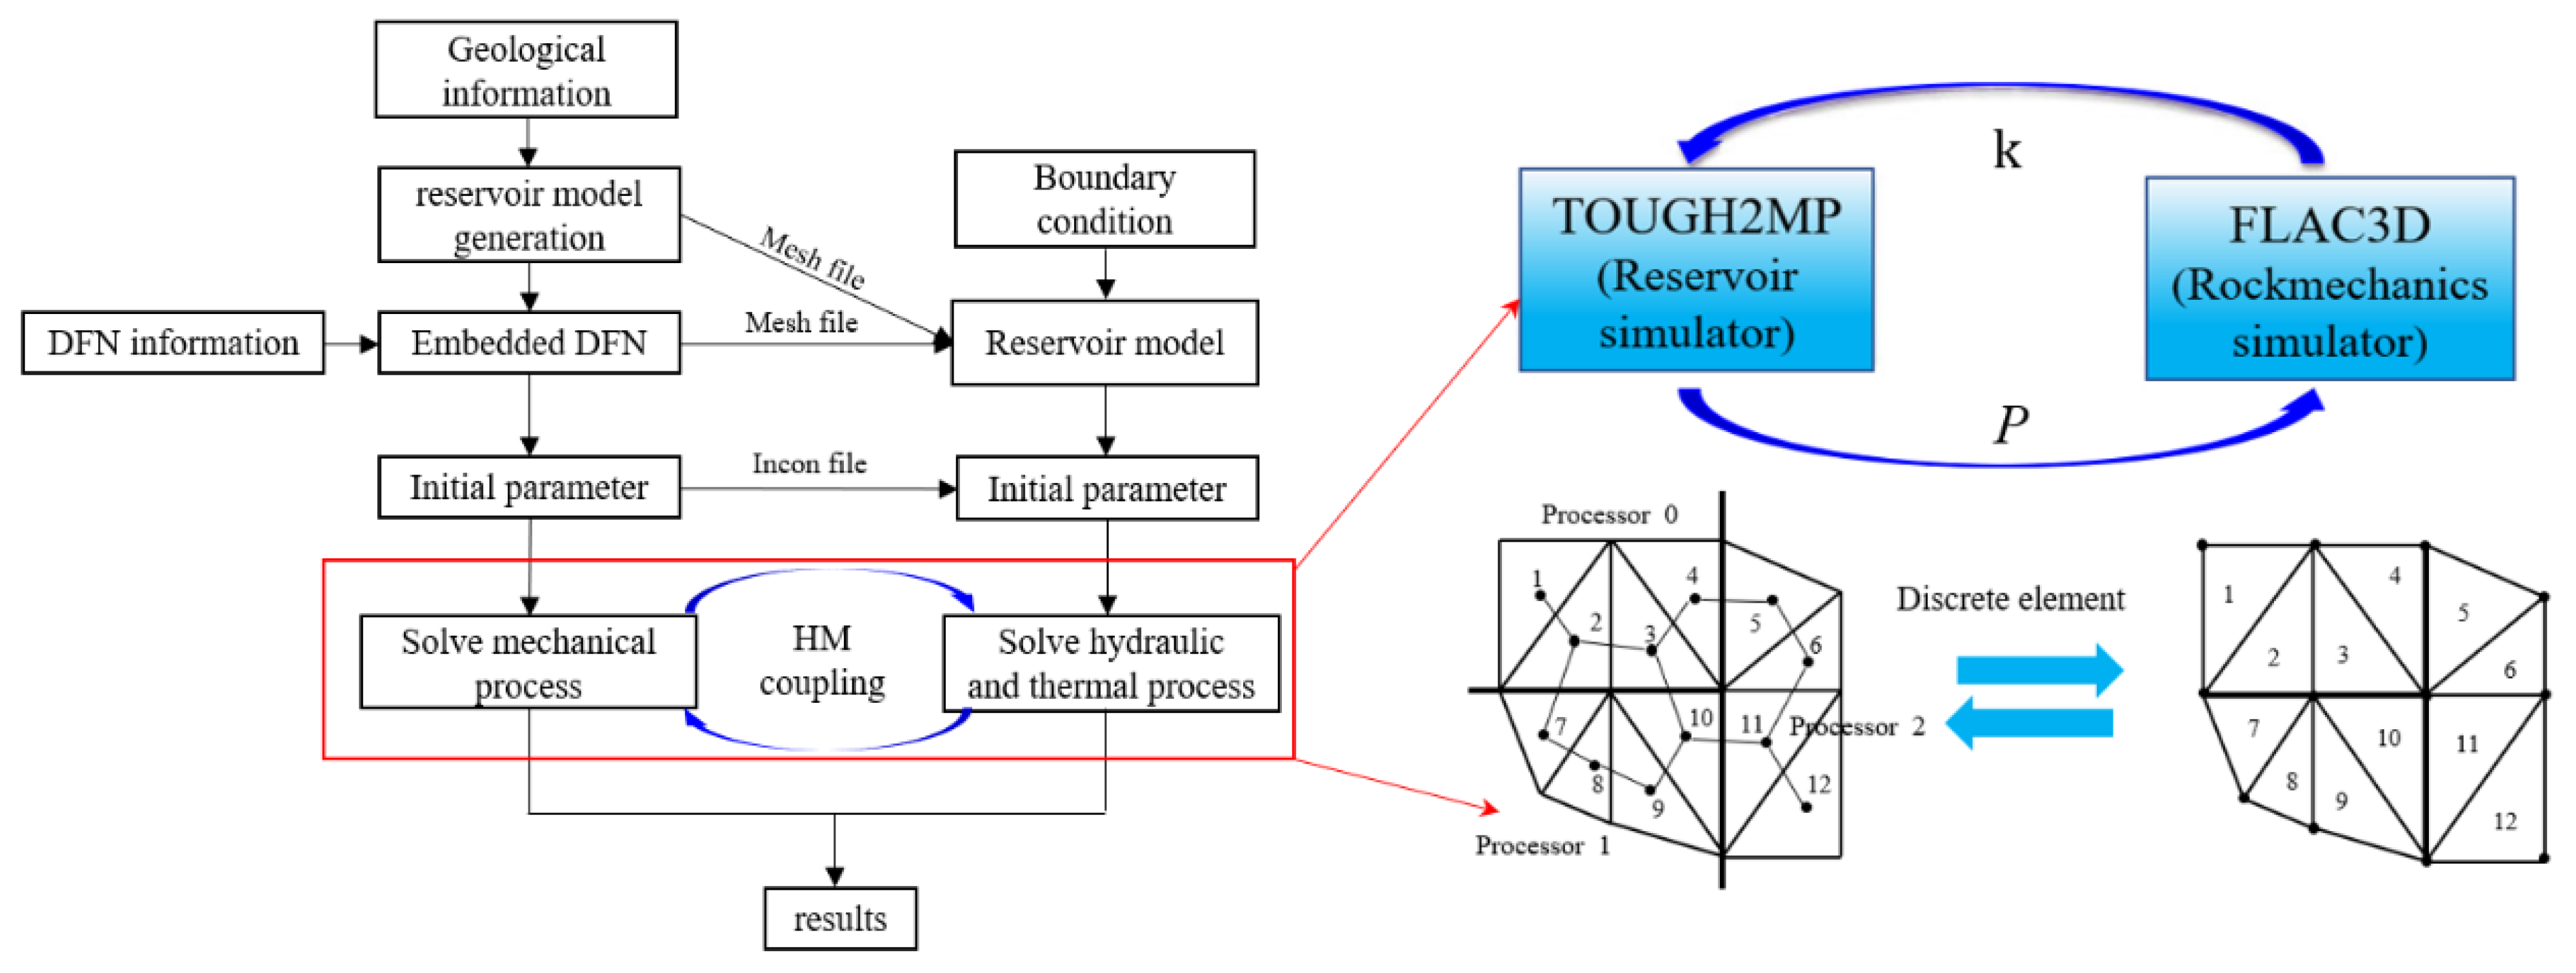
2.4. Hydro-Mechanical Coupling Process

The hydro-mechanical coupling schema for solving these equations is shown in Figure 4, using the loosely coupled HM coupling framework of TOUGH-FLAC3D [33,34]. The simulation procedure is presented as follows:
  • Generate model and mesh with geological information.
  • Generate embedded DFNs with DFN information including density and incline angle.
  • Initiate the mechanic parameter and configure the boundary condition in FLAC3D.
  • Prepare the input file, initiate hydraulic parameter, and configure the boundary condition in TOUGH.
  • Run the coupling framework of TOUGH-FLAC3D till the time limit.
  • Result evaluation.
In the coupling framework of TOUGH-FLAC3D, it is crucial to maintain strict consistency in the number of discrete cells and geometric information in both specifications. It should be noted that TOUGH calculated results based on the control points located at the center, while FLAC3D calculated results based on grid points. Therefore, FLAC3D data should be averaged at the center before being transferred to TOUGH. For more detailed information, refer to the literature by Liao et al. [35]. The permeability is initially allocated to each discrete element in TOUGH for pressure resolution, and then returned to FLAC3D for mechanical resolution.

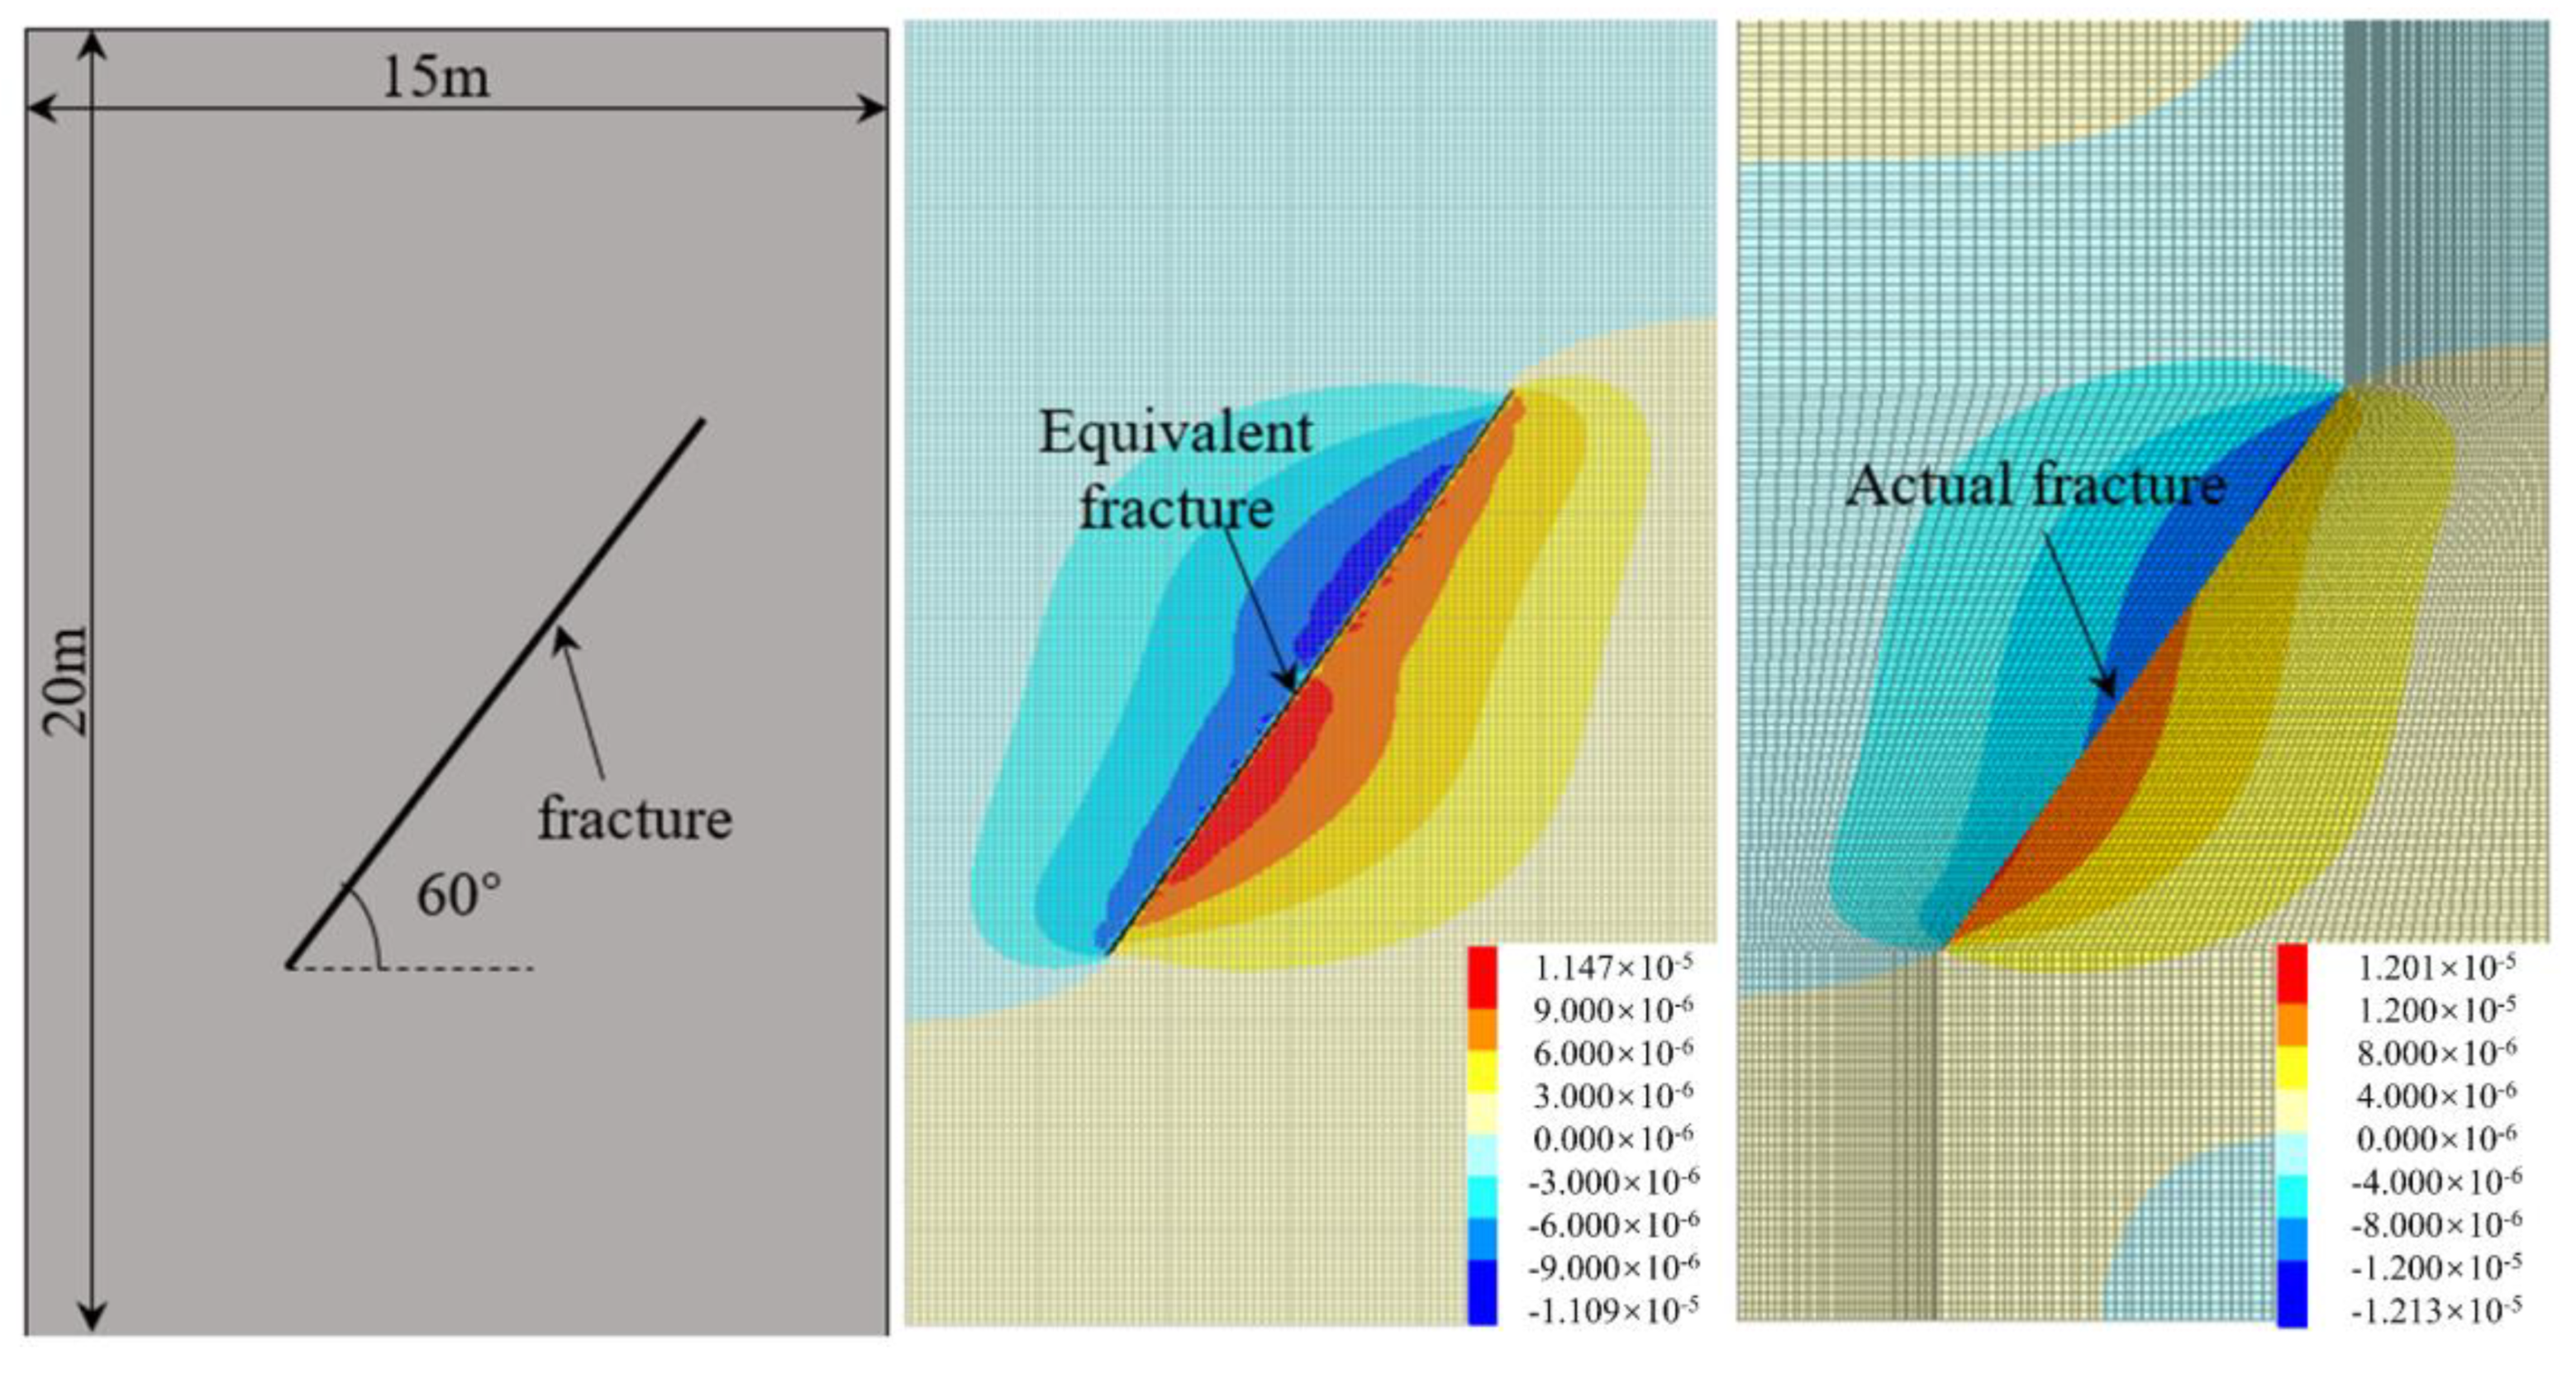
2.5. Fracture Shear Behavior Validation

To verify the reasonableness of the equivalent fracture model, the shear behavior of the fracture face was compared with that of the real fracture. The model information is shown in Figure 5, with a fracture dip of 60°, located in the middle of the model. In the real model the fracture is represented by explicit discrete element, while in the equivalent fracture model, the fracture is represented by an embedded two-dimensional plane. In both models, the displacements at the bottom and sides are fixed in the normal direction, and a compressive stress of 20MPa is applied at the top boundary. The Young’s modulus and the Poisson’s ratio are 40GPa and 0.25 respectively. The friction and dilatation angles are both set to 15°, and zero cohesion is applied at the fractures. Figure 5 compares the displacements in the x-direction for the two models. The displacements on each side of the fracture are in opposite directions, indicating that shear damage occurs at the fracture face. Clearly, the displacements around the real discrete fracture are more detailed than those around the equivalent fracture. Nevertheless, the displacements around the equivalent fracture capture the main characteristics of the real discrete fracture model, such as the values and the extent of distribution. Therefore, the accuracy of the shear behavior in the equivalent fracture is still acceptable.

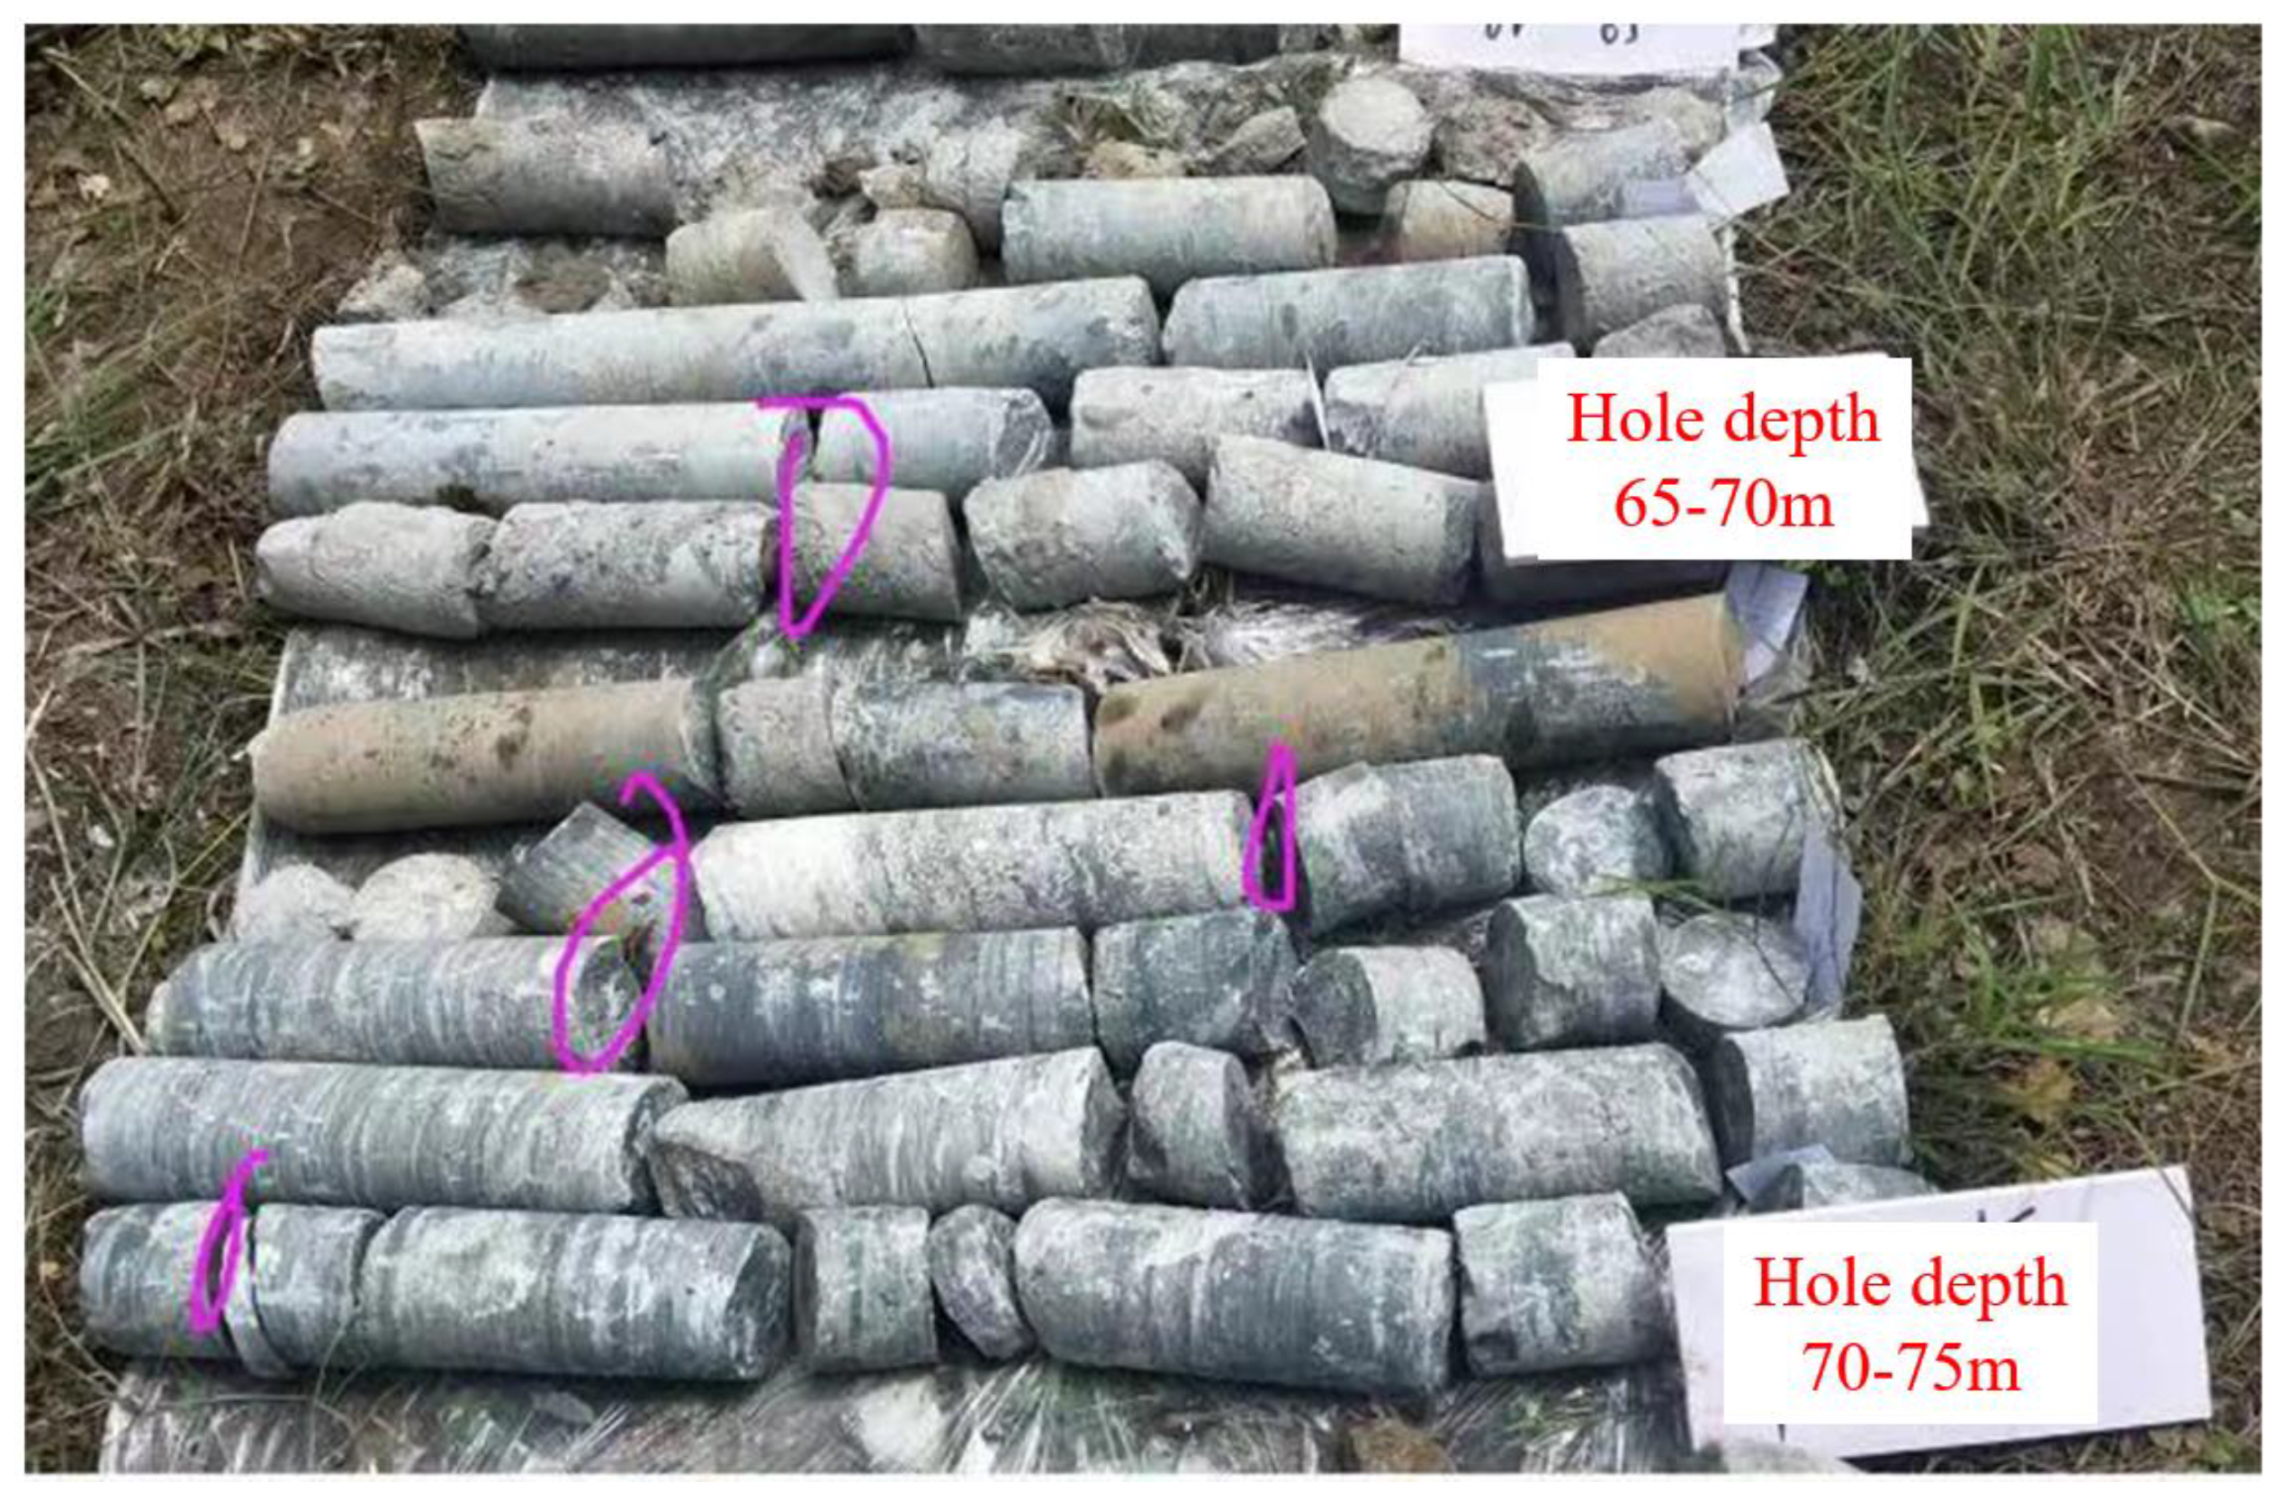
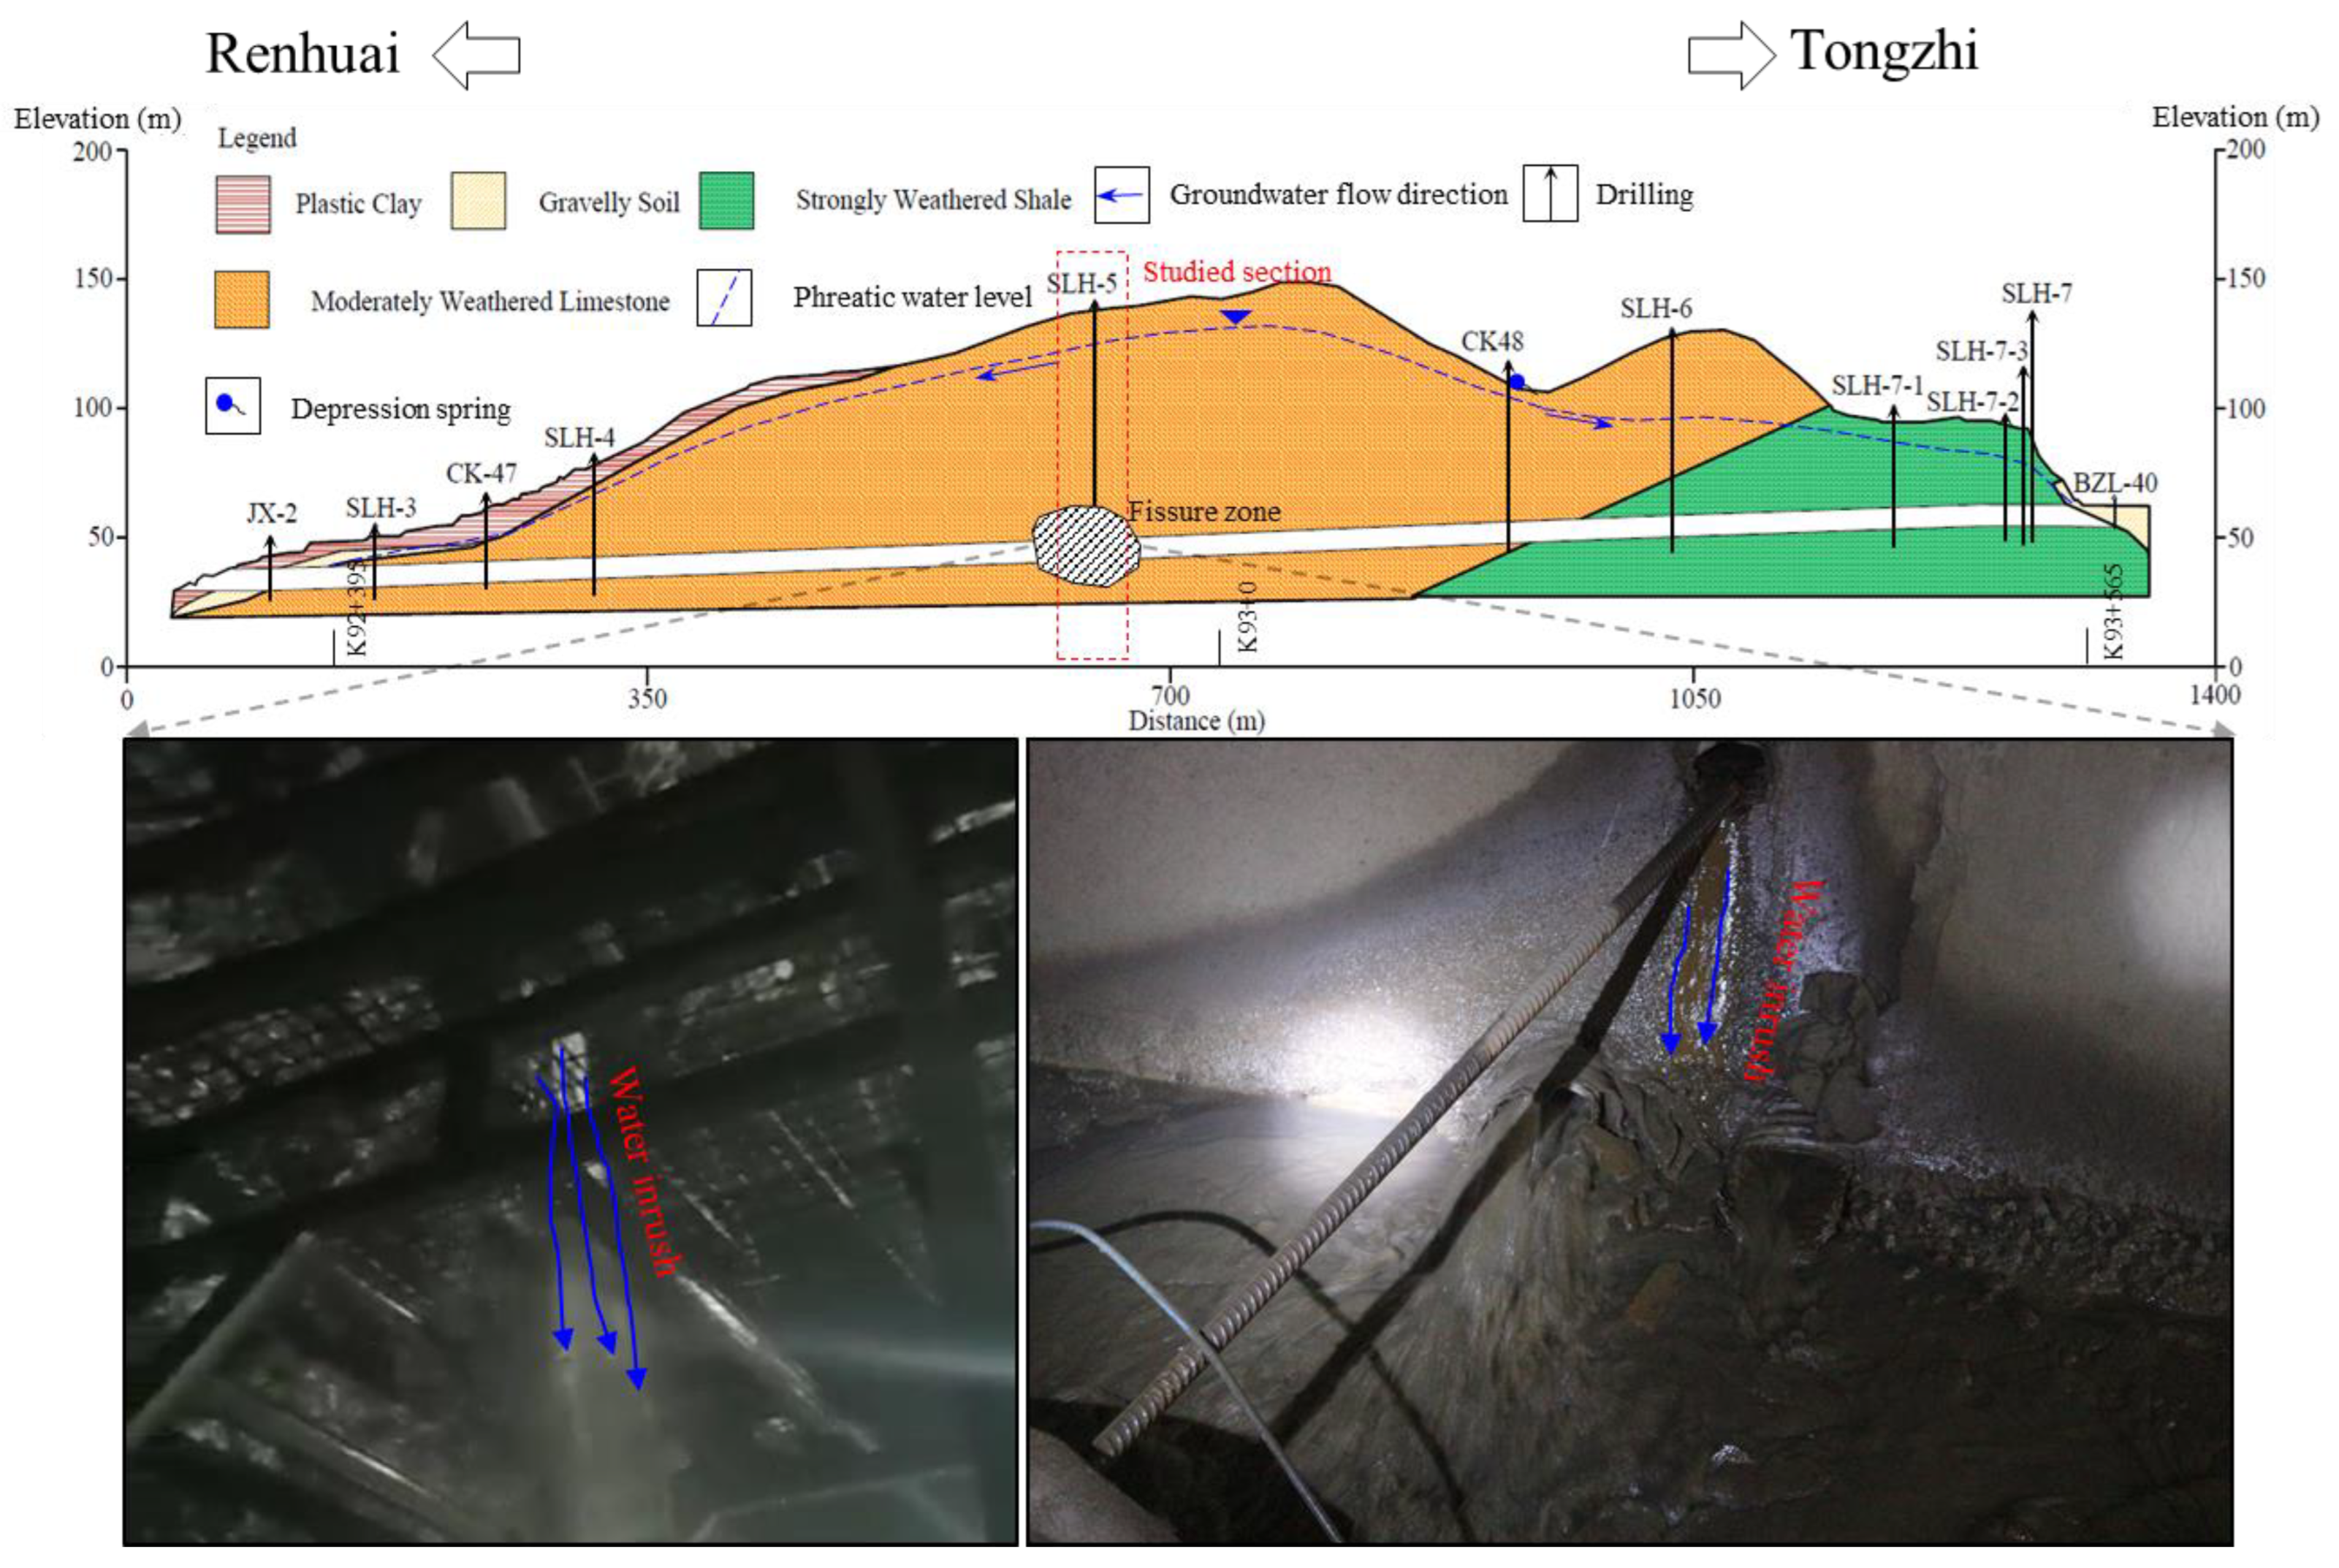
2.5.1. Geological Information and Model Configuration

The Jianxin Tunnel is in the eastern section of the Jin-Ren-Tong Expressway in Guizhou Province, China. As shown by the preliminary resistivity in Figure 6, the rock near the roof of the K92+900 roadway is a low-resistivity anomaly zone, a potential dissolution fracture zone, which has a large impact on the roadway construction. Therefore, test holes were drilled to expose the structural form of the fissures. As shown in Figure 7, many fractures were present in the samples at 65 m~75 m depth, indicating the presence of fractures in this area. Therefore, the section through the SLH-5 hole was selected as the study area, where the water level is approximately 50 m above the tunnel axis.
As shown in Figure 8, the main rock types crossing the tunnel axis are plastic clay, gravelly clay, weathered limestone, and weathered shale. Weathered limestone often contains dissolved fractures and cavities, which provide large storage spaces and highly conductive channels for groundwater, increasing the potential for water inflow during tunnel construction. According to field geologic surveys, the massive fissures in the site provide favorable percolation conditions and channels for groundwater, which is recharged primarily by atmospheric precipitation and flows mainly from east to west into low-lying areas. The phreatic water level is drawn in Figure 8 by the blue dashed line, which varies periodically with atmospheric precipitation. There is a spring approximately 50 m to the left of K93+600 with a seasonally varying flow rate in the range of 0.1~0.3 L/s. The fissure water is a potential threat to the construction of the tunnel, as the phreatic water level is about 40 m above the tunnel axis in most parts.
The tunnel was excavated through the study area in July 2022, which is the main rainy season in Guizhou Province, China. During this period, maximum precipitation intensities of up to 200 mm/day were recorded in the tunnel construction area. Sudden flooding occurred in the study area. The inflow into the tunnel was mainly from natural fractures around the tunnel, as shown in Figure 8. The inflow rate was initially very high, ejecting from the fracture, with the maximum estimated inflow rate of about 100L/s, and then rapidly decreases. After approximately 2 days, the inflow was steady at a rate of approximately 0.5 L/s.

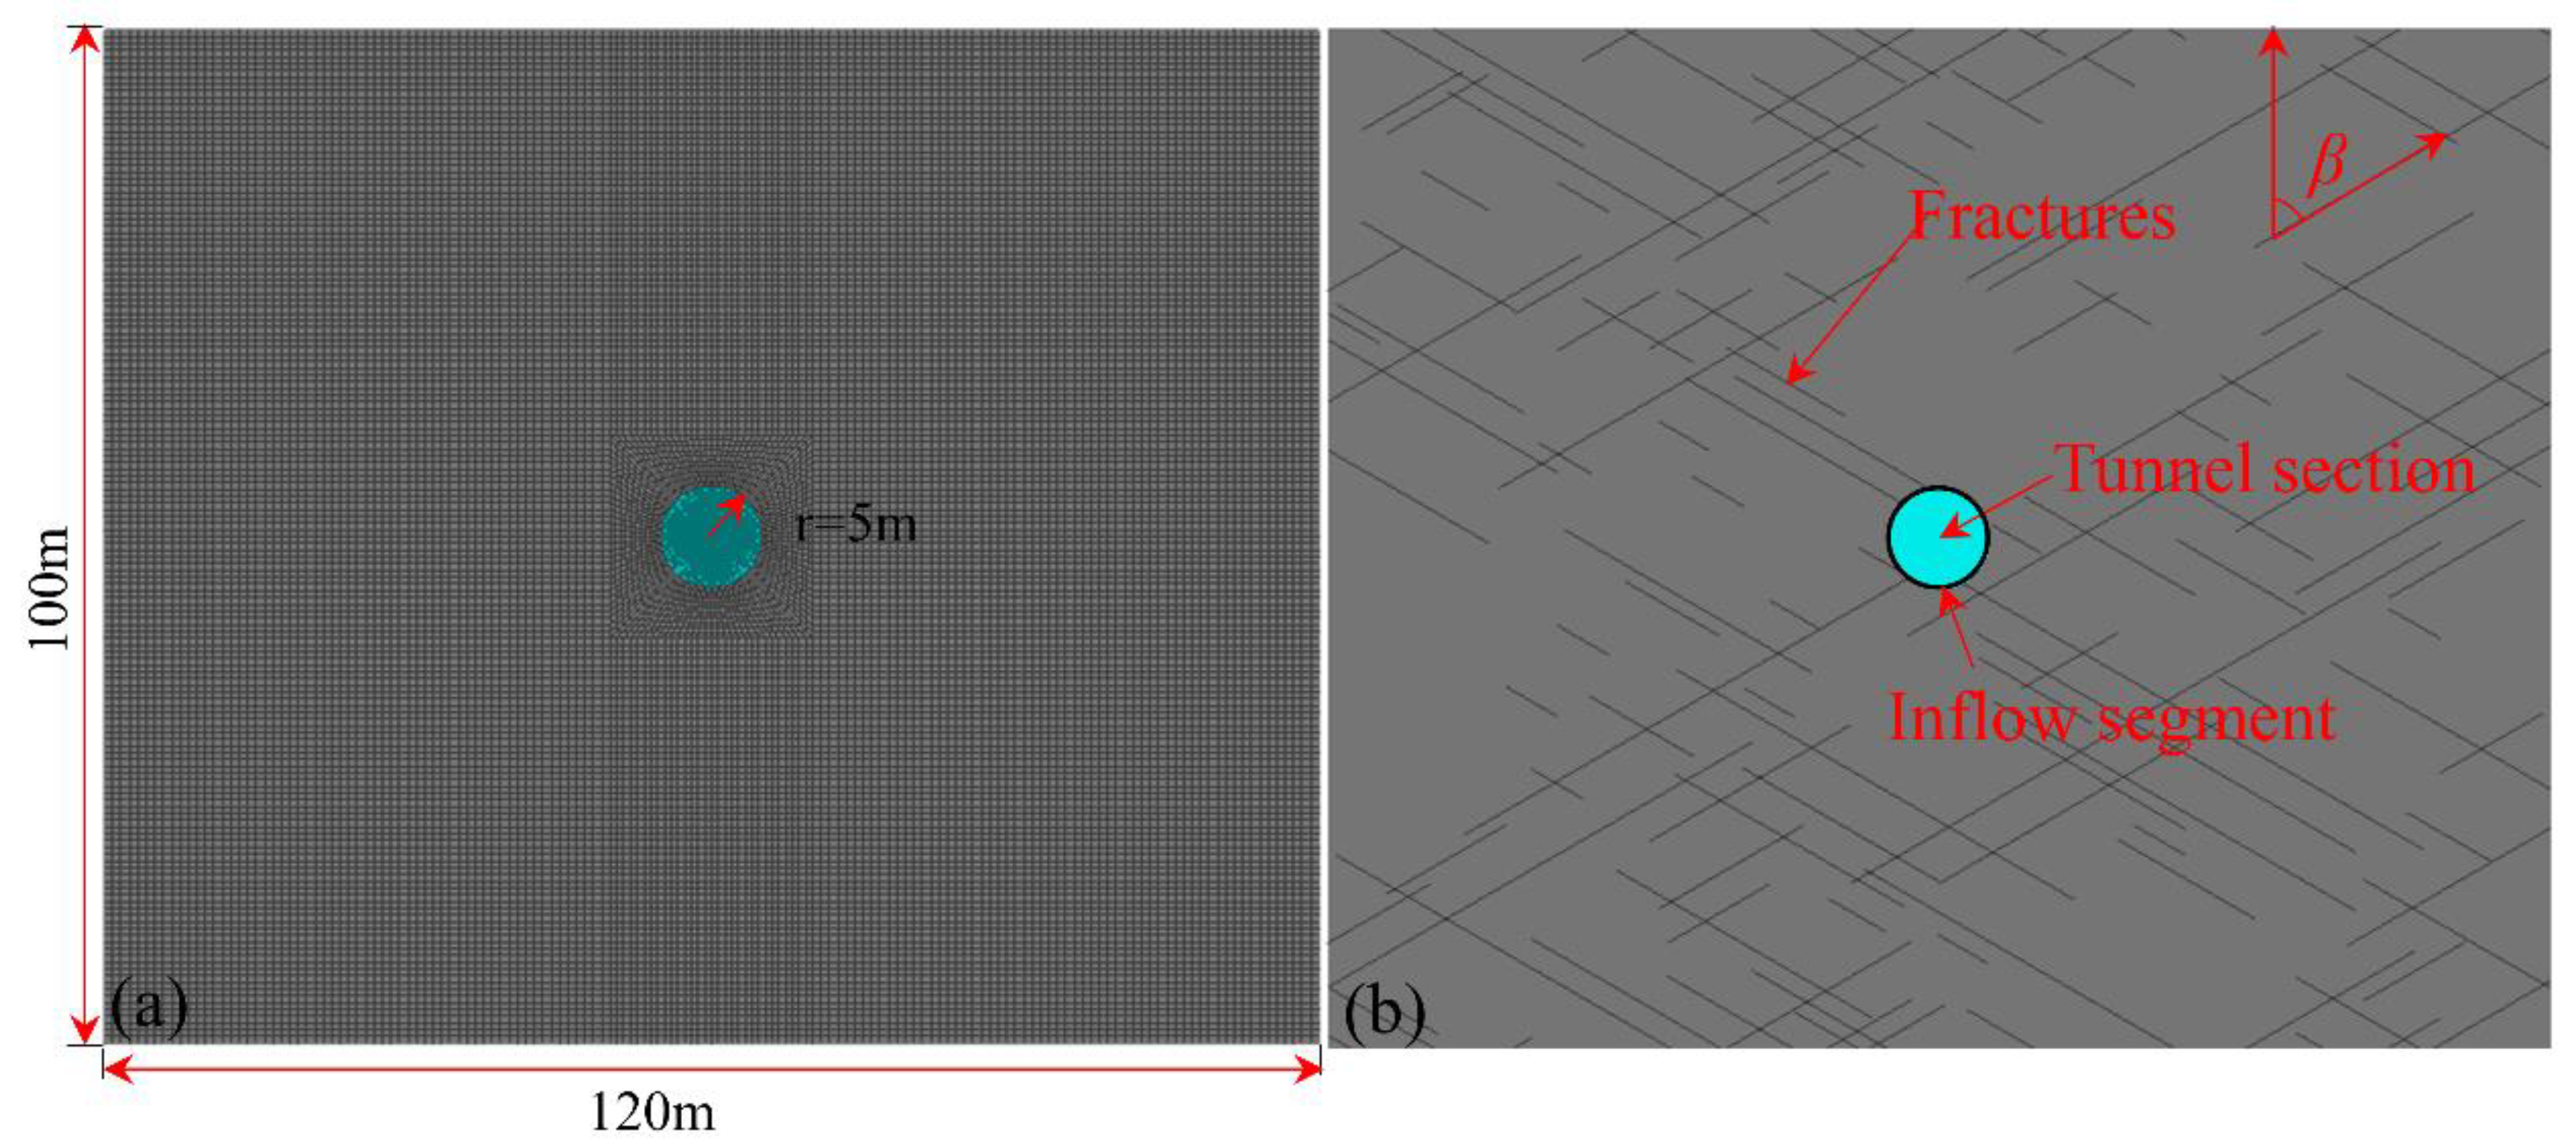
2.5.2. Configuration of Numerical Model

A two-dimensional model with dimensions of 100 m × 1 m × 120 m was created to study the inflow of the unit thickness tunnel during construction, whose dimension is comparable to the configuration in reference [36]. A circular tunnel with a radius of 5 m was excavated in the middle of the model. Two cluster fractures were randomly initiated in the 2D model with an inclination angle of 60°. A total of 150 fractures were initiated, as shown in Figure 9. Laboratory tests were carried out on samples from the SLH_5 borehole to measure basic mechanical and hydraulic properties including Young’s modulus, Poisson’s ratio, permeability and porosity.
Table 1 summarizes all parameters for the matrix and the fractures, in which fracture characteristics, such as fracture initial width, density, and incline angle are assumed. The initial vertical stress was converted from a density of 2500 kg/m3, and the initial horizontal stress was calculated from the vertical stress with a horizontal stress ratio of 0.6.
The top boundary initiated as gas saturation and porosity is set to infinity, representing the atmospheric boundary, meaning that the pressure within this boundary remains equal to the atmospheric pressure. The other three boundaries are assumed to be fixed-pressure boundaries. All elements, except the top boundary, are initiated as water saturation [37,38].
To investigate the influence of the mesh on the numerical results, numerical simulations were performed with different mesh sizes. The inflow rate around the tunnel section is recorded at 10h and is illustrated in Figure 10. Clearly, the inflow rate increases with the number of discrete elements, whereas such an upward tendency is slower as the number of elements exceeds 25,200. Therefore, the mesh with 25,200 discrete elements was chosen in the work to balance computational accuracy and efficiency.
During the construction of the tunnel, the elements within the tunnel section are removed while the pressure at the tunnel boundary is fixed to atmospheric pressure. The mechanical response of the fracture and fluid flow will be resolved by coupling, and the inflow rate of the tunnel section is recorded until a steady state is reached. The pressure contours and total inflow rate in the tunnel section will be recorded for results’ evaluation. As complex fracture networks cannot be measured explicitly, various uncertainties will be gathered on the geometry and properties of fracture networks. Therefore, the impact of key parameters such as fracture density, inclination angle, stress anisotropy, and initial fracture width on the water inflow during the tunnel construction will be analyzed in following section.

3. Results and Discussion

3.1. Numerical Results

The simulated pressure contours at different times are shown in Figure 11. A non-symmetric drawdown of groundwater is observed from the numerical results. Since the fractures provide highly conductive channels for inflow, the water first comes from the fracture network surrounding the tunnel section. Then, the lower pressure region extends from the fracture path to the host rock. The pressure surrounding the tunneling profile varies dramatically at the initial time and reaches a stationary state within 1 h, as observed from the comparable pressure contours between 1 and 50 h. The minimum pressure comparable to the atmospheric pressure exists around the tunnel, and this low pressure region propagates mainly along the connecting fractures. Under gravity, most of the inflow comes from the top of the tunnel and the sides of the section. In contrast, pressure variations in low-lying rocks are not significant.
Comparing the pressure contour of the model with and without the fracture in Figure 12, the effect of the fracture on the fluid flow is significant. In the model without fractures, the groundwater drawdown is symmetrically distributed, which is observed in the most analytical results and numerical results based on homogenous rock [39,40]. In contrast to fractured rocks, low pressure regions are very shallowly intruded in the surrounding rock, as dense intact rock limits pressure propagation.
The flow channels are explicitly demonstrated by the flow vector in Figure 13. Only some of the fractures contribute to the fluid flow, consistent with the observation in the previous reference [26]. The highest fluid flow rate is found at the junction of the fracture and the bottom slab, at approximately 0.0015 m/s, an increase of approximately four orders of magnitude compared to the absence of the fracture. In the model without fractures, the flow vectors are symmetrically distributed and increase with distance closer to the tunnel.
Tunneling causes a redistribution of stress around the tunnel, which further changes the fracture width. The fracture width after 50 h is shown in Figure 14. The maximum fracture width is enlarged from an initial fracture width of 0.4 mm to 0.8 mm. Most of the enlarged fracture is concentrated around the tunnel, and the excavation causes significant stress redistribution and enhance fracture width. The fracture width due to the dilatation is shown in Figure 14b. The distribution of the dilation fractures is similar as the width of the enlarged fractures in Figure 14a. Moreover, the difference between the total width and the dilatation width is consistent with the initial fracture width, indicating that shear dilation is the dominant mechanism for fracture variability in this case. The effect of shear expansion on the fracture width was found to be within 8.2 m of the tunnel wall, which is deeper than that of a previous work, as the presence of groundwater will promote the shear failure in fractures [41].
Due to the direct connection of the top surface to the atmosphere, the gas can freely move in and out of this model. Both liquid and gas phases are considered in this model. After 50 h of simulation, the liquid saturation of the model with and without fracture is compared in Figure 15. The top boundary is saturated with gas due to the initial conditions. Since the fracture provides a highly conducting channel for the fluid and the gas is more mobile due to its low viscosity, the gas will be concentrated in the fracture space, especially at the top of the fracture. The flow behavior in the saturated region differs from those in the unsaturated region, resulting in the inflow with the fracture model differing from the inflow without the fracture model.
The difference in inflow rate of the fractured and unfractured models is compared in in Figure 16a. In general, the total inflow rate can be divided into two segment, transient flow period and stationary flow period, in which the transient flow period refers to the period when there is an advancing pressure gradient [42]. Clearly, the inflow rate of the fractured model is much higher than the non-fractured model. Due to excavation, the transient flow rate in the fractured rock can reach 200 L/s at the initial stage, after which the flow rate rapidly decreases. After 50 h, the flow rate reaches a steady state, where the inflow rate is slightly lower than the observed data in situ. In spite of this, the simulated inflow rates fully cover the range of observed data in situ, demonstrating the plausibility of the present approach. In the unfractured model, the transient flow rate reaches a maximum of approximately 0.02 L/s, and the flow rate reaches a steady state in approximately 1000 h. The steady flow rate for the model with fractures is approximately 0.07 L/s, which is about 100 times higher than the steady flow rate for the model without fractures, highlighting the importance of fractures in the evaluation of inflow in tunnel construction.
The effect of mechanical effects on the inflow rate is shown in Figure 16b. The inflow rate under mechanical effects is significantly higher than the inflow rate in the absence of mechanical effects, as the change in fracture width is taken into account. The increased fracture width will provide a wider channel for fluid flow. Overall, the highest transient and steady rates increase by approximately 50% when accounting for the mechanical effects of fracture deformation, suggesting that the mechanical response of fractures can have a significant effect on inflow, especially during construction.

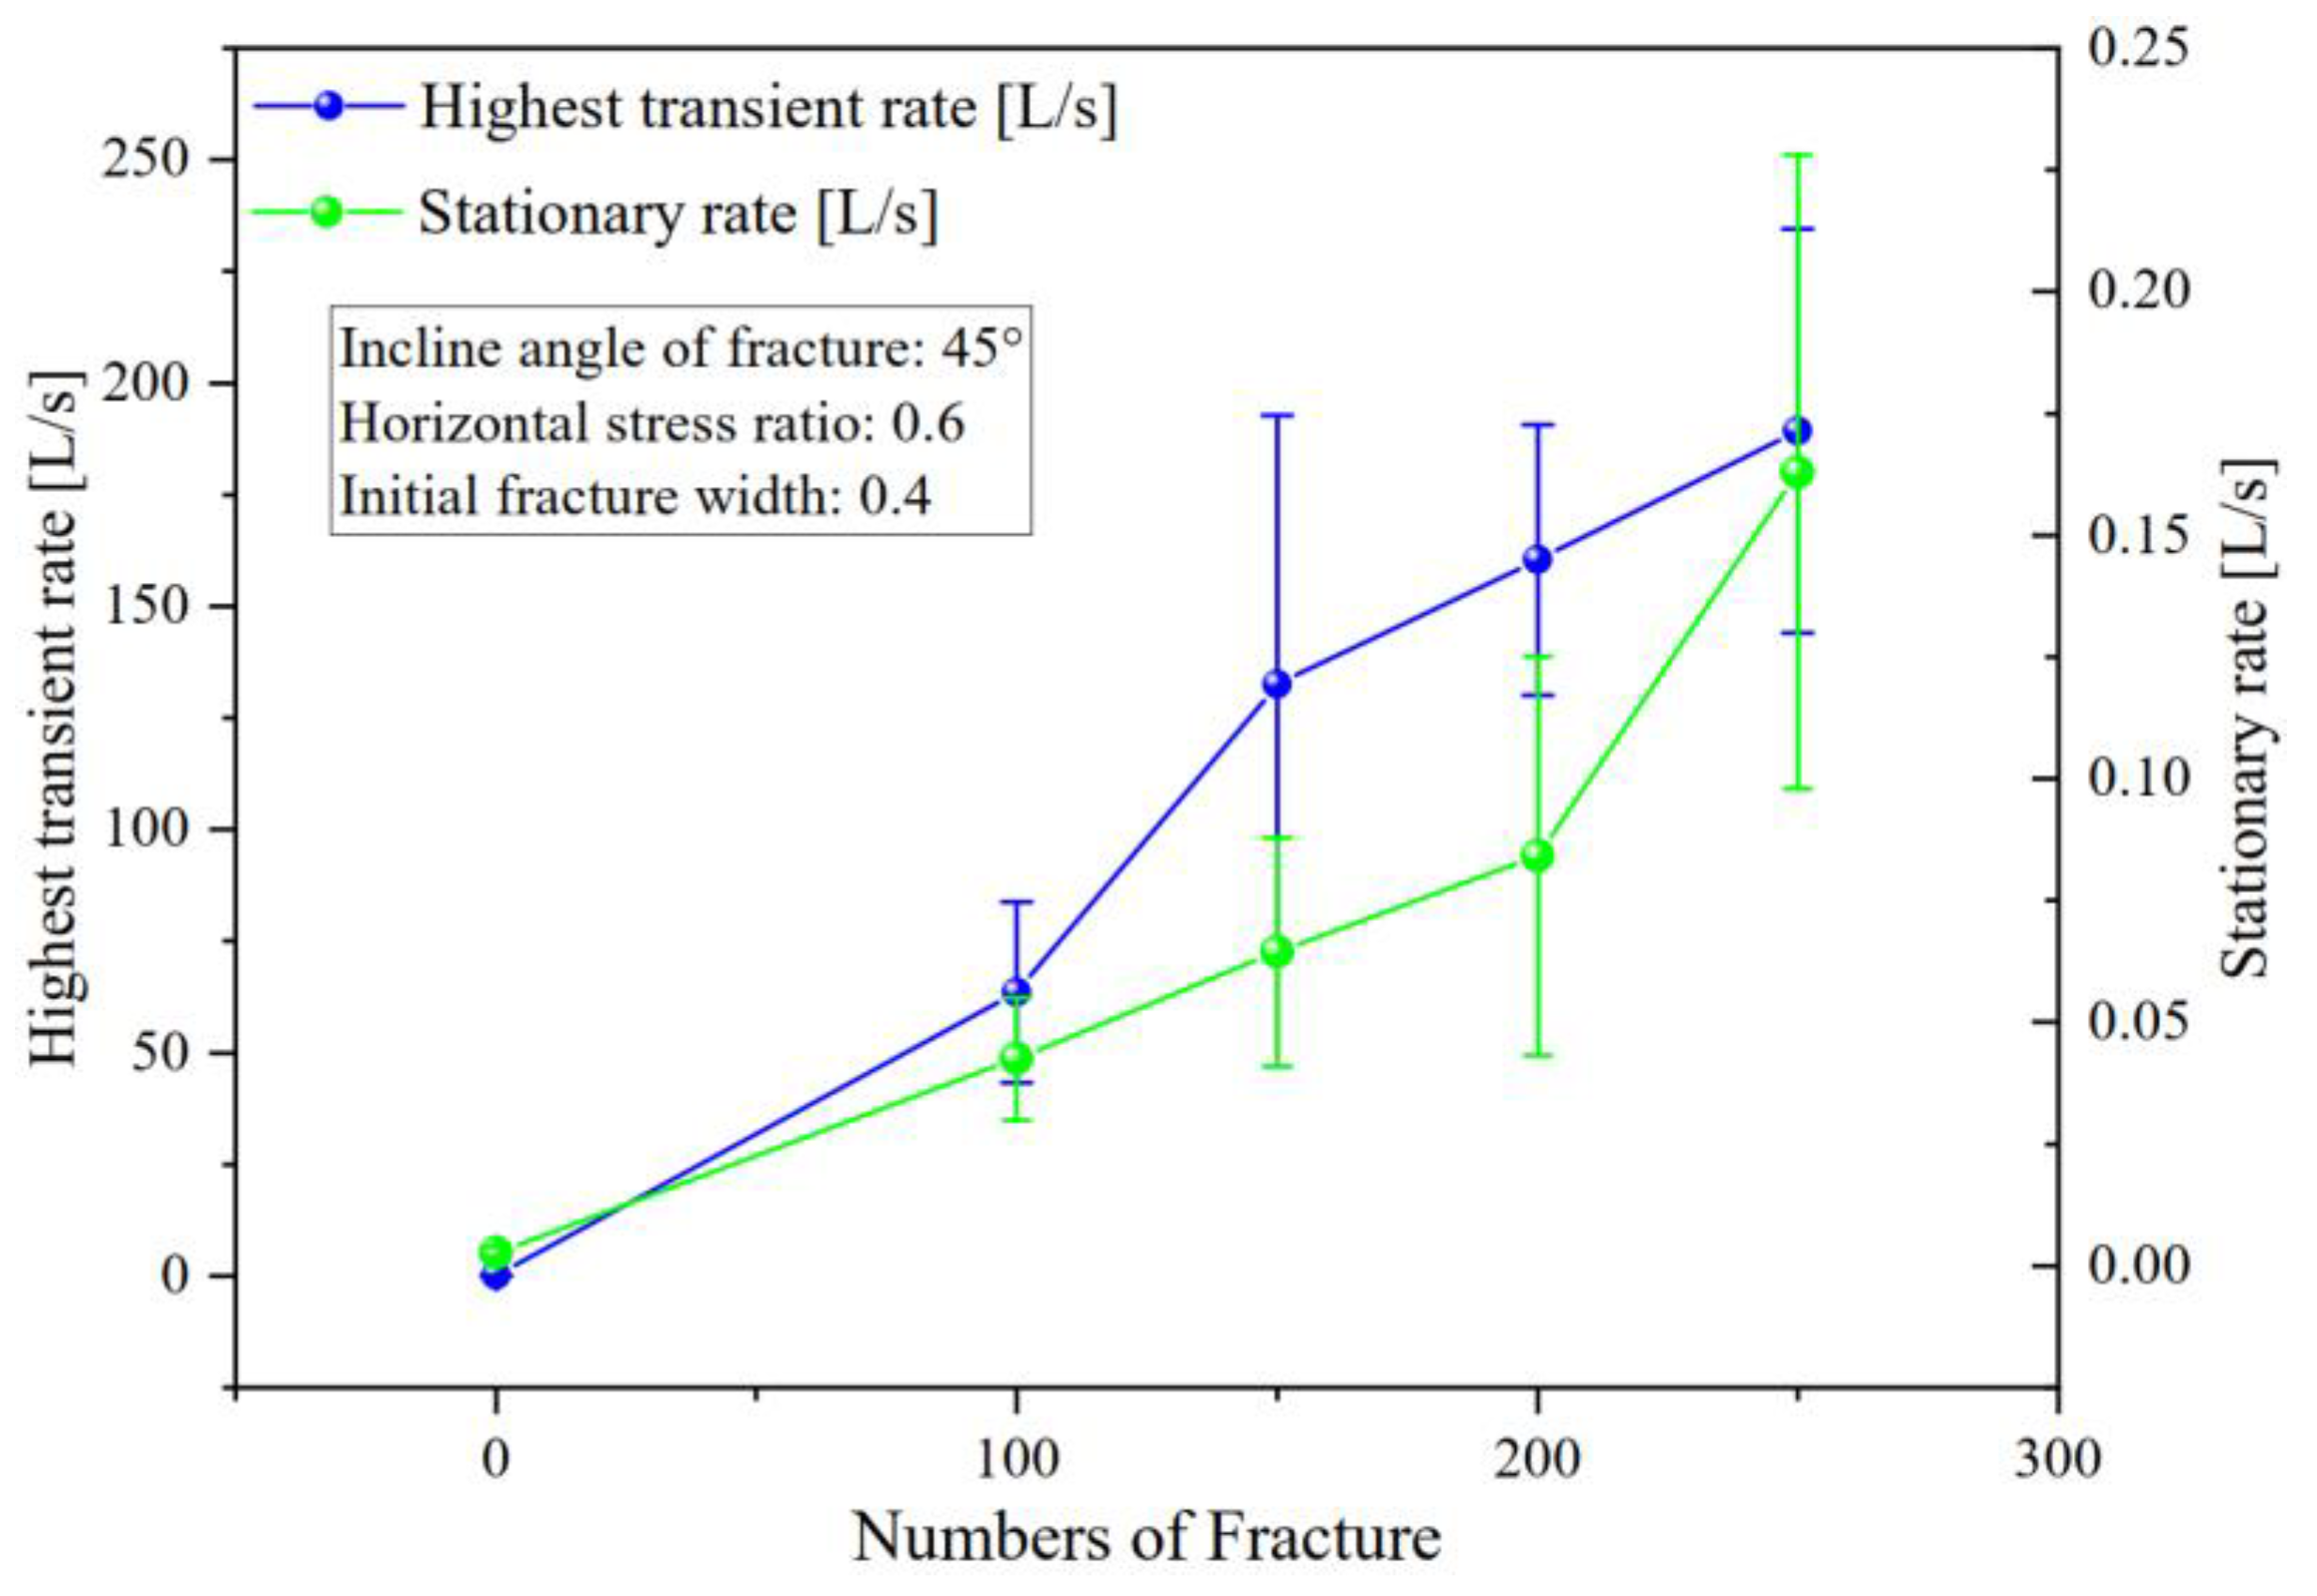
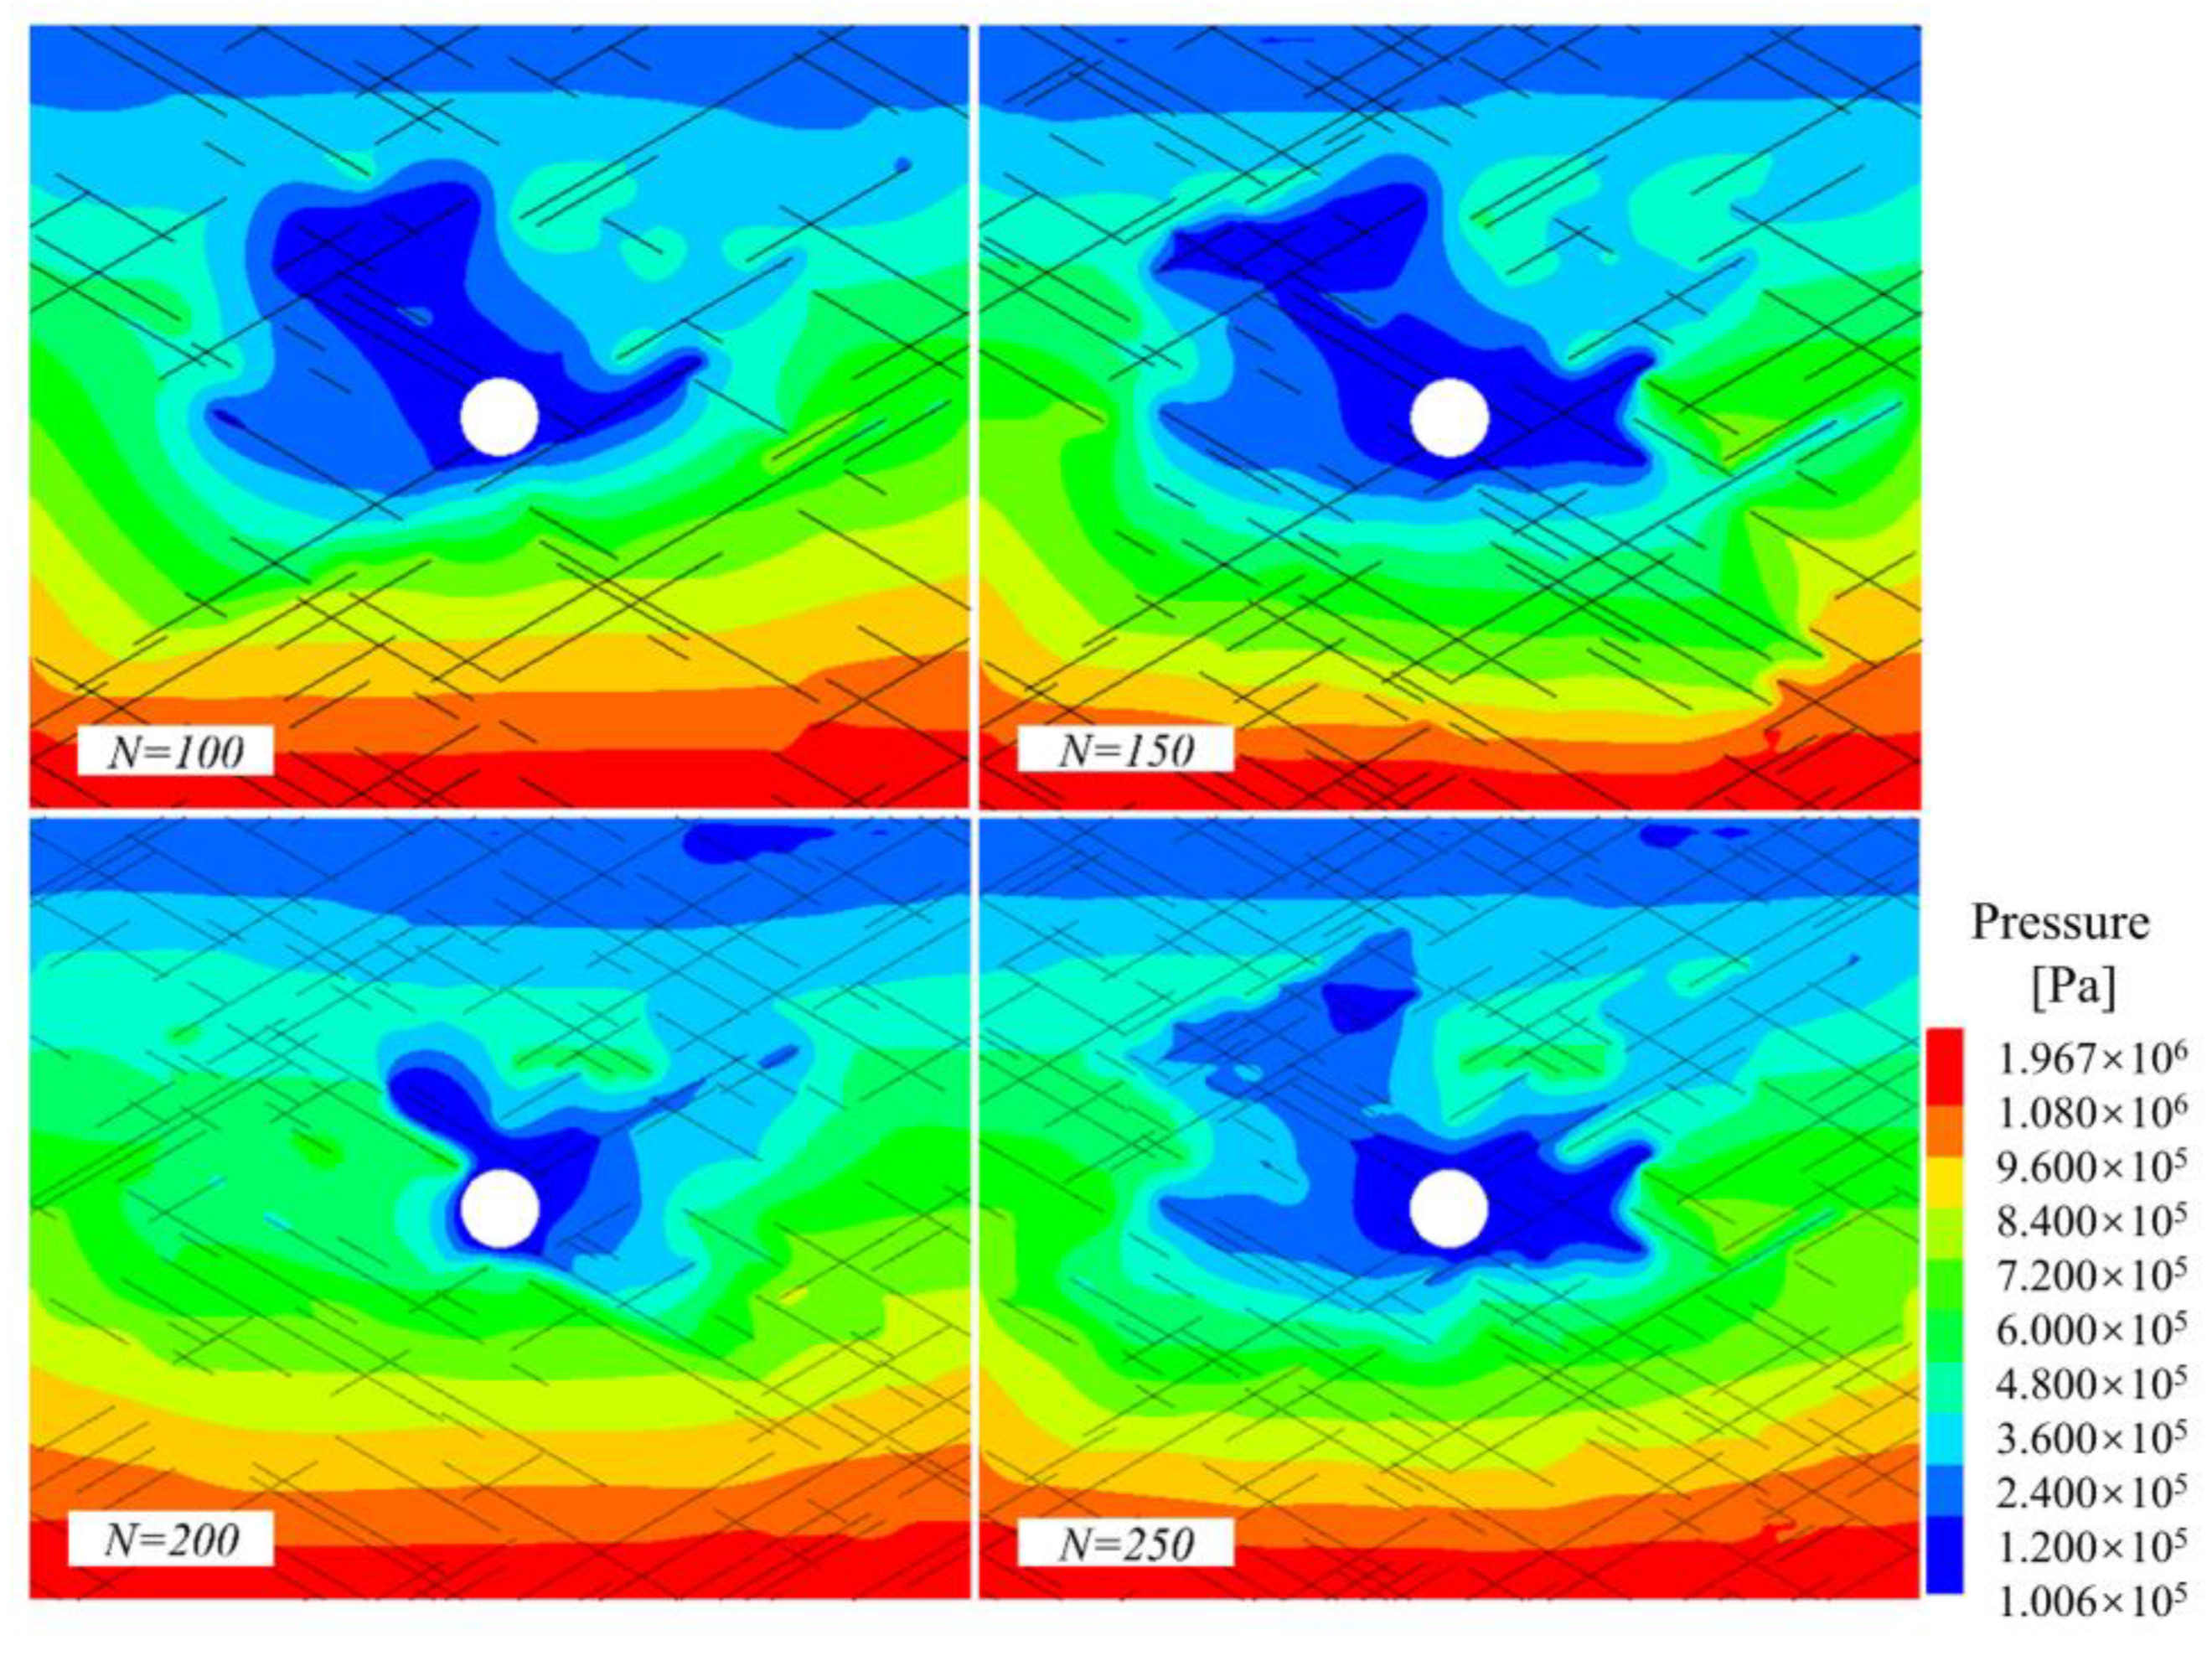
3.2. Effects of Fracture Density

The fracture density increases with the number of fractures. Higher fracture densities will provide more alternative access for the fluid to tunnel [43]. To understand the effect of the fracture density, 10 simulations were performed for cases with 100, 150, 200, and 250 fractures, respectively. The final statistics, including the maximum transient and steady-state inflow rates, are compared in Figure 17. Both the maximum transient rate and the steady rate are significantly positively correlated with the fracture density.
The pressure contours at 50 h are shown in Figure 18. The distribution of groundwater drawdown depends on the connecting fracture. Due to the stochasticity that accumulates during model generation, there is no clear rule for the size of the groundwater drawdown.

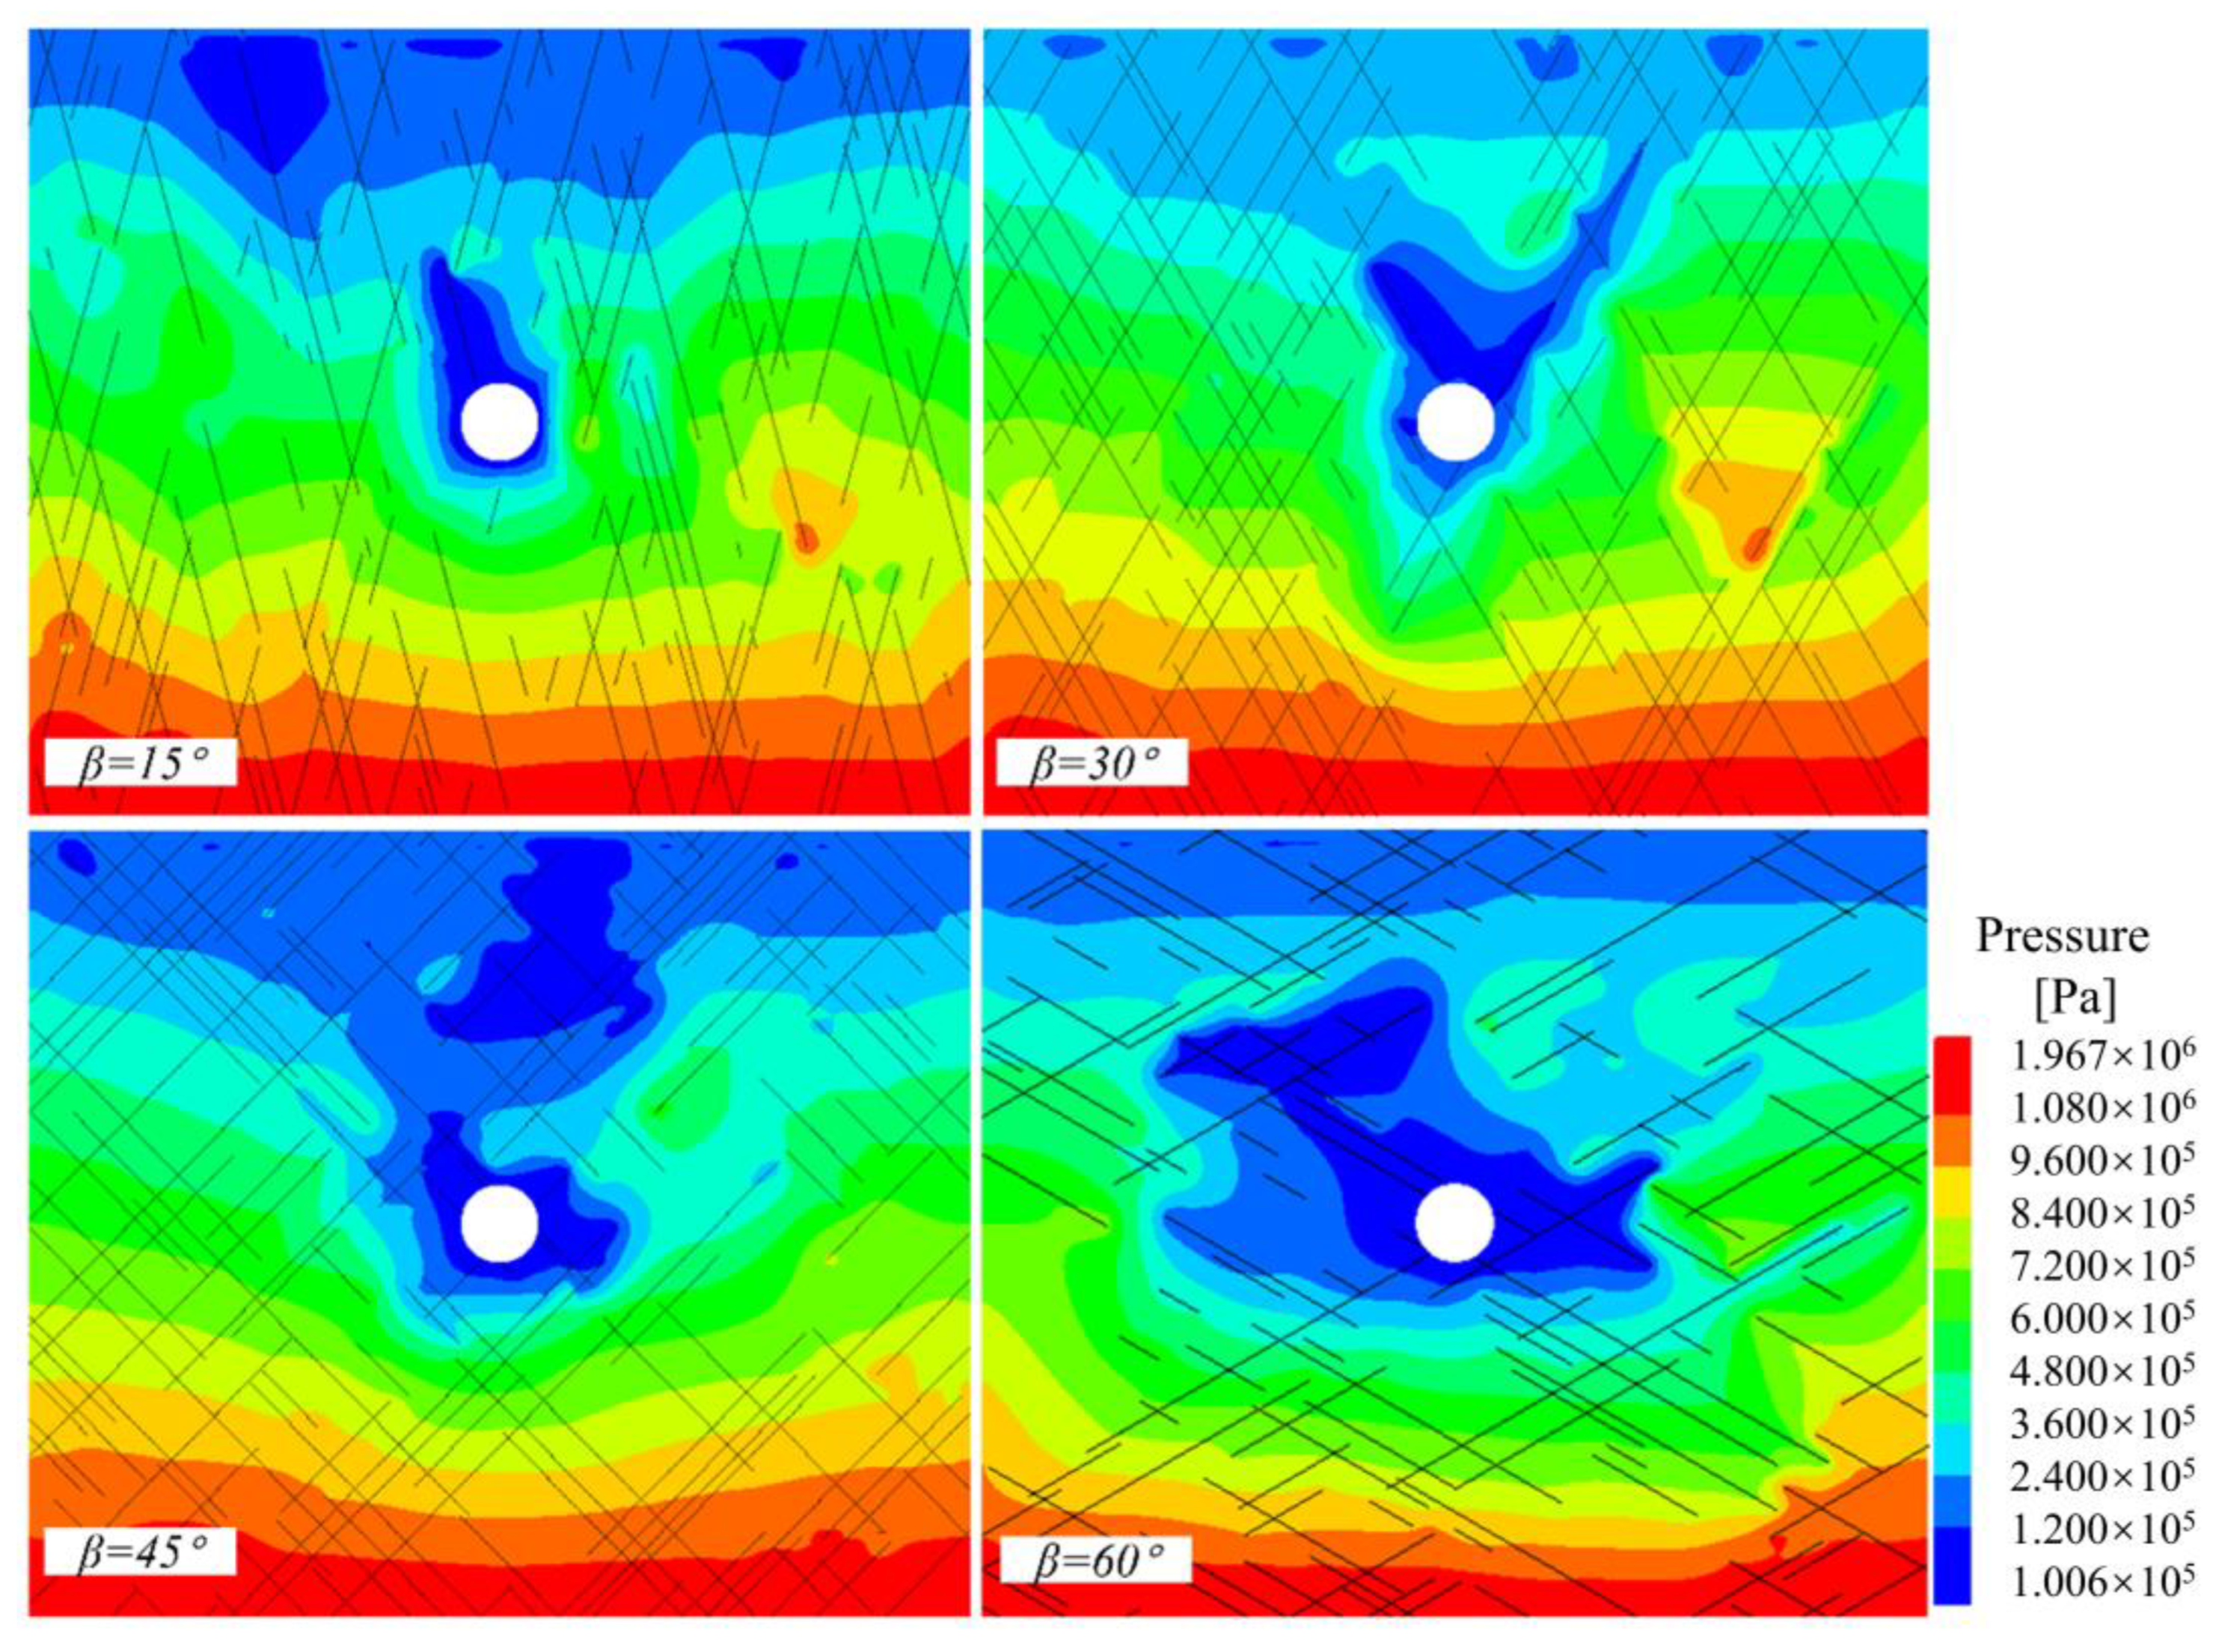
3.3. Effects of Inclination Angles

The incline angle defines the minimum angle between the fracture trajectory and the vertical. Low incline fractures are oriented closer to the vertical. In this paper, fractures with incline angles of 15°, 30°, 45°, and 60° are studied. Ten simulations were performed on randomly generated fracture networks for each incline angle. Figure 19 compares the highest transient and stationary rates for different incline angles. At an incline angle of 15°, the transient and steady rates are lowest because the source flow is mainly from the top of the tunnel, where the source area is smaller, and the groundwater level is much more variable. In contrast, at incline angles of 45° and 60°, the transient and steady rates are higher, the source area is larger, and the constant pressure boundary is shown in Figure 18. This phenomenon is observed as well as in the numerical results in reference [36]. Regarding the effects of incline angle, the difference between the highest transient rate and the steady rate is approximately 200 and 30 times, respectively.
The pressure contours are shown in Figure 20. The incline angle has a significant effect on the pressure distribution. As the incline angle increases, the magnitude of the groundwater drawdown increases, as the well-connected fracture controls the low pressure zone, confirming the law of highest transient and steady-state rates in tunnel sections with increasing incline angle.

3.4. Effects of Stress Anisotropy

According to Equation (20), the horizontal stress ratio is defined as the ratio of the minimum horizontal stress σ h and vertical’ stress σ v . As the horizontal stress ratio increases to 1.0, the initial stress anisotropy decreases. At high stress anisotropy, fracture slip is more likely to be activated [35]. Horizontal stress ratios of 1.0, 0.8, 0.6, and 0.4 were investigated. Ten simulations with randomly generated fracture networks were performed in every horizontal stress ratio. Figure 21 compares the highest transient and steady rates for different horizontal stress ratios. All inflow rates show a similar trend in that the highest transient and steady rates decrease with rising horizontal stress ratio, as shear failure is easily initiated at high stress anisotropies, that is, at low horizontal stress ratios. Shear failure occurring at fractures will enhance the fracture width under the dilatation effect, providing a higher inflow channel. In these cases, the difference between the maximum transient rate and the steady rate is approximately 2.5 and 5 times, respectively.
K 0 = σ h σ v
The final pressure contours are shown in Figure 22. The low-pressure region has similar size at different horizontal stress ratios due to the same fracture network in this case.

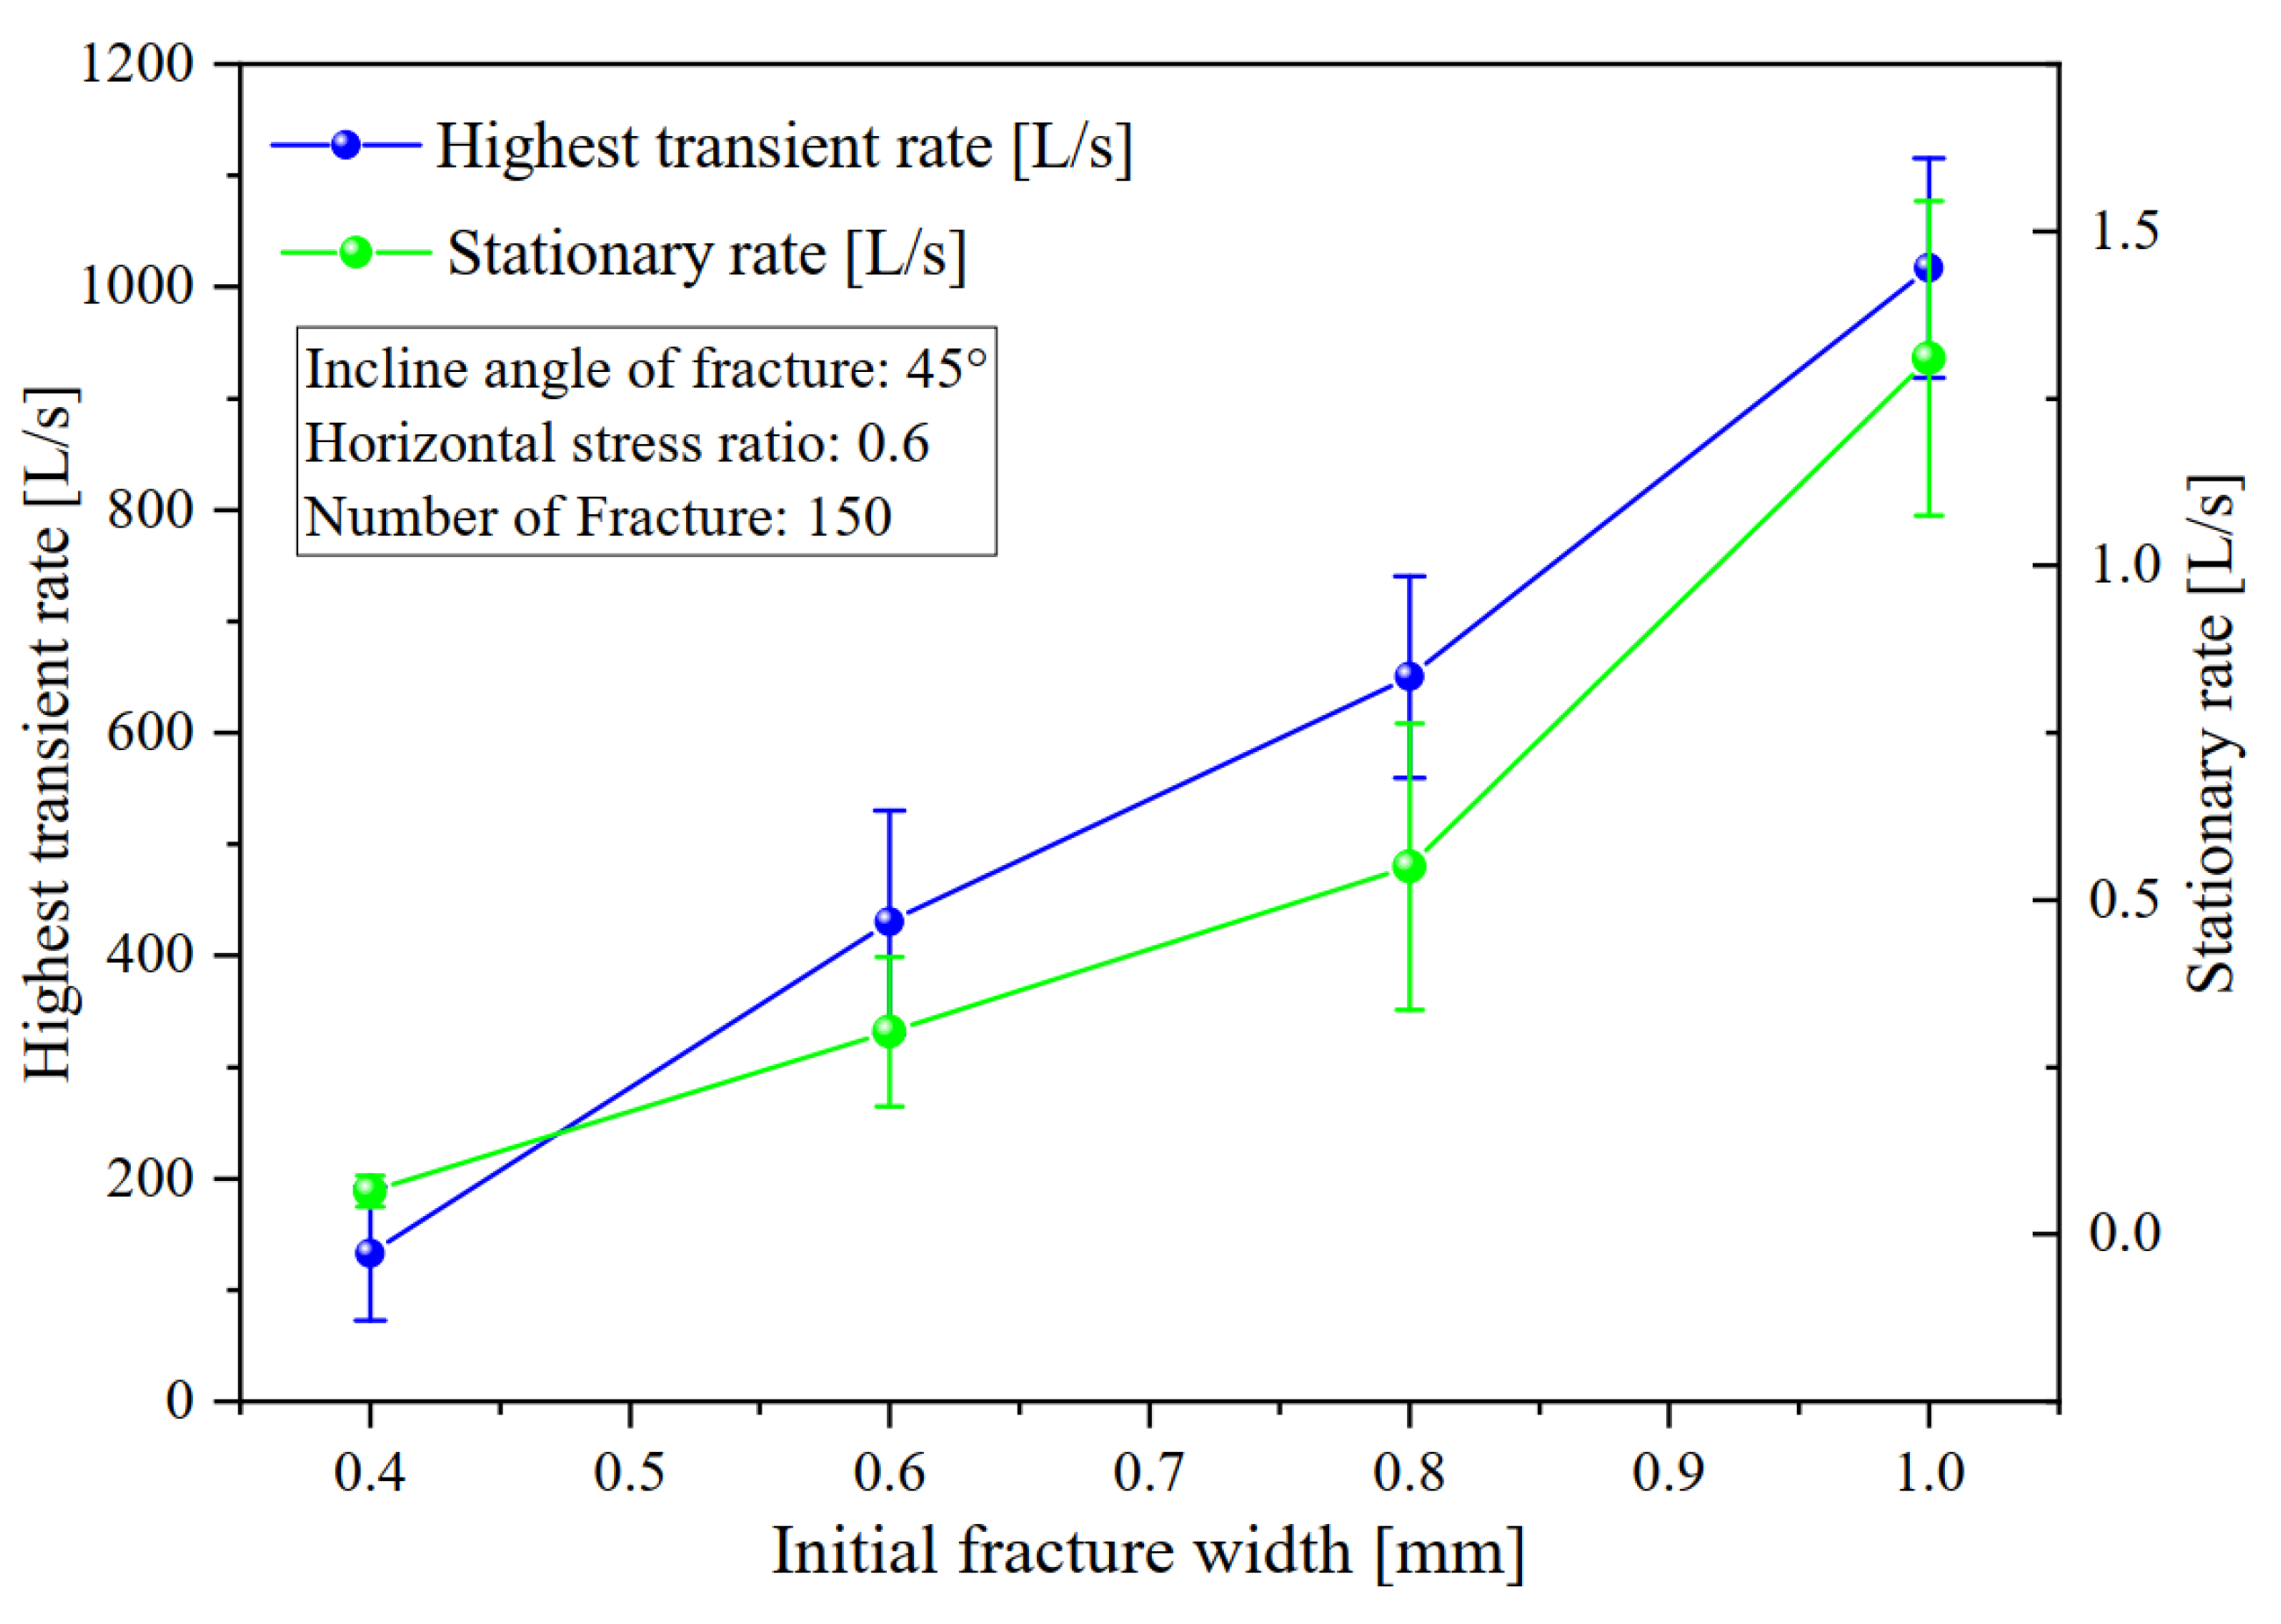
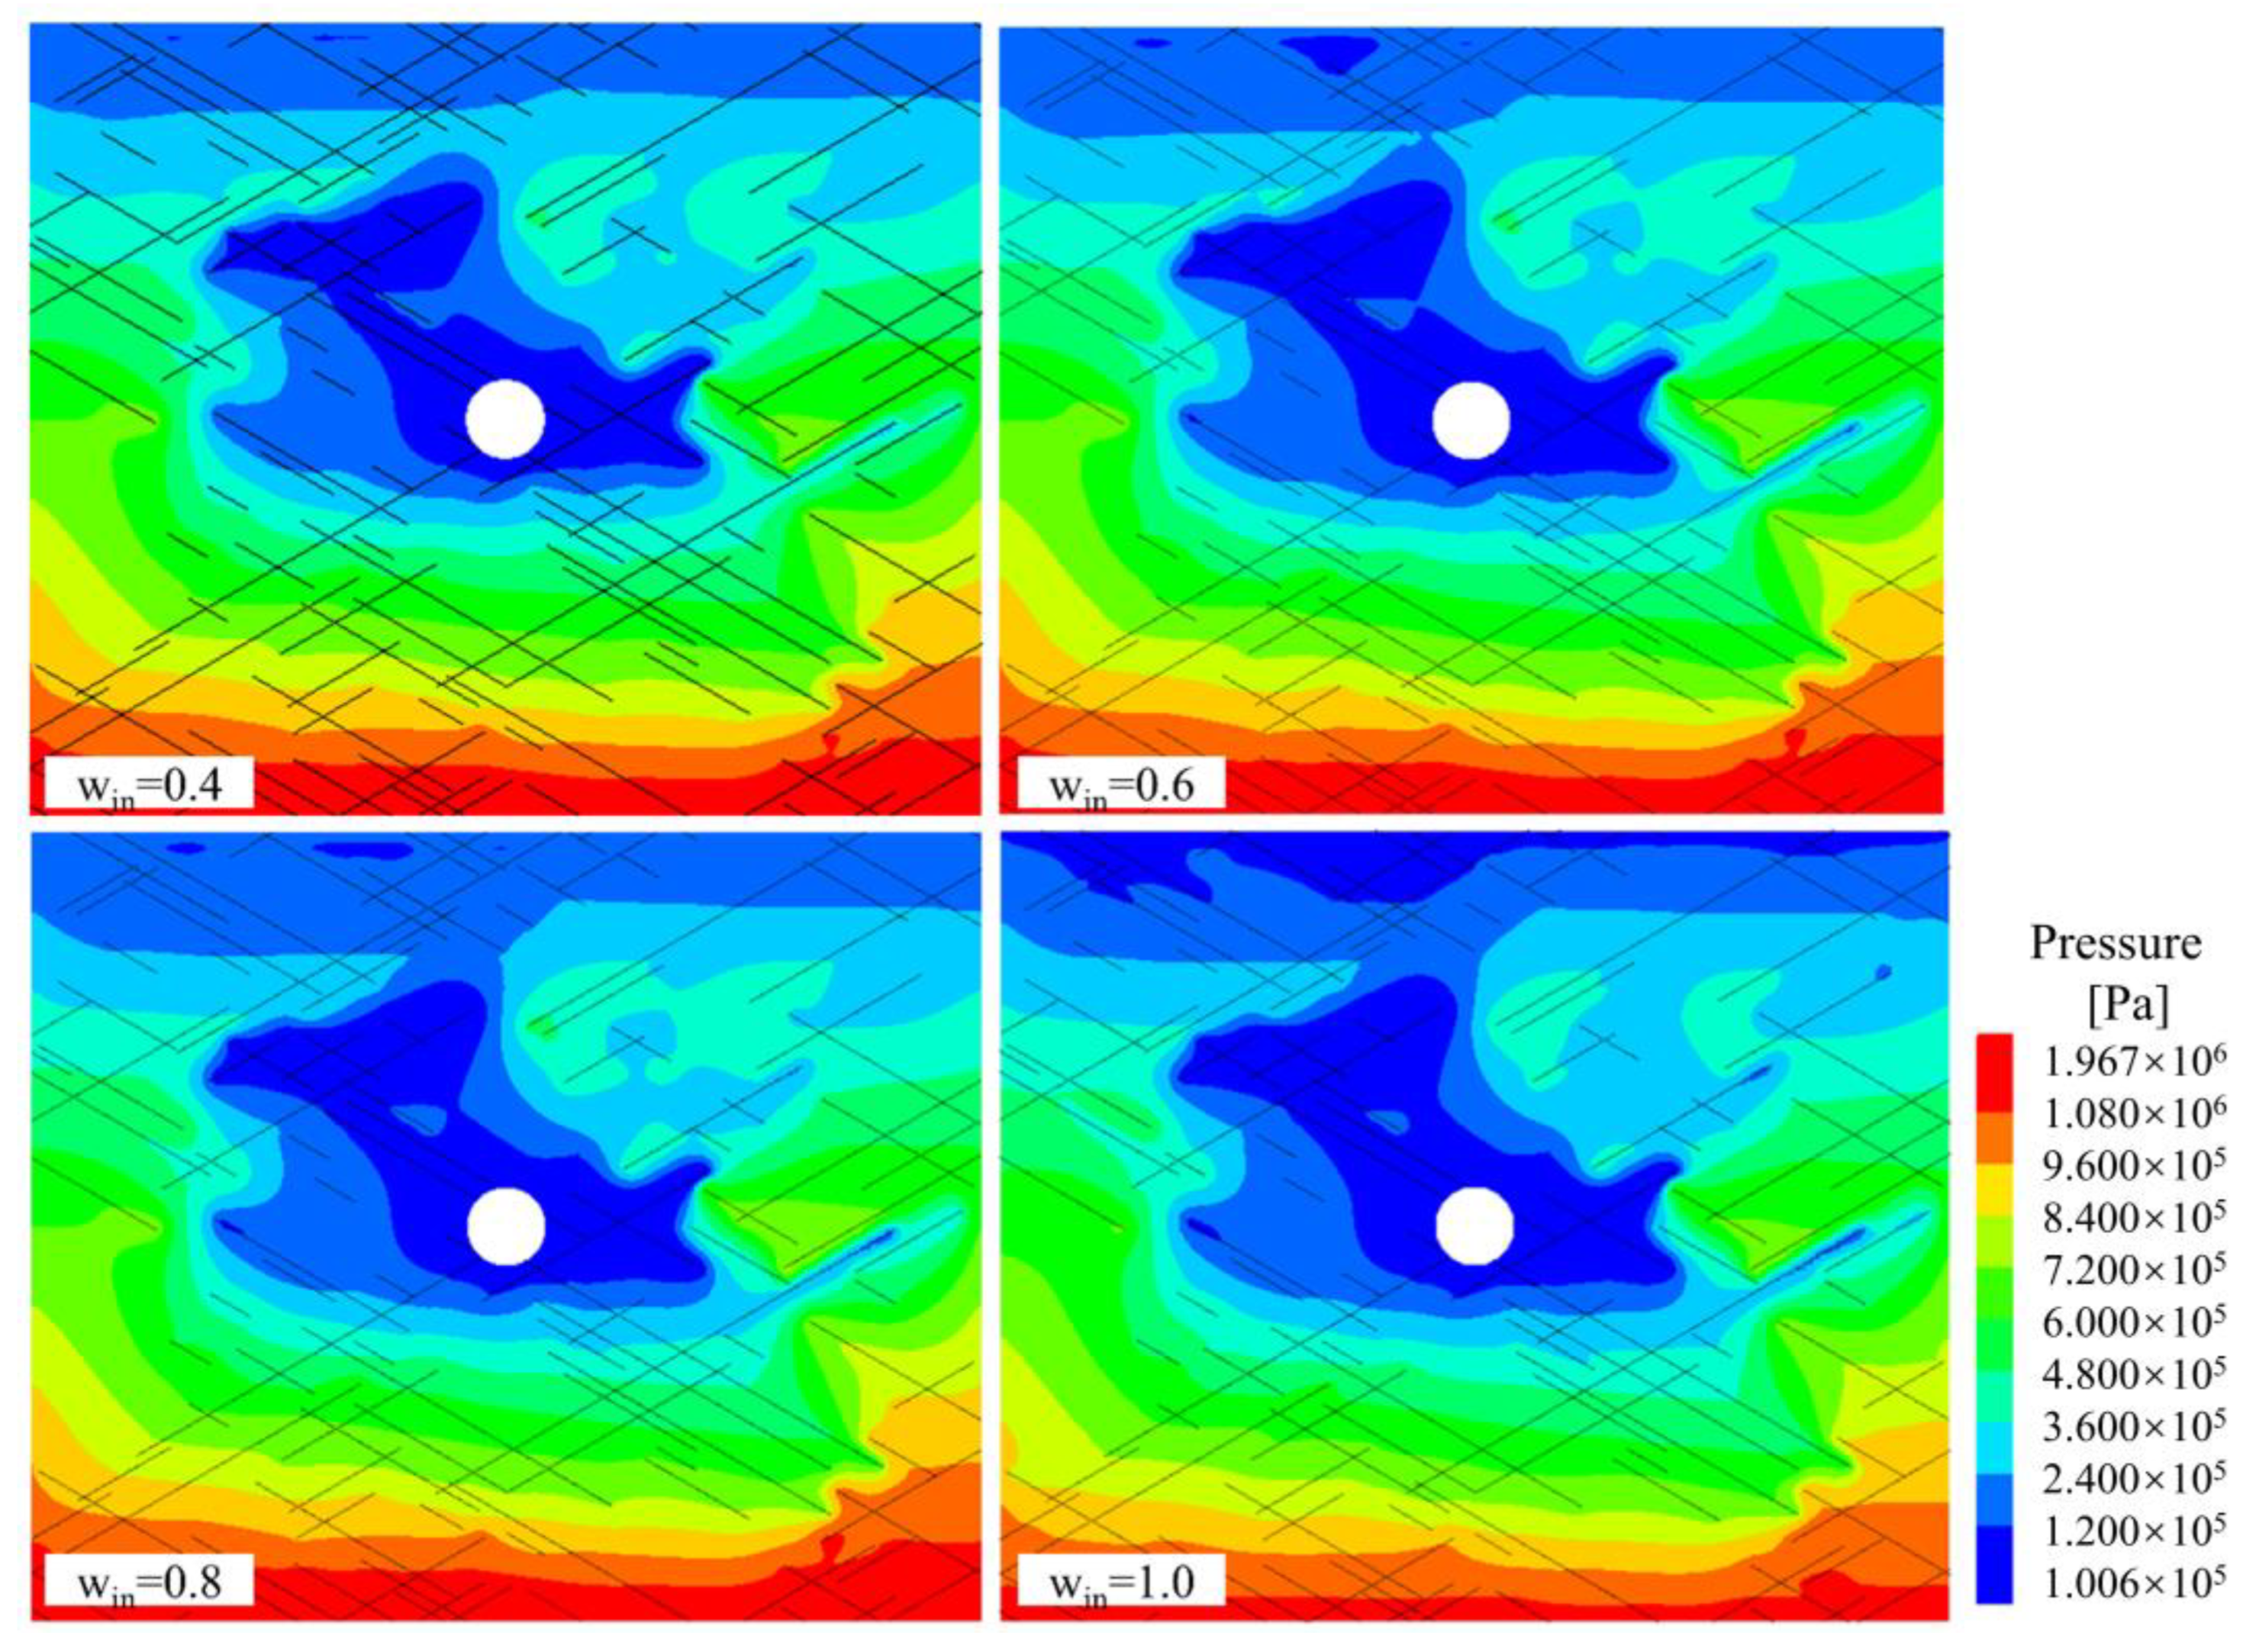
3.5. Effects of Initial Fracture Width

The fracture conductivity depends directly on the fracture width. A higher fracture width will provide a highly conducting channel for the fluid [35]. In this work, initial fracture widths of 1.0 mm, 0.8 mm, 0.6 mm, and 0.4 mm were investigated. Ten simulations with randomly generated fracture networks were performed at each initial fracture width. A comparison of the maximum transient rate and the steady rate for different initial fracture widths is shown in Figure 23. All inflow rates show a similar trend, with a significant positive correlation between the maximum transient rate and the steady rate, which is consistent with previous results [36]. A higher initial fracture width will increase water inflow during tunnel construction. In these cases, the difference between the maximum transient rate and the steady rate is approximately 5 and 17 times, respectively.
The final pressure contours are shown in Figure 24. Since the same fracture network is presented, the size of the low pressure region varies slightly for different initial fracture widths. Overall, a higher initial fracture width results in a wider impact zone.

4. Conclusions

In this paper, a hydraulic coupling numerical model that considered discrete fracture network is developed to predict the water inflow of surrounding rock during tunnel construction. The significance and effectiveness of the proposed framework are demonstrated through a practical engineering case, namely the Jianxing Tunnel, China. The following conclusions are reached based on the results presented:
(1)
The trend and value of the inflow rate predicted by the proposed numerical model have good consistency with the values observed on site in Jianxing Tunnel, proving that the equivalent fracture model is feasible for predicting the water inflow of fractured karst tunnels.
(2)
In the fractured model, the steady inflow rate reaches the steady state much faster than in the unfractured model. Moreover, the highest transient and steady rates are much higher in the fractured model, by a factor of approximately 100.
(3)
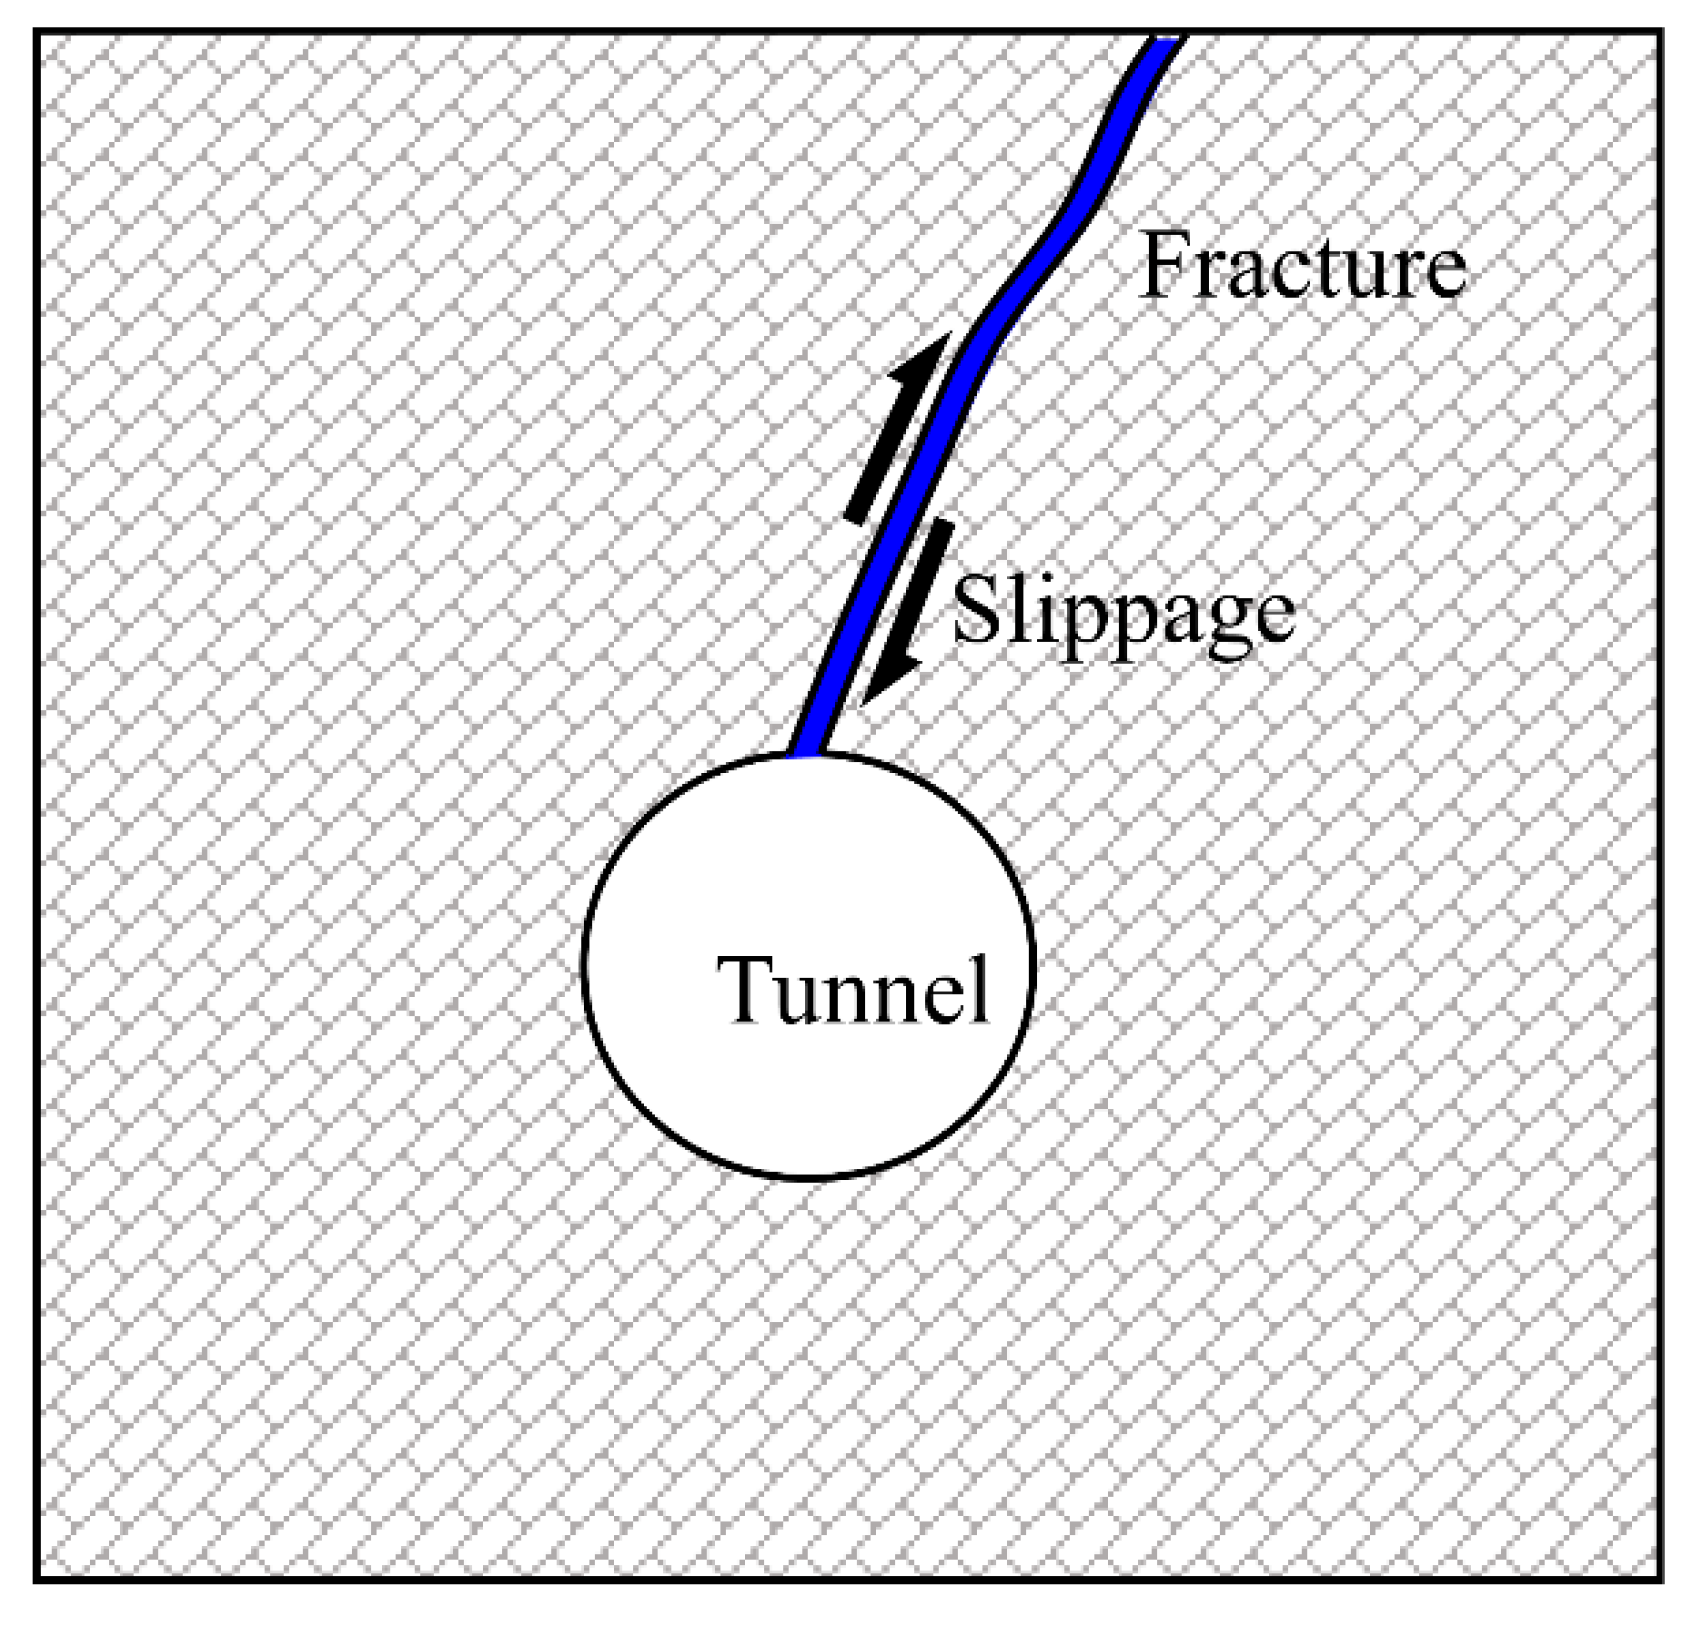
The stress distribution due to the excavation induced slippage on the fractures around the tunnel, at an impact distance of approximately 8.2 m from the tunnel wall.
(4)
The increased fracture width due to shear dilatation on the fracture increases the tunnel inflow rate by approximately 50%, highlighting the importance of mechanical effects on tunnel inflow, particularly during tunnel construction.
(5)
The fracture density, dip angle, stress anisotropy, and initial fracture width have significant impact on the inflow rate, with the order dip angle > initial fracture width > fracture density > stress anisotropy. When using the proposed model to predict water inflow, values should be taken based on actual geological environmental conditions.
Due to the extremely complex geological environment in practical engineering, there are strong uncertainties in the true distribution of fractures, which limits the accuracy of the proposed method. Moreover, cavities are also an inevitable structure in the surrounding rock, and they also have a significant effect on the prediction of water inflow. These factors are not fully taken into account in this paper. At a later stage, we will carry out a more detailed study on this aspect to expand the application value of the proposed method, provide favorable tools for reducing tunnel disaster risks, and promoting sustainable economic and social development.

Author Contributions

Conceptualization, G.L. and C.L.; Methodology, J.L.; Formal analysis, J.L. and H.W.; Investigation, G.L.; Resources, G.L.; Data curation, C.L.; Writing—original draft, G.L.; Writing—review & editing, J.L. and H.W.; Visualization, C.L.; Funding acquisition, J.L. and H.W. All authors have read and agreed to the published version of the manuscript.

Funding

This work was supported by the Guizhou Provincial Science and Technology Projects (No. QKHJC-ZK[2022]YB104 & QKHJC-ZK[2023]YB074).

Conflicts of Interest

The authors declare no conflict of interest.

References

  1. Huang, Q.; Peng, J.; Wang, F.; Lliu, N. Issues and challenges in the development of urban underground space in adverse geological environment. Earth Sci. Front. 2019, 26, 85–94. [Google Scholar] [CrossRef]
  2. Ma, J.; Guan, J.; Duan, J.; Huang, L.; Liang, Y. Stability analysis on tunnels with karst caves using the distinct lattice spring model. Undergr. Space 2021, 6, 469–481. [Google Scholar] [CrossRef]
  3. Liu, N.; Pei, J.; Cao, C.; Liu, X.; Huang, Y.; Mei, G. Geological investigation and treatment measures against water inrush hazard in karst tunnels: A case study in Guiyang, southwest China. Tunn. Undergr. Space Technol. 2022, 124, 104491. [Google Scholar] [CrossRef]
  4. Zhang, Q.; Tian, S.; Mo, Y.; Dong, X.; Hao, S. An expert system for prediction of Karst disaster in excavation of tunnels or underground structures through a carbonate rock area. Tunn. Undergr. Space Technol. 1993, 8, 373–378. [Google Scholar] [CrossRef]
  5. Zheng, Y.; Yan, J.; Su, R.; Ma, S.; Li, Y.; Wang, X.; Zheng, J.; Zhu, Y.; Yu, Y. Investigation of the settlement mechanism and control measures of a super-large section tunnel in a giant karst cave using ultra-thick backfill method. Tunn. Undergr. Space Technol. 2023, 137, 104956. [Google Scholar] [CrossRef]
  6. Jing, H.; Wu, J.; Yin, Q.; Wang, K. Deformation and failure characteristics of anchorage structure of surrounding rock in deep roadway. Int. J. Min. Sci. Technol. 2020, 30, 593–604. [Google Scholar] [CrossRef]
  7. Berisavljević, Z.; Bajić, D.; Jovičić, V. Development and Application of Methodology for Quantification of Overbreaks in Hard Rock Tunnel Construction. Appl. Sci. 2023, 13, 1379. [Google Scholar]
  8. Wang, J.; Li, S.; Li, L.; Xu, Z. Dynamic evolution characteristics and prediction of water Inflow of karst piping-type Water Inrush of Tunnels. Chin. J. Geotech. Eng. 2018, 40, 1880–1888. [Google Scholar]
  9. Shi, S.; Guo, W.; Li, S.; Xie, X.; Li, X.; Zhao, R.; Xue, Y.; Lu, J. Prediction of tunnel water inflow based on stochastic deterministic three-dimensional fracture network. Tunn. Undergr. Space Technol. 2023, 135, 104997. [Google Scholar] [CrossRef]
  10. Kong, W.K. Water Ingress Assessment for Rock Tunnels: A Tool for Risk Planning. Rock Mech. Rock Eng. 2011, 44, 755–765. [Google Scholar] [CrossRef]
  11. Raymer, J. Groundwater inflow into hard rock tunnels. Tunn. Tunn. Int. 2001, 33, 50–53. [Google Scholar]
  12. Wu, J.; Zhou, Z.; Zhuang, C. A combined analytical-numerical method for groundwater inflow into circular tunnels in drained conditions. Hydrogeol. J. 2021, 29, 2529–2543. [Google Scholar] [CrossRef]
  13. Li, L.; Sun, S.; Wang, J.; Yang, W.; Song, S.; Fang, Z. Experimental study of the precursor information of the water inrush in shield tunnels due to the proximity of a water-filled cave. Int. J. Rock Mech. Min. Sci. 2020, 130, 104320. [Google Scholar] [CrossRef]
  14. Liang, D.-x.; Jiang, Z.-q.; Zhu, S.-y.; Sun, Q.; Qian, Z.-w. Experimental research on water inrush in tunnel construction. Nat. Hazards 2016, 81, 467–480. [Google Scholar] [CrossRef]
  15. Wang, Y.; Chen, F.; Sui, W.; Meng, F.; Geng, F. Large-scale model test for studying the water inrush during tunnel excavation in fault. Bull. Eng. Geol. Environ. 2022, 81, 238. [Google Scholar] [CrossRef]
  16. Ma, J.; Zhao, J.; Lin, Y.; Liang, J.; Chen, J.; Chen, W.; Huang, L. Study on Tamped Spherical Detonation-Induced Dynamic Responses of Rock and PMMA Through Mini-chemical Explosion Tests and a Four-Dimensional Lattice Spring Model. Rock Mech. Rock Eng. 2023, 56, 7357–7375. [Google Scholar] [CrossRef]
  17. Sweetenham, M.G.; Maxwell, R.M.; Santi, P.M. Assessing the timing and magnitude of precipitation-induced seepage into tunnels bored through fractured rock. Tunn. Undergr. Space Technol. 2017, 65, 62–75. [Google Scholar] [CrossRef]
  18. Peng, X.; Yu, P.; Cheng, X.; Chen, G.; Zhang, Y.; Zhang, H.; Li, C. Dynamic simulation of the water inrush process in tunnel construction using a three-dimensional coupled discontinuous deformation analysis and smoothed particle hydrodynamics method. Tunn. Undergr. Space Technol. 2022, 127, 104612. [Google Scholar] [CrossRef]
  19. Li, Z.; Wang, Y.; Olgun, G.; Yang, S.-Q.; Jiao, Q.; Wang, M. Risk assessment of water inrush caused by karst cave in tunnels based on reliability and GA-BP neural network. Geomat. Nat. Hazards Risk 2020, 11, 1212–1232. [Google Scholar] [CrossRef]
  20. Liu, D.; Xu, Q.; Tang, Y.; Jian, Y. Prediction of Water Inrush in Long-Lasting Shutdown Karst Tunnels Based on the HGWO-SVR Model. IEEE Access 2021, 9, 6368–6378. [Google Scholar] [CrossRef]
  21. Li, S.-c.; He, P.; Li, L.-p.; Shi, S.-s.; Zhang, Q.-q.; Zhang, J.; Hu, J. Gaussian process model of water inflow prediction in tunnel construction and its engineering applications. Tunn. Undergr. Space Technol. 2017, 69, 155–161. [Google Scholar] [CrossRef]
  22. Li, Y.; Zhang, D.; Fang, Q.; Yu, Q.; Xia, L. A physical and numerical investigation of the failure mechanism of weak rocks surrounding tunnels. Comput. Geotech. 2014, 61, 292–307. [Google Scholar] [CrossRef]
  23. Miccoli, L.; Garofano, A.; Fontana, P.; Müller, U. Experimental testing and finite element modelling of earth block masonry. Eng. Struct. 2015, 104, 80–94. [Google Scholar] [CrossRef]
  24. Wu, J.; Jing, H.; Yin, Q.; Yu, L.; Meng, B.; Li, S. Strength prediction model considering material, ultrasonic and stress of cemented waste rock backfill for recycling gangue. J. Clean. Prod. 2020, 276, 123189. [Google Scholar] [CrossRef]
  25. Wu, J.; Jing, H.; Gao, Y.; Meng, Q.; Yin, Q.; Du, Y. Effects of carbon nanotube dosage and aggregate size distribution on mechanical property and microstructure of cemented rockfill. Cem. Concr. Compos. 2022, 127, 104408. [Google Scholar] [CrossRef]
  26. Karimzade, E.; Sharifzadeh, M.; Zarei, H.R.; Shahriar, K.; Cheraghi Seifabad, M. Prediction of water inflow into underground excavations in fractured rocks using a 3D discrete fracture network (DFN) model. Arab. J. Geosci. 2017, 10, 206. [Google Scholar] [CrossRef]
  27. Chen, T.; Yin, H.; Zhai, Y.; Xu, L.; Zhao, C.; Zhang, L. Numerical Simulation of Mine Water Inflow with an Embedded Discrete Fracture Model: Application to the 16112 Working Face in the Binhu Coal Mine, China. Mine Water Environ. 2022, 41, 156–167. [Google Scholar] [CrossRef]
  28. Han, G.; Jing, H.; Jiang, Y.; Liu, R.; Wu, J. Effect of Cyclic Loading on the Shear Behaviours of Both Unfilled and Infilled Rough Rock Joints Under Constant Normal Stiffness Conditions. Rock Mech. Rock Eng. 2020, 53, 31–57. [Google Scholar] [CrossRef]
  29. Yin, Q.; Nie, X.; Wu, J.; Wang, Q.; Bian, K.; Jing, H. Experimental study on unloading induced shear performances of 3D saw-tooth rock fractures. Int. J. Min. Sci. Technol. 2023, 33, 463–479. [Google Scholar] [CrossRef]
  30. Bandis, S.C.; Lumsden, A.C.; Barton, N.R. Fundamentals of rock joint deformation. Int. J. Rock Mech. Min. Sci. Geomech. Abstr. 1983, 20, 249–268. [Google Scholar] [CrossRef]
  31. Ma, J.; Chen, J.; Chen, W.; Huang, L. A coupled thermal-elastic-plastic-damage model for concrete subjected to dynamic loading. Int. J. Plast. 2022, 2022, 103279. [Google Scholar] [CrossRef]
  32. Zhou, L.; Su, X.; Lu, Y.; Ge, Z.; Zhang, Z.; Shen, Z. A New Three-Dimensional Numerical Model Based on the Equivalent Continuum Method to Simulate Hydraulic Fracture Propagation in an Underground Coal Mine. Rock Mech. Rock Eng. 2019, 52, 2871–2887. [Google Scholar] [CrossRef]
  33. Zhang, K.; Yamamoto, H.; Pruess, K. TMVOC-MP: A Parallel Numerical Simulator for Three-PhaseNon-Isothermal Flows of Multicomponent Hydrocarbon Mixtures Inporous/Fractured Media; Lawrence Berkeley National Lab.: Berkeley, CA, USA, 2007. [Google Scholar] [CrossRef]
  34. Lin, Y.; Ma, J.; Lai, Z.; Huang, L.; Lei, M. A FDEM approach to study mechanical and fracturing responses of geo-materials with high inclusion contents using a novel reconstruction strategy. Eng. Fract. Mech. 2023, 282, 109171. [Google Scholar] [CrossRef]
  35. Liao, J.; Hu, K.; Mehmood, F.; Xu, B.; Teng, Y.; Wang, H.; Hou, Z.; Xie, Y. Embedded discrete fracture network method for numerical estimation of long-term performance of CO2-EGS under THM coupled framework. Energy 2023, 285, 128734. [Google Scholar] [CrossRef]
  36. Farhadian, H.; Katibeh, H.; Huggenberger, P. Empirical model for estimating groundwater flow into tunnel in discontinuous rock masses. Environ. Earth Sci. 2016, 75, 471. [Google Scholar] [CrossRef]
  37. Maleki, M.; Imani, M. Active lateral pressure to rigid retaining walls in the presence of an adjacent rock mass. Arab. J. Geosci. 2022, 15, 152. [Google Scholar] [CrossRef]
  38. Maleki, M.; Khezri, A.; Nosrati, M.; Hosseini, S.M.M.M. Seismic amplification factor and dynamic response of soil-nailed walls. Model. Earth Syst. Environ. 2023, 9, 1181–1198. [Google Scholar] [CrossRef]
  39. Farhadian, H.; Nikvar-Hassani, A. Water flow into tunnels in discontinuous rock: A short critical review of the analytical solution of the art. Bull. Eng. Geol. Environ. 2019, 78, 3833–3849. [Google Scholar] [CrossRef]
  40. Fernandez, G.; Moon, J. Excavation-induced hydraulic conductivity reduction around a tunnel—Part 1: Guideline for estimate of ground water inflow rate. Tunn. Undergr. Space Technol. 2010, 25, 560–566. [Google Scholar] [CrossRef]
  41. Li, G.; Hu, Y.; Tian, S.M.; Weibin, M.; Huang, H.L. Analysis of deformation control mechanism of prestressed anchor on jointed soft rock in large cross-section tunnel. Bull. Eng. Geol. Environ. 2021, 80, 9089–9103. [Google Scholar]
  42. Alotaibi, M.; Alotaibi, S.; Weijermars, R. Stream and Potential Functions for Transient Flow Simulations in Porous Media with Pressure-Controlled Well Systems. Fluids 2023, 8, 160. [Google Scholar] [CrossRef]
  43. Molinero, J.; Samper, J.; Juanes, R. Numerical modeling of the transient hydrogeological response produced by tunnel construction in fractured bedrocks. Eng. Geol. 2002, 64, 369–386. [Google Scholar] [CrossRef]
Figure 1. Presentation of fractured rock.
Sustainability 15 14703 g001
Figure 2. Demonstration of shear damage in tunnel construction.
Sustainability 15 14703 g002
Figure 3. Permeability of fractured rock consists of fractured and intact rock.
Sustainability 15 14703 g003
Figure 4. Schematic diagram of the coupling pattern.
Sustainability 15 14703 g004
Figure 5. x-displacement comparing embedded fractures with actual fractures.
Sustainability 15 14703 g005
Figure 6. Resistivity tomography of tunnel cross-sections.
Sustainability 15 14703 g006
Figure 7. Hole SLH-5 for sampling, the purple circles represent fresh fissures, the other are natural fissures.
Sustainability 15 14703 g007
Figure 8. Geological information.
Sustainability 15 14703 g008
Figure 9. (a) Demonstration of model dimension and (b) fracture sets.
Sustainability 15 14703 g009
Figure 10. Mesh influence on numerical results.
Sustainability 15 14703 g010
Figure 11. Pressure contours at different times.
Sustainability 15 14703 g011
Figure 12. Pressure contours after 50 h, (a) with fractures and (b) without fractures.
Sustainability 15 14703 g012
Figure 13. Flow vectors, (a) with fractures and (b) without fractures.
Sustainability 15 14703 g013
Figure 14. Fracture width variation in fracture networks around tunnel section, (a) total fracture width, (b) dilatation fracture width.
Sustainability 15 14703 g014
Figure 15. Liquid saturation after 50 h, (a) with fractures and (b) without fractures.
Sustainability 15 14703 g015
Figure 16. (a) Comparison of inflow rates for the fractured and unfractured models; (b) comparison of inflow rates considering variable fracture (HM) and constant fracture (H).
Sustainability 15 14703 g016
Figure 17. Maximum instantaneous and fixed rates for different numbers of fractures.
Sustainability 15 14703 g017
Figure 18. Comparison of pressure contours after 50 h for different fracture number.
Sustainability 15 14703 g018
Figure 19. Maximum transient and steady rates for different inclination angles.
Sustainability 15 14703 g019
Figure 20. Comparison of pressure contours after 50 h for different incline angle.
Sustainability 15 14703 g020
Figure 21. Maximum instantaneous and steady rates at different horizontal stress ratios.
Sustainability 15 14703 g021
Figure 22. Comparison of pressure contours after 50 h for different horizontal stress ratios.
Sustainability 15 14703 g022
Figure 23. Maximum instantaneous and fixed rates for different initial fracture aperture sizes.
Sustainability 15 14703 g023
Figure 24. Comparison of pressure contours after 50 h for different initial fracture aperture models.
Sustainability 15 14703 g024
Table 1. Applied parameter in numerical model.
ParameterUnitValueData Source and Note
Young’s modulus EGPa15Labor test
Poisson ratio v-0.25Labor test
Friction   angle   of   fracture   φ °25Modelling progressive failure in fractured rock masses using a 3D discrete element method
Cohesion of fracture CKPa0Modelling progressive failure in fractured rock masses using a 3D discrete element method
Permeability of intact rock kIm210−15Labor test
Porosity   of   intact   rock   ϕ I %10Labor test
Permeability of fractured rock kfm2Equation (18)Calculated
Porosity   of   fractured   rock   ϕ F %Equation (19)Calculated
Initial fracture width winmm0.4Sensitive analysis
Numberer of fractures N-150Sensitive analysis
Incline angle β°60Sensitive analysis
Horizontal stress ratio k0-0.6Sensitive analysis
Disclaimer/Publisher’s Note: The statements, opinions and data contained in all publications are solely those of the individual author(s) and contributor(s) and not of MDPI and/or the editor(s). MDPI and/or the editor(s) disclaim responsibility for any injury to people or property resulting from any ideas, methods, instructions or products referred to in the content.

