Article

Experimental and Numerical Study of Water–Rock Coupling Creep under Uniaxial Compression

1
School of Civil Engineering, Nanyang Institute of Technology, Nanyang 473000, China
2
Henan International Joint Laboratory of Dynamics of Impact and Disaster of Engineering Structures, Nanyang Institute of Technology, 80 Changjiang Road, Nanyang 473004, China
3
State Key Laboratory for GeoMechanics and Deep Underground Engineering, China University of Mining and Technology (Beijing), Beijing 100083, China
*
Authors to whom correspondence should be addressed.
Sustainability 2023, 15(20), 14718; https://doi.org/10.3390/su152014718
Submission received: 25 August 2023 / Revised: 29 September 2023 / Accepted: 2 October 2023 / Published: 10 October 2023
(This article belongs to the Special Issue Challenges and Strategies for Sustainable Development in Deep Mines)

Abstract

:
In order to study the influence of the long-term strength of the rock surrounding deep roadways under the action of groundwater on surrounding rock stability, taking the rock surrounding the deep roadway of the Wanfu Coal Mine as the main research object, uniaxial compression and uniaxial creep tests were carried out on sandstone samples under different water-content states. It was found that the water content had an obvious softening effect on short-term and long-term strength, and both strengths showed a negative exponentially declining relationship. The viscosity modulus ( E ¯ v ) was put forward to describe viscoelastic creep deformation. And damage variables corresponding to E (the instantaneous elastic modulus) and E ¯ v were proposed. A sticky element that can describe the accelerated creep behavior was also established to improve the Nishihara model, based on the experimental results and damage theory. A comparison of the identified parameters and the experimental curves showed that the model can describe the mechanical behavior of various creep stages well. The model was developed using the ABAQUS user subroutine function, and the uniaxial compression creep experiment was simulated. The simulation results were basically consistent with the experimental results, which provide a basis for the further long-term stable use of roadway and creep failure simulation and have important practical and guiding significance.

1. Introduction

The theory of rock strength softening holds that water in rock will reduce the short-term strength and long-term strength of a rock to different degrees. Many scholars have conducted research on short-term strength under different water-content conditions, including uniaxial compression tests, triaxial compression tests, and splitting tests. At present, scholars around the world have carried out a large number of tests on different rocks to study the compressive strength, elastic modulus, tensile strength, and other parameters of rocks affected by water content or saturation, including sandstone, slate, mudstone, etc. Starting with Price, scholars [1,2,3,4,5,6] carried out indoor experimental compression studies and concluded that the strength decline of sandstone mainly occurred when the saturation was less than 20%, and the strength drop was not significant under high-water-content conditions. From the dry state to the saturated state, the uniaxial compressive strength, elastic modulus, and tensile strength of the rock decreased by 60–90%. These studies showed that the decreasing trends of the strength and elastic modulus of sandstone obviously had negative exponentially declining relationships with the water content. It was found that the water content was the most important factor leading to decreases in rock strength and modulus, and the contents of different mineral components had impacts on rock softening, especially the clay minerals contained in rock materials [7,8,9,10]. Feng et al. [11] investigated the effects of the moisture content and intermediate principal stress on the failure behavior and rockburst response of sandstone under true triaxial unloading conditions. The results indicate that the presence of water may reduce the possibility of rockburst, and the intermediate principal stress exhibits distinct functions in the failure behavior of natural and saturated sandstone, which represent significant findings for preventing dynamic disasters, such as rockbursts.
Wong et al. [12] found that the strength effect of sedimentary rocks is generally more serious than that of igneous rocks and metamorphic rocks through a statistical analysis of a large number of studies since 1960. Sandstone, as a kind of rock material rich in clay minerals, is greatly affected by water–rock coupling.
In terms of the study of water–rock coupling creep, scholars [13,14,15,16] have carried out experimental research on the water–rock coupling creep characteristics of a variety of rocks. It has been found that the instantaneous strain and total creep strain of rock are positively correlated with the water content under the water–rock coupling effect. Saturated samples will enter the creep deformation stage at a lower stress level, the cumulative creep deformation of saturated samples is much larger than that of dry samples, and an increase in the water content greatly improves the creep speed. On an experimental basis, a creep model considering water weakening was established using the theory of the primordial model. Tao et al. [17] conducted a comparative study of the Burgers model and Nishihara model and believed that both the Burgers model and Nishihara model were suitable for soft rock, while the Nishihara model had a wider range. Scholars have also carried out studies of the creep model based on the Nishihara model and described the decay creep and steady creep characteristics of all kinds of rocks [18,19,20].
Due to the characteristics of the above models, they can describe the first two stages of the creep curve, but they are not sufficient to describe the deformation law of rock material in the accelerated creep failure stage. Rock is a nonlinear, heterogeneous, anisotropic, and complex material, and its creep process is a complex process of elastic, viscous, and plastic coexistence. The nonlinear variation in the creep deformation and creep rate in the accelerated section, coupled with the effects of multiple fields, greatly increases the complexity of the creep law of rock.
Therefore, scholars have continuously improved the existing basic model in the research process; analyzed different creep deformation amounts, deformation rates, failure modes, and viscoplastic deformation relationships caused by different water contents; and tried to reveal the mechanism of the influence of water on rock creep, thus establishing the creep constitutive equation considering water damage [21,22]. In addition, some studies improved the Nishihara model and introduced nonlinear viscoplastic elements [23,24,25,26] to describe the accelerated creep behavior of rocks.
In order to further reveal the influence of the water saturation degree of each creep stage under the coupled action of water, in this study, the deformation law in the creep process of each stage was further analyzed and the damage evolution law in the creep process was classified, based on previous studies. In addition, the creep damage law of different deformation stages was improved, and an improved Nishihara model was obtained. At the same time, the secondary development function ABAQUS software [27,28,29] was used in the numerical calculation of the creep process. Compared with the experimental results, the accuracy of the model was verified.

2. Experimental Sample and Scheme

2.1. Sample Preparation and Basic Properties

The sandstone samples selected in this paper were from the Wanfu Coal Mine in Shandong Province. Cores drilled on site were processed into standard cylindrical samples (φ 50 mm × 100 mm) for laboratory experiments. And the surface flatness and the parallelism of the top and bottom faces of all samples were within the specified error range (the surface flatness was within ± 0.05 mm). Some sandstone samples are shown in Figure 1.
The mineral composition of the sandstone samples was obtained via X-ray Diffraction (XRD) experiments. They were mainly composed of quartz, clay minerals, potassium feldspar, and ankerite. Among them, quartz and clay minerals accounted for 78.5% and 17.6% of the mineral content, respectively. The components of the clay minerals were mainly kaolinite and chlorite, and they also contained a small amount of chlorite. The average wave velocity of the sandstone samples was 3.52 km/s. Samples with similar wave velocities were selected for the experiment to reduce the error between samples. In order to study the effect of the water content in the creep experiment, water absorption experiments were set up in advance, and the maximum water content of the sandstone was 3.3%. Therefore, five kinds of sandstone samples with different water contents were prepared, namely, the dry state (0%), 0.8%, 1.6%, 2.4%, and the saturated state (3.3%).

2.2. Design of Creep Experiment

A creep experiment was carried out on the Five-link Rheological Test System for Deep Soft Rock (Figure 2) developed by the State Key Laboratory of Deep Geomechanics and Underground Engineering of China University of Mining and Technology (Beijing, China). The parameters of the samples in this test are shown in Table 1. The creep experiment adopted the creep method of single-stage loading. In order to study the creep response of sandstone under the same stress condition, the initial creep stress was set to 18 MPa, and the incremental load between the two adjacent loads was 4.5 MPa. In addition, due to the low compressive strength of saturated sandstone, the initial creep stress was set to 9 MPa. After the full creep process, the next load was applied, and the creep time of each stage was set to 24 h until the creep failure of the samples occurred.

3. Experimental Results and Analysis

3.1. Analysis of Strength-Softening Experiment Results

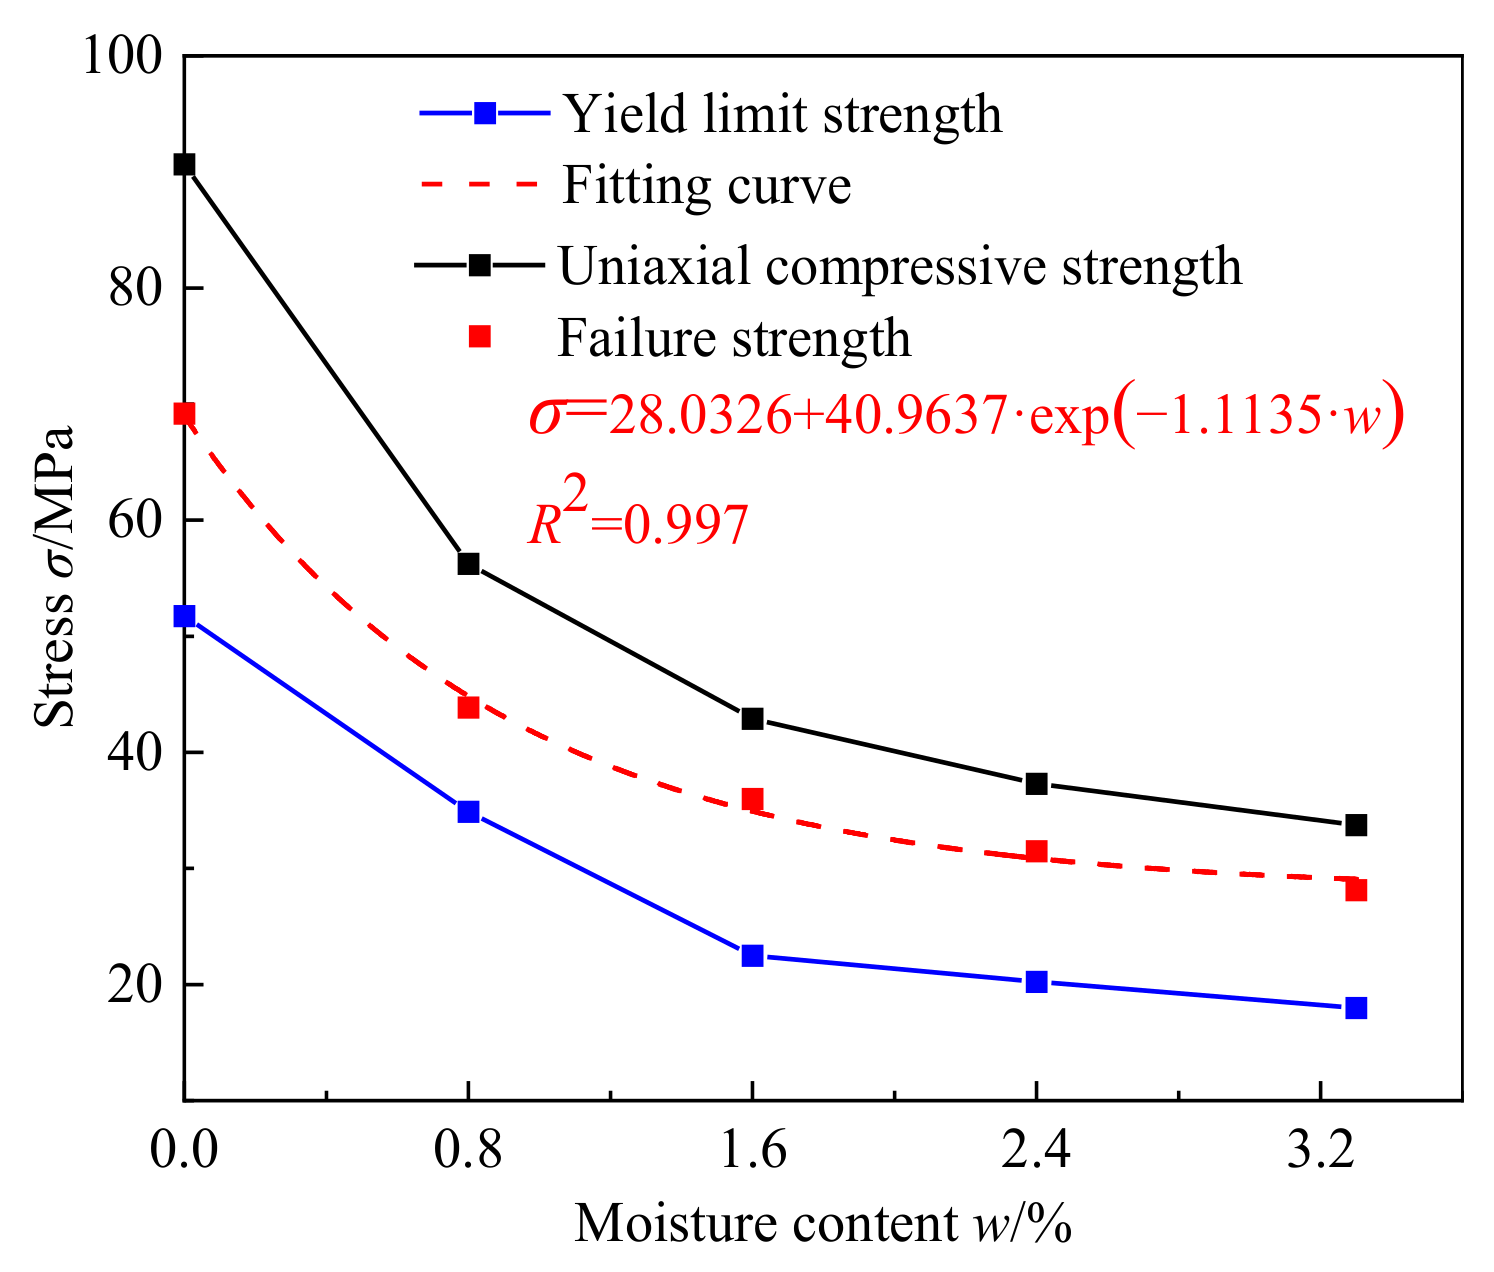
The uniaxial compression experiment results of sandstone samples with five different moisture contents are shown in Figure 3. The uniaxial compressive strength and elastic modulus of the sandstone samples showed negative exponential relationships with the water content, and both of them decreased continuously with the increase in the water content. From the dry state to the saturated state, the uniaxial compressive strength of the sandstone decreased from 90.67 MPa to 33.74 MPa, and the softening coefficient was 0.37. The elastic modulus decreased from 14.1 GPa to 7.3 GPa, a drop of 46%, indicating that the sandstone was obviously softened by the water content.

3.2. Creep Experiment Results

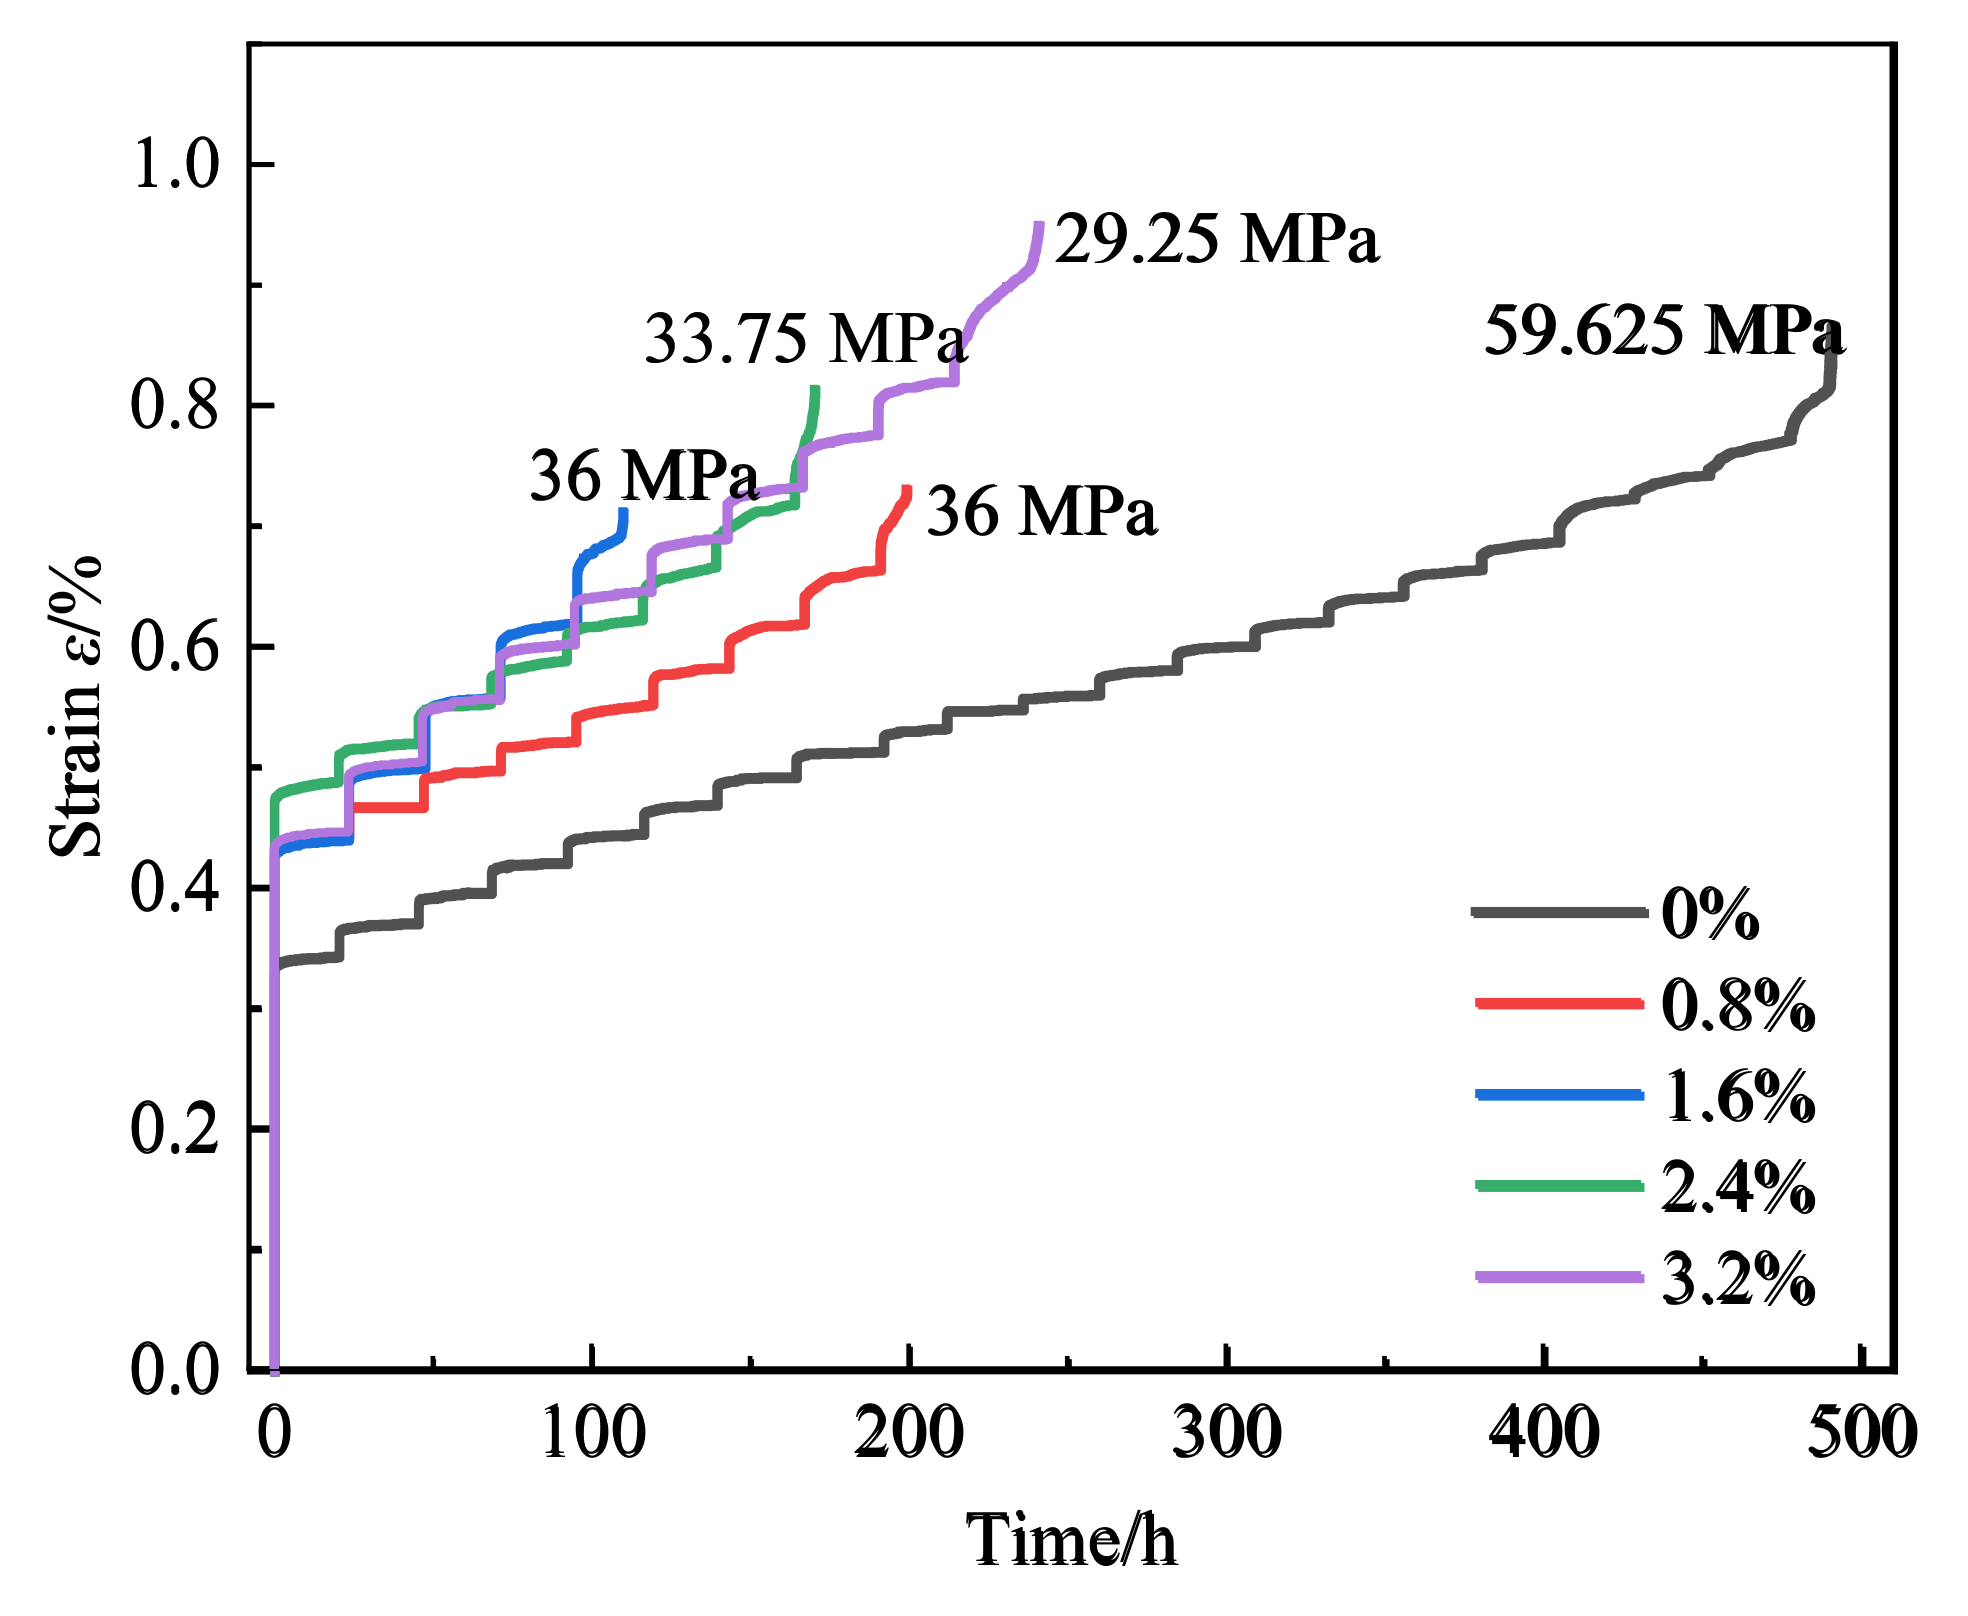
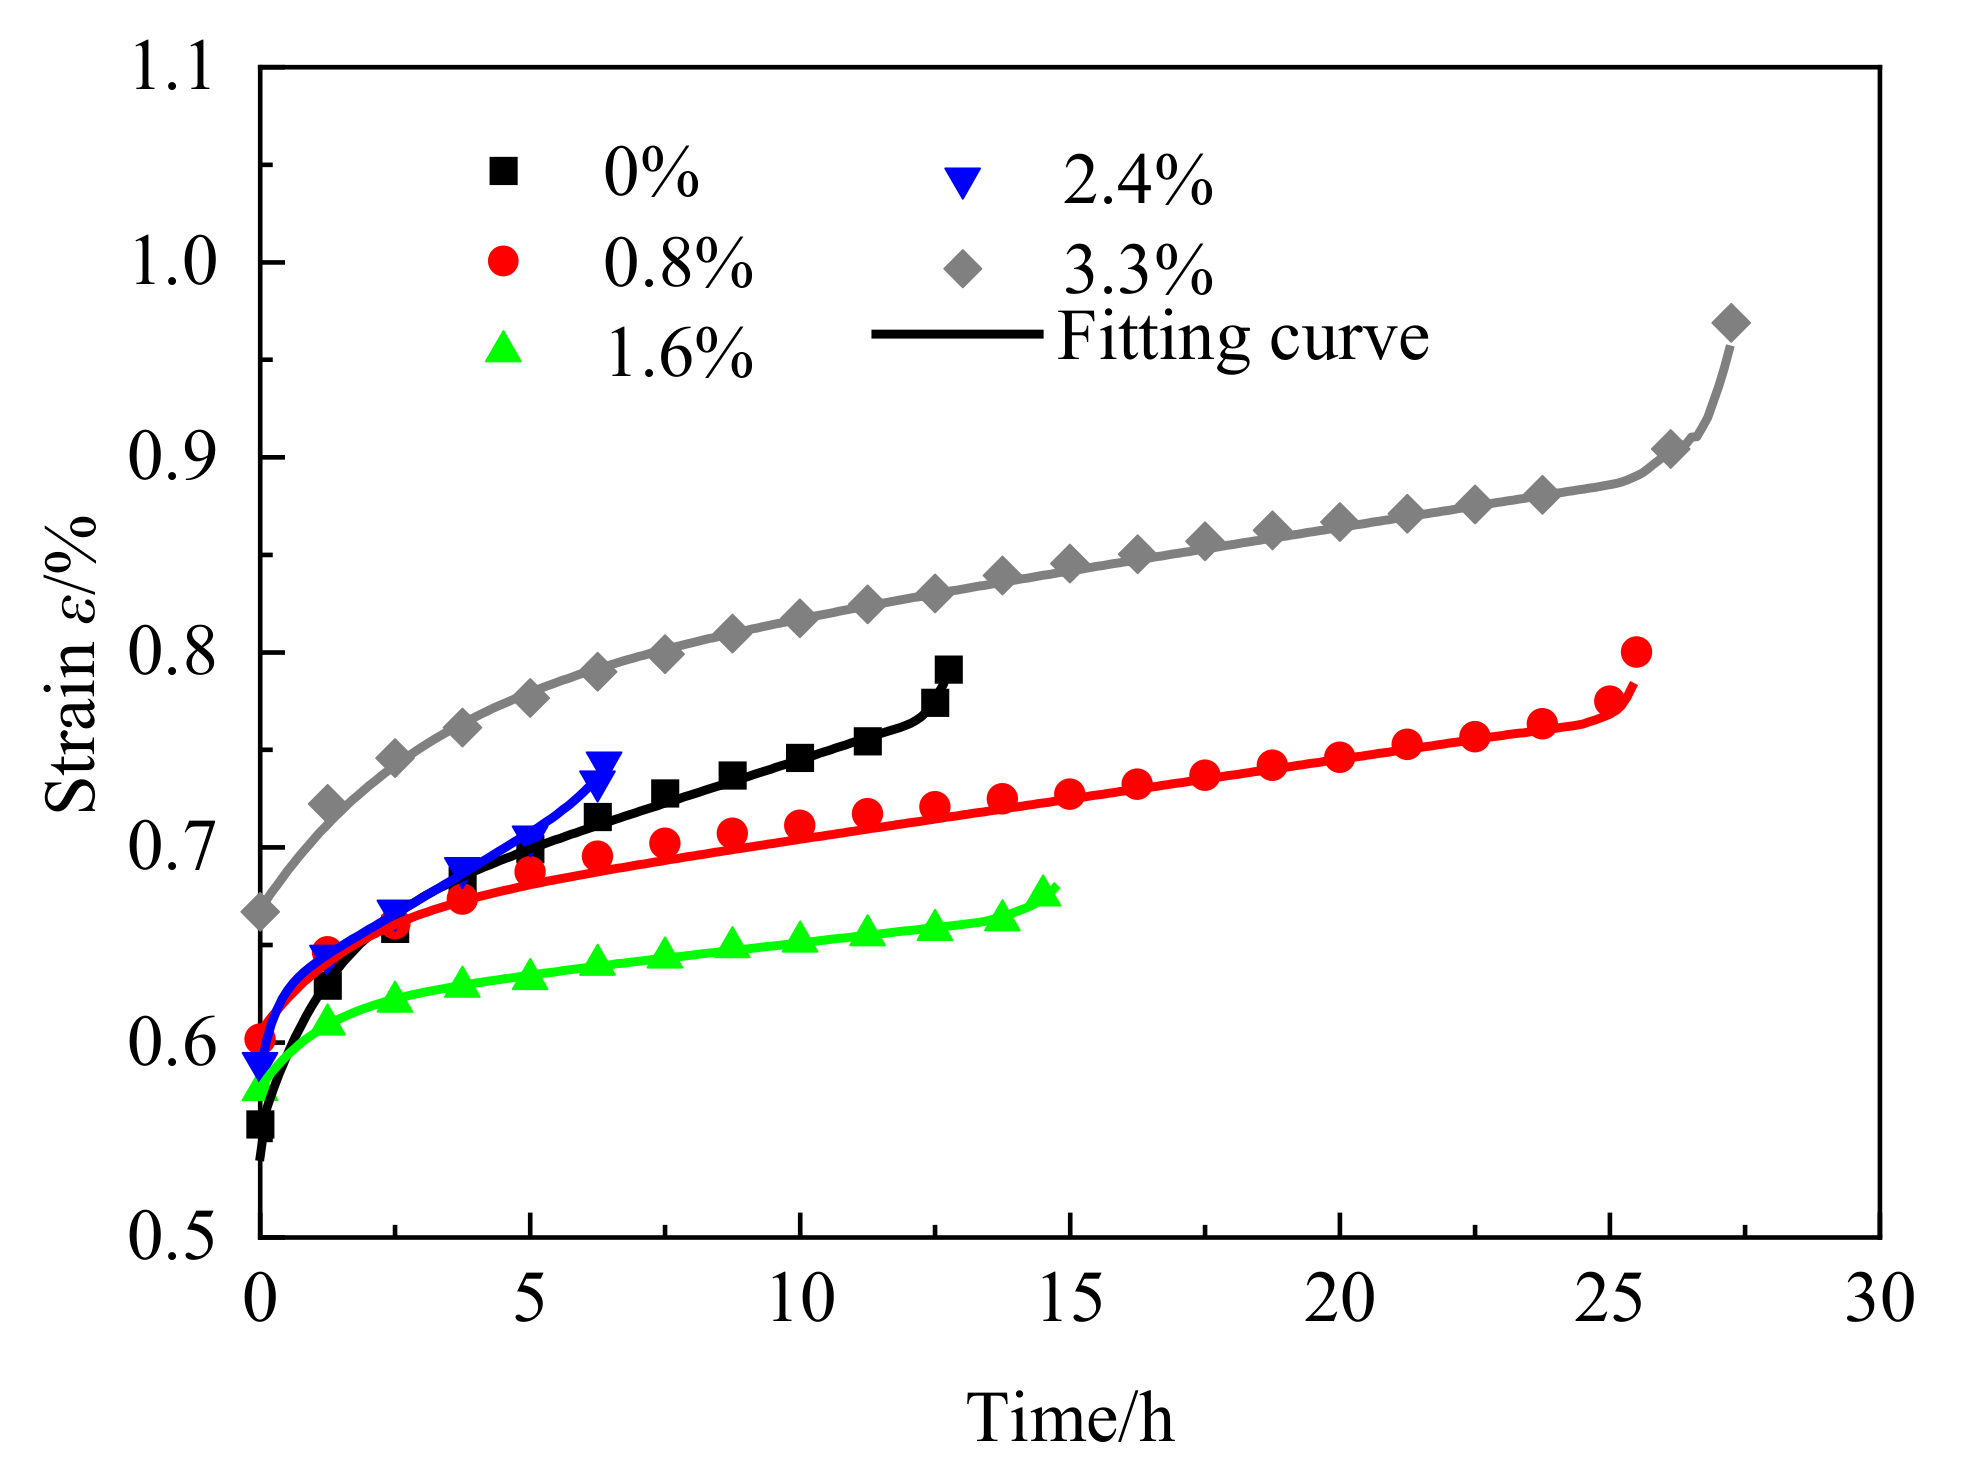
The creep results of sandstone samples with different water contents are shown in Figure 4. Due to the influence of water on the long-term strength of rocks, the dry samples failed under high stress. The average failure stress was 69.19 MPa, while the average failure stress of the saturated samples was 28.13 MPa. The detailed values are shown in Table 2. It can be clearly seen in Figure 3 that the creep failure stress of the sandstone decreased exponentially with the increase in the water content. It was found that the ratio of creep failure stress to uniaxial compressive strength was relatively stable, ranging from 0.76 to 0.84. Due to the limitation of the experimental design, it was suitable for the stress range when the accelerated creep failure occurred after about 24 h of sandstone creep. When the stress is less than this range, the rock will be damaged after a longer creep time, and when the stress is greater than this range, the creep failure will occur in a shorter time. When the stress is less than a certain threshold, the rock will not enter the steady-state creep stage after initial creep; therefore, creep failure will not occur. In order to further study the critical stress of rock entering the plastic deformation stage, namely, the yield limit stress (σs), the experimental creep data were processed.
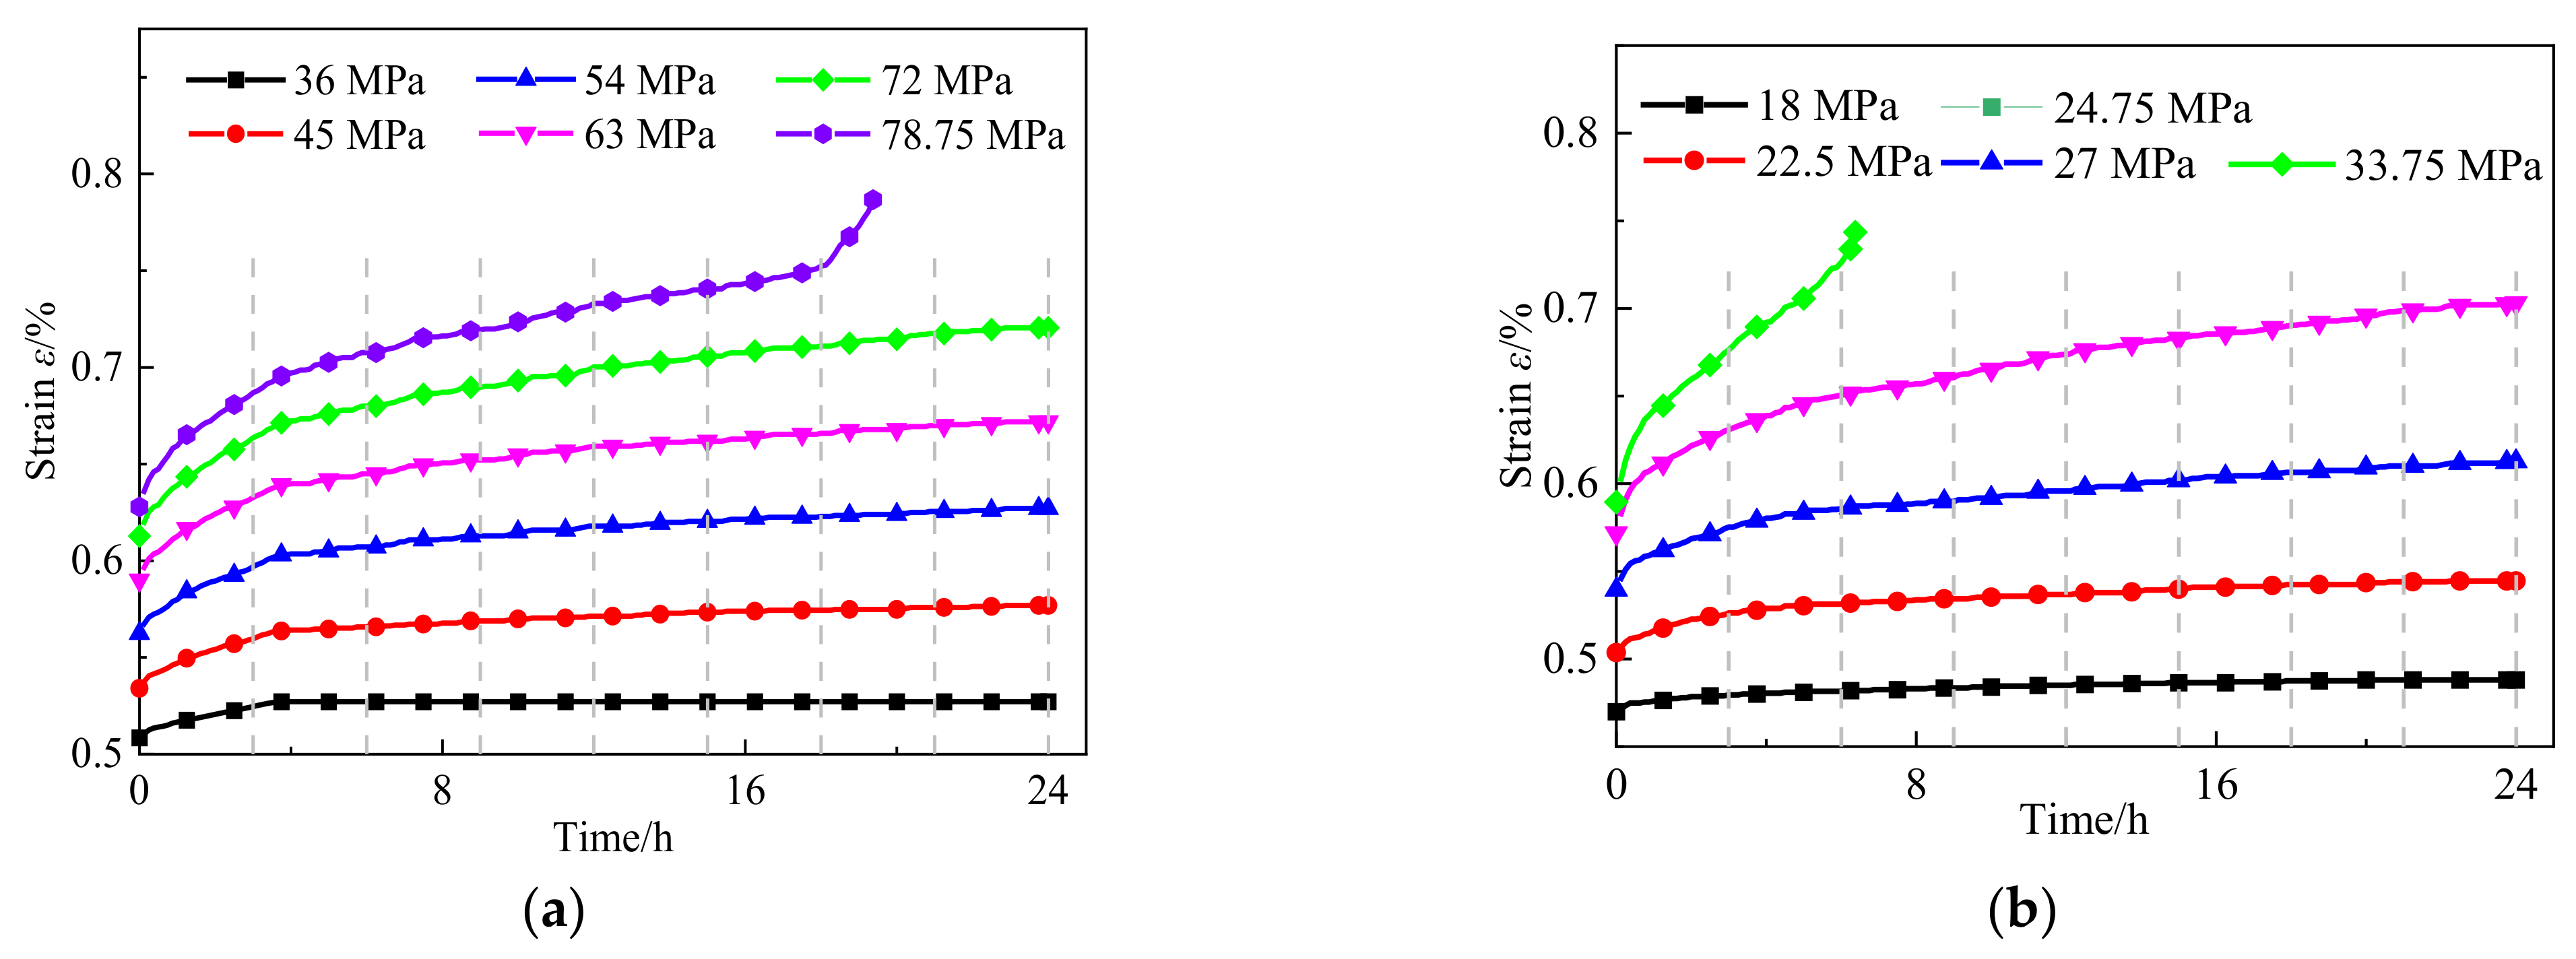
Using Chen’s loading method [30], the creep curves were processed, and the uniaxial creep curves of sandstone with different water contents under different graded loads were obtained. In order to study the influence of water on the viscoelastic deformation stage of sandstone creep, the instantaneous strain generated by the applied stress was separated. Only the viscoelastic and viscoplastic deformation after the creep load was applied in each stage was studied, and the isochronous viscoelastic stress–strain curves were obtained. Taking the DR-20 and DR-23 sandstone samples as examples, the creep curves of the graded loading are shown in Figure 5. When the stress was at the initial load and a low stress level, the sandstone samples showed viscoelastic deformation characteristics under the creep stress, and the strain remained stable. With the gradual increase in the load stress level, the steady creep stage, where the deformation grew steadily, appeared after the initial creep stage. In the last load stage, the samples entered the accelerated creep stage. There was a complete three-stage creep deformation and failure process.
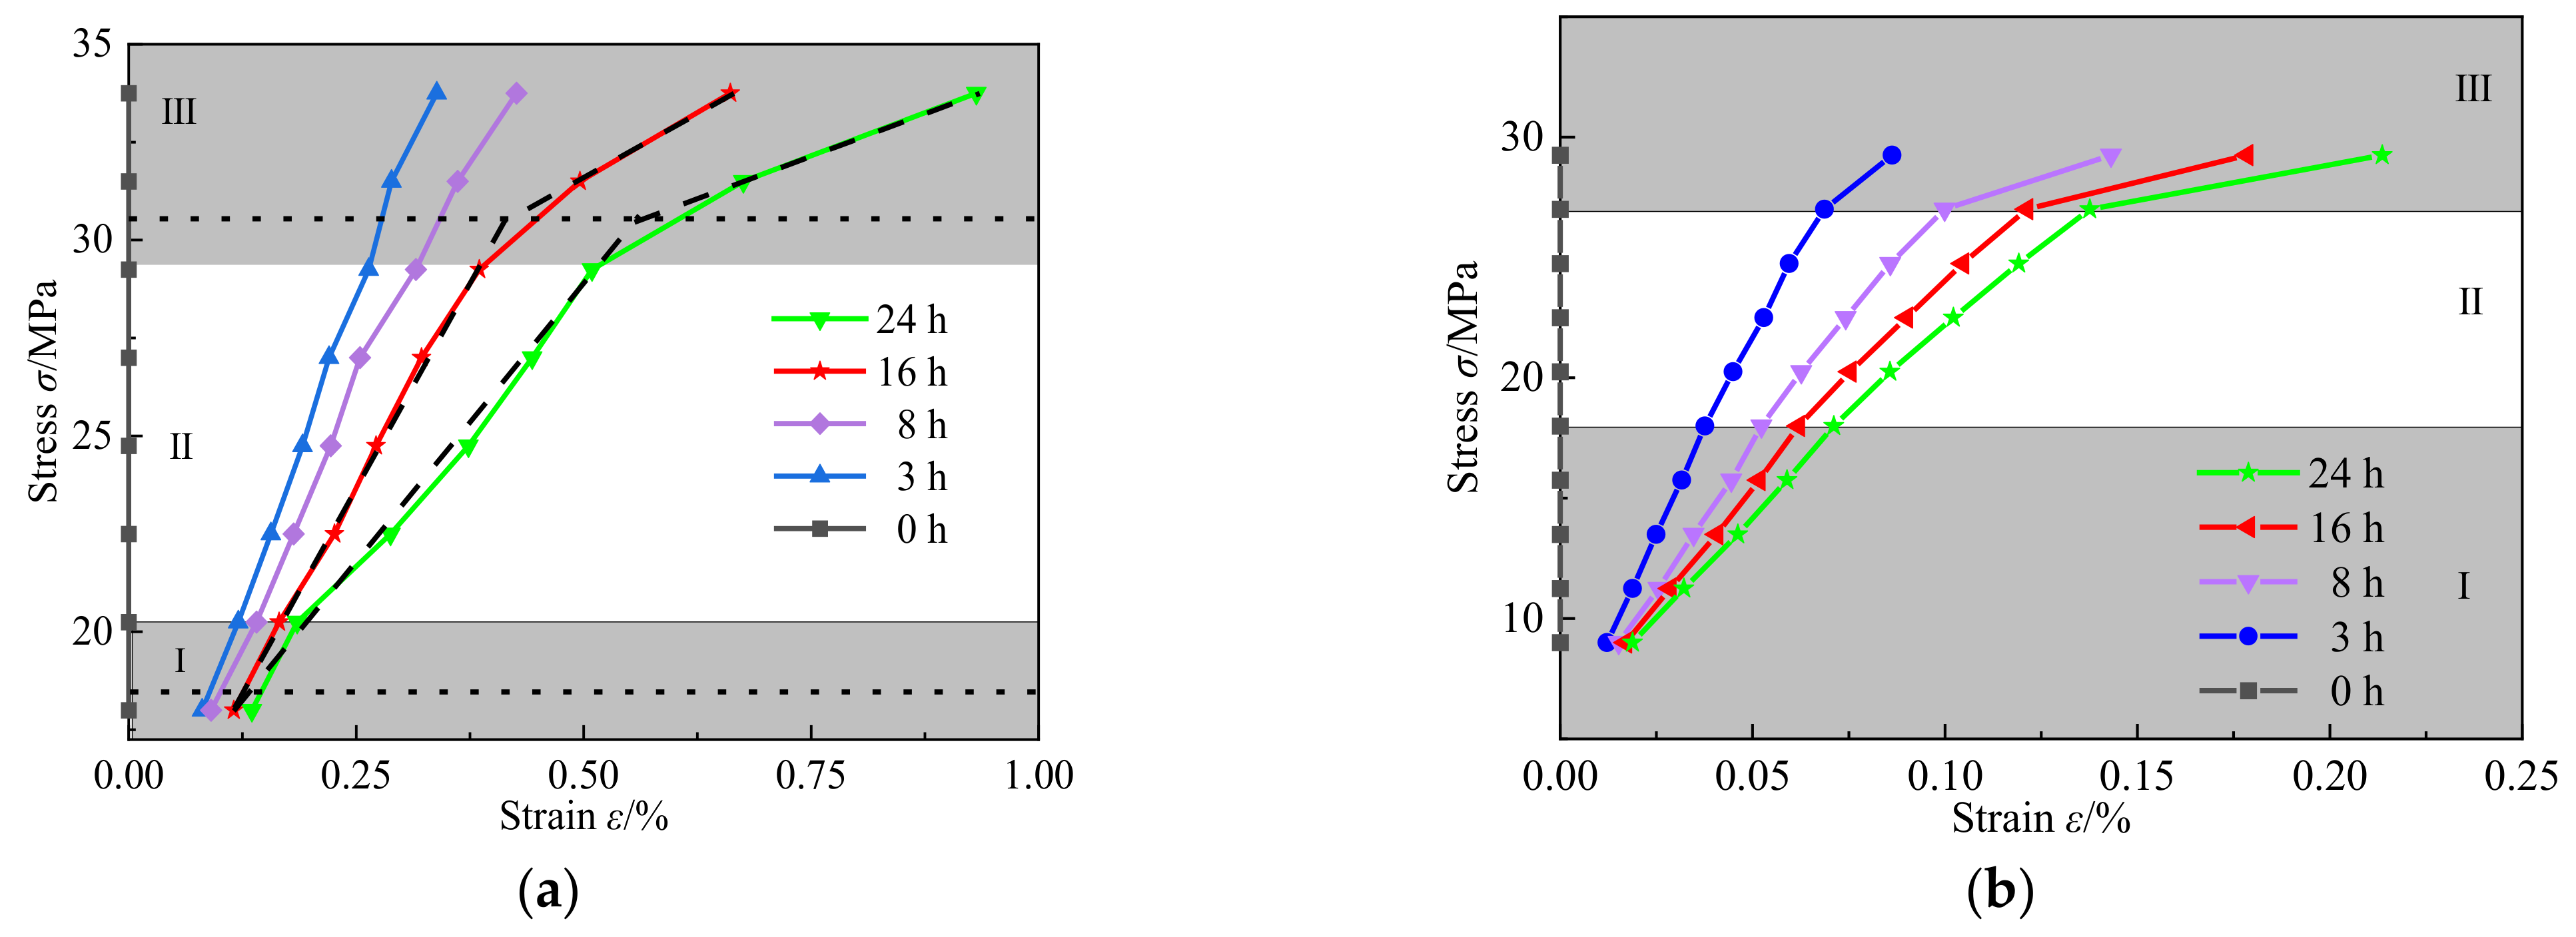
By processing the stepped loading creep curve of sandstone, the isochronous stress–strain curves of sandstone with different moisture contents could be obtained [30]. A total of nine times were selected, including 0, 3, 6, 9, 12, 15, 18, 21, and 24 h, and the stress–strain curves at different times formed a curve cluster. In this paper, the viscoelastic stress–strain isochronous curves of the DR-21 and DR-24 sandstone samples were obtained, as shown in Figure 6. The following results could be obtained by analyzing the creep curves. When the creep stress was small, the strain was basically stable after a short period of the initial creep stage, and the strain remained basically unchanged after 24 h of creep. The value was related to the creep stress, and there was a linear increase in the first stage, as shown in Figure 6. According to the creep theory, the strain in this process was a viscoelastic deformation, which could be fitted by the viscoelastic equation in the Nishihara model. When the stress exceeded a certain value, the isochronous creep curves entered the second stage, and plastic deformation occurred during the creep process. It can be seen that the isochronous creep curve also showed a linear increase after 24 h of creep, and it indicated that the plastic deformation increased linearly with the increase in the creep stress. The critical stress between the two stages was expressed by the yield limit strength (σs) in the Nishihara model. Then, with the stress further increasing, the strain increased nonlinearly after reaching a certain stress, and the isochronous creep curves entered the third stage. Therefore, this critical stress is defined as the accelerated yield limit strength, which is expressed by σas. Therefore, the creep process can be divided into three stages according to the stress in the isochronous curve.
The difference in slope between the first-stage curve and the second-stage curve was small. In order to study the effect of different moisture contents on the viscosity during creep, the slope of the two-stage isochronous curve could be defined as a new viscous elastic modulus. It was expressed as E ¯ v , and the value was equal to the average value of the slope of the isochronous curve with the same moisture content. It was used to describe the evolution law of the viscous strain in the whole creep process. It was found that the ratio of the accelerated yield limit to the compressive strength ranged from 0.66 to 0.73, as shown in Table 2, and there was little difference in the final failure stress. Therefore, this modulus can be used as an approximate substitution of the whole process of creep. It can be seen that the viscous modulus ( E ¯ v ) and the instantaneous elastic modulus (E) decreased nonlinearly with the increase in the water content, and their softening equations were obtained as shown in Figure 7.

4. Constitutive Creep Damage Model

4.1. Damage Variable

According to the basic definition of damage theory, the ratio of the material defect area to the total effective bearing area is used to represent damage:
D = A 0 A w A 0
where A0 and Aw are the effective bearing area and the effective bearing area in a damaged state, respectively.
Therefore, the damage variable of the water absorption strength of sandstone can be defined as
D E = 1 E w E 0
Combined with the fitting equation of the elastic modulus changing with the moisture content, the damage equation of the elastic modulus is as follows:
D E = 0.4209 0.4209 exp ( 1.554 w )
The long-term creep damage is defined according to the change in the viscous modulus, which is consistent with the idea of defining instantaneous elastic damage. It was considered that the rock was in a non-destructive state in the dry condition, and its viscous modulus was E ¯ 0 . When the water content of the sandstone changed, the creep modulus of the sandstone gradually decayed, and when the water content reached a saturation state, the creep modulus tended to reach a stable value. The creep damage variable can be defined as
D c = 1 E ¯ v E 0
Combined with the fitting equation of the creep modulus changing with the moisture content, the damage equation of the creep modulus can be expressed as
D c = 0.6445 0.6445 exp ( 0.8253 w )

4.2. Accelerated Creep Model

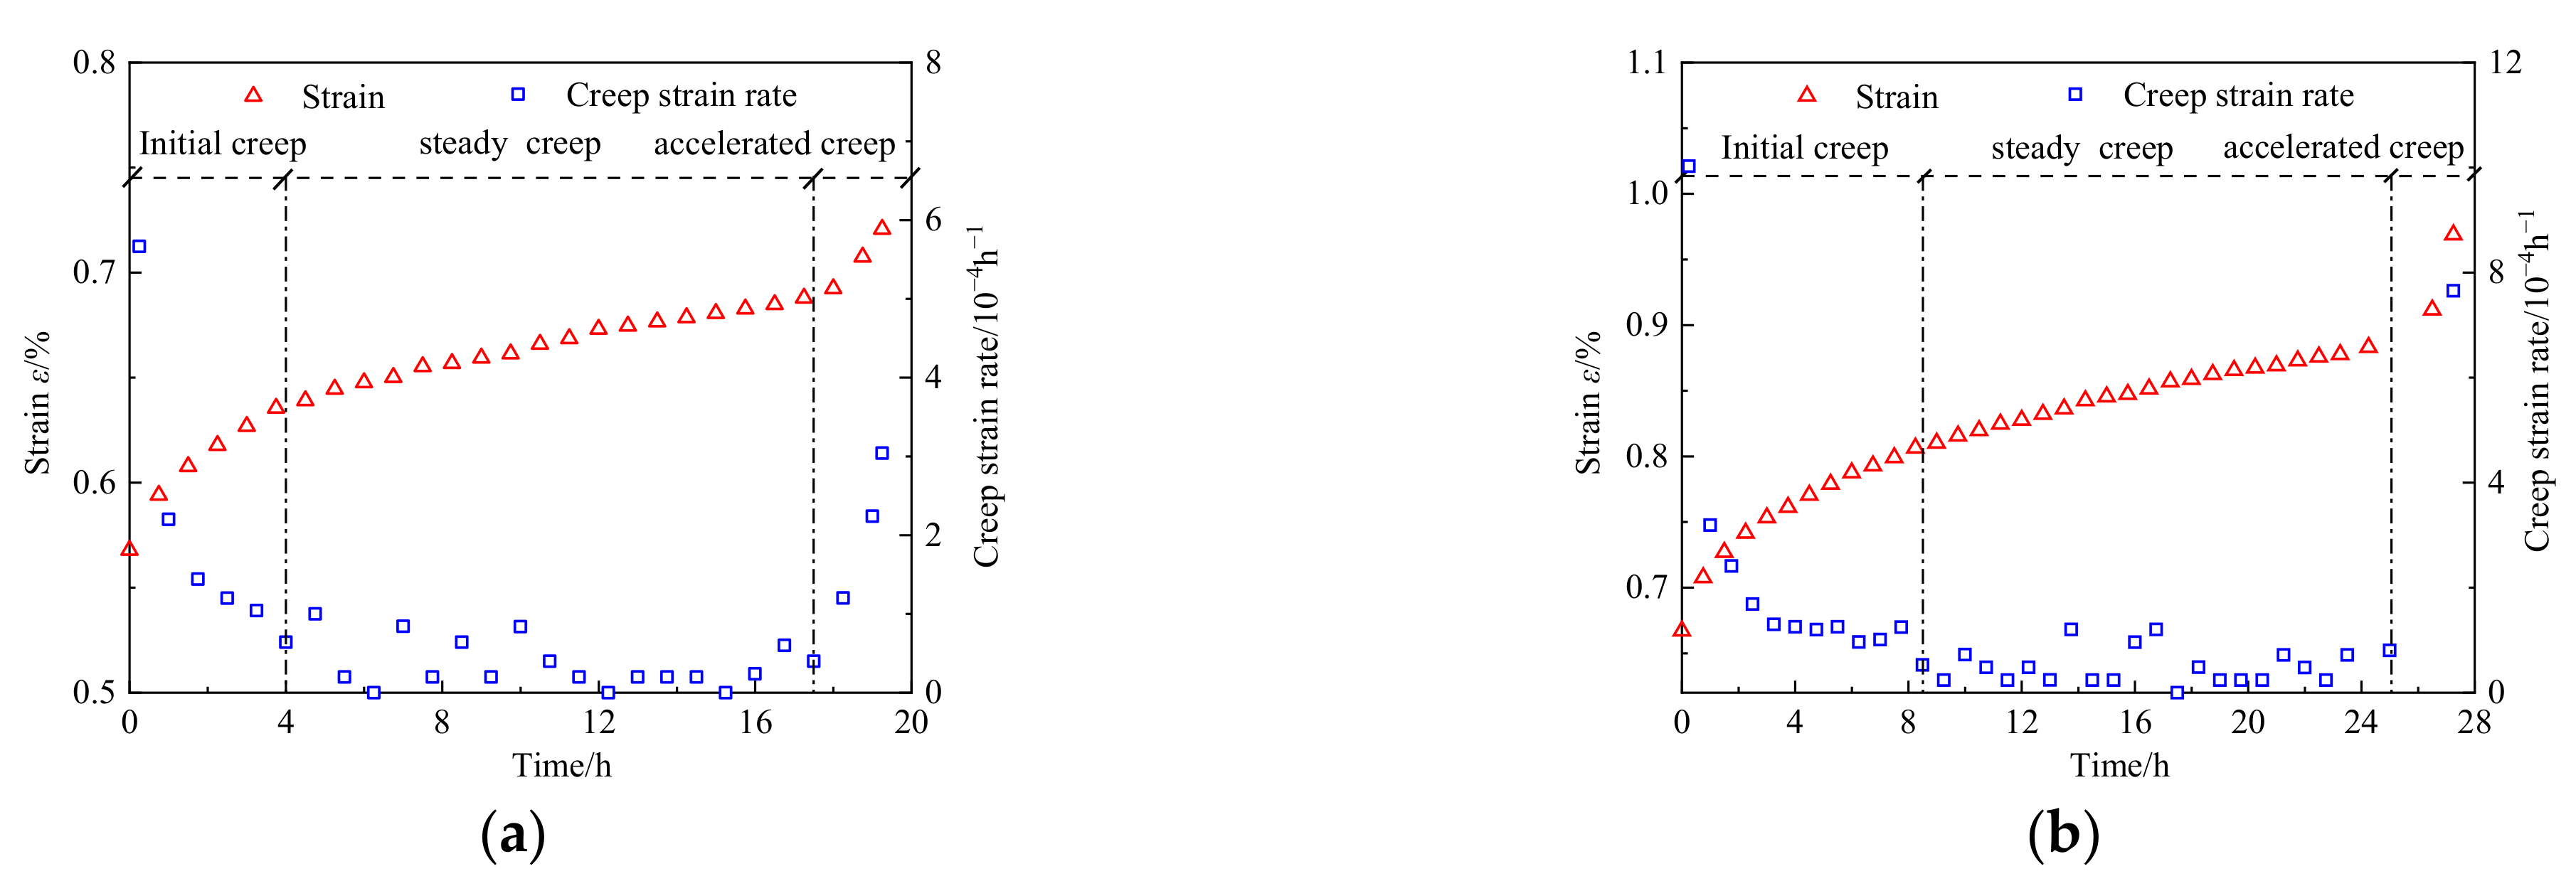
Compared with the initial creep stage and the steady creep stage, the accelerated creep failure stage only occupied a very small part of the processes of the creep experiment, but it could produce great nonlinear deformation. Figure 8 shows the accelerated creep process of sandstone samples under dry and saturated conditions. The last step of the creep curve showed a complete three-stage creep curve characteristic of the whole creep process. From the end of the instantaneous elastic deformation of the loading to the initial creep stage, the creep rate finally reached a stable level. After a period of steady creep, the accelerated creep stage began to appear, and finally creep failure occurred. The duration of each acceleration curve varied from 2 h in the dry state to 27 h in the saturated state because of the influence of different moisture contents and different creep stresses.
After the rock creep process entered the accelerated creep stage, the strain increased nonlinearly, and the growth of strain in this stage became the most important factor in the rock failure. In general, the elastic element was used to describe the instantaneous elastic behavior of the rock during the loading process. The deformation characteristics of the rock conformed to Hooke’s law, and it was considered that the deformation was only related to stress and had nothing to do with time. A viscous body was used to describe the viscoelastic behavior of the rock, and the mechanical properties conformed to the definition of a Newtonian fluid. A Newtonian fluid is a material whose stress is proportional to the strain rate. Therefore, during the study of the accelerated creep model, this paper mainly researched the internal relationships between stress and strain or the strain rate and established a new element to describe the accelerated creep behavior.
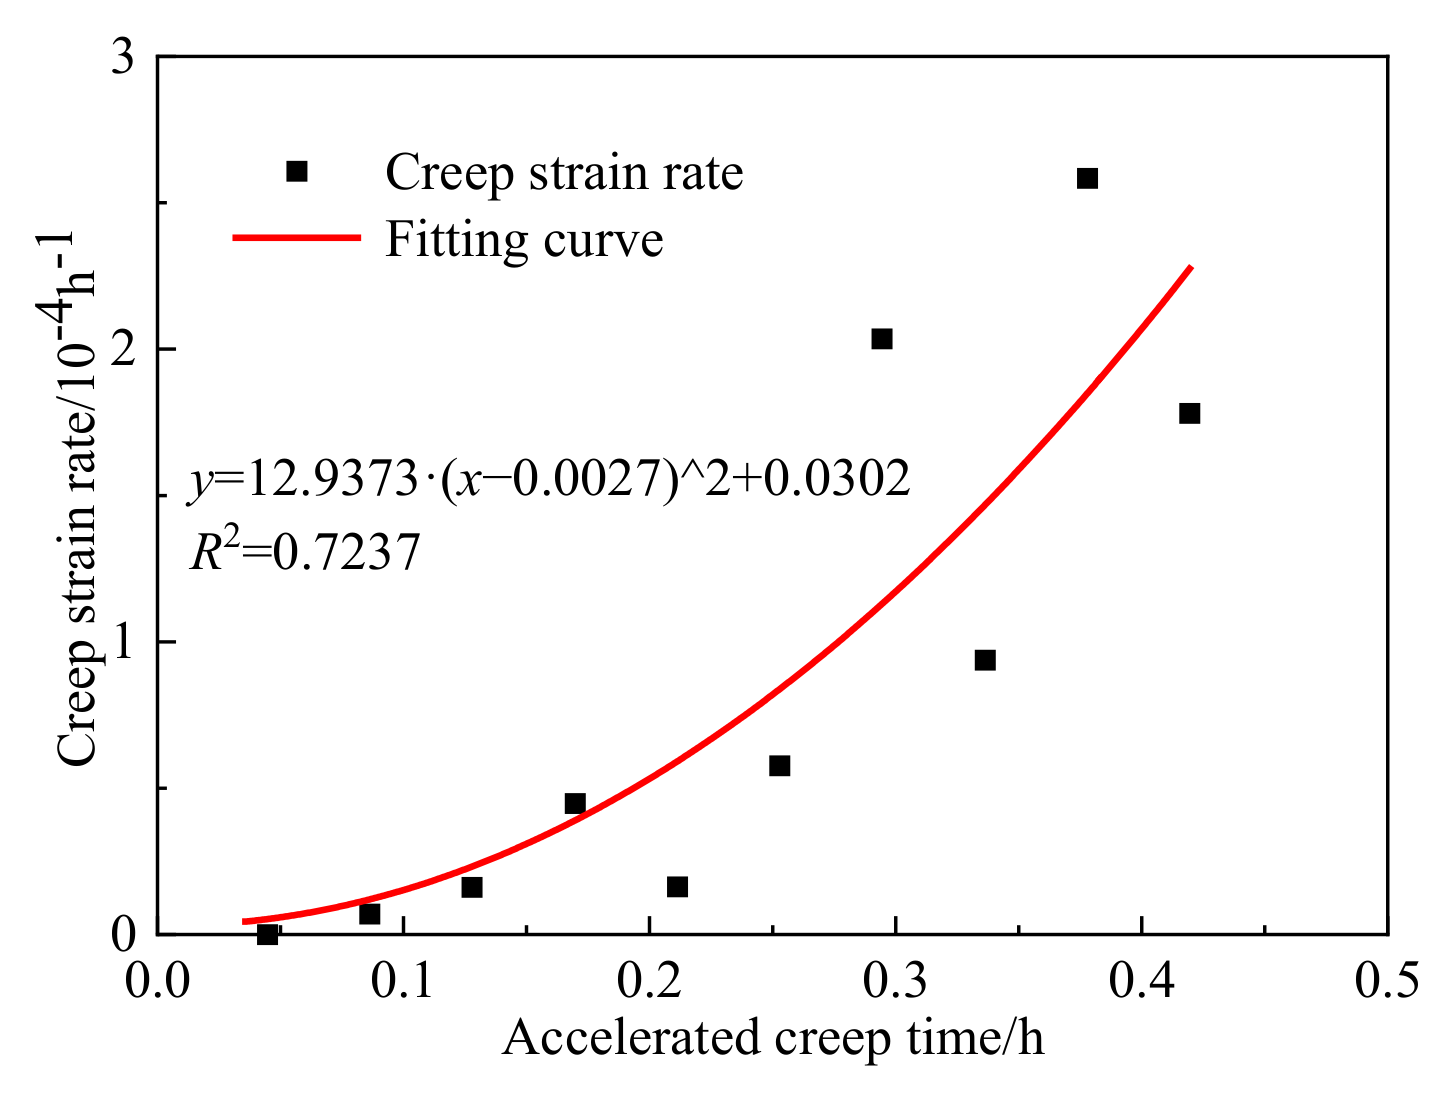
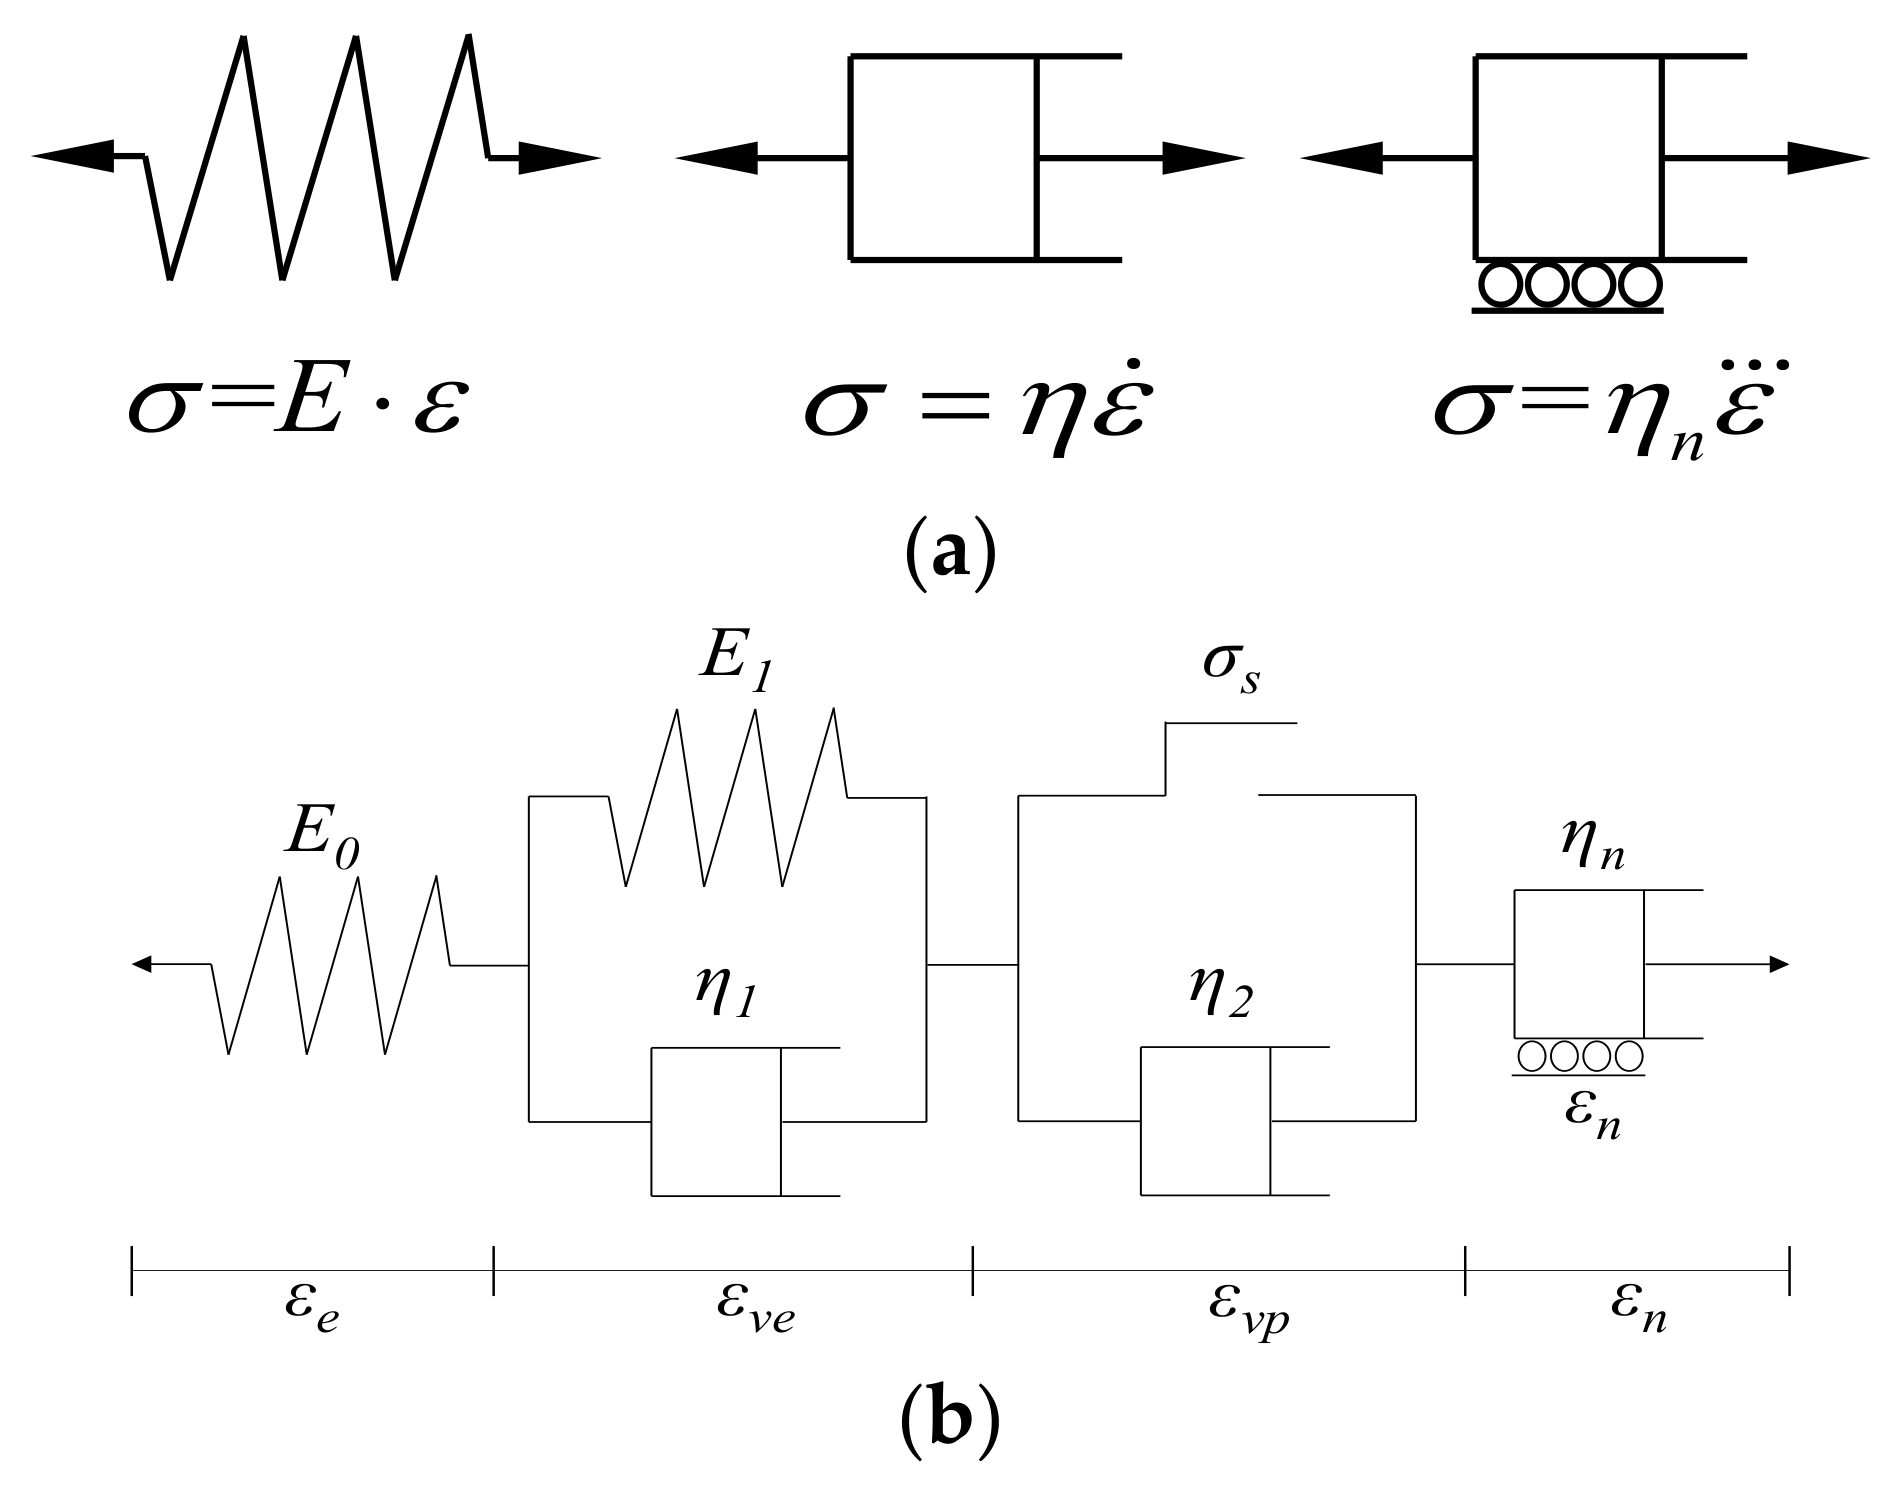
By analyzing the data of the accelerated creep failure stage in the creep experiment, it was found that the creep strain rate ( ε ˙ = d ε / d t ) increased exponentially with time. And the derivative of the creep strain rate showed that ε ¨ increased linearly with time, so a quadratic function could be used to fit the relationship between the creep rate and time. The fitting results are shown in Figure 9. A new nonlinear viscous kettle model with strain triggering was established to describe the process of accelerated creep, and the specific model is shown in Figure 10. When the strain was greater than εn, the model would work in the accelerated creep stage. When the overall strain of the model was less than εn, the kettle did not act. Similar to the definition of an ideal viscous body, the viscous element, which was independent of time, was defined as
σ = η n d ε ¨ d t = η n ε
According to the research on the creep law of the water–rock coupling damage state of sandstone above, a new nonlinear creep damage model was constructed considering the instantaneous damage of the water content and creep damage, and the triggered viscous model was superimposed, as shown in Figure 10. When σ < σ s , the model degenerates into a simple Kelvin model, which can describe the instantaneous deformation and the initial creep process. When σ σ s and ε < ε c , the model degenerates to the Nishihara model, which can describe the initial creep and steady creep stages in the creep curve. When σ σ s and ε ε c , the newly established viscous damage model can work and describe the accelerated creep stage in the creep process. According to the series–parallel relationship, the equation of the current creep model can be obtained through theoretical derivation. The creep equation of the improved Nishihara creep damage model is shown in Formula 7.
ε t = σ E 0 ( 1 D e ) + σ E 1 ( 1 D e ) 1 exp E 1 ( 1 D e ) η 1 ( 1 D c ) σ < σ s σ E 0 ( 1 D e ) + σ E 1 ( 1 D e ) 1 exp E 1 ( 1 D e ) η 1 ( 1 D c ) + σ σ s η 2 ( 1 D c ) t σ σ s σ E 0 ( 1 D e ) + σ E 1 ( 1 D e ) 1 exp E 1 ( 1 D e ) η 1 ( 1 D c ) + σ σ s η 2 ( 1 D c ) t + σ 6 η n τ 3 σ σ s , ε > ε c
Based on the experimental creep data of sandstone with different moisture contents from the Wanfu Coal Mine, the rheological beginning of the accelerated creep stage was determined. For example, the sandstone in the dry state entered the accelerated creep stage when t = 12.12 h, and the corresponding strain was used as the trigger strain value of the viscous kettle. The strain value was 7.68 × 10⁻² at this time. First, the parameters of the damaged viscoelastic element ( E 0 , E 1 , η 1 , and η 2 ) were obtained by fitting the curves of the first two stages. Then, the accelerated creep curve was fitted to obtain the accelerated rheological parameters ( η n ), as shown in Table 3.
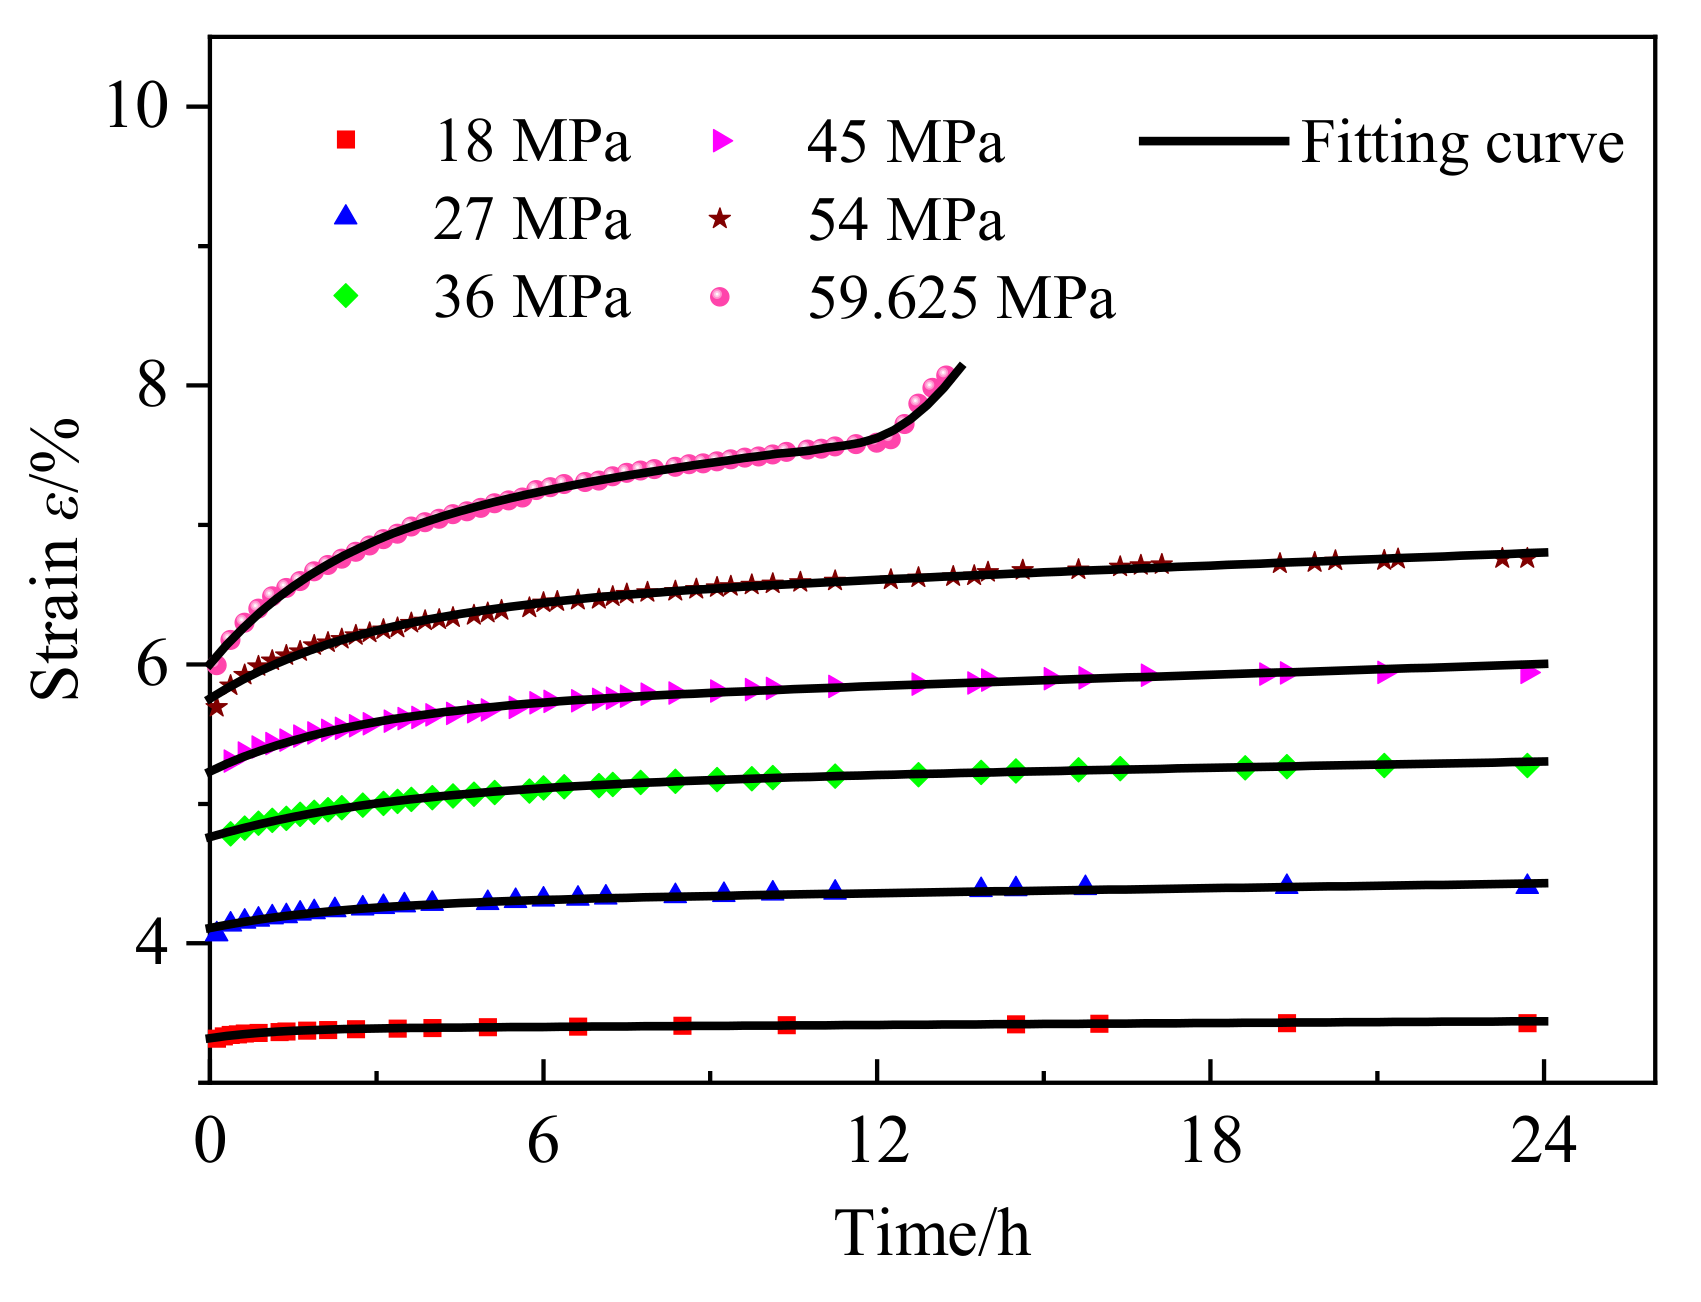
Figure 11 shows a results comparison between the uniaxial experimental creep curve under graded loading and the creep damage model curve of DR-20 sandstone. The experimental curve was in good agreement with the theoretical curve, and it indicated that the model can not only accurately describe the whole process, including the initial creep process, steady creep process, and accelerated creep process, but can also effectively describe the creep characteristics of sandstone samples with different moisture contents.

5. Numerical Calculation

5.1. Damage Calculation Model

The total strain of the model rock ( ε i j ) is composed of four parts, including the elastic strain ( ε i j e ), viscoelastic strain ( ε i j v e ), plastic strain ( ε i j v p ), and accelerated viscous strain ( ε i j n ).
ε i j = ε i j e + ε i j v e + ε i j v p + ε i j n
The strain deviator rate form is
ε ˙ i j = ε ˙ i j e + ε ˙ i j v e + ε ˙ i j v p + ε ˙ i j n
Combined with the Perzyna viscoplastic theory, the three-dimensional incremental form of elastic deformation is
ε e = A E 0 · σ
The viscoelastic three-dimensional constitutive incremental form is
ε v e = A E 1 · 1 exp E 1 η 1 t σ
ε v e t + Δ t = ε v e t + ε v e t σ i Δ σ + ε v e t f t · Δ f t
Formula (11) can be obtained by expanding Formula 10 with the first-order Taylor series.
ε v e t = ε v e t σ i : Δ σ + ε v e t f t Δ f t = J v e : Δ σ + B v e
where B v e = A σ E 1 Δ f t , Δ f t = exp E 1 η 1 exp 1 exp E 1 η 1 Δ t .
The incremental form of plastic deformation is
ε ˙ v p = 1 η 2 F F 0 n F σ
Using the Drucker–Prager yield criterion, the following equation can be obtained:
F = α I 1 + J 2 K = 0
where I 1 and J 2 are the first invariant of stress and the second invariant of stress deviation. α and K are experimental constants only related to the internal friction angle (Φ) and cohesive force of rock. In the principal stress space, the yield surface of the D-P criterion is a conical surface.
In this paper, the associated flow rule was adopted, so the plastic strain increment can be expressed as
ε ˙ p = λ F σ
Then,
F σ = α + 1 6 J 2 2 σ x σ y σ z α + 1 6 J 2 2 σ y σ z σ x α + 1 6 J 2 2 σ z σ x σ y τ x y J 2 τ y z J 2 τ z x J 2
Therefore,
ε ˙ v p t + Δ t = ε ˙ v p t + ε ˙ v p t σ Δ σ + ε ˙ v p t K Δ K = ε ˙ v p t + G t Δ σ + H t Δ K
where G t = φ σ m T + φ m σ t η 2 , H t = φ σ m + φ m K t η 2 .
Without considering material hardening, the plastic strain increment can be expressed as
Δ ε v p = ε ˙ v p t + G t : Δ σ Δ t
The incremental form of accelerated creep strain can be obtained:
Δ ε n l = ε n l s s σ : Δ σ + s 6 η n l 2 τ Δ τ = 1 6 η n l s σ : Δ σ + s 6 η n l 2 τ Δ τ
The incremental form of this damage calculation model can be obtained by further derivation:
Δ σ = D n : Δ ε D n : B v e + ε ˙ v p Δ t + s 6 η n l 2 τ Δ τ
where D n = C e + J v e + G t Δ t + 1 6 η n l s σ 1 and Ce is the flexibility matrix corresponding to the elastic stiffness matrix.
According to Equation (21), the stress increment can be calculated, and the next step in stress value calculation can be taken. A numerical calculation of creep damage based on the D-P yield criterion can be realized by programming the corresponding program with ABAQUS User-defined Material Mechanical Behavior (UMAT).

5.2. Numerical Model and Calculation Parameters

Based on the new damage calculation model, ABAQUS software was used to simulate the creep behavior of uniaxial compression creep under different load conditions. The graded loading creep curves of sandstone with different moisture contents are shown in Figure 12, and Table 4 shows the parameters of the numerical calculation.
It can be seen that the simulation curves obtained by ABAQUS software could better describe the initial creep process, although there was a little deviation from the experimental creep curves in the initial creep stage. In the stable creep stage and the accelerated creep stage, the simulation curves were highly consistent with the experimental curves, and good simulation results were achieved. Therefore, based on this new damage calculation model, ABAQUS software can effectively simulate the whole creep process of sandstone.

6. Conclusions

Based on the creep experiment using sandstone from the Wanfu Coal Mine, this paper studied the whole process of the water–rock coupling creep of sandstone with different moisture contents and analyzed the deformation law in the creep process of each stage. Based on the traditional Nishihara model, the damage theory was used to modify the different deformation stages, and an original model describing the multi-stage creep was obtained. At the same time, the secondary development function of ABAQUS software was used to numerically calculate the creep process, and good simulation results were obtained. The conclusions were as follows:
(1)
In this paper, uniaxial compression experiments and the uniaxial compression creep experiments using five kinds of sandstone samples with different moisture contents were carried out. The experimental results showed that the compressive strength, the elastic modulus, and the parameters related to the long-term strength had negative exponential relationships with the moisture content. The isochronous viscoelastic curve was obtained using the curve of uniaxial compression step loading of the whole creep process. The critical stress of different stages of creep also had a negative exponential relationship with the water content, but there was a stable proportional relationship between it and the uniaxial compressive strength.
(2)
A new viscous modulus ( E ¯ v ) was introduced to describe the evolution law of the viscous strain in the whole creep process according to the slope change of the isochronous viscoelastic curve, and the nonlinear softening equation with the change in the moisture content was obtained. At the same time, a new viscous modulus was defined based on the accelerated creep deformation law of uniaxial graded loading creep. A nonlinear viscous kettle model with strain triggering was introduced to describe the accelerated creep process. In addition, a new creep constitutive model was derived, and the creep equation was given.
(3)
According to the viscoelastic constitutive relation, the iterative incremental form of the improved Nishihara model based on the D-P criterion was established. The calculation curves of the creep process of sandstone were obtained using ABAQUS software and were in good agreement with the experimental creep curves. The whole creep process of sandstone can be accurately simulated, and it provided a new research idea to study the creep process of sandstone using the method of numerical simulation.

Author Contributions

Conceptualization, X.S. and C.M.; methodology, X.S. and C.M.; software, M.J. and F.C.; validation, C.M., F.C. and X.S.; formal analysis, M.J.; investigation, M.J. and F.C.; resources, C.M.; data curation, C.M.; writing—original draft preparation, C.M. and F.C.; writing—review and editing, C.M. and F.C.; visualization, C.M. and F.C.; supervision, X.S.; project administration, C.M.; funding acquisition, X.S. and F.C. All authors have read and agreed to the published version of the manuscript.

Funding

This work was supported by the National Natural Science Foundation of China (Grants 51874311 and 51904306), the Fundamental Research Funds for the Central Universities (Grant No. 2022YJSSB03), and the Scientific and Technological Projects of Henan Province (Grant No. 232102320238).

Institutional Review Board Statement

Our study did not require ethical approval.

Informed Consent Statement

Our study did not involve humans.

Data Availability Statement

Data associated with this research are available and can be obtained by contacting the corresponding author upon reasonable request.

Conflicts of Interest

The authors declare no conflict of interest.

References

  1. Price, N.J. The compressive strength of coal measure rocks. Colliery Eng. 1960, 37, 283–292. [Google Scholar]
  2. Hadizadeh, J.; Law, R.D. Water-weakening of sandstone and quartzite deformed at various stress and strain rates. Int. J. Rock Mech. Min. Sci. Geo-Mech. Abstr. 1991, 28, 431–439. [Google Scholar] [CrossRef]
  3. Shakoor, A.; Barefield, E.H. Relationship between Unconfined Compressive Strength and Degree of Saturation for Selected Sandstones. Environ. Eng. Geosci. 2009, 15, 29–40. [Google Scholar] [CrossRef]
  4. Erguler, Z.A.; Ulusay, R. Water-induced variations in mechanical properties of clay-bearing rocks. Int. J. Rock Mech. Min. Sci. 2009, 46, 355–370. [Google Scholar] [CrossRef]
  5. Li, D.J.; Wang, G.L.; Han, L.Q. Analysis of microscopic pore structures of rocks before and after water absorption. Min. Sci. Techno. 2011, 21, 287–293. [Google Scholar]
  6. Rajabzadeh, M.A.; Moosavinasab, Z.; Rakhshandehroo, G. Effects of rock classes and porosity on the relation between uniaxial compressive strength and some rock properties for carbonate rocks. Rock Mech. Rock Eng. 2012, 45, 113–122. [Google Scholar] [CrossRef]
  7. Burshtein, L.S. Effect of moisture on the strength and deformability of sandstone. Soviet Min. 1969, 5, 573–576. [Google Scholar] [CrossRef]
  8. Sun, X.M.; Jiang, M.; Wang, X.B.; Zang, J.C.; Gao, X.; Miao, C.Y. Experimental study on creep mechanical properties of sandstone with different water contents in Wanfu coal mine. Rock Soil Mech. 2023, 44, 624–636. [Google Scholar]
  9. Guo, H.Y.; Li, B.; Sun, C.H. Hydrophilic characteristics of soft rock in deep mines. Int. J. Min. Sci. Techno. 2015, 25, 177–183. [Google Scholar] [CrossRef]
  10. Miao, C.Y.; Yang, L.; Xu, Y.Z.; Yang, K.; Sun, X.M.; Jiang, M.; Zhao, W.C. Experimental study on strength softening behaviors and micro-mechanisms of sandstone based on nuclear magnetic resonance. Chin. J. Rock Mech. Eng. 2021, 40, 2189–2198. [Google Scholar]
  11. Feng, F.; Chen, S.; Han, Z.; Golsanami, N.; Liang, P.; Xie, Z. Influence of moisture content and intermediate principal stress on cracking behavior of sandstone subjected to true triaxial unloading conditions. Eng. Fract. Mech. 2023, 284, 109265. [Google Scholar] [CrossRef]
  12. Wong, L.; Maruvanchery, V.; Liu, G. Water effects on rock strength and stiffness degradation. Acta Geotech. 2016, 11, 713–737. [Google Scholar] [CrossRef]
  13. Griggs, D.T. Creep of rocks. J. Geol. 1939, 47, 225–251. [Google Scholar] [CrossRef]
  14. Zhang, Z.L.; Xu, W.Y.; Wang, W.; Wang, R.B. Triaxial creep tests of rock from the compressive zone of dam foundation in Xiangjiaba Hydropower Station. Int. J. Rock Mech. Min. Sci. 2012, 50, 133–139. [Google Scholar] [CrossRef]
  15. Lu, Y.; Wang, L. Effect of water and temperature on short-term and creep mechanical behaviors of coal measures mudstone. Environ. Earth Sci. 2017, 76, 597. [Google Scholar] [CrossRef]
  16. Chen, P.Z.; Tang, S.B.; Liang, X.; Zhang, Y.J.; Tang, C.A. The influence of immersed water level on the short- and long-term mechanical behavior of sandstone. Int. J. Rock Mech. Min. Sci. 2021, 138, 104631. [Google Scholar] [CrossRef]
  17. Tao, B.; Wu, F.Q.; Guo, G.M.; Zhou, R.G. Flexibility of visco-elastoplastic model to rheological characteristics of rock and solution of rheological parameter. Chin. J. Rock Mech. Eng. 2005, 24, 3165–3171. [Google Scholar]
  18. Zheng, H.; Feng, X.T.; Hao, X.J. A creep model for weakly consolidated porous sandstone including volumetric creep. Int. J. Rock Mech. Min. Sci. 2015, 78, 99–107. [Google Scholar] [CrossRef]
  19. Jiang, X.W.; Chen, C.X.; Xia, K.Z.; Liu, X.M.; Zhou, Y.C. Experimental study of creep characteristics of gypsum mine rock in triaxial compression. Rock Soil Mech. 2016, 37, 301–308. [Google Scholar]
  20. Gens, A.; Mánica, M.; Vaunat, J.; Ruiz, D.F. Modelling the Mechanical Behaviour of Callovo-Oxfordian Argillite. Formulation and Application. In Advances in Laboratory Testing and Modelling of Soils and Shales; Springer: Berlin/Heidelberg, Germany, 2017; pp. 37–44. [Google Scholar]
  21. Song, Y.J.; Lei, S.Y.; Zou, C.; Zhang, W.X. Study on creep characteristics of carbonaceous slates under dry and saturated states. Chin. J. Undergr. Space Eng. 2015, 47, 619–625. [Google Scholar]
  22. Yang, X.R.; Jiang, A.N.; Jiang, Z.B. Creep test and damage model of soft rock under water containing condition. Rock Soil Mech. 2018, 39, 167–174. [Google Scholar]
  23. Cao, S.G.; Xian, X.F. Analysis of generalized elasto-viscoplastic model for coal rock. J. China Coal Soc. 2001, 4, 364–369. [Google Scholar]
  24. Xu, W.Y.; Yang, S.Q.; Chu, W.J. Nonlinear viscoelasto-plastic rheological model (hohai model) of rock and its engineering application. Chin. J. Rock Mech. Eng. 2006, 25, 433–447. [Google Scholar]
  25. Zhou, H.W.; Wang, C.P.; Han, B.B.; Duan, Z.Q. A creep constitutive model for salt rock based on fractional derivatives. Int. J. Rock Mech. Min. Sci. 2011, 48, 116–121. [Google Scholar] [CrossRef]
  26. Jiang, Q.H.; Qi, Y.J.; Wang, Z.J.; Zhou, C.B. An extended Nishihara model for the description of three stages of sandstone creep. Geophys. J. Int. 2013, 193, 841–854. [Google Scholar] [CrossRef]
  27. Jung, G.D.; Youn, S.K.; Kim, B. A three-dimensional nonlinear viscoelastic constitutive model of solid propellant. Int. J. Solids Struct. 2000, 37, 4715–4732. [Google Scholar] [CrossRef]
  28. Barbero, E.J. Finite Element Analysis of Composite Materials with Abaqus; CRC Press: Boca Raton, FL, USA; Taylor & Francis Group: Boca Raton, FL, USA, 2013. [Google Scholar]
  29. Liu, K.; Chen, S.L.; Gu, X.Q. Analytical and Numerical Analyses of Tunnel Excavation Problem Using an Extended Drucker–Prager Model. Rock Mech. Rock Eng. 2020, 53, 1777–1790. [Google Scholar] [CrossRef]
  30. Miao, X.X.; Chen, Z.D. A creep damage equation for rock materials. Chin. J. Solid Mech. 1995, 16, 4. [Google Scholar]
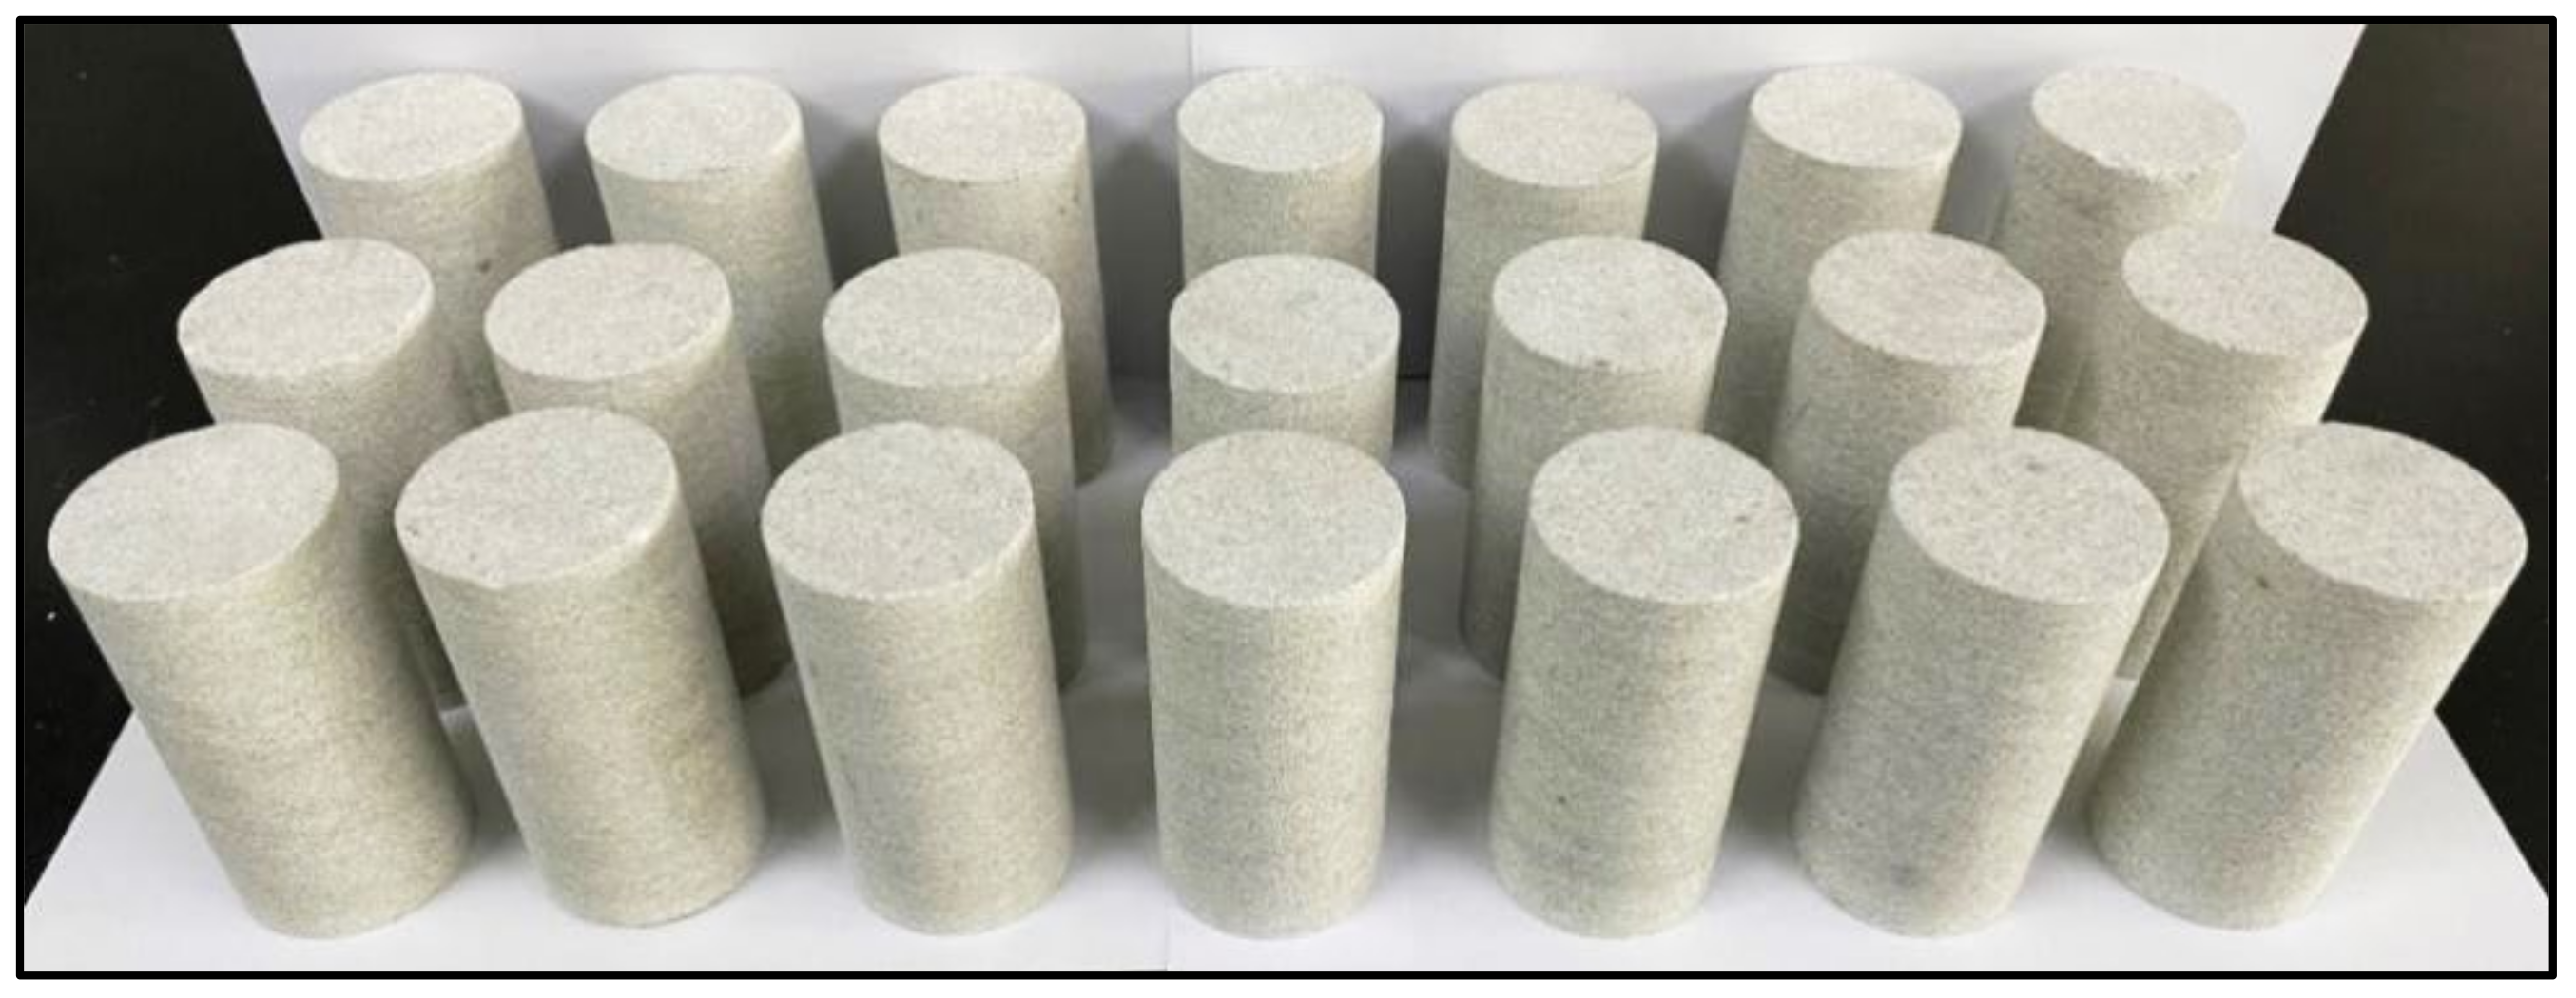
Figure 1. Partial creep sandstone samples.
Sustainability 15 14718 g001
Figure 2. The Five-link Rheological Test System for Deep Soft Rock.
Sustainability 15 14718 g002
Figure 3. Relationship between creep failure stress and moisture content of sandstone.
Sustainability 15 14718 g003
Figure 4. Creep curves of different water-content states.
Sustainability 15 14718 g004
Figure 5. Uniaxial stepped loading creep curves of sandstone using Chen’s loading method. (a) Dry condition (DR-20). (b) Water content: 2.4% (DR-23).
Sustainability 15 14718 g005
Figure 6. Isochronous viscoelastic stress–strain curves in dry state. (a) DR-21. (b) DR-24.
Sustainability 15 14718 g006
Figure 7. Softening curves of elastic modulus and viscoelastic modulus.
Sustainability 15 14718 g007
Figure 8. Uniaxial accelerated creep curves and creep strain rate curves of sandstone under dry and saturated conditions. (a) Dry condition (0%). (b) Saturated condition (3.3%).
Sustainability 15 14718 g008
Figure 9. Accelerated creep strain rate fitting curve.
Sustainability 15 14718 g009
Figure 10. Modified Nishihara model. (a)Traditional creep elements and accelerated creep elements. (b) Nishihara model with viscous kettle.
Sustainability 15 14718 g010
Figure 11. Experimental and theoretical curves of creep.
Sustainability 15 14718 g011
Figure 12. Creep fitting curve of sandstone under uniaxial graded loading.
Sustainability 15 14718 g012
Table 1. Parameters of sandstone samples in creep experiment.
Sample NumberNatural Quality
(wn, g)
Dried Quality (wd, g)Quality in the Aqueous State (wq, g)Moisture Content (w, %)Length
(l, mm)
Diameter (mm)Density
(ρ, g/cm3)
R-20463.03462.33-0100.9949.482.38
R-21463.20462.47465.710.8100.4649.382.41
R-22472.96472.10479.631.6101.3549.582.42
R-23474.13473.35485.072.48101.5649.562.42
R-24460.33459.55474.663.3299.5949.432.41
Table 2. Ratios of yield limit and failure stress to UCS.
Moisture Content (w, %)0%0.8%1.6%2.4%3.2%
UCS (MPa)90.6756.2542.9137.3033.74
Yield limit strength
(σs, MPa)
5449.5029.2540.522.522.51822.51818
Mean value
(MPa)
51.7534.8822.520.2518
σs/UCS0.570.620.520.540.53
Accelerated yield strength (σas, MPa)5476.52747.252731.524.752722.527
Mean value
(MPa)
65.2537.1329.2525.8824.75
σas/UCS0.720.660.680.690.73
Failure stress
(σd, MPa)
59.6378.7536.0051.7536.0036.0029.2533.7527.0029.25
Mean value
(MPa)
69.1943.8836.0031.5028.13
σd/UCS0.760.780.840.840.83
Table 3. Fitting parameters of creep damage model based on modified Nishihara model.
Moisture Content (%)Creep StressModel Parameters
E′0 (GPa)E′1 (GPa)η′1 (GPa·h)η′2 (GPa·P)ηn (GPa·h3)
0186.03192.34825.89
22.56.93133.18690.22
277.64108.20417.22
31.58.3160.12343.23
368.9456.00262.78
4510.2353.00247.111964.02
5411.2652.11196.441330.20
59.62511.8840.33136.00634.307.25
Table 4. Numerical calculation parameters of the uniaxial compression creep in the last load stage.
NumberCohesive Force (c, MPa)Internal Friction Angle (φ, °)Poisson’s Ratio (μ)E0
(GPa)
E1
(GPa)
η1
(GPa·h−1)
η2
(GPa·h−1)
ηnl
(GPa·h−2)
ε
(10−3)
DR-1018.9345.960.1317.019.524090015.0−8.63
DR-2015.519.52602200100.0−8.35
DR-1113.0342.970.2313.542.524010005.0−7.15
DR-2111.836.5600260050.0−9.40
DR-129.6041.350.259.815.030080025.0−7.03
DR-2210.314.01600420050.0−7.09
DR-138.9640.160.289.719.038065040.0−7.43
DR-2310.115.544084020.0−7.70
DR-148.1439.750.309.135.05805200.7−7.70
DR-248.95.5158032007.0−11.13
Disclaimer/Publisher’s Note: The statements, opinions and data contained in all publications are solely those of the individual author(s) and contributor(s) and not of MDPI and/or the editor(s). MDPI and/or the editor(s) disclaim responsibility for any injury to people or property resulting from any ideas, methods, instructions or products referred to in the content.