Abstract
In response to the challenges posed by rapid development, the wide-ranging disaster impact, and the untimely warning of debris flow resulting from tailing dam failure, it is of great significance to study the mechanism of dam failure as well as the evolution law and affected area of debris flow for effective disaster prediction and risk assessment. We developed a 1:150 physical model for testing tailing dam failure and combined it with RAMMS (V1.7.0) debris flow software to investigate the mechanisms of tailing dam failure and the evolutionary patterns of rock flows in complex environments. Through the analysis and comparison of experimental data, we comprehensively summarized the consequences of disaster risk resulting from dam failure. The results show that the grain size distribution of the model sand should be moderate; the composition of the particle size distribution has a significant impact on the collapse morphology of the dam after failure. The saturation line is the lifeline for the stability of the wake reservoir, and its level determines the degree of saturation of the wake in the reservoir. The breach was at the midpoint of the crest of the dam. The inflow volume at the time of the breach was 0.313 m3. According to the flow ratio relationship, the inflow volume at breach occurrence was equivalent to 1.78 times the total amount of a 1000-year flood and 1.19 times the total amount of a probable maximum flood (PMF). Analysis of the surface flow field revealed that the region with the highest flow velocity extended from the toe of the dam to Shangdi village; the impact on the village of Shizhou was limited to the backflow of the dam break and the gradual sedimentation of the tailings.
1. Introduction
As mining techniques for mineral resources continue to be enhanced and optimized for mining efficiency. The number of tailing ponds is on the rise and so is the amount of land required. To enhance the economic benefits of mining and minimize land use, the construction of large-capacity tailing dams is one solution. Tailing ponds represent a high-risk source of potential energy that could result in significant downstream damage in the event of a dam breach. The study of tailings dam failures mainly encompasses two aspects: the instability of the dam structure and the evolution of debris flows. The study of dam break sand flow evolution mainly encompasses empirical formulation methods, model testing methodology, and numerical simulation techniques.
In terms of dam break research, Yekti et al. [1] simulated that overtopping is the most dangerous, with the highest flow velocity and flow rate. Chen et al. [2] simulated the development of notch erosion using the time iteration method in mathematical models. A stability analysis was conducted on the reinforced cracked slope using the limit equilibrium method, and then physical tests were used to reproduce the process of tailings dam failure. Dumergue et al. [3] conducted numerical analyses of different wave impacts generated by wet dams by changing the downstream depth and obstacle position. Mattas et al. [4] used HEC-RAS software (Hydrologic Engineering Centre—River Analysis System) to simulate the dam breaking process and flood wave trend using two-dimensional numerical models for two types of failure scenarios. In terms of debris flow caused by dam failure, Aleixo et al. [5] used PIV and PTV to measure the velocity field of sand containing water flow in tailings dam failure and obtained the velocity characteristics of sand containing water flow in tailing dams. Schaefer et al. [6] conducted model experiments to study the flow velocity characteristics of sand containing water flow in dam breaks under various terrain conditions. The study found that shape has a significant impact on the flow velocity of sand containing water flow, and different terrain roughness also affects the flow velocity distribution of sand containing water flow. Sanchez Perelta et al. [7] studied the characteristics of dam break debris flow movement using dry tailings mixed with different water contents and obtained the relationship between the length and width of dam break debris flow movement. Gao et al. [8] used homogeneous mud to simulate the movement of dam break debris flow and measured the yield stress of the mud in a water tank, obtaining the variation pattern of the yield stress of homogeneous mud. Le et al. [9] used the volume of fluid method, the shear stress transport turbulence model, and the Lagrange particle tracking method to simulate the scouring process caused by dam failure. Hamza et al. [10] developed a flood inundation model using GIS technology and simulated the impact of the study area on flood wave propagation. Özgenç et al. [11] studied the propagation law of water waves in debris flows through dam breaking experiments. Yu et al. [12] focused on constructing a virtual geographic environment (VGE) system that offers an effective visualization tool for the dam-break process of a tailings pond. We integrated the dam-break numerical model of the tailings dam, which is based on computational fluid dynamics (CFD), into the VGE system. This integration proves valuable for assessing the risk associated with tailing dams. Chen et al. [13], in order to tackle the issue of serious defects suggested by the evaluation indicator value, established a three-layer indicator system for assessing dam failure safety. We also introduced the variable weight method (VWM) to evaluate the safety of the tailings dam. Ma et al. [14,15,16] proposed an anisotropic plastic model to describe the nonisotropic mechanical behavior of porous media. This model was developed using bounding surface plasticity theory within the critical state framework. Melo et al. [17] explored the sensibility of tailings dam breach flood mapping to rheological parameters in Bingham and Herschel–Bulkley (H–B) models. The developed approach was based on the probabilistic Latin hypercube sampling of rheological parameters.
Currently, there is no comprehensive theoretical framework in the field of dam break analysis that can accurately elucidate its underlying physical principles. This article established a model of engineering based on the highest risk and utilized DEM data to construct a three-dimensional physical model of the tailings pond at a scale of 1:150 for dam break tests, in order to obtain reliable data. Meanwhile, utilizing the Voellmy friction model in RAMMS for numerical computations, we conducted a comprehensive assessment of the maximum potential hazard zone and disaster range associated with tailings dam instability. Additionally, we proposed an accurate evaluation of the downstream environmental impact resulting from tailings dam failure and performed precise risk assessments.
2. Overview of the Proposed Tailings Pond
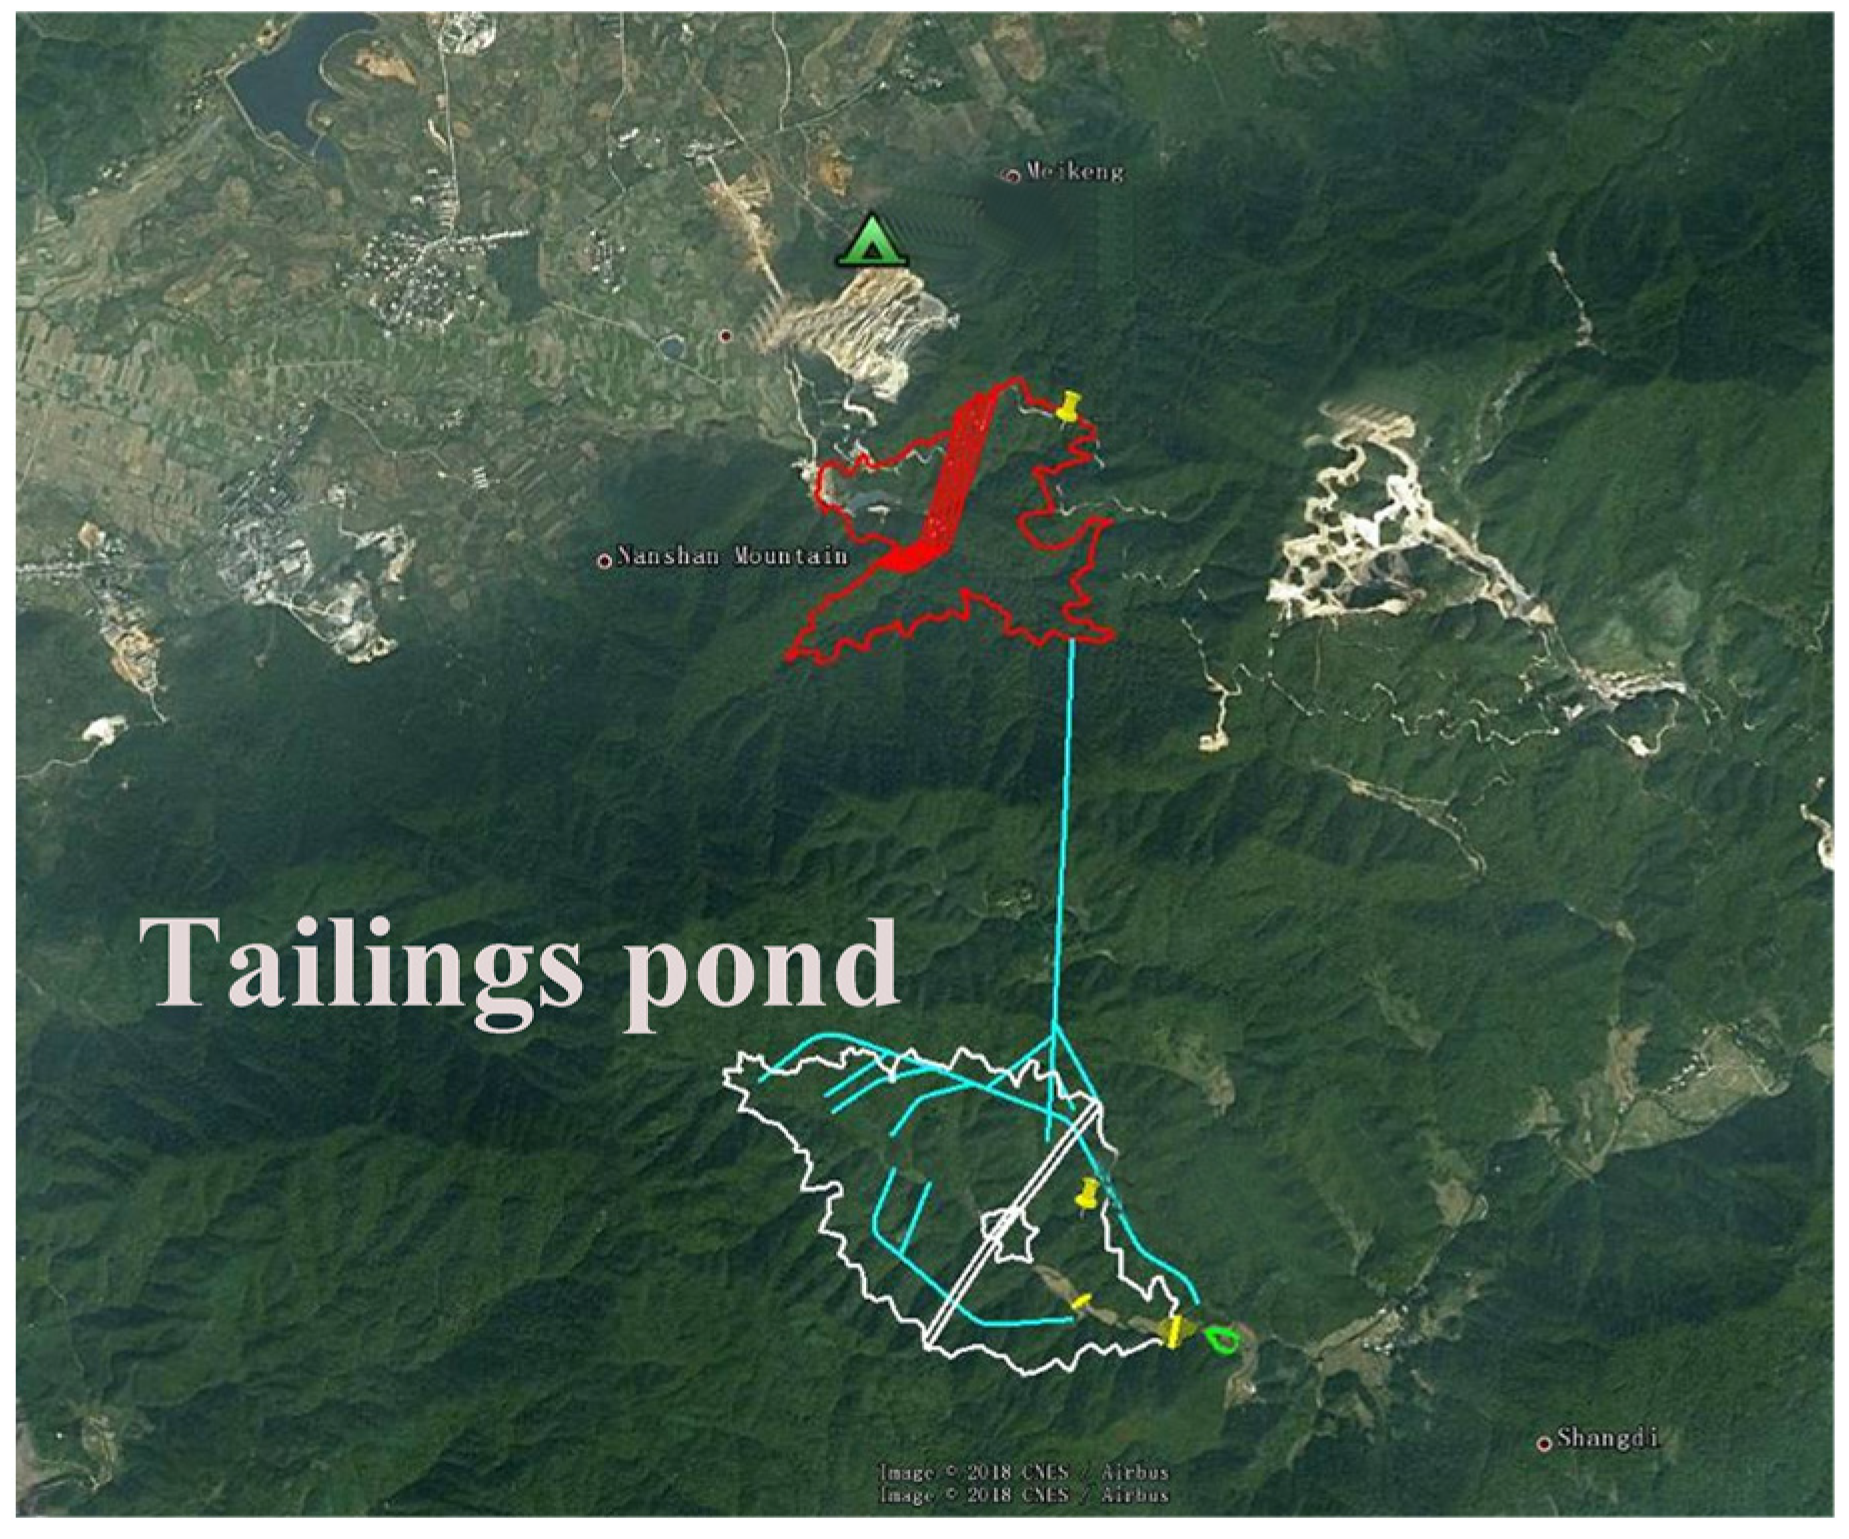
The tailings pond area features a topography characterized by low mountains and hills. The valley and mountain ridge run in a northwest to southeast direction, while the water ditch originates from the mountain ditch area on the northwest side and flows through the reservoir area towards the southeast. The elevation of the watershed on the west side of the reservoir area ranges from 1030.50 to 1100.70 m (Xiangfeng Building), while that on the northeast side varies between 957.30 and 1053.00 m, and that on the south side falls within a range of 657.00 to 937.50 m; furthermore, the bottom elevation of the tailings pond ditch changes from northwest to southeast with an altitude ranging from 855.00 to 555.00 m. Overall, the tailings pond area is surrounded by mountains on all sides, with slopes of 25–45° on both sides and abundant surface vegetation. The tailings pond was designed using the centerline method for dam construction, as shown in Figure 1.
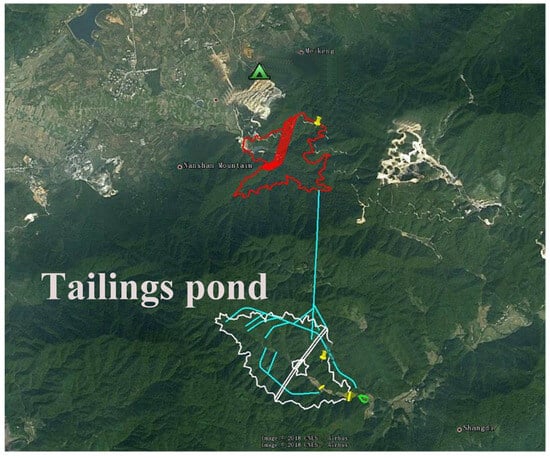
Figure 1.
Topographic feature of the tailings pond area.
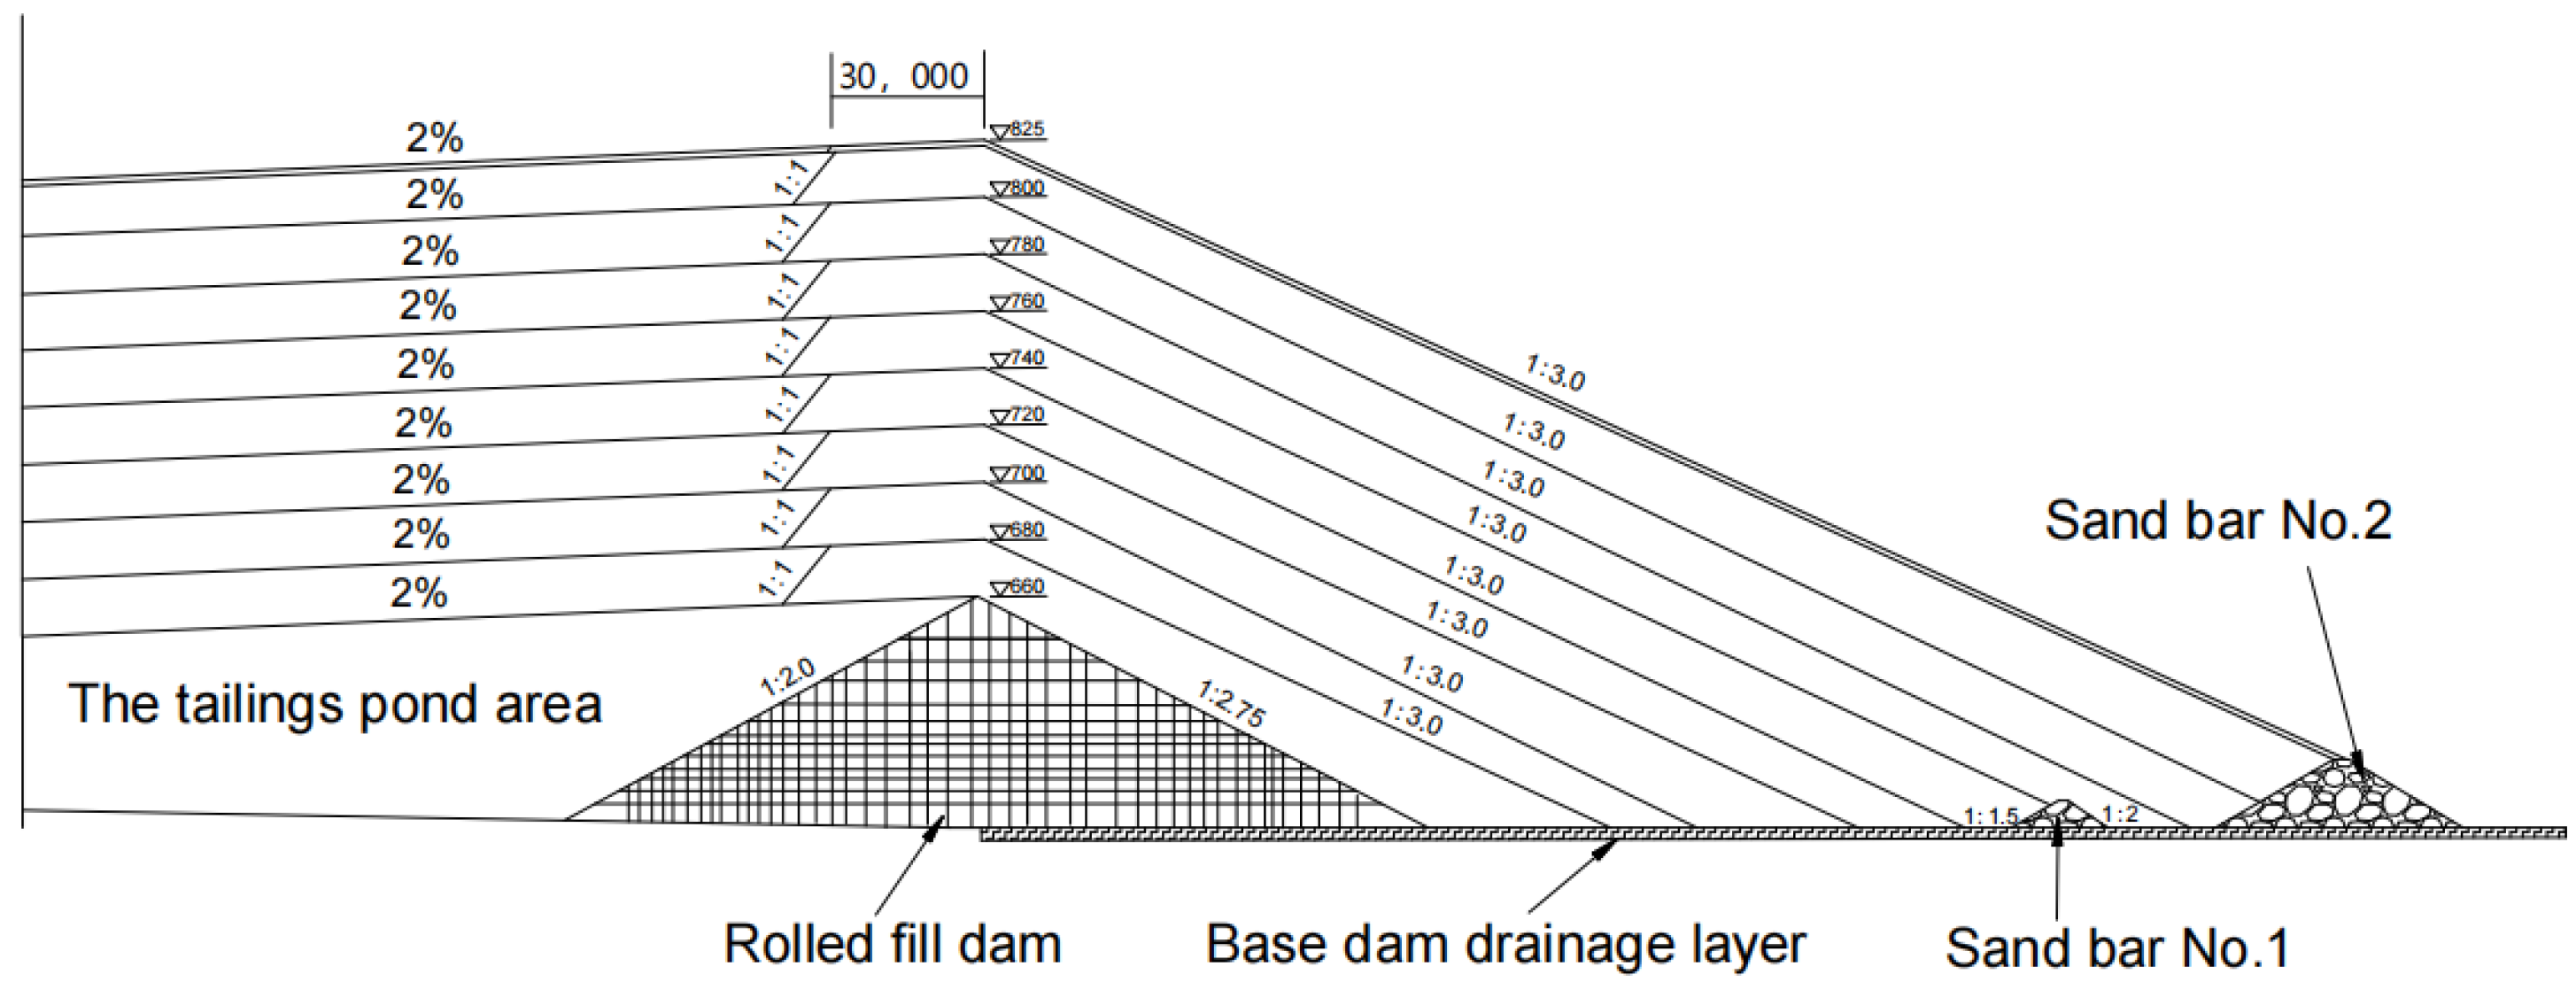
The embankment dam was utilized as the initial structure, while the centerline method was employed in later stages to construct a graded tailings dam with swirling. The total dam height of the tailings dam was 217.0 m, and the total storage capacity was 9291.4 × 104 m3. The final stage of the tailings pond was a second-class pond, as shown in Figure 2.
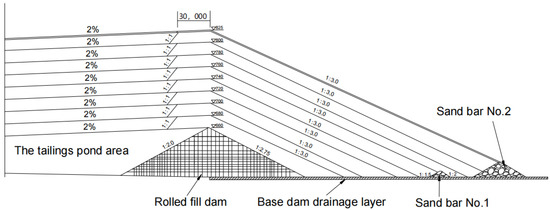
Figure 2.
Profile of the dam in the tailings pond area.
The stacking dam was built using the centerline method with tailings. The incoming tailings were classified by swirling flow, and the graded bottom flow tailings were discharged to the initial dam crest and downstream for dam construction. The overflow tailings were directly discharged into the reservoir. The final crest elevation of the accumulation dam was 825 m, the dam height was 165 m, the dam crest width was 30 m, the dam axis length was 1080 m, the slope of the dry beach in the reservoir was 2%, and the downstream slope was 1:3. In order to prevent the tailing on the dam slope from being polluted by rainwater during rainstorms, two sand retaining dams were set downstream of the initial dam, both of which are rockfill dams.
The sand blocking dam was located approximately 290.0 m downstream of the initial dam, with a dam crest elevation of 590 m, a dam length of 65 m, and a dam height of 12 m. The No. 2 sand dam was located approximately 600 m downstream of the initial dam, with a dam crest elevation of 600 m, a dam length of 126 m, and a dam height of 38 m. The types of sand blocking dams were all permeable rockfill dams, with a slope ratio of 1:2.0 for both upstream and downstream. An inverted filter layer was installed upstream for inverted filtration, and dry masonry slope protection was used for the downstream surface.
3. Establishment of Tailings Dam Model
3.1. Model Test Principles
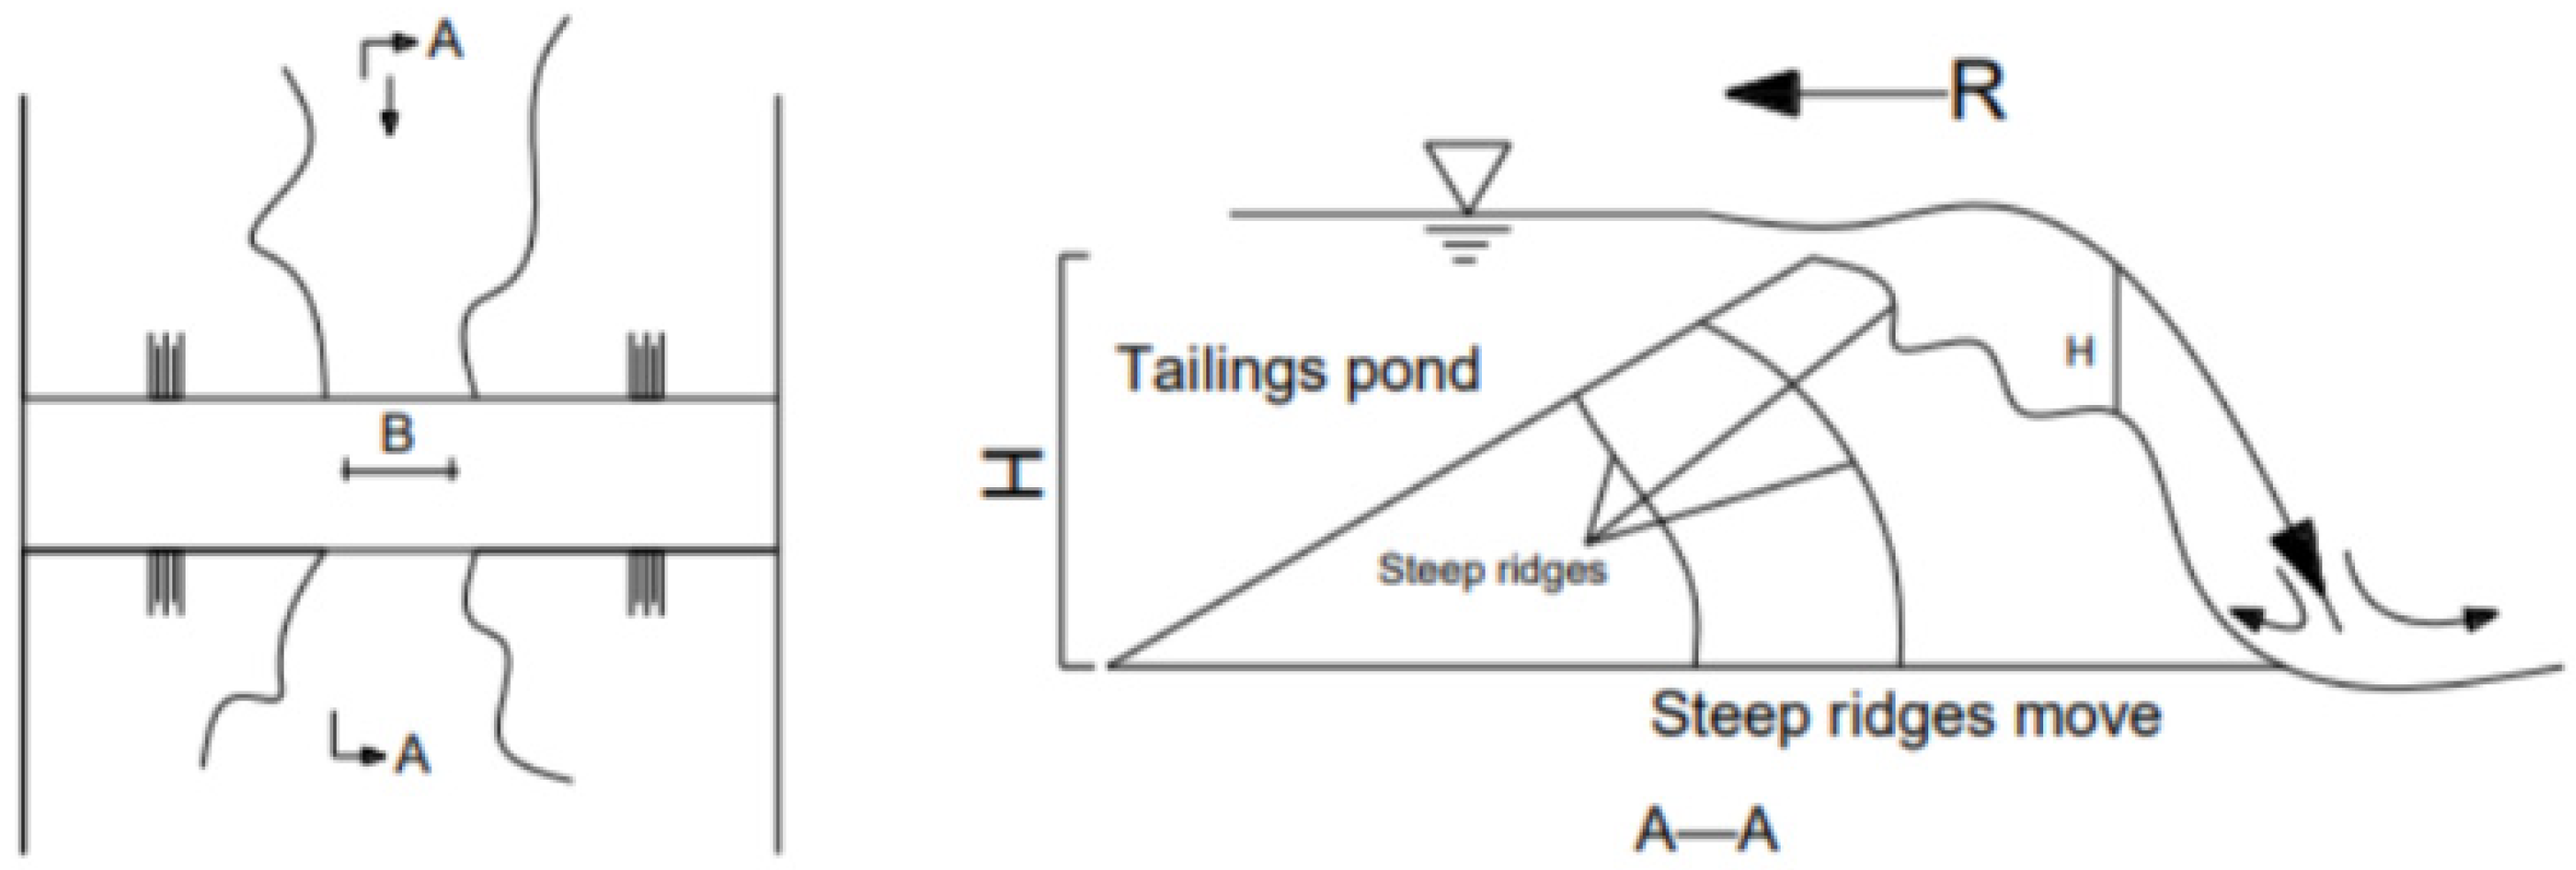
The purpose of a physical model test of a tailings pond is to imitate the prototype tailings pond, follow similar principles, and shrink it into a model at a ratio of 1:150. The physical model test of tailing dams is similar to the form of overtopping dam failure, and the mechanism of Embankment dam “scarp” erosion dam failure was used for reference. As shown in Figure 3, the overtopping failure process of the Embankment dam with “scarp scouring” has the following processes: first, water overtopping; the second step is the formation of fine gullies; the third step includes the formation of multi-level stepped small “steep ridges” of gullies; the fourth step is to form a large “steep slope”; the fifth step is to widen the breach; the sixth step is the rapid development of the breach; and step seven is dam collapse.
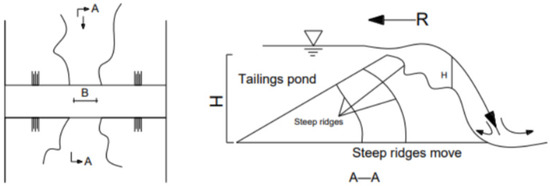
Figure 3.
Diagram of the “steep slope” type development of overtopping dam failure.
The downstream evolution of dam break water sand flow requires the similarity criterion to not only consider the resemblance in water flow but to also fulfill the conditions of comparable tailings settlement, the equivalent sand carrying capacity of water flow, and analogous erosion and sedimentation deformation.
- (1)
- Similar conditions for tailings settlement
According to the diffusion equation of sediment under the state of unbalanced sediment transport in the three-dimensional steady uniform flow based on the turbulent diffusion theory, the similar conditions for the settlement along the way of the tailing movement process in the normal model can be derived using the following equation:
By substituting the Stokes sedimentation velocity scale relationship, we can obtain the size scale of the suspended load sand:
where is particle size scale; is the unit weight of sand; is the unit weight of water.
- (2)
- Similar conditions of water flow and sand retention
The critical sand content when the water flow is in a saturated state is used to represent the sand carrying capacity of the water flow . If the actual sand content is greater than , then the deposition will occur along the path. The water flow sand content scale is equal to the water flow sand carrying capacity scale:
- (3)
- Similar conditions of scouring and warping deformation
From the sediment continuity equation, the following is available:
where is the flow movement time scale; is the time ratio of silt; is prototype sand and model sand; is sand content scale.
Based on the similarity criteria, the appropriate model sand, prototype sand, and model sand are selected, as shown in Table 1. The hydraulic factor-related scale is calculated as shown in Table 2.

Table 1.
Physical property indexes of the original sand and model sand.
Table 2.
Physical model test similar scale.
3.2. Model Construction
To optimize the simulation of actual tailings dam failures while taking into account testing time and funding, a geometrically scaled-down physical model was employed, adhering to normal modeling principles with proportional reductions in length, width, and height. Based on actual terrain measurement data and test site conditions, the construction ratio of the model was determined to be 1:150, and the actual terrain range was 4.3 km × 3.2 km × 0.5 km, model size range was 35 m × 21 m × 3.3 m (length × width × height), and the red lines in Figure 4 contain areas within the simulation range of the physical model.
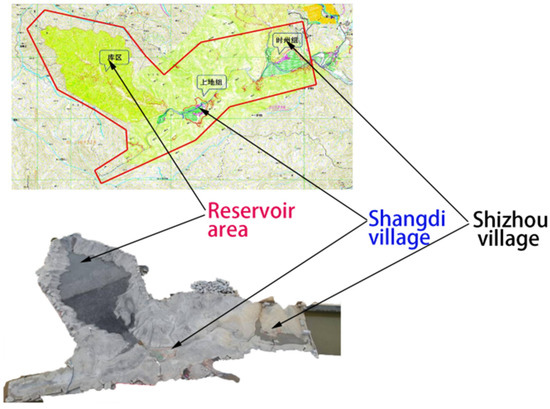
Figure 4.
Tailings pond model.
3.3. Comparison and Selection of Terrain Model Construction Methods
The terrain encompassed by the model exhibited significant undulations and featured well-developed gullies. A channel with a gourd-like shape had a significant impact on flood transport and sediment deposition in the downstream area affected by the dam break. Therefore, it was imperative to meticulously shape the original terrain, particularly the channel’s bottom area, when constructing the terrain model. There are multiple approaches to constructing physical models: the first involves utilizing solid materials such as cement, bricks, sand, and gravel for stacking; the second method employs steel pipes to replicate terrain through node parameters; and the third type utilizes materials such as sand for sculpting shapes, as shown in Figure 5.
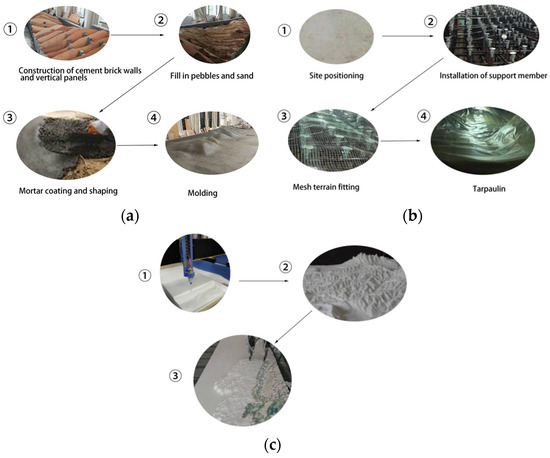
Figure 5.
Three ways to build physical models: (a) solid material stacking; (b) steel pipe and support; (c) simulation of sand or foam and other materials.
Due to the limitations of cost and schedule factors in the aforementioned methods, and by taking into account cost, construction complexity, and scheduling requirements, the model adopted the initial solid material stacking method while also enhancing it. As shown in Figure 6, the model adopted a size of 60 cm × 25 cm × 20 cm, and a concrete aerated block was used as the stacking material. The aerated concrete block material is lightweight, easily cuttable, and has a large volume, making it a convenient and efficient stacking material for construction purposes.
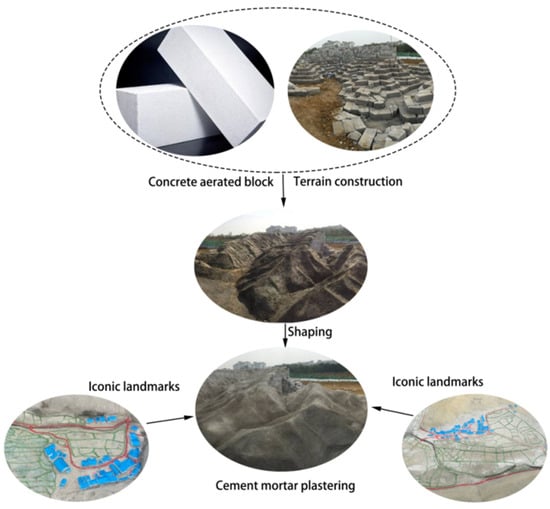
Figure 6.
Building a physical model.
Physical model building involves stacking concrete aerated blocks along the terrain contour line to create a terrain skeleton and then using concrete pavement to shape mountains and channels. The specific approach is as follows:
- (1)
- Electronic topographic map processing: CAD topographic maps are processed and reduced to a scale of 150. The contour lines are selected for measurement and setting out based on the size of the filling block.
- (2)
- Laying concrete aerated blocks involves laying the blocks along the contour line with the lowest elevation, starting from the valley and extending to the model boundary. Once the first layer is in place, subsequent layers are lofted on top of each other along the contour line until the highest layer is reached.
- (3)
- Mountain shaping: Concrete is utilized to create a seamless transition between the stepped terrain resulting from the installation of aerated blocks.
- (4)
- Cement mortar plastering is the final step in terrain treatment, which must be carried out to meet the requirements of experimental roughness.
- (5)
- Iconic landmarks are used for positioning, including roads, rivers, small bridges, farmland, and houses.
3.4. Infiltration Line Control and Measurement System
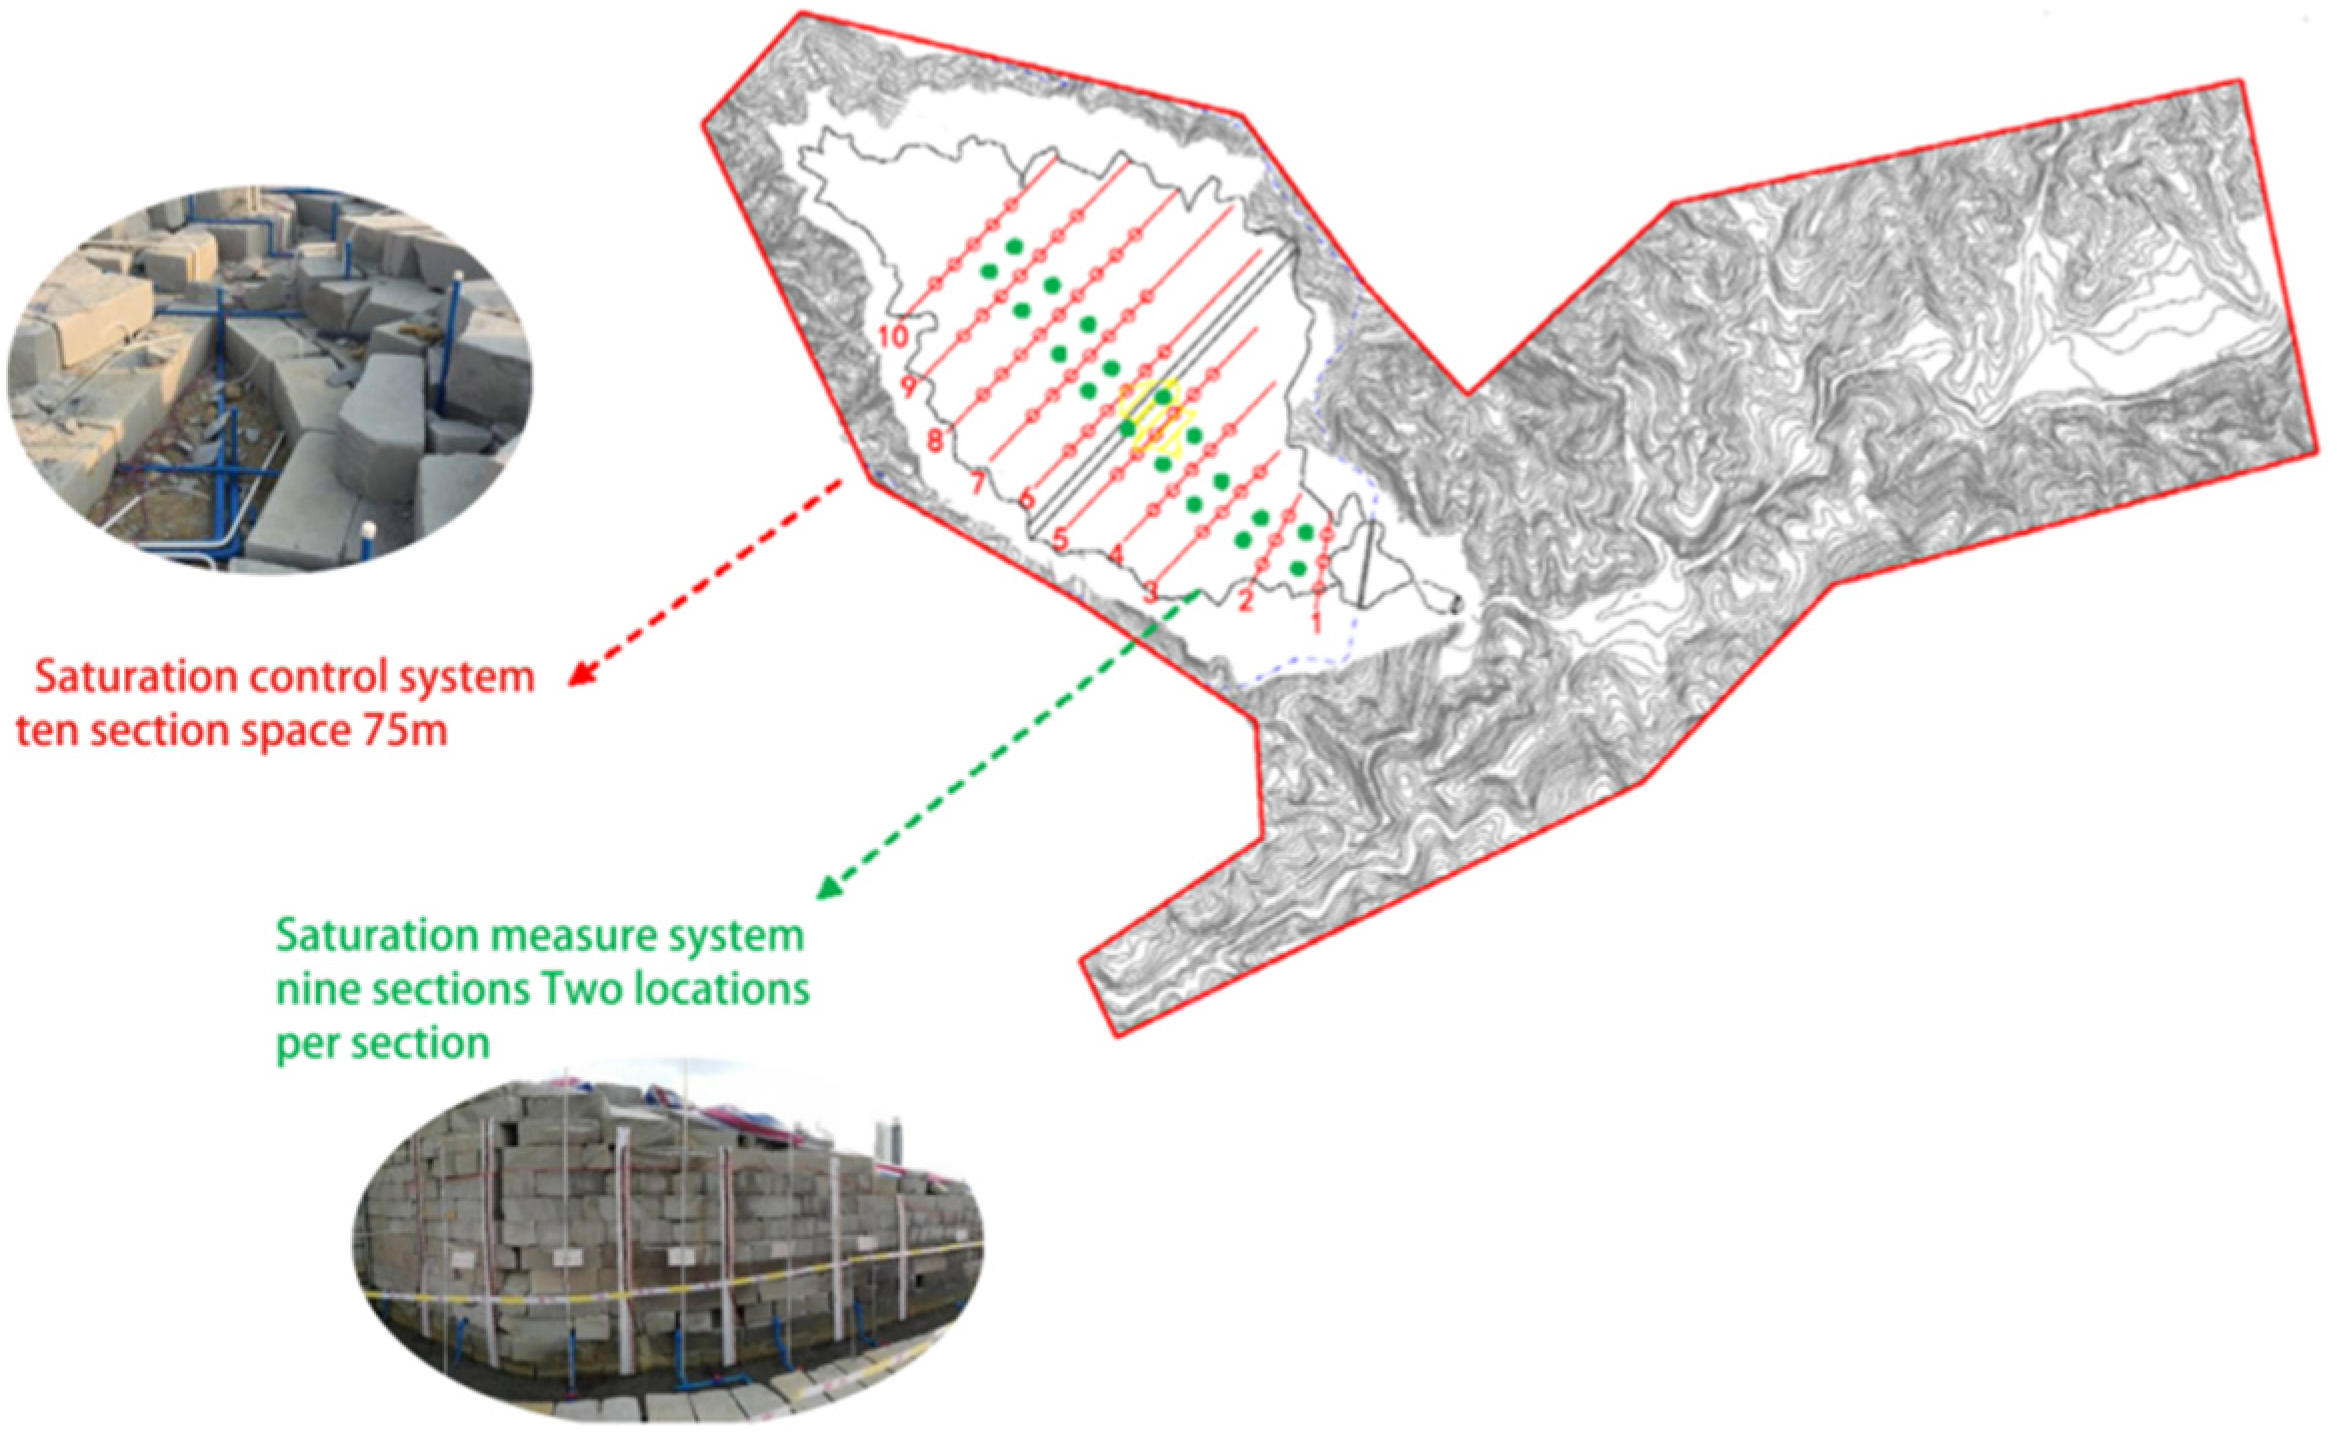
There existed a complex seepage field within the tailings dam, and its seepage path has a direct impact on both the static and dynamic stability of the dam. The seepage line, known as the “lifeline” of the tailings reservoir, was given special consideration in terms of layout and simulation within this physical model. As shown in Figure 7, a plum blossom-shaped seepage point was set up in the reservoir area, and the influence of the height of the seepage line on the stability of the dam body and the influence of different seepage failure points on the stability of the dam body were studied by controlling the section water head. The infiltration line control system in the model was primarily situated along the valley floor, consisting of 10 sections spaced at intervals of 0.5 m between each section point. The infiltration line measurement system was positioned between the two aforementioned sections, comprising nine segments with two locations for each segment.
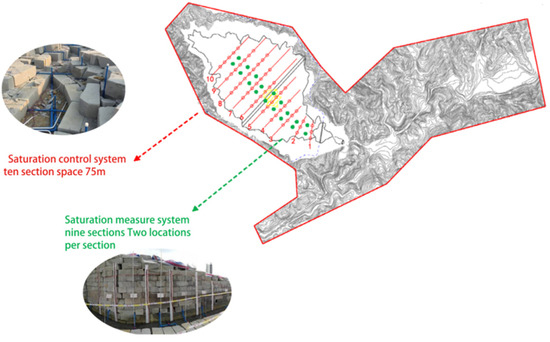
Figure 7.
Model infiltration line control measurement system.
3.5. Model Size Affects the Control Principle
Selecting suitable model sand is the key to the dam break model test of tailing ponds. It is not reasonable to use the original sand in the model test, which not only gives up the geometric similarity between the original sand and the model sand particles but also cannot guarantee the similarity between the model and the prototype tailings movement. If the original sand is reduced according to geometric similarity, then the model sand particles will be very small, and even the corresponding model sand cannot be found. Even if the model sand satisfying geometric similarity is found, the structure and characteristics of the model sand will be significantly different from that of the original sand. In the dam break model test, we studied the clustering effect of the entire tailing rather than tracking the movement of individual tailing particles in water. In the selection of model sand, it is required that the simulated material and the prototype material have good similarity or similarity in the main physical and mechanical properties; specifically, the following five conditions should be met:
- (1)
- The physical and mechanical properties are stable and will not have a big impact when the atmospheric temperature and humidity change.
- (2)
- The tailings dam body will not have large shrinkage, expansion, and other deformation after forming.
- (3)
- The permeability, deformation, and strength properties are similar to those of the tailings materials.
- (4)
- Suitable bulk density is met.
- (5)
- The sudden collapse displacement of the prototype and the movement characteristics of debris flow are met.
4. Determination of Physical and Mechanical Indicators of Model Sand and Prototype Sand
4.1. Physical and Mechanical Properties Indicators of Prototype Sand
The tailings pond utilized the centerline method for dam construction and employed tailings grading equipment to segregate the tailings slurry into coarse-grained settling sand and fine-grained overflow tailings. The tailings pond utilized the centerline method for dam construction and employed tailings grading equipment to segregate the tailings slurry into settling sand with coarse grains and overflow tailings with fine grains. The upstream ore drawing method was still employed for the deposition of fine-grained overflow tailings, resulting in the formation of dry beaches upstream of the axis. The coarse and fine-grained tailings combined to form a single dam body both upstream and downstream of the axis. The prototype sand’s basic information included a tailings slurry concentration of 25% for fine mud tailings and 35% for gravity tailings. The particle size composition of tailings is shown in Table 3 and Table 4, with the particle distribution of fine mud tailings d50 = 0.02 mm and gravity tailings d50 = 0.4 mm. The initial median particle size of tailings is d50 = 0.21 mm.
Table 3.
Composition of prototype sand particles.
Table 4.
Physical and mechanical property indicators of prototype sand.
Physical and mechanical property indicators: The test sand sample was obtained from the tailings pond and represents a natural, undisturbed sample. Multiple sets of experiments were conducted to determine the physical and mechanical properties of the prototype sand, which are presented in Table 4.
4.2. Model Sand Selection
Power plant slag is the residual waste material that is discharged from coal-fired power plants. Compared to the dry bottom slag of fly ash boilers, it exhibits a lower carbon content and a more moderate bulk density. After sampling and testing, the particle bulk density was about 21.17 kN/m3, and the particle size range was between 0.13 mm and 0.4 mm. The pore structure and surface morphology of the model sand were comparable to those of the actual tailings, exhibiting consistent physical and mechanical properties. After the formation of the dam body, there was no significant shrinkage, expansion, or other deformation, nor any hardening phenomenon.
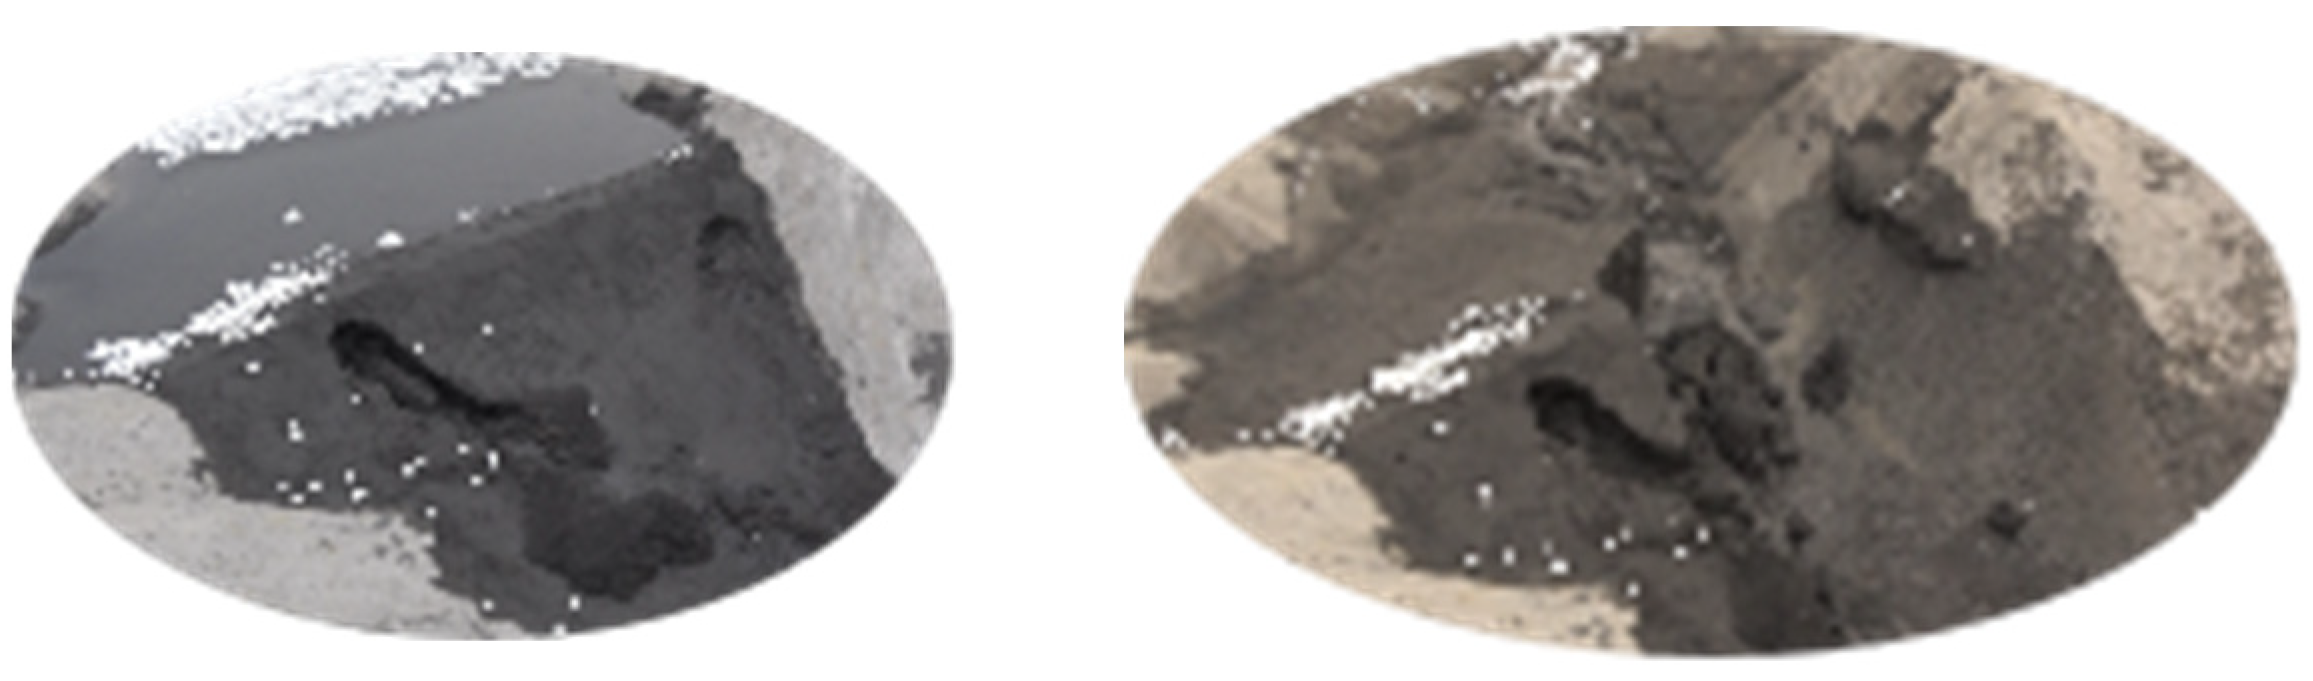
Based on the comparison of characteristics, and considering on-site material selection, thermal power plant slag with moderate bulk density and stable chemical properties was chosen as the model sand for this tailings dam break model test, as shown in Figure 8.
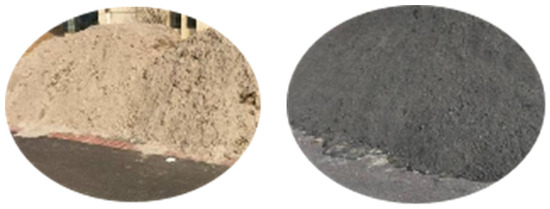
Figure 8.
Prototype tailings and model sand.
To compare the performance differences between prototype sand and model sand, samples of both were prepared with three different moisture contents (10%, 15%, and 20%).
To ensure the uniformity of compactness among all samples, each sample was compacted under identical conditions. The results of the direct shear test on both prototype and model sand, with moisture contents of 10%, 15%, and 20%, are presented in Table 5.
Table 5.
Shear test results of prototype sand and model sand.
The difference in internal friction angle and cohesion values between the two was insignificant under varying water contents, indicating that the mechanical properties of the selected model sand were comparable to those of the prototype, thereby ensuring similarity in erosion rates between them. In terms of permeability properties, the prototype tailings underwent hydraulic sedimentation as they were pumped and discharged into the tailings pond for stacking. The permeability coefficient of the prototype tailings in its original state was K = 2.2 × 10⁻⁵ cm/s. In the dam break test, the sand-filled dam was subjected to water injection for hydraulic sedimentation simulation. After conducting sampling, the permeability coefficient K of the model sand was measured to be 4.2 × 10⁻⁵ cm/s, which closely approximates that of the prototype sand. Under hydraulic erosion, it exhibited the characteristics of sudden collapse and movement as debris flow.
When the bulk density of sand particles was low, their water-carrying capacity increased due to a larger sand content in the model, resulting in increased particle contact and higher water flow viscosity. The solid–liquid volume ratio in the model’s water sand flow was significantly distorted compared to that of the prototype. After measurement, the unit weight of the slag particles in the power plant was found to be 21.17 kN/m3, which exceeded the minimum requirement of 19.6 kN/m3 for unit weight and thus qualified as a suitable model sand for this test.
Particle size analysis and physical and mechanical property index measurement were performed on the model sand, as shown in Table 6 and Table 7. The median particle size of model sand particle d50 = 0.16 mm.
Table 6.
Model sand particle size distribution.
Table 7.
Physical and mechanical property indicators of model sand.
4.3. Preliminary Tests
In the initial stage, four preliminary tests were conducted to investigate the erosion and sedimentation morphology of model sand after dam failure under varying conditions such as compaction, sand selection, and saturation line of the dam. The adaptability of model sand in simulating tailings dam failure was tested, providing a basis for the accurate selection of model sand and dam parameters.
- (1)
- First and Second Preparatory Tests
The first two preliminary tests employed partial stacking, utilizing a model stacking dam with a height of 1.8 m and a downstream slope ratio of 1:3. The stacking body was compacted in layers. After compaction, the average moisture content of the model sand sample was 24%, and the average stacking density was 0.97 g/cm3, corresponding to the dry density of the stacking ρd = 0.78 g/cm3. As shown in Figure 9.
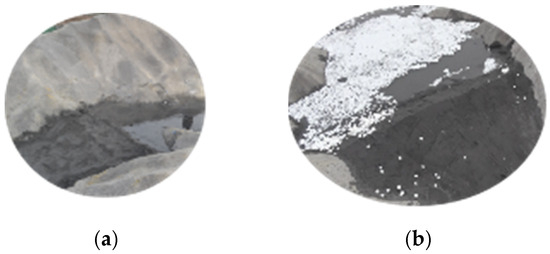
Figure 9.
Preliminary test initial state: (a) first preliminary test; (b) second preliminary test.
The test scenario involved overtopping dam failure, and the final morphology of dam failure in both tests was comparable. As shown in Figure 10, during the initial preliminary test, cracks were observed on the left bank of the central section of the dam slope prior to water overtopping. Subsequently, the water that overtopped from the left bank of the dam body breached and rapidly propagated. The bottom of the breach rapidly eroded and deepened, resulting in a steep ridge with both sides collapsing successively. The breach continued to intensify until the flood discharge from the reservoir was completed, marking an end to the dam breach.
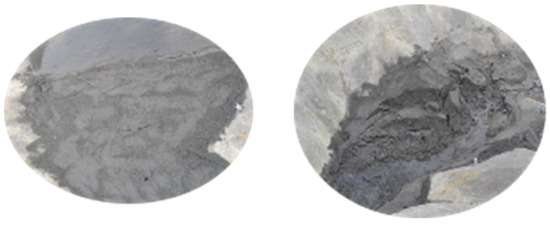
Figure 10.
Dam break process of the first preparatory test.
As shown in Figure 11, in the second preliminary test, piping points appeared successively on the right and left banks of the dam below the dam crest before the water flow reached the top of the dam. Then, a stream flow formed, and the dam slope was pulled up, causing severe erosion of the sand bodies in the middle and lower reaches of the dam. The final breach appeared on the left bank, and steep ridges quickly formed on both sides of the breach and continued to collapse. The breach continued to deepen until the end of the breach.
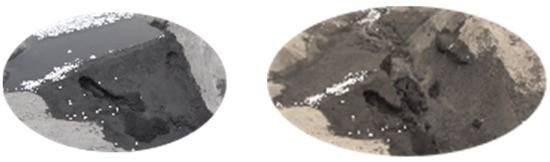
Figure 11.
Dam break process of the second preparatory test.
- (2)
- Third and fourth wetting line control tests in the preparation stage.
The accumulation height of the third and fourth preparatory tests was in accordance with the prototype design. The wetting line control system was utilized to regulate the wetting line height within the reservoir. The average moisture content of the sand sample was 35%, while its mean accumulation density reached 1.17 g/cm3, resulting in a corresponding dry density ρd = 0.87 g/cm3.
In the third preliminary test, as a result of the high setting of the control head of the wetting line and its prolonged duration, water cascaded over the slope of the dam to create multiple scour trenches. The initial overtopping flow breached through the centerline of the crest before continuing to erode along pre-existing scour features. The sand body atop the dam between both sides slid due to deep trenches, leading to a landslide and rapid collapse of the structure. The resulting flood in the reservoir caused immediate release and ultimately failure of the dam. At the end of the collapse, the hole was 5 m wide and 1.3 m deep. For the initial state of the test, the control water head of each section infiltration line is shown in Table 8. The dam break process of the third preparatory test is shown in Figure 12.
Table 8.
Third preparatory test wetting line control head.
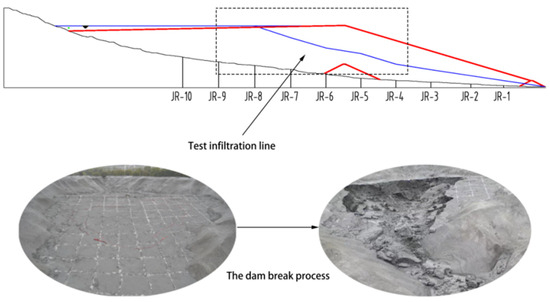
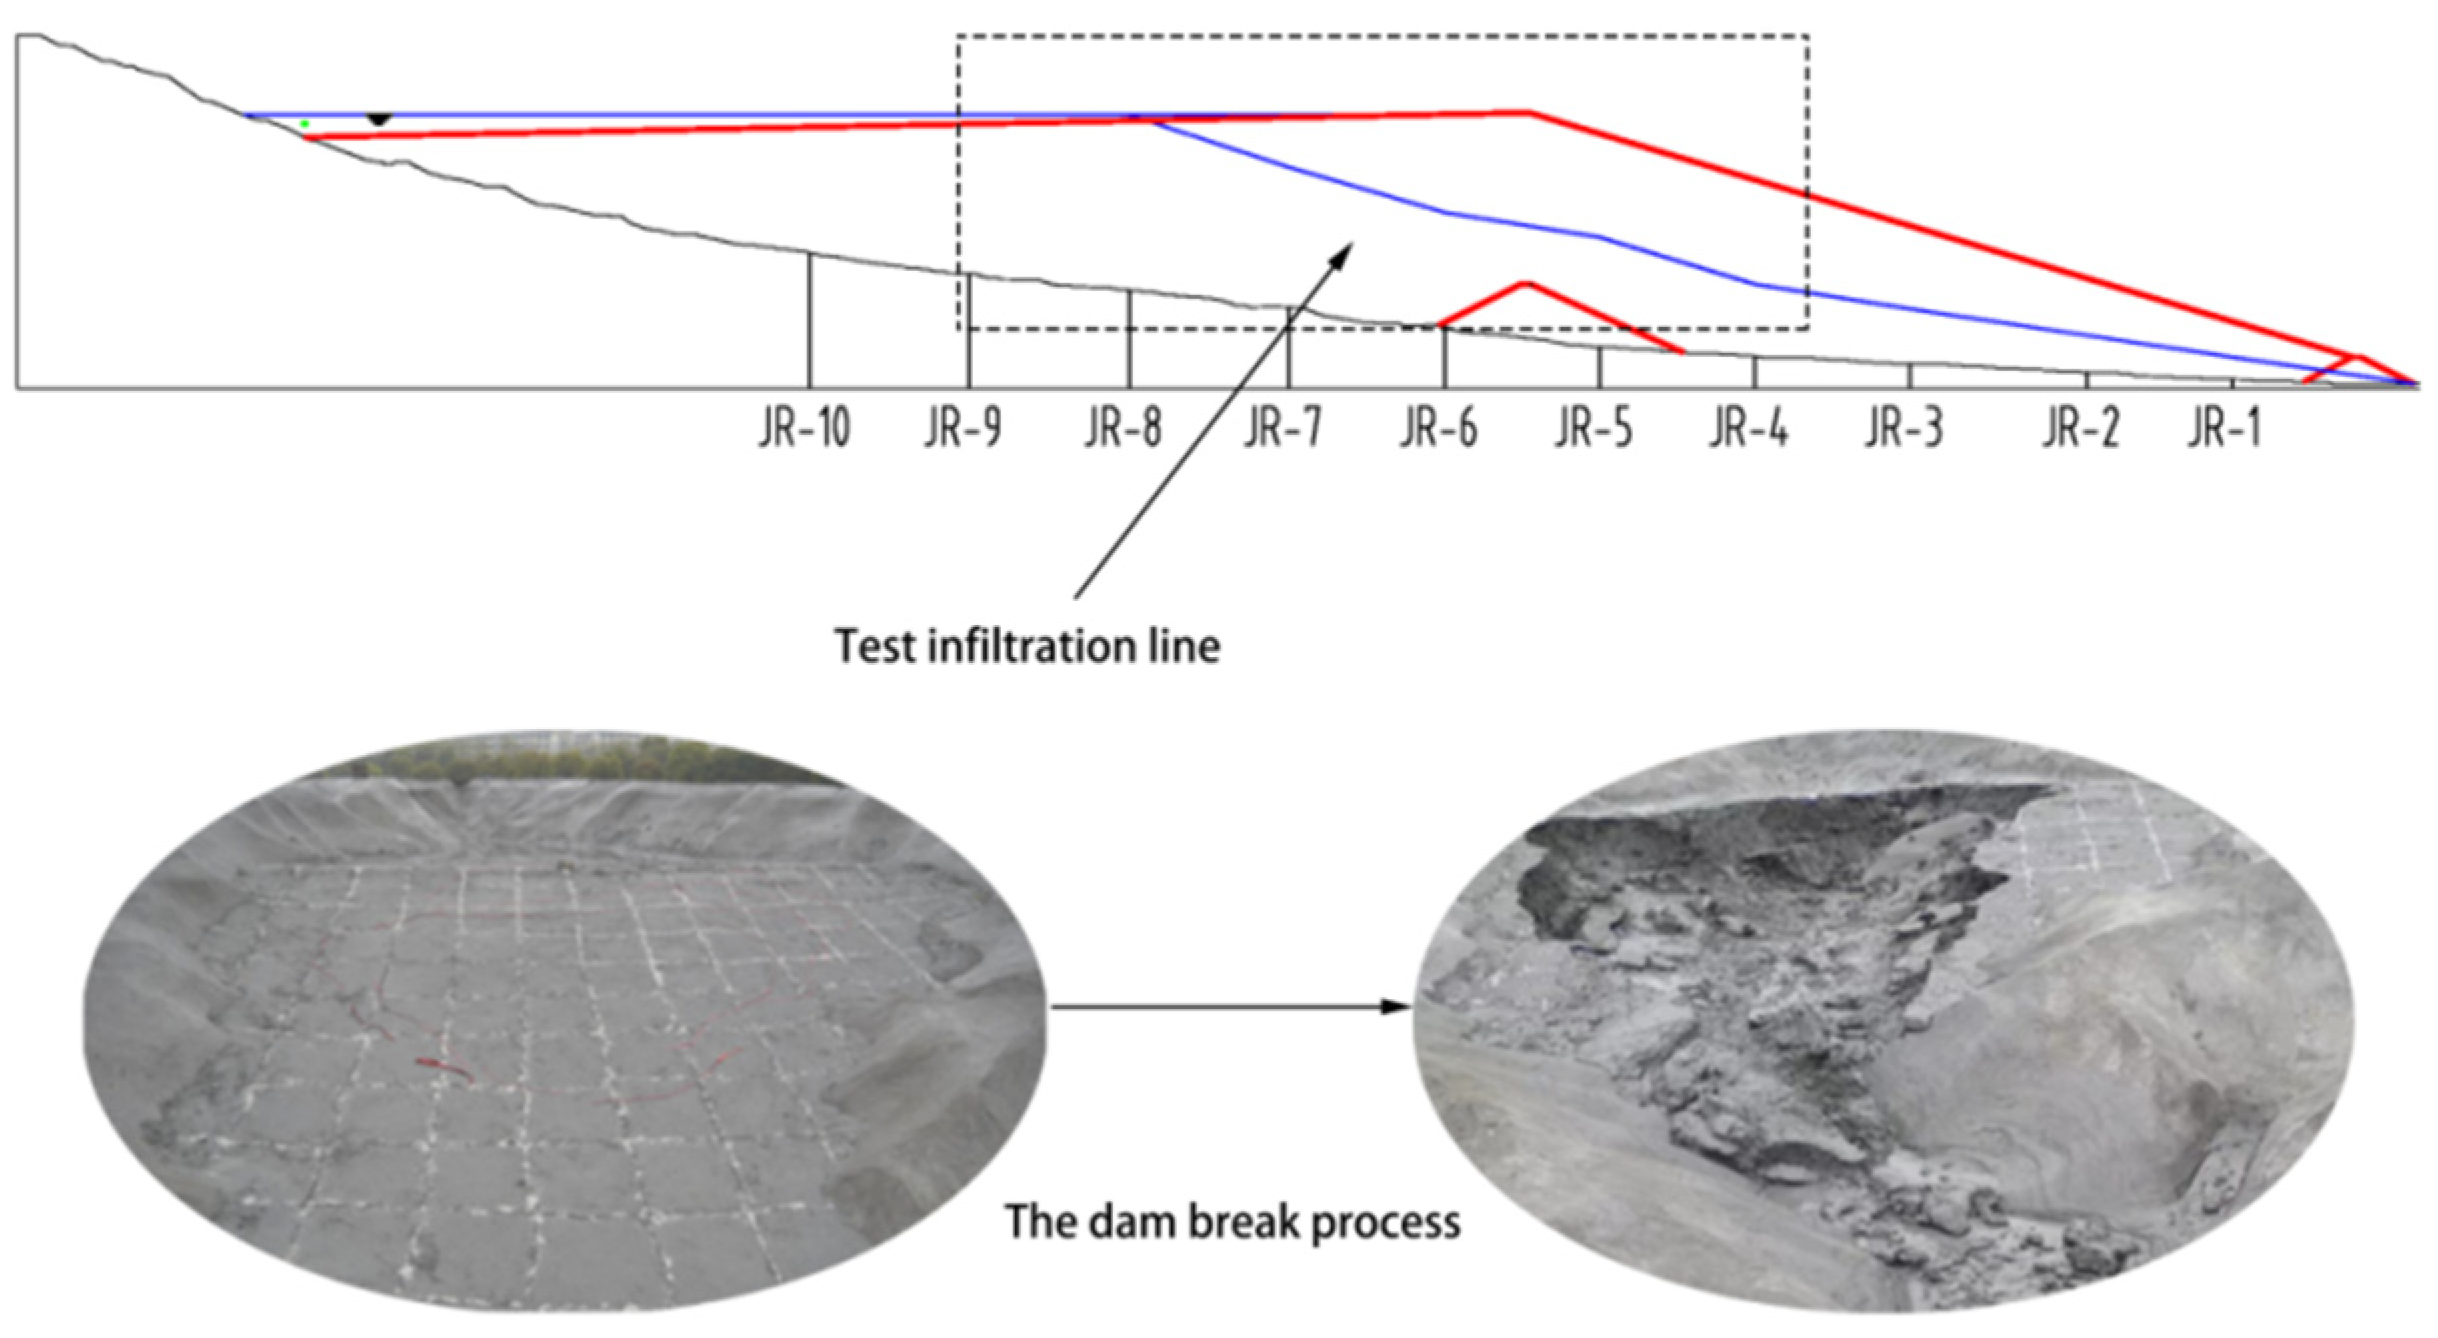
Figure 12.
Dam break process of the third preparatory test.
In the fourth preparatory test, the arrival of a simulated flood at the end of the reservoir and the wetting line system were strictly controlled. In the initial state, the control head of the infiltration line of each section is shown in Table 9. The simulated flood reached the overtopping position and formed a breach in the middle of the dam top. After the water broke through the dam top, the water flowed down the dam slope, the dam slope was washed and pulled into a ditch, and then the dam slope was deepened, steep ridges formed at the bottom of both sides, and it gradually collapsed from bottom to top. The breach immediately increased and deepened, and the water in the reservoir drained slowly until the flood in the reservoir was discharged and the dam break process was completed. The dam break process of the fourth preparatory test is shown in Figure 13.
Table 9.
List of control heads of the wetting line for the fourth preliminary test.
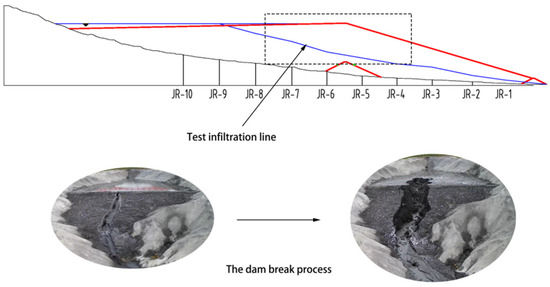
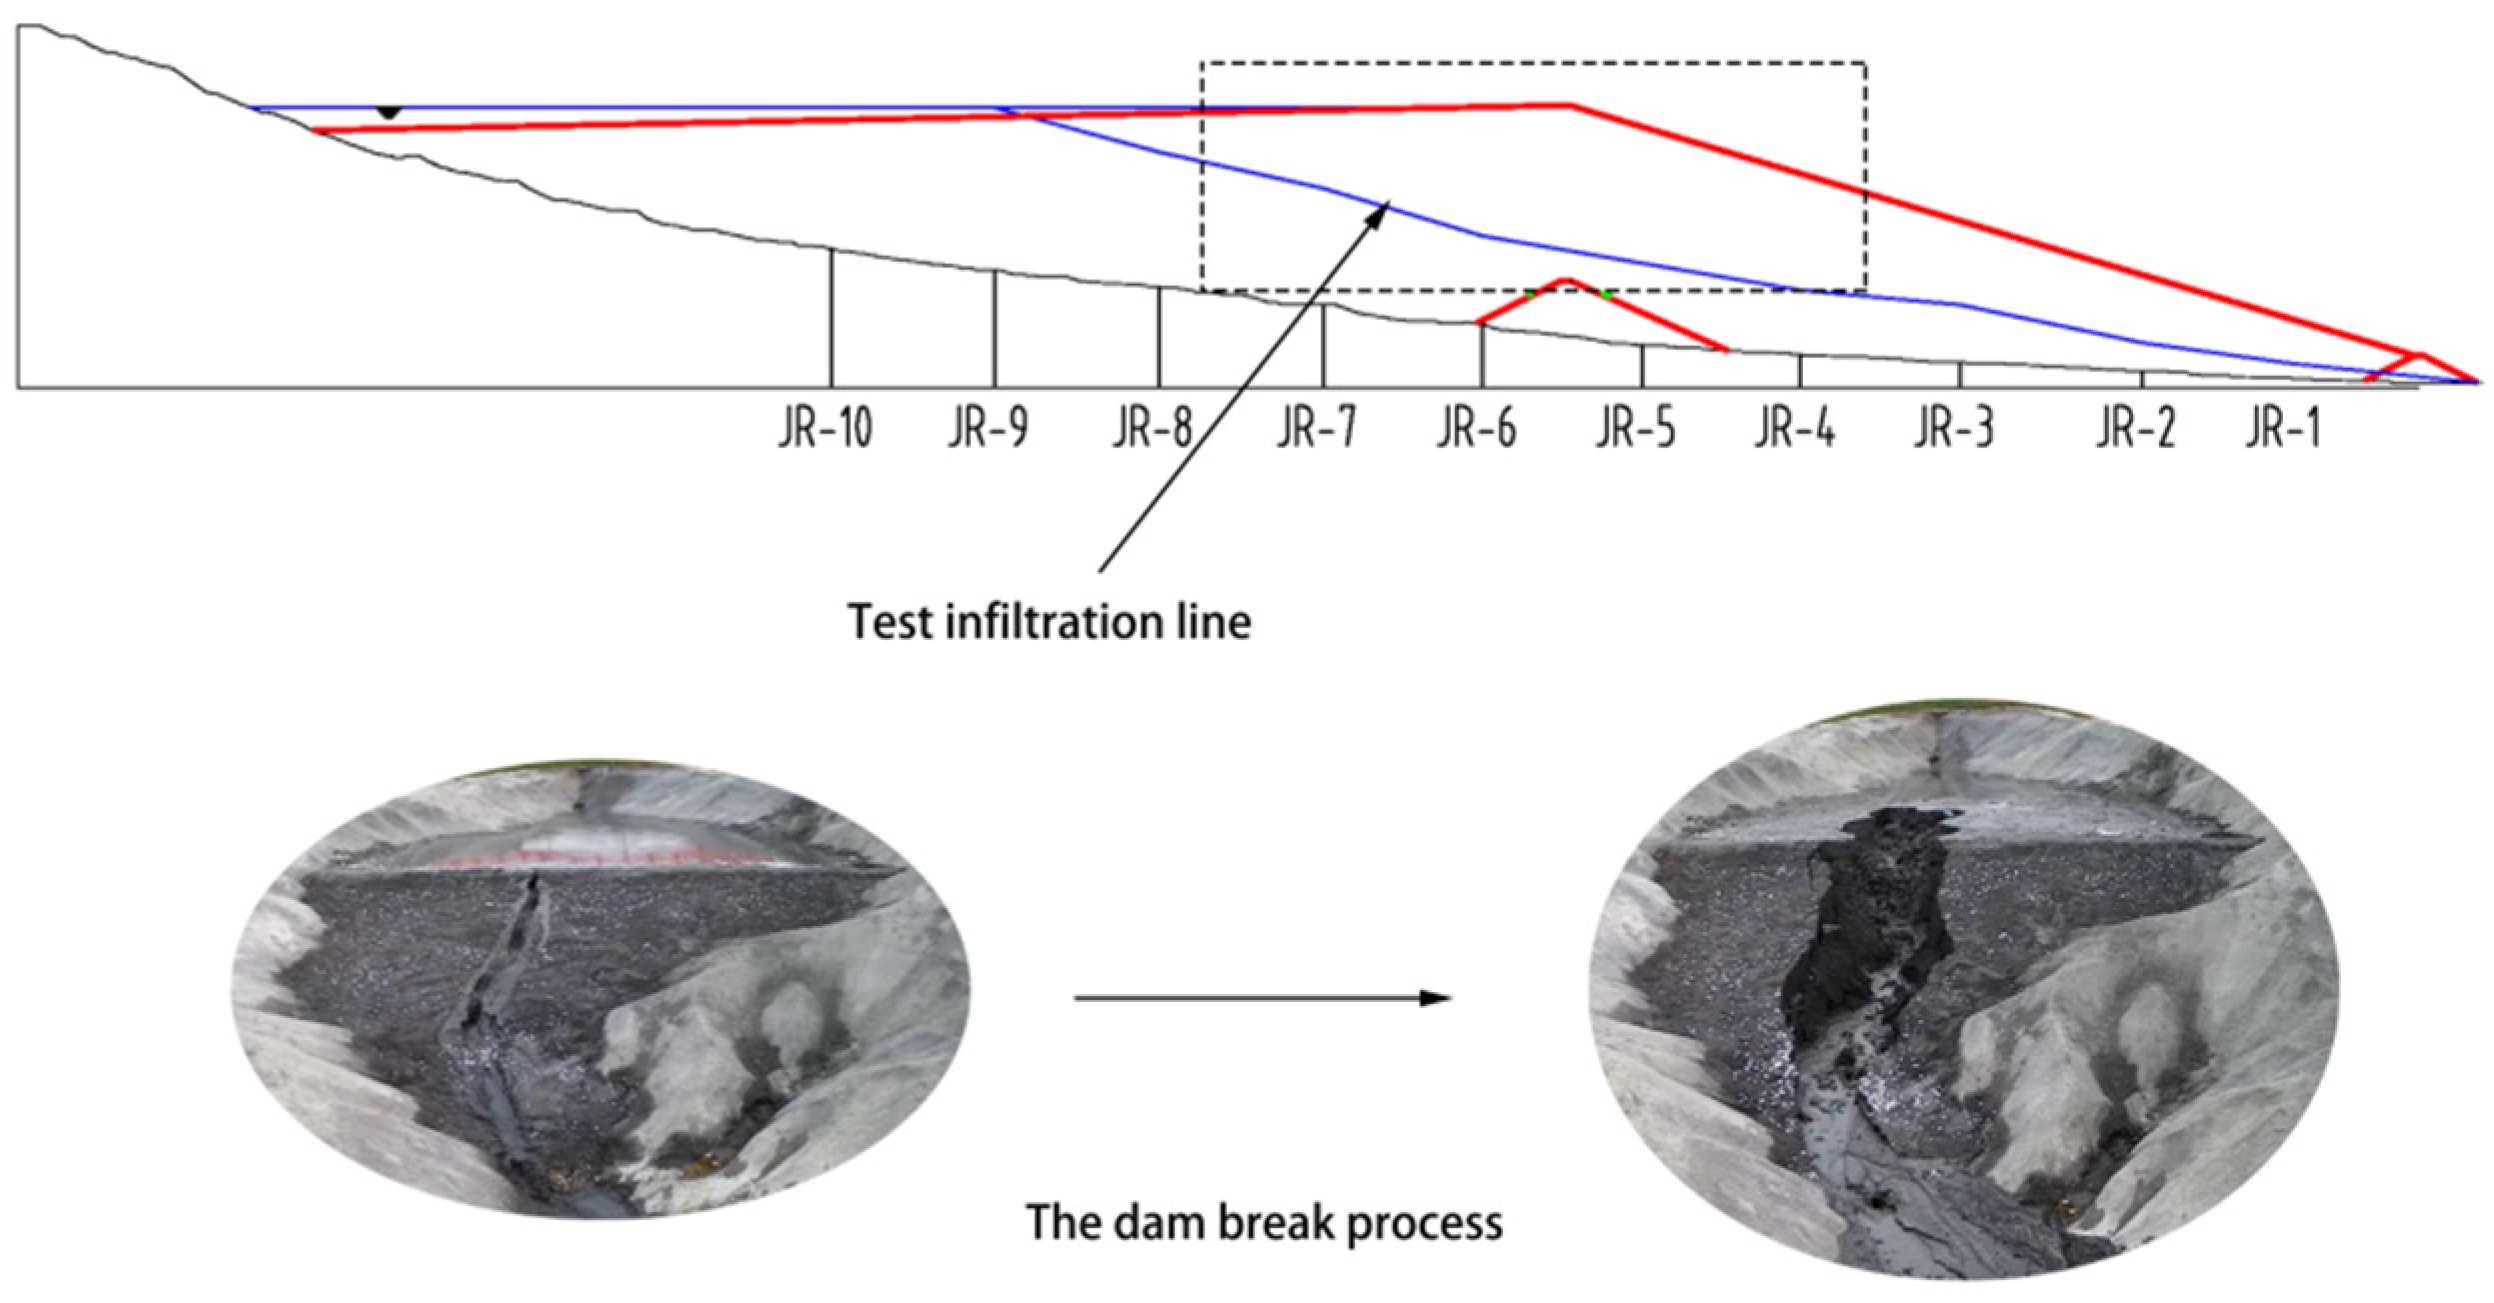
Figure 13.
Dam break process of the fourth preparatory test.
4.4. Summary of Preliminary Tests
- (1)
- The higher the compaction degree of the accumulated dam, the slower the process of dam failure and the smaller the volume of collapse. Additionally, it was observed that hydraulic infiltration achieved a greater level of compactness (ρd = 0.87 g/cm3) compared to artificial rolling (ρd = 0.74 g/cm3). Therefore, during formal testing, it is imperative to ensure an appropriate infiltration time for optimal results.
- (2)
- The size gradation of model sand particles should be moderate, as it greatly affects the post-failure collapse mode of a dam body. An excess of large particles results in higher porosity and potential for piping phenomena, while an excess of small particles increases cohesion and viscosity, resulting in narrower collapse widths and potential for compaction phenomena.
- (3)
- The saturation line is a critical factor in maintaining the stability of tailings reservoirs, as it determines the degree of saturation within the reservoir and greatly impacts outburst behavior during dam break events. During testing, it is important to control the head of the saturation line to ensure that model results accurately reflect those observed in real-world prototypes.
5. Physical Model Dam Break Test
5.1. Introduction to Test Conditions
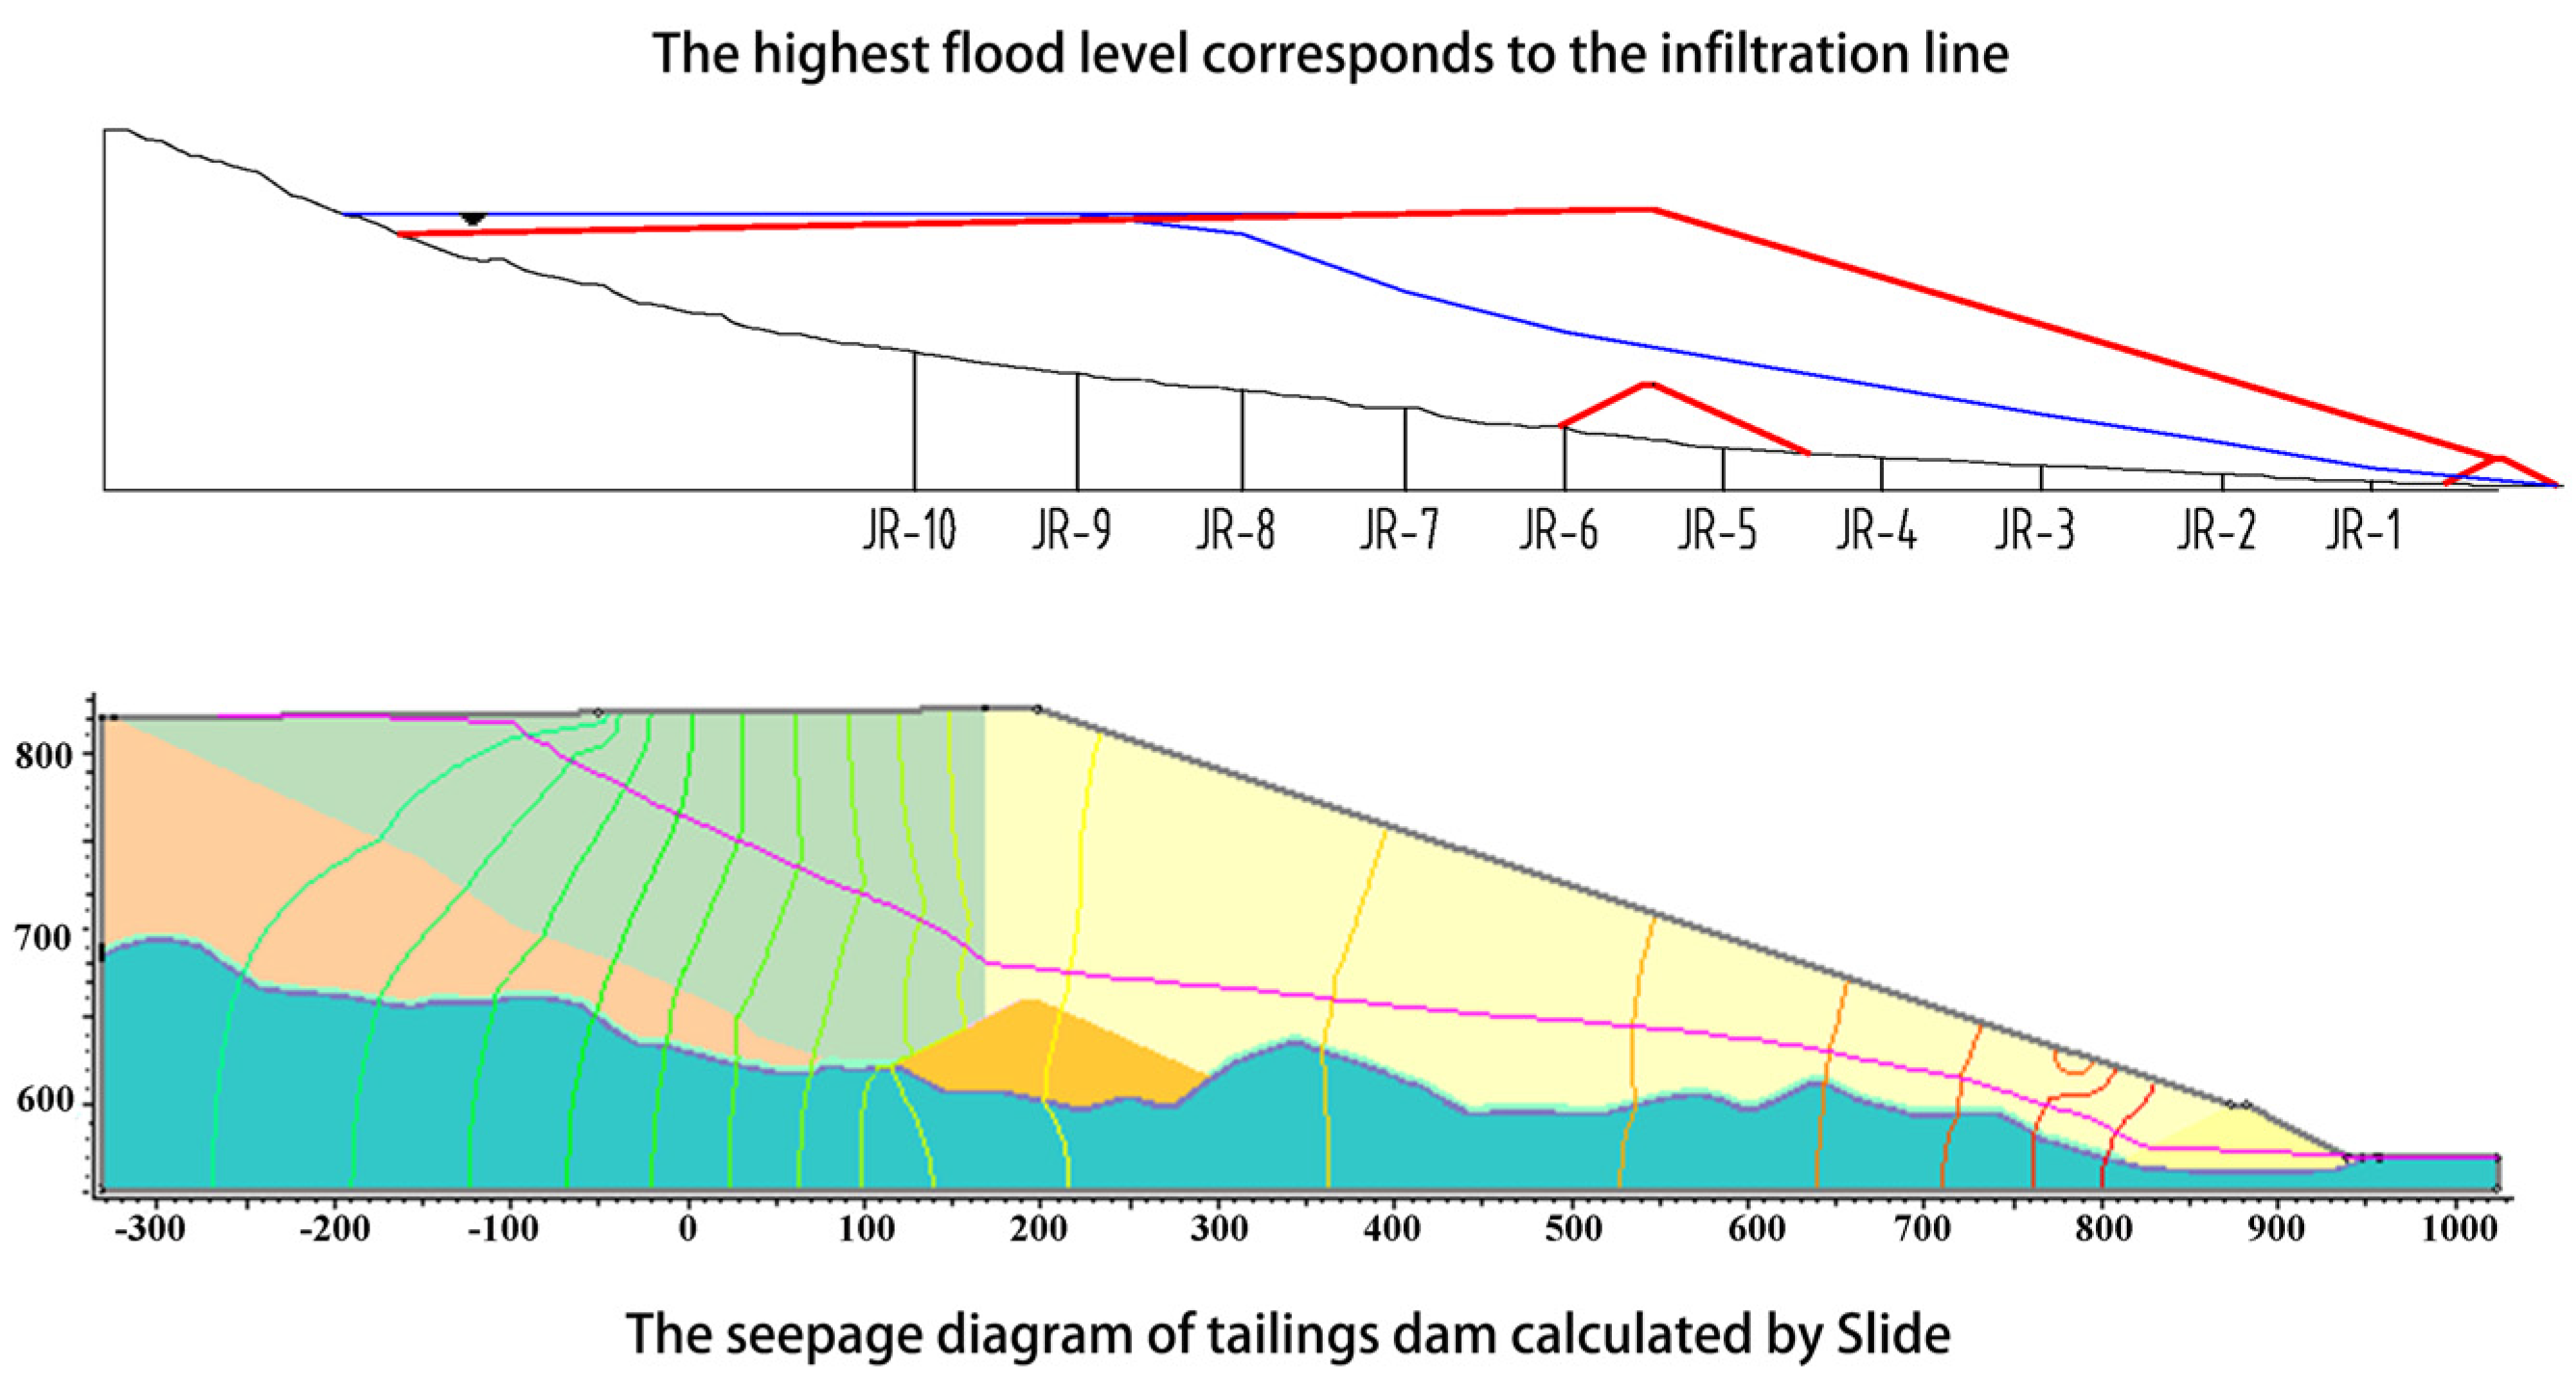
In order to achieve a physical model that closely resembled the middle-line dam stacking method, the sand used in the model was sieved during the stacking process. A fine particle model sand was utilized upstream of the dam axis, while a relatively coarse particle model sand was employed downstream of the dam axis. The formal testing scenario assumed that the tailings dam failed as a result of flood overflow. Under these circumstances, the water level in the tailings reservoir area was at a critical state, meaning it reached its highest flood level, and the length of dry beach was only 0.67 m (100 m in prototype). In this condition, any potential PMF event could result in an overtopping dam break. Table 10 and Figure 14 demonstrate the buried depth of the wetted line in the initial state of the physical model, which was controlled and adjusted through the wetted line system of the tailings dam.
Table 10.
Depth of infiltration line in the initial state of the physical model.

Figure 14.
Comparison of seepage results of flood operation at the final accumulation elevation.
By comparing the seepage flow results of flood operation at the final accumulation elevation calculated by Slide software (V 6.0), adjustments could be made to the wetting line system in order to ensure that the state of the wetting line in the physical model was essentially consistent with that of the prototype.
5.2. Dam Failure Process
In the initial state, the water level in the tailings reservoir reached its maximum flood level, while the length of exposed dry beach measured 0.67 m (equivalent to 100 m in the prototype).
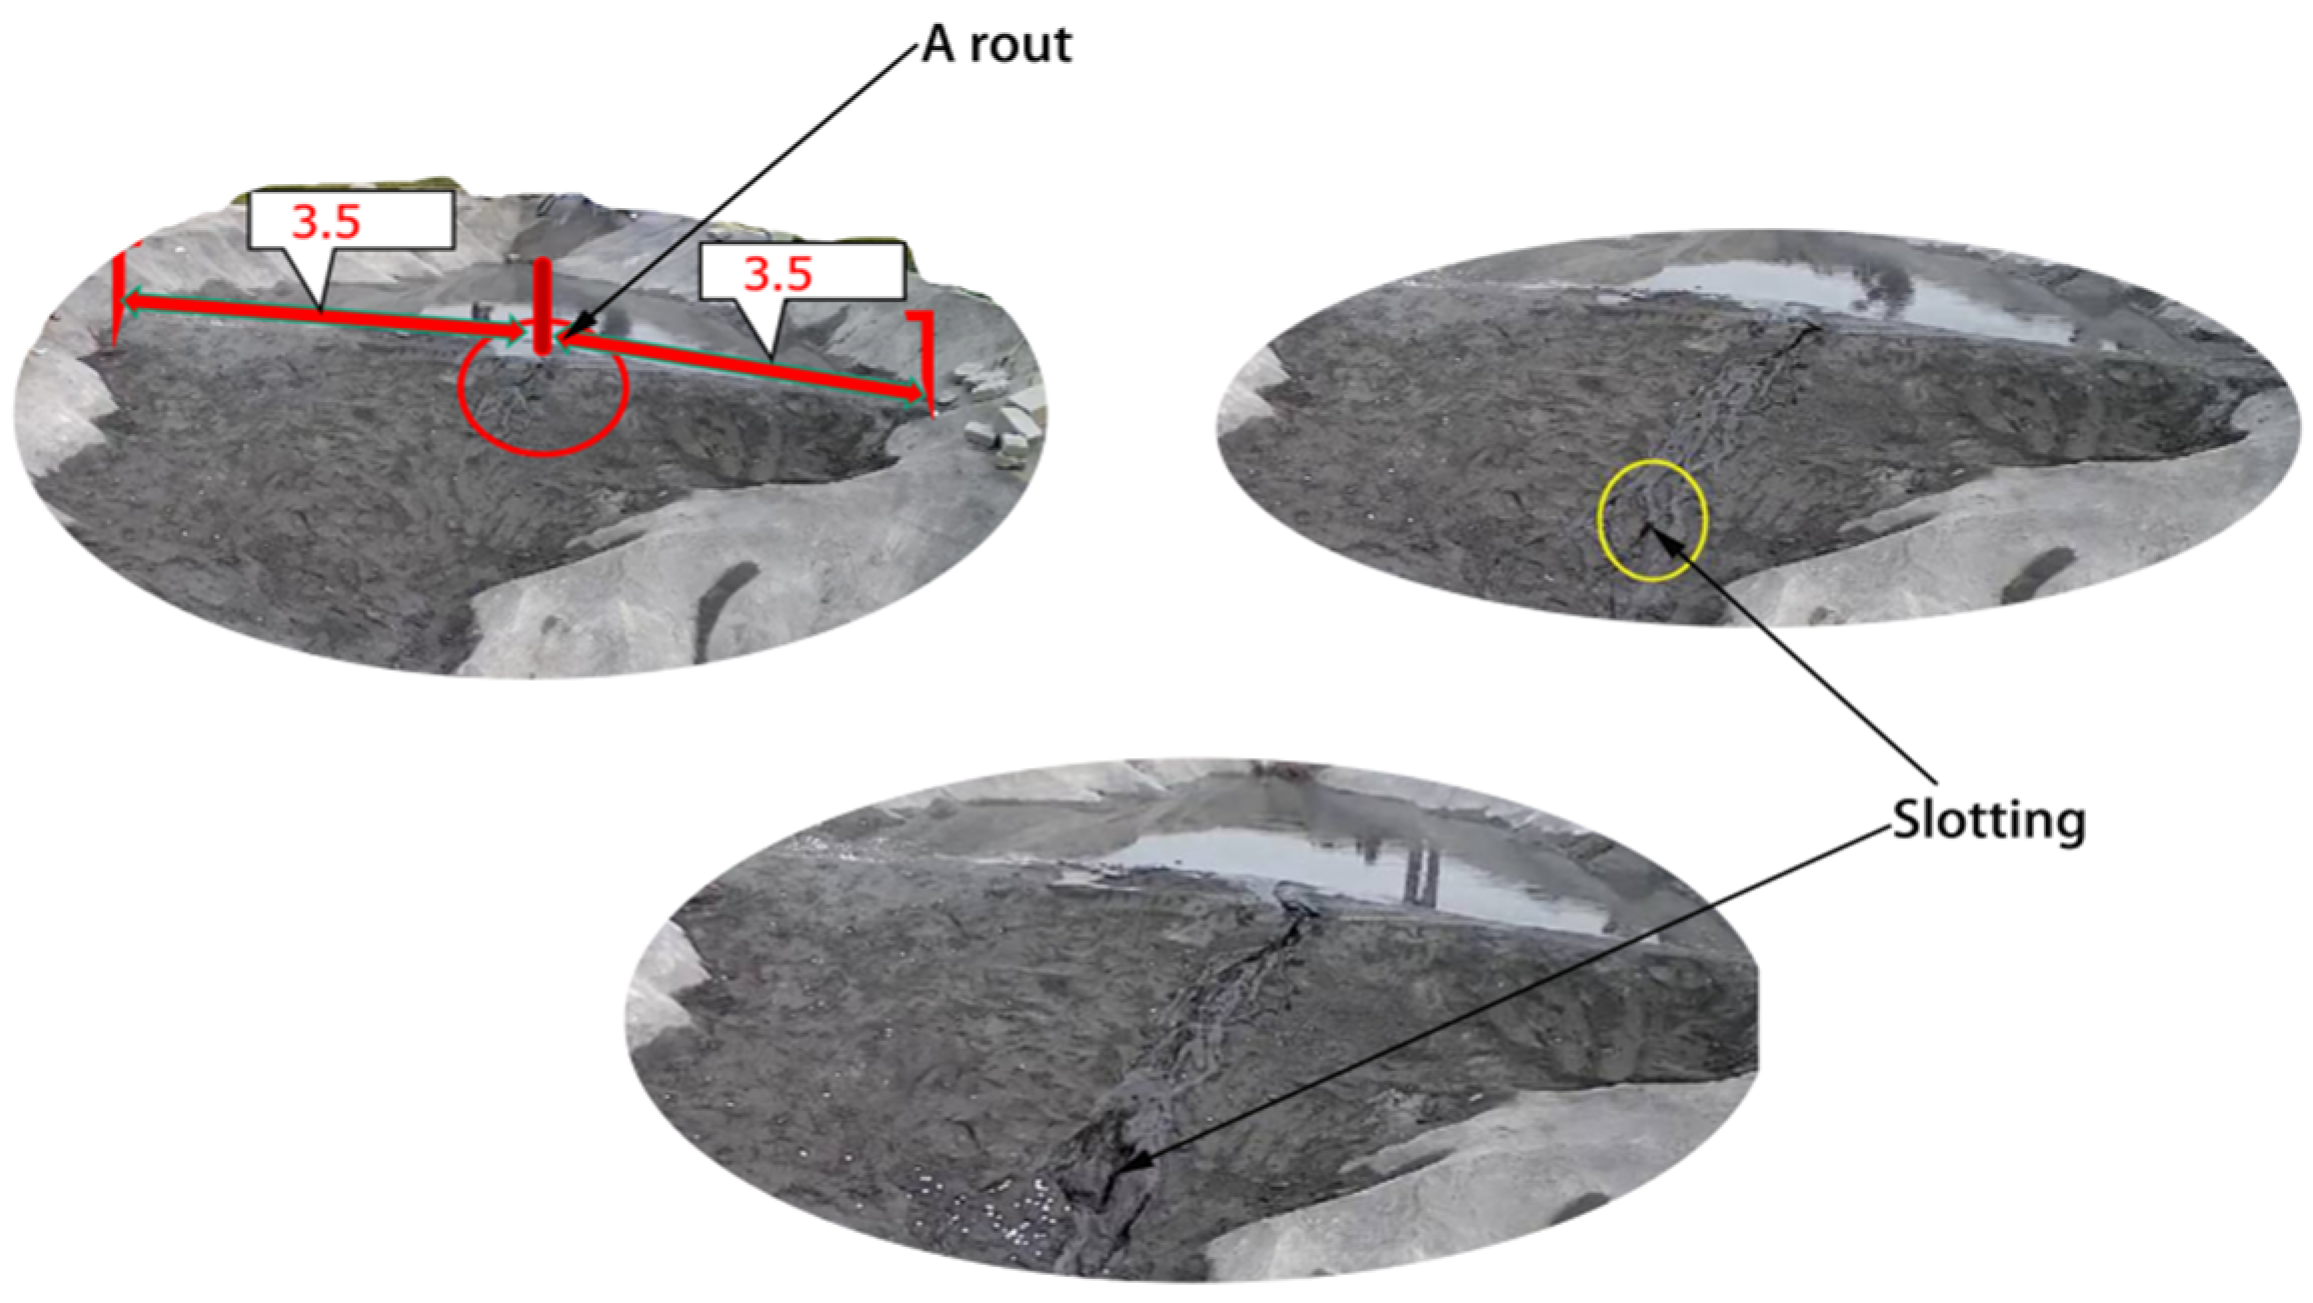
At 17:00 (model time), the reservoir’s endpoint initiated water inflow, simulating a flood event. At 07 min and 26 s, a breach occurred in the middle of the dam crest, with a water injection volume of 0.313 m3. This amount is equivalent to 1.78 times the total amount of once-in-1000 years flood and 1.19 times the total amount of PMF (probable maximum flood) flood. At 8 min and 30 s, the water overtopped and reached the base of the sand bar. At 8 min and 40 s, a depression emerged at the local vulnerable point of the dam surface. At 9 min and 15 s, a significant furrow manifested on the dam surface and propagated throughout the entire structure, as shown in Figure 15.

Figure 15.
There is a ditch in the dam.
At 09 min 46 s, the ditch was obviously pulled, the local (weak) wall of the ditch collapsed, and water trickled down. The gully was deep, but the width was not significantly increased; the gully was slowly formed with the tailing sand in the reservoir area. At 10 min 00 s, the ditch continued to expand deep, cracks appeared along the edge of the ditch wall, and the collapse degree increased.
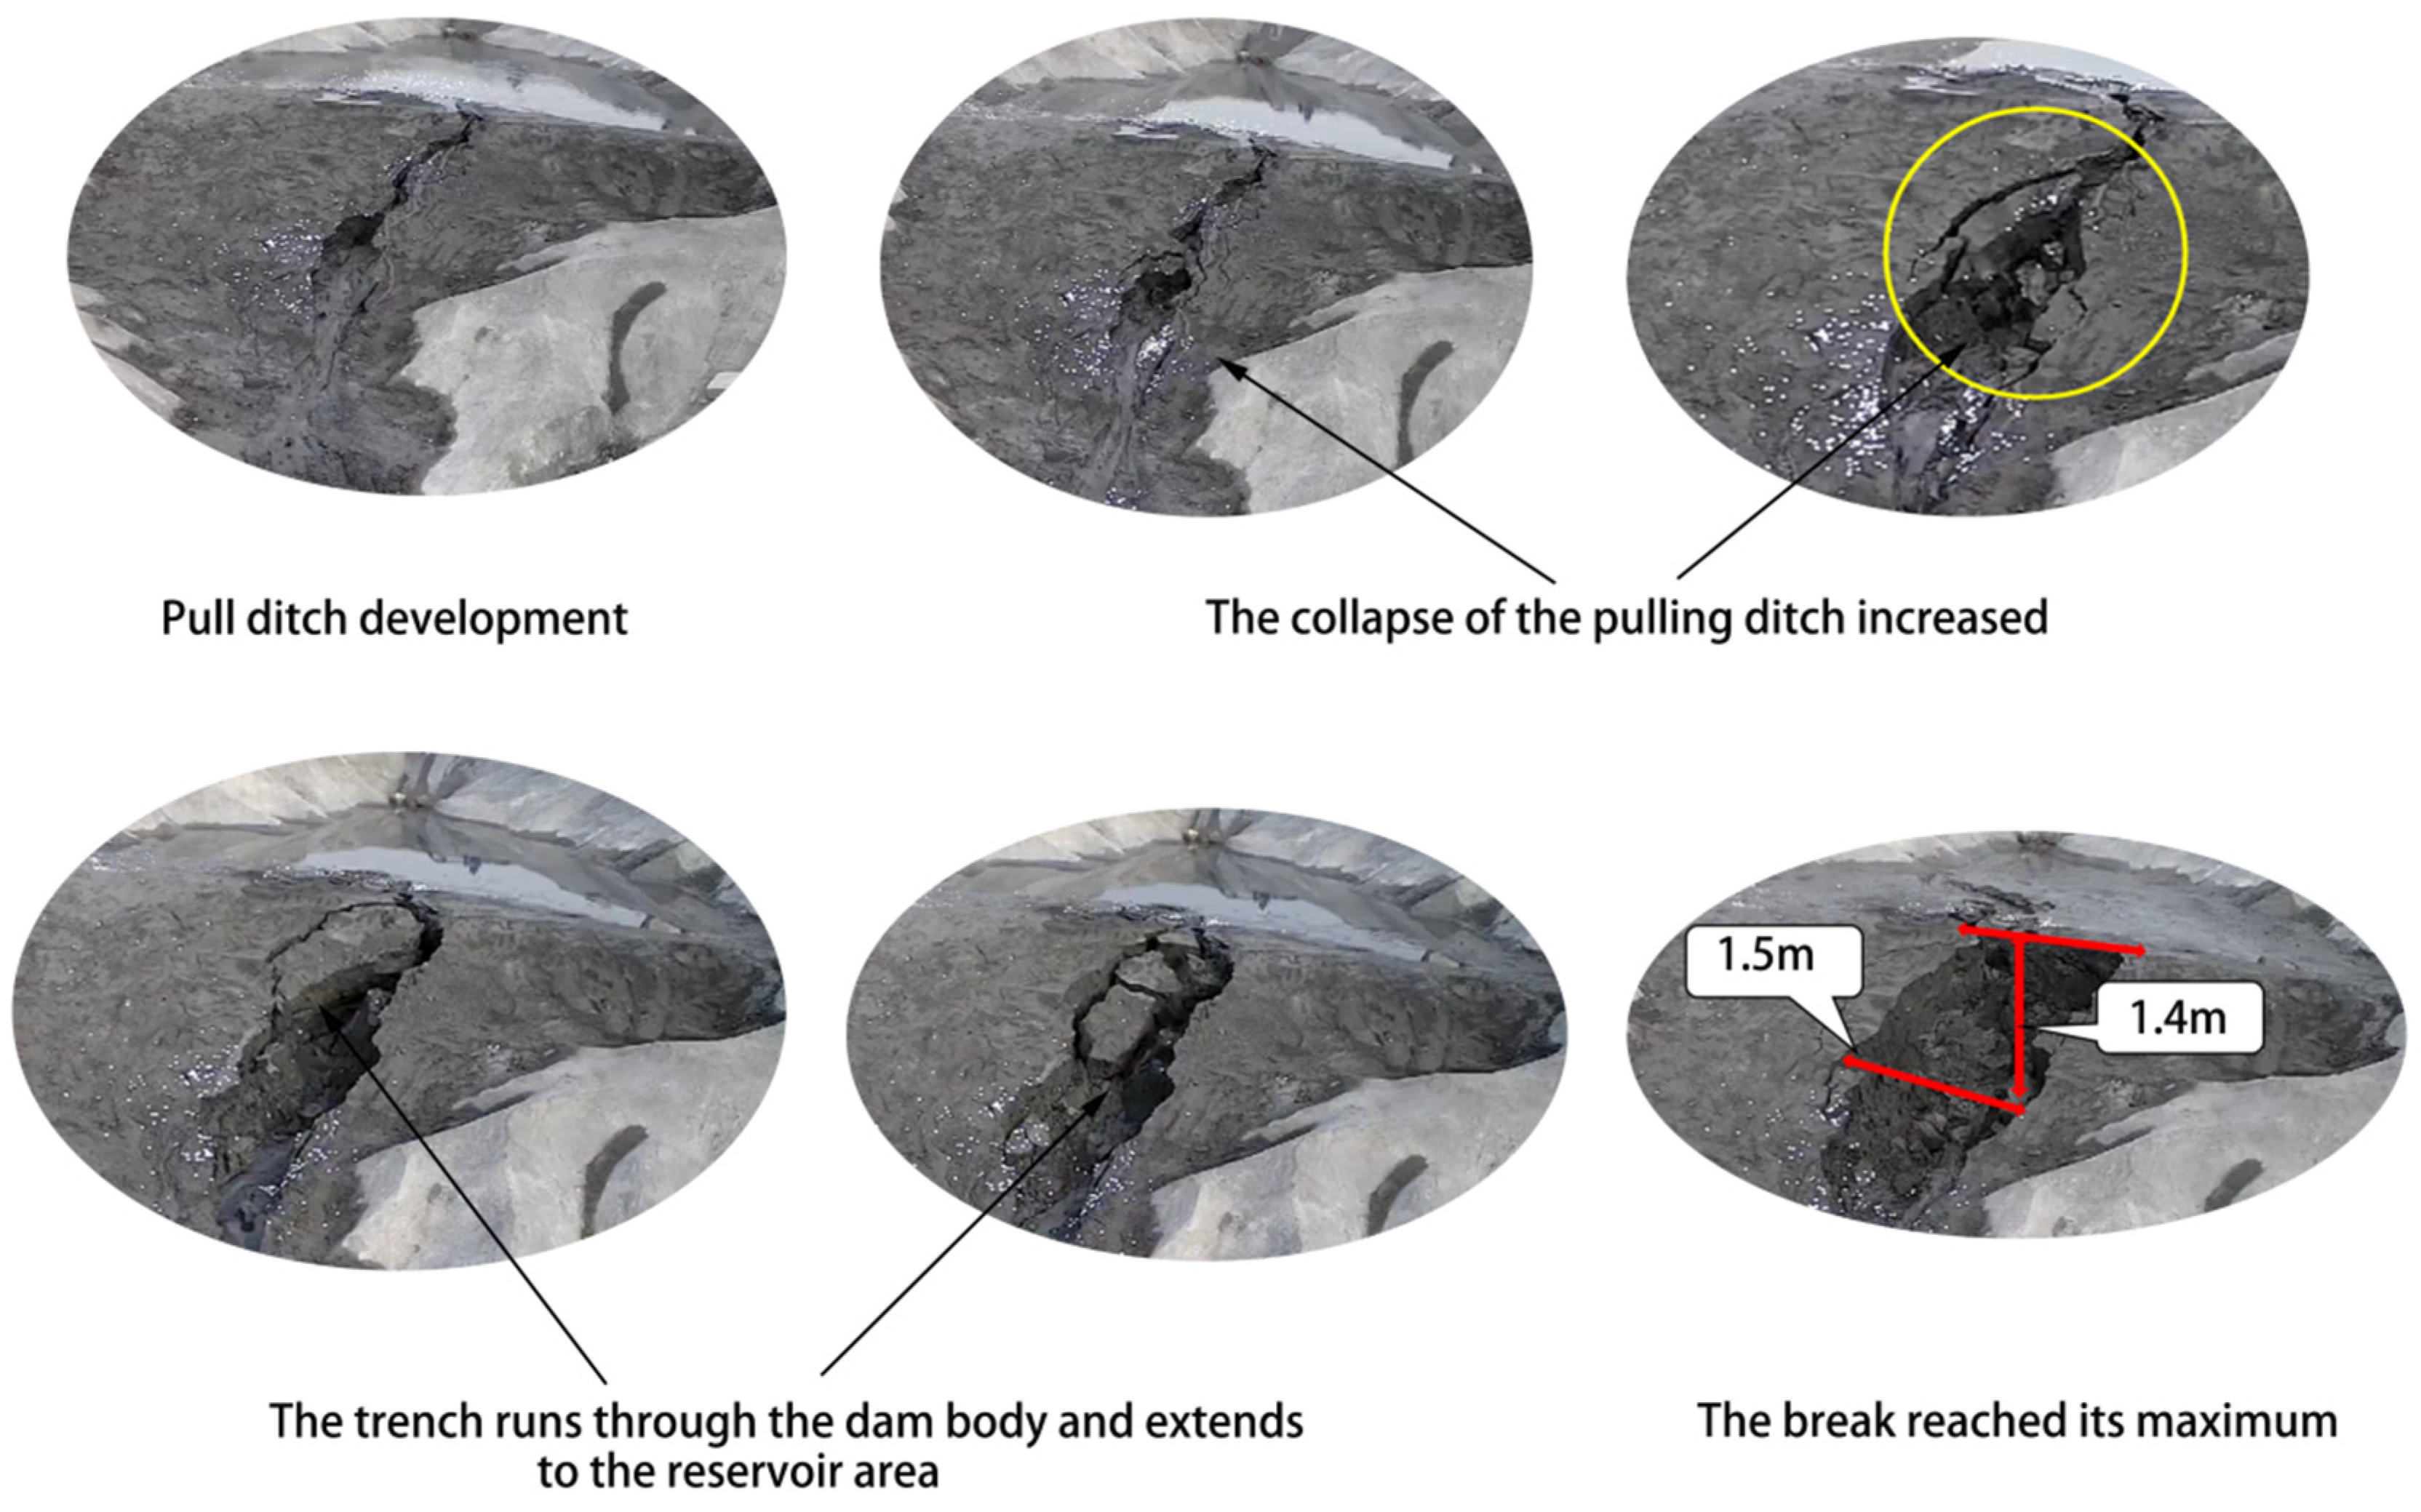
At 10 min and 30 s, the horizontal development of the collapse of the trench wall mentioned above accelerated, and the area of the collapse area continued to increase. At 12 min 00 s, both sides of the trench wall collapsed from transverse to longitudinal, forming a horn and constantly collapsing the upstream development.
At 16 min and 00 s, the depth of water flow increased continuously, the collapse range of sand body on both sides of the horn mouth became larger, the collapse began to expand near the dam top, and the gully in the reservoir area increased accordingly. At 16 min and 53 s, the horn broke through the dam top and extended to the reservoir area, the dam slope gully continued to deepen, the lateral collapse of the gully wall increased, and the whole dam slope formed a large gully.
At 27 min and 36 s, the dam body collapse development process ended, lasting 20 min and 10 s (corresponding to 4.1 h of the prototype), the maximum rupture was about 1.5 m (prototype 225 m), and the depth was about 1.4 m (prototype 210 m). The length of the reservoir trench was about 2.8 m (prototype 420 m), and the widest point was 0.56 m (prototype 84 m), as shown in Figure 16.
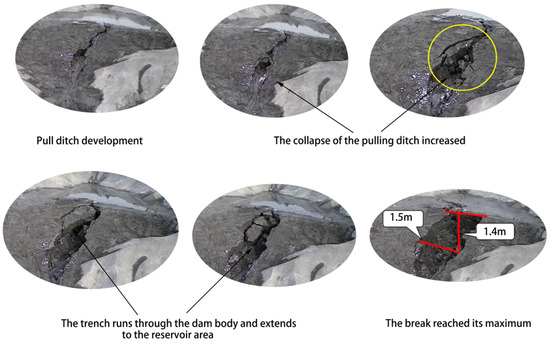
Figure 16.
Development of the dam furrow.
5.3. Downstream Evolution Process of Water-Sand Flow
- (1)
- The affected process of Shangdi Village
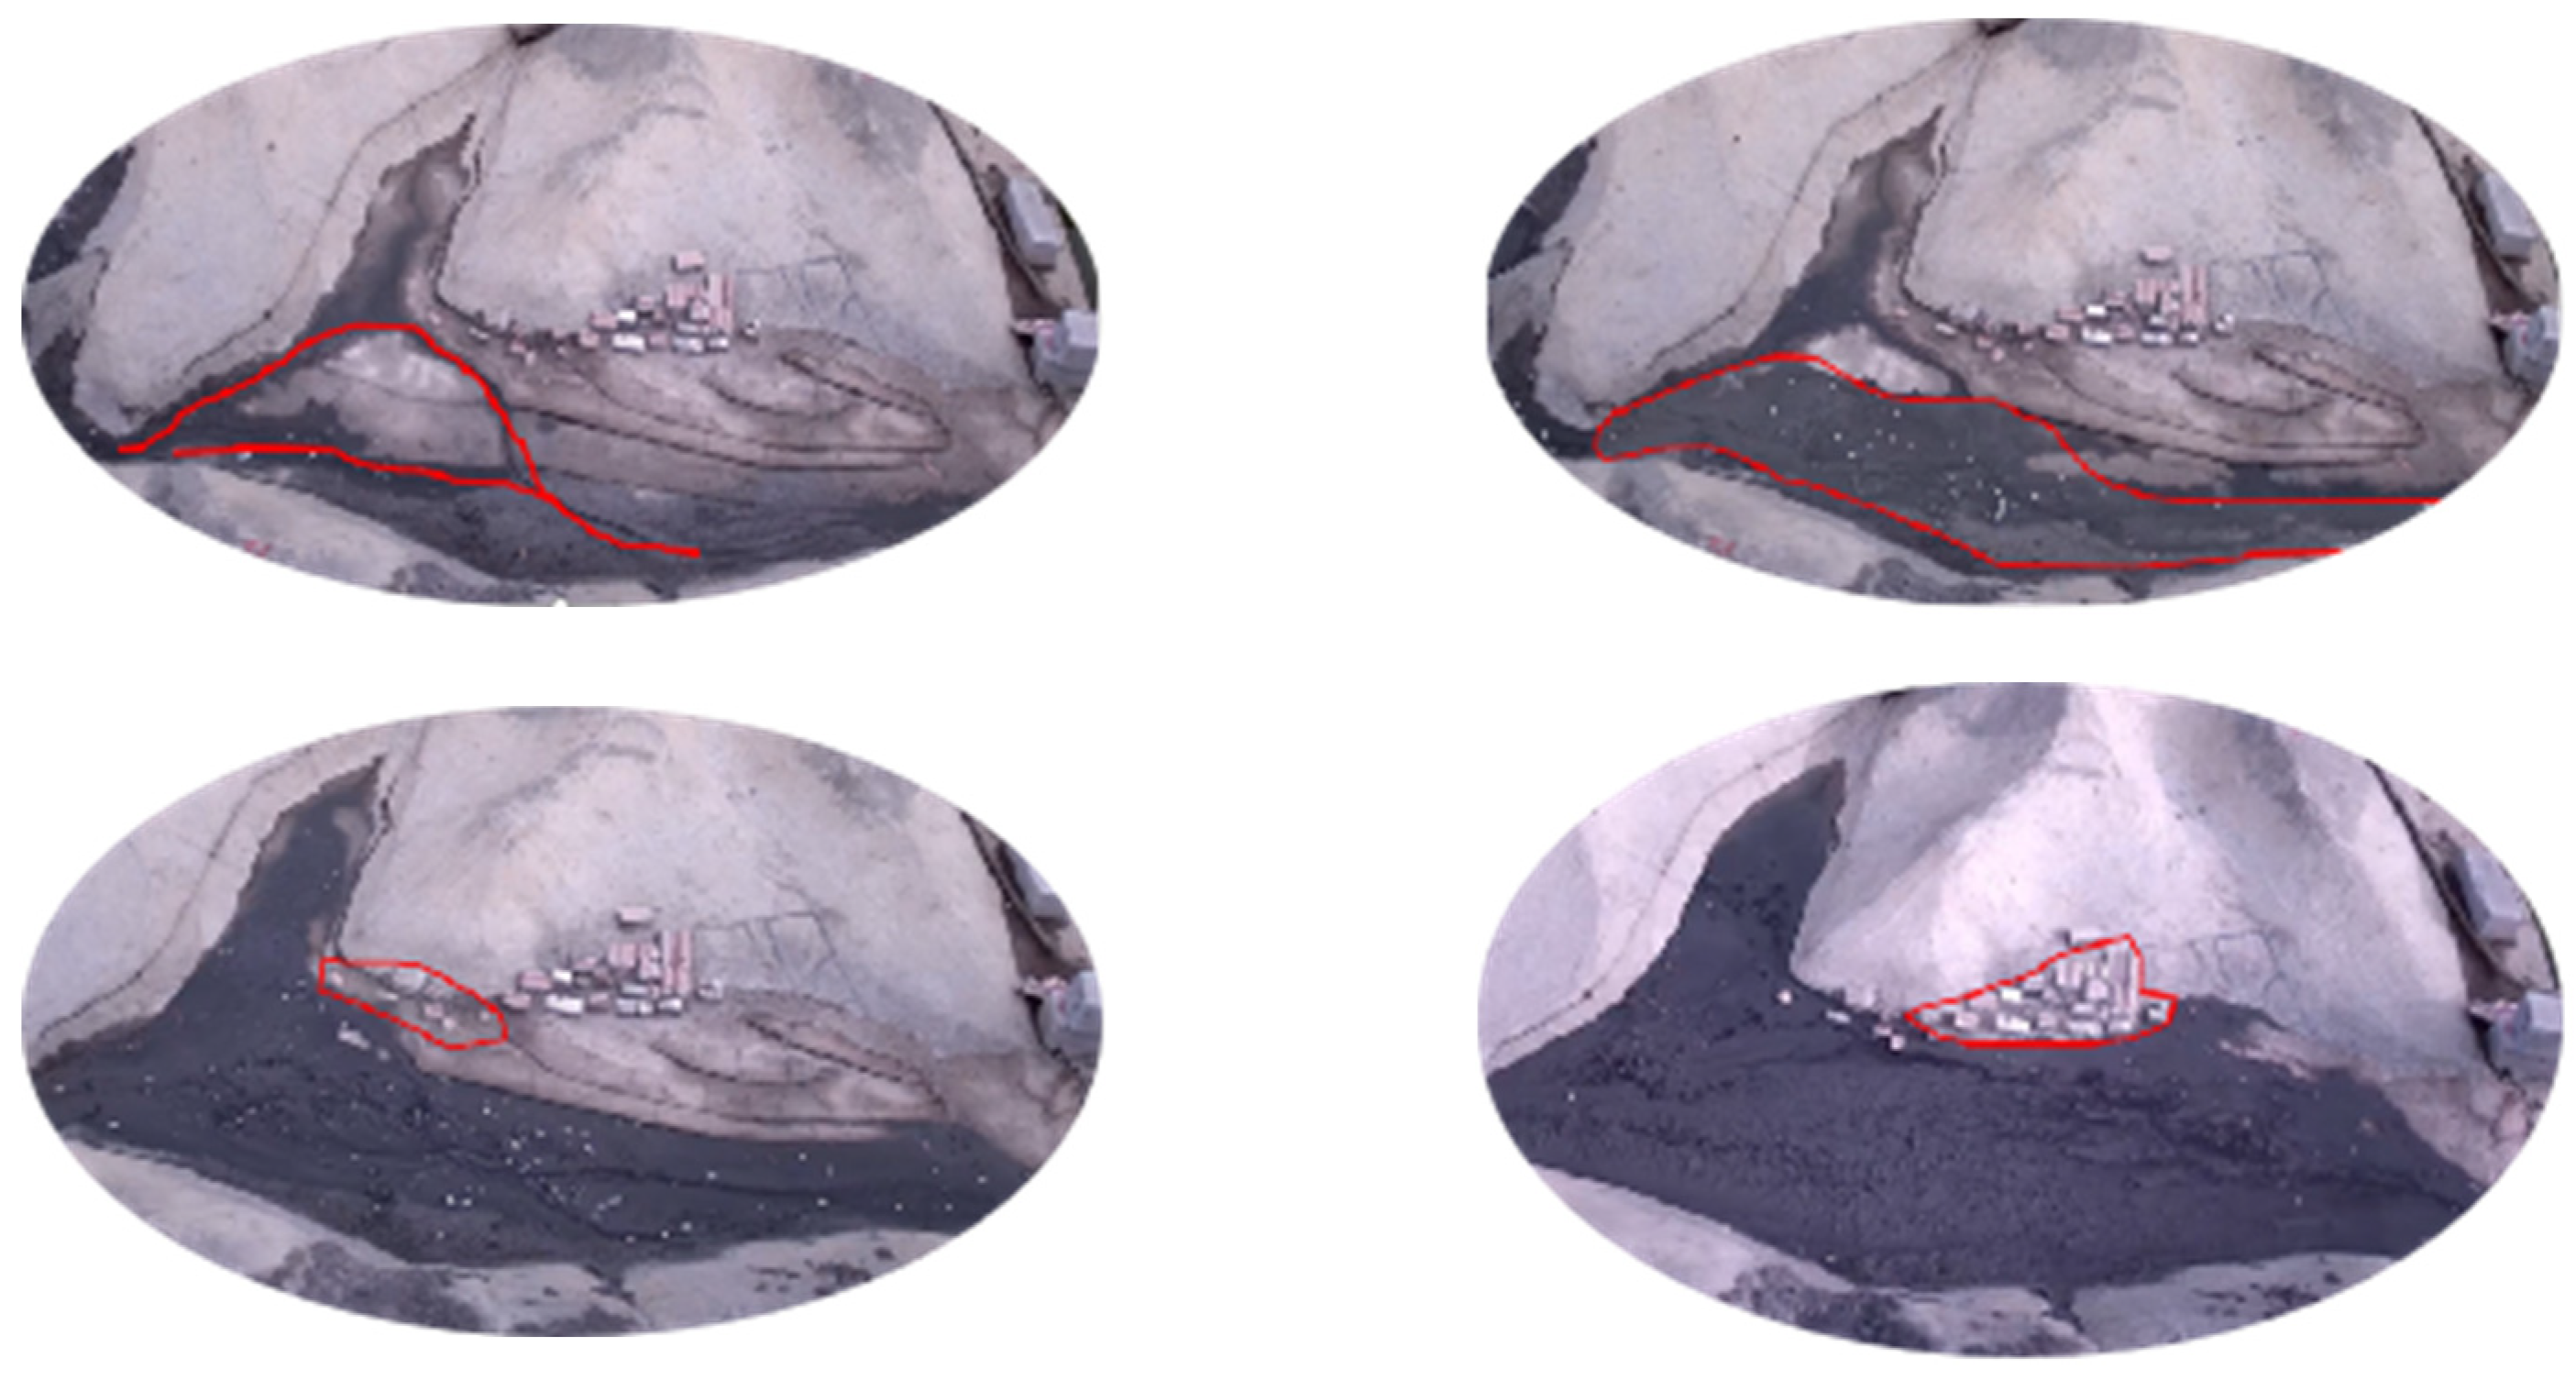
The rupture occurred between 7 min and 26 s and 9 min and 15 s, with no impact on Shangdi Village. The water flow was minimal and followed the river’s course during this period. Subsequently, at 9 min and 15 s, the water level gradually increased, overflowing the channel and reaching the building boundary. At precisely 9 min and 32 s, flooding began in houses located on the left bank in line with the direction of water flow as water levels continued to rise.
At 9 min and 43 s, water inundated houses on the right bank in the downstream direction, with a continuous rise in water level. At 12 min and 39 s, mud and sand engulfed the entire upper residential area, gradually deepening sedimentation.
In 19 min and 10 s, the upper residential areas were completely inundated, while in 31 min and 11 s, the dam break had ceased to have any further impact on the flood’s extent or depth. As shown in Figure 17.
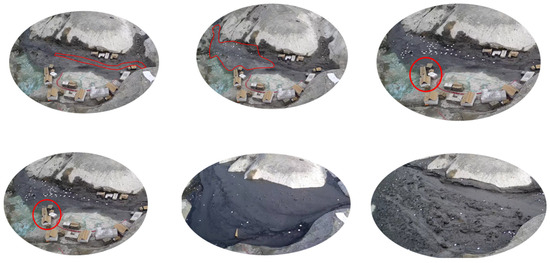
Figure 17.
Evolution of water and sand flow in the Shangdi village dam break.
- (2)
- The affected process of Shizhou Village
After the dam break test commenced, at 10 min and 00 s, water infiltrated into the village of Shizhou. The water flowed through the natural river and low-lying areas within the residential zone without causing any damage to houses. At 10 min and 31 s, several houses on the right bank were gradually submerged by water.
At 11 min and 45 s, several houses below the 450 m elevation of the left bank in the direction of the water flow began to be affected by the water flow. At 19 min and 46 s, the flood area of the water sand flow rose and flooded, and the elevation was close to 457 m; most houses were affected.
At 11 min and 45 s, the water flow began to affect several houses located below the left bank’s elevation of 450 m in the direction of its current. At 19 min and 46 s, as the flood area of the water sand flow rose and approached an elevation close to 457 m, most houses were inundated. As shown in Figure 18.
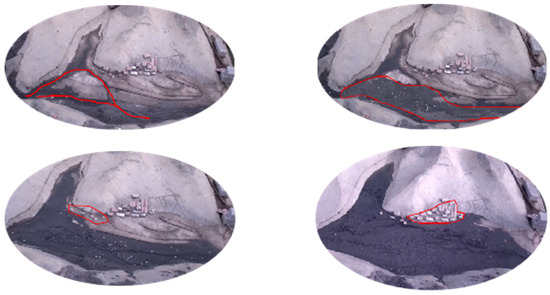
Figure 18.
Evolution of water and sand flow in the Shizhou Village dam break.
5.4. Post-Collapse Inundation Area
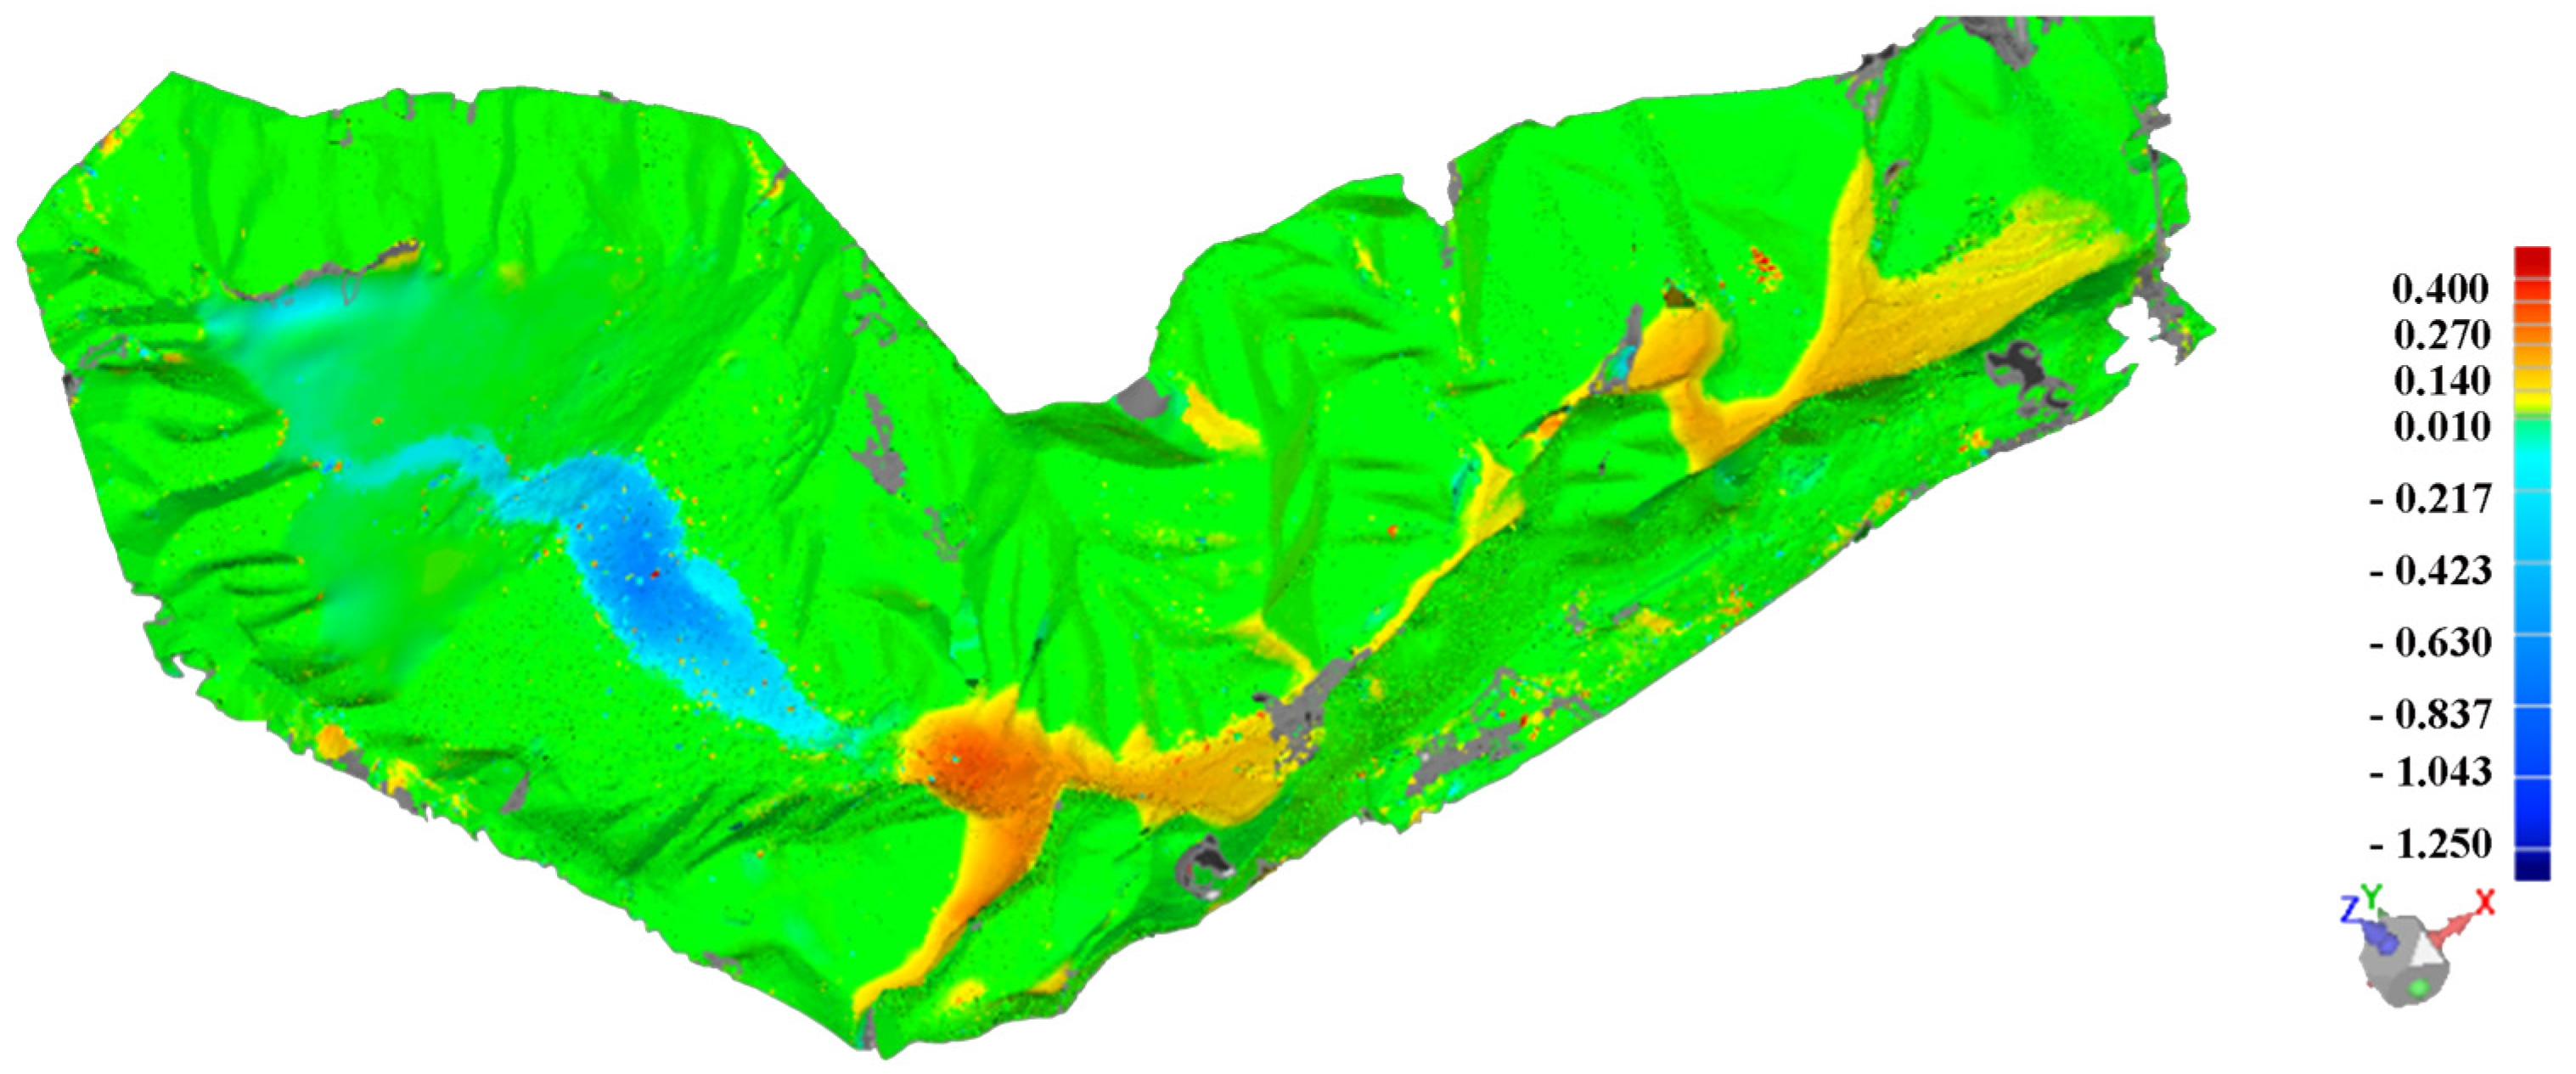
The dam break model exhibited a significant drop and possessed a large potential energy. Following the rupture of the dam, water stored in the reservoir was released rapidly, carrying with it a substantial amount of tailings. The flooded area of tailings discharged under the dam break is shown in Figure 19. The total plane area of the silting area is about 24.8 m2, equivalent to 0.558 km2 in the prototype, and the total collapse volume of tailing sand was 3.85 m3, about 1300 × 104 m3 in the prototype, accounting for 14% of the total storage capacity. The sedimentation at the base of the dam accounted for 36% of the total drainage volume, followed by the Shizhou residential area, river area, and Shangdi village. Additionally, approximately 9.1% of the total drainage volume flowed into the lower reaches of Shizhou Village.
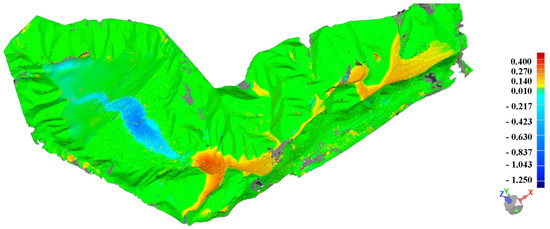
Figure 19.
Measurement map of inundation range.
5.5. Water Level Process Line
Prior to the dam’s breach, downstream of the structure consisted solely of natural river flow characterized by low water volume and slow velocity with no accumulation in other areas. It can be observed from the dam break test that, following the breach and subsequent outflow of water stored in the reservoir, initial discharge through the breach was limited, while flow velocity of the dam break flood through the river channel gradually increased. At this stage, overflow of the water level into the river channel began as flow velocity remained relatively low. With the increase in dam break water volume and sediment thickness along downstream flow, there was a resultant rise in water levels. The sedimentation process of tailings was as follows: During the initial stage, due to the top-to-bottom water flow in the reservoir, the eroded tailings were fully entrained by the water flow and continuously discharged downstream as a debris flow resulting from dam failure. In the later stage of the downstream flow process, water and sand were continuously separated, while tailings were deposited along the way, resulting in an increase in riverbed height and ultimately leading to a continuous rise in water level until dam failure occurred.
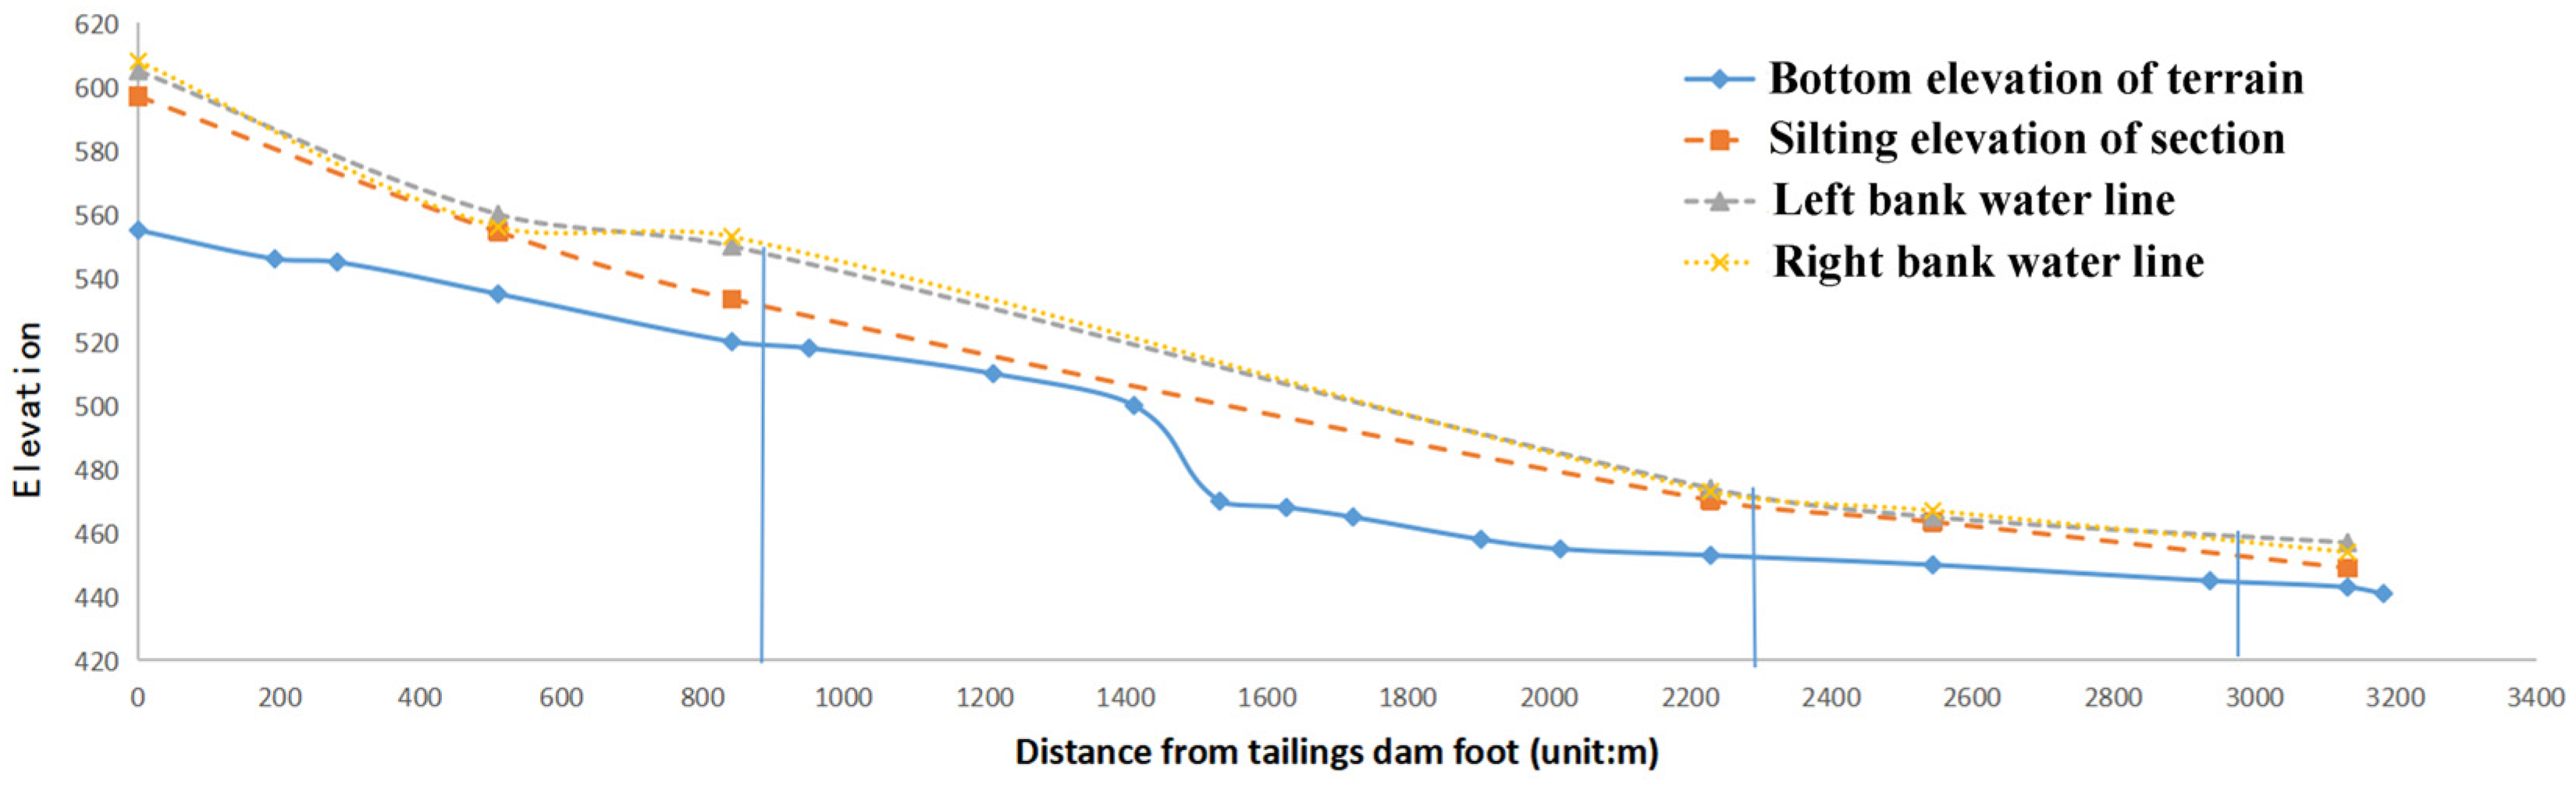
The variation in topography, deposition of tailing silt, and flow potential energy resulted in dissimilar highest water levels on the left and right banks of each section. Figure 20 shows the profile of the water line. Through analysis of the water level elevation, it was evident that the entire Shangdi residential area was affected by the flow of water. The maximum elevation of the water level in the State Residential Area reached 461 m, and houses situated above this altitude remained unaffected by any potential dam break flood.
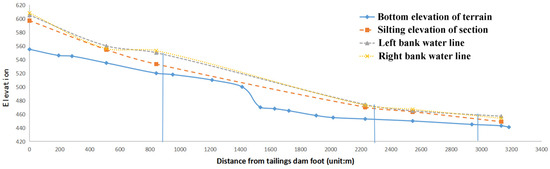
Figure 20.
Profile of the water level.
5.6. Dam Break Flow Field
The real-time measurement system for surface flow fields was utilized to analyze the dam break flow field. The system comprised four key components: video acquisition terminal, communication component, client, and system software. By leveraging industrial Ethernet technology, the system enables real-time measurement of a wide range of flow fields. The primary objective of utilizing this system was to analyze the surface velocity and downstream evolution of dam-broken debris flow. During experimentation, white tracer particles were initially dispersed into the water storage area of the reservoir, followed by capturing the movement state of these particles through an acquisition terminal. Subsequently, the software integrated within this system calculated and analyzed the surface flow field of the dam-broken debris flow. The outdoor test model was equipped with an acquisition terminal consisting of four groups supported by movable telescopic supports, which ensured complete coverage of the entire test model.
From the whole process of the dam break, the evolution of the dam break was a gradual process, and the impact of dam break debris flow on the downstream was relatively mild and had certain regularity and periodicity. The process of water erosion leading to dam body collapse can be summarized as follows: The dam body was eroded by water, causing the formation of a ditch, which pulled on the dam body. The walls of the ditch eventually collapsed, leading to sedimentation at its bottom and further water erosion. This entire process did not occur instantaneously but rather involved significant downrushing and slow fluid surface flow due to narrow river channels, ultimately resulting in an outburst.
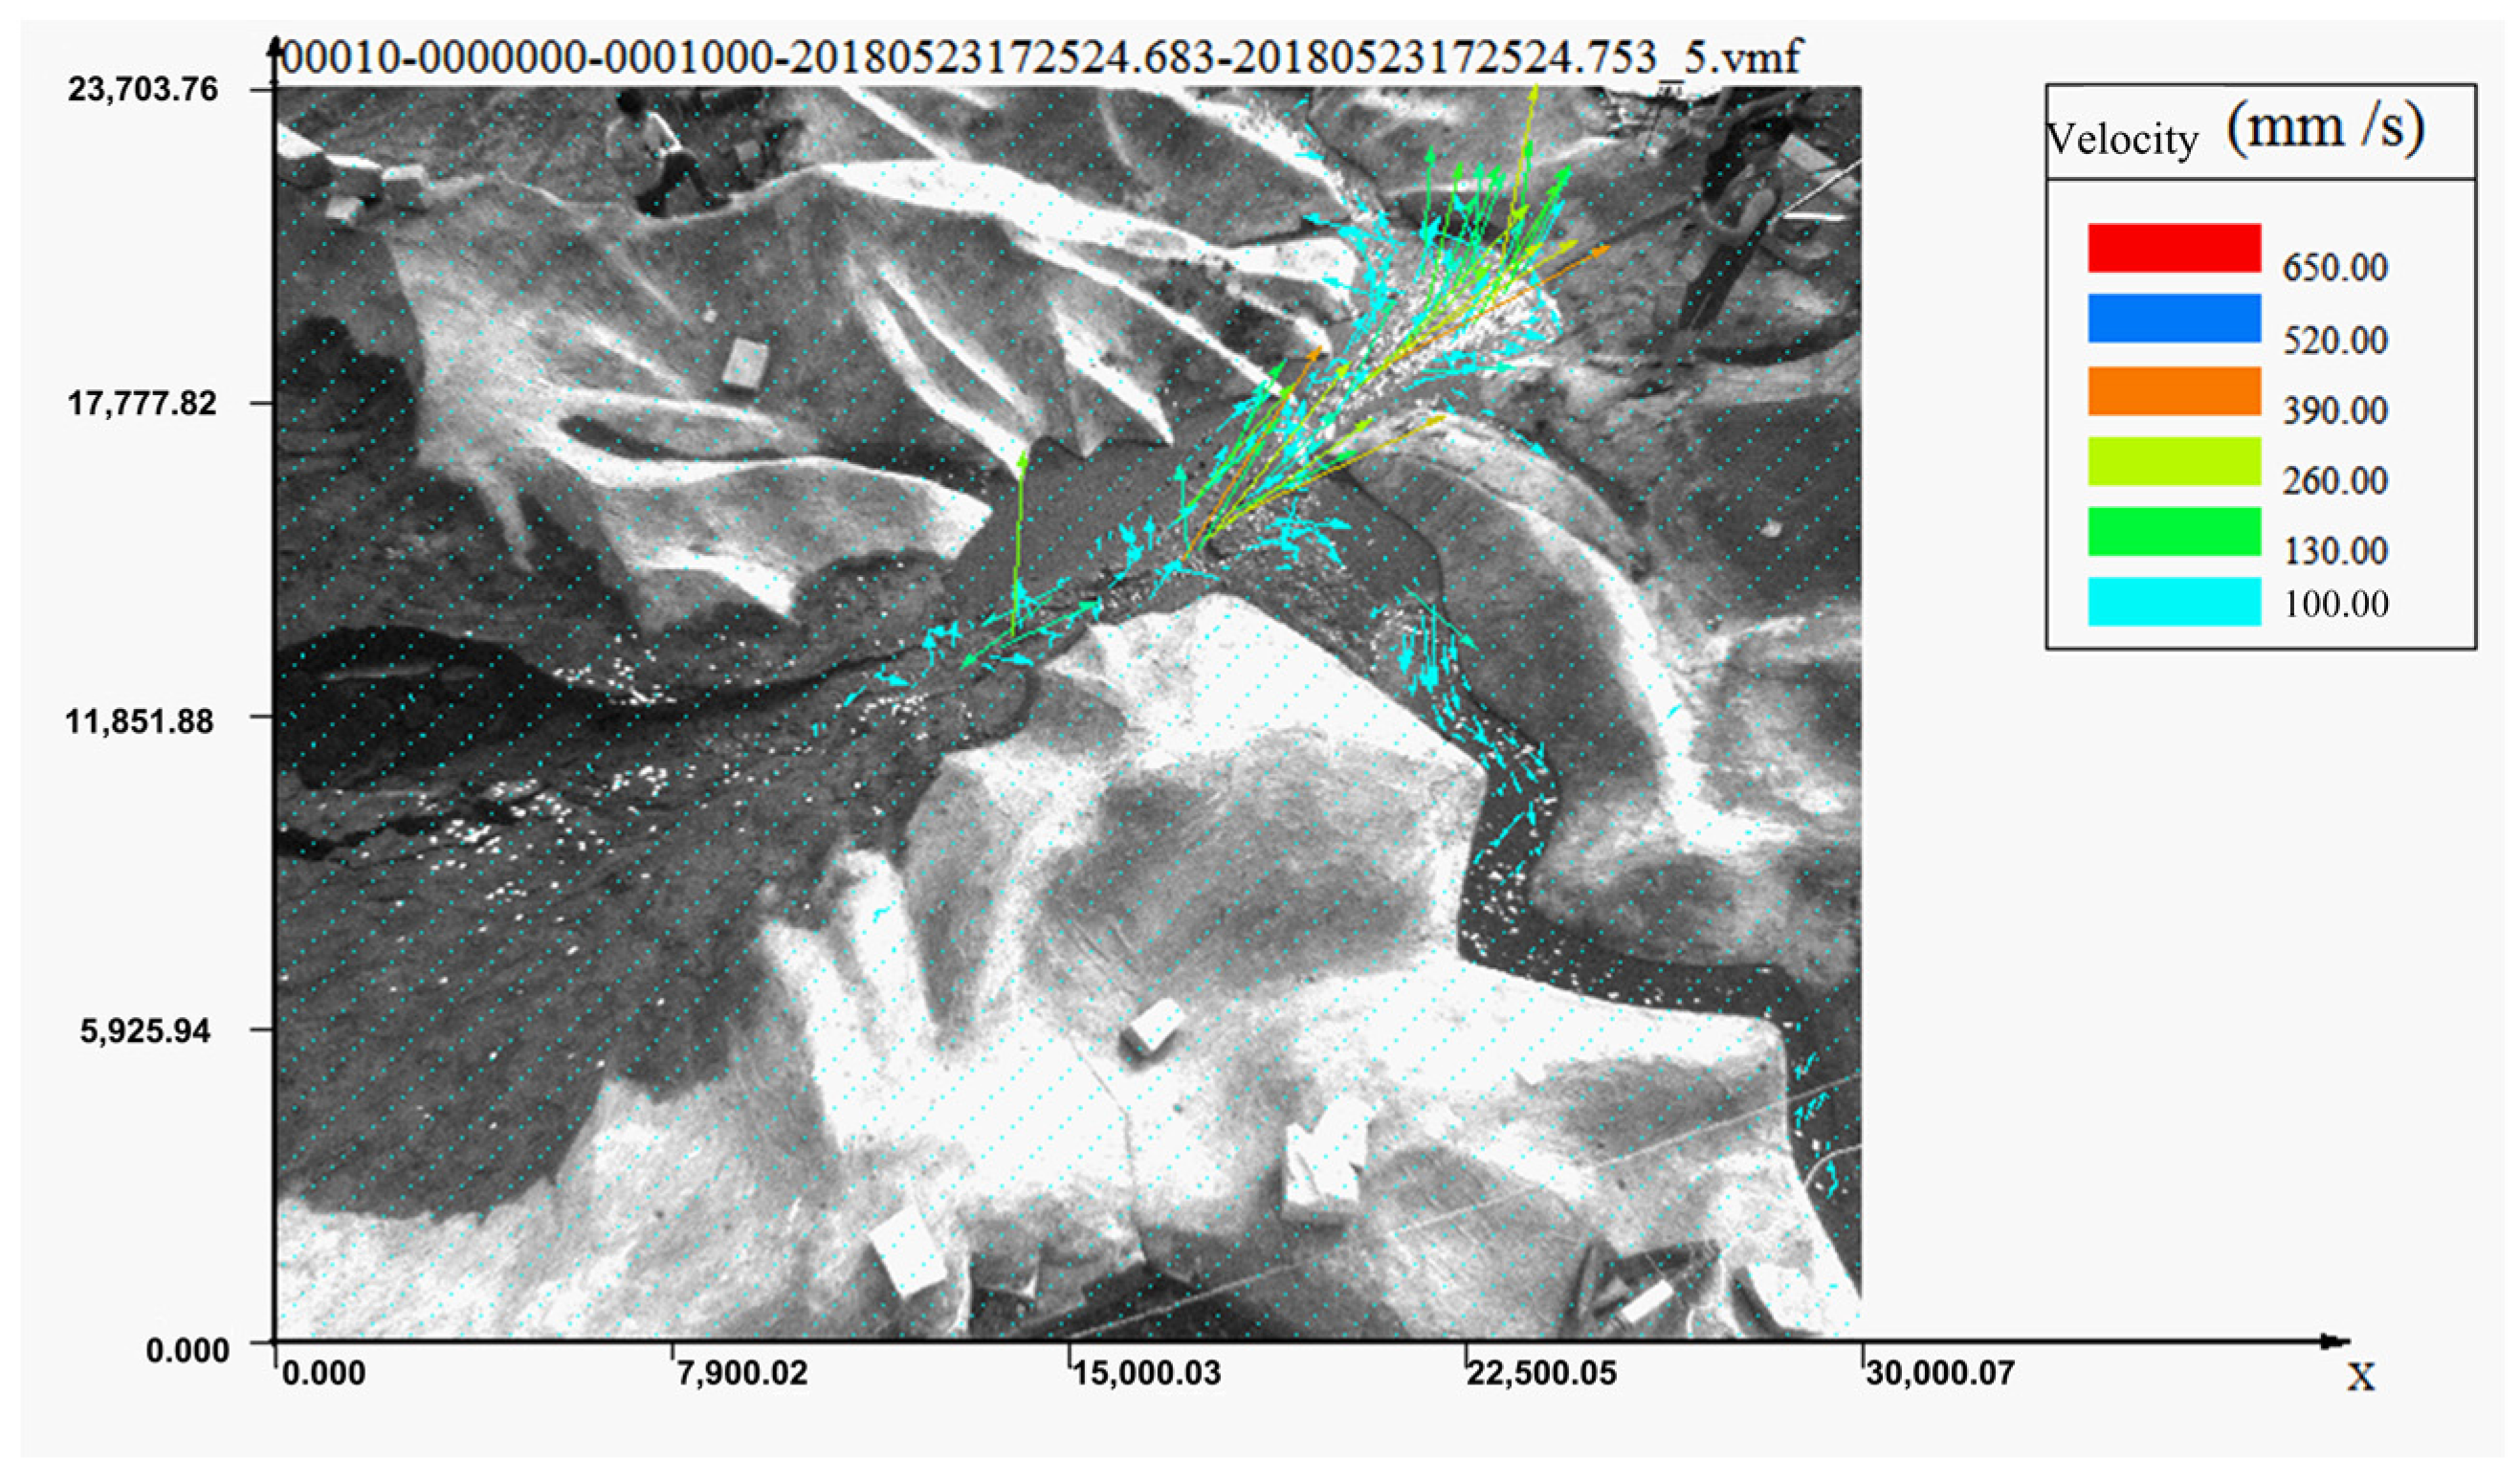
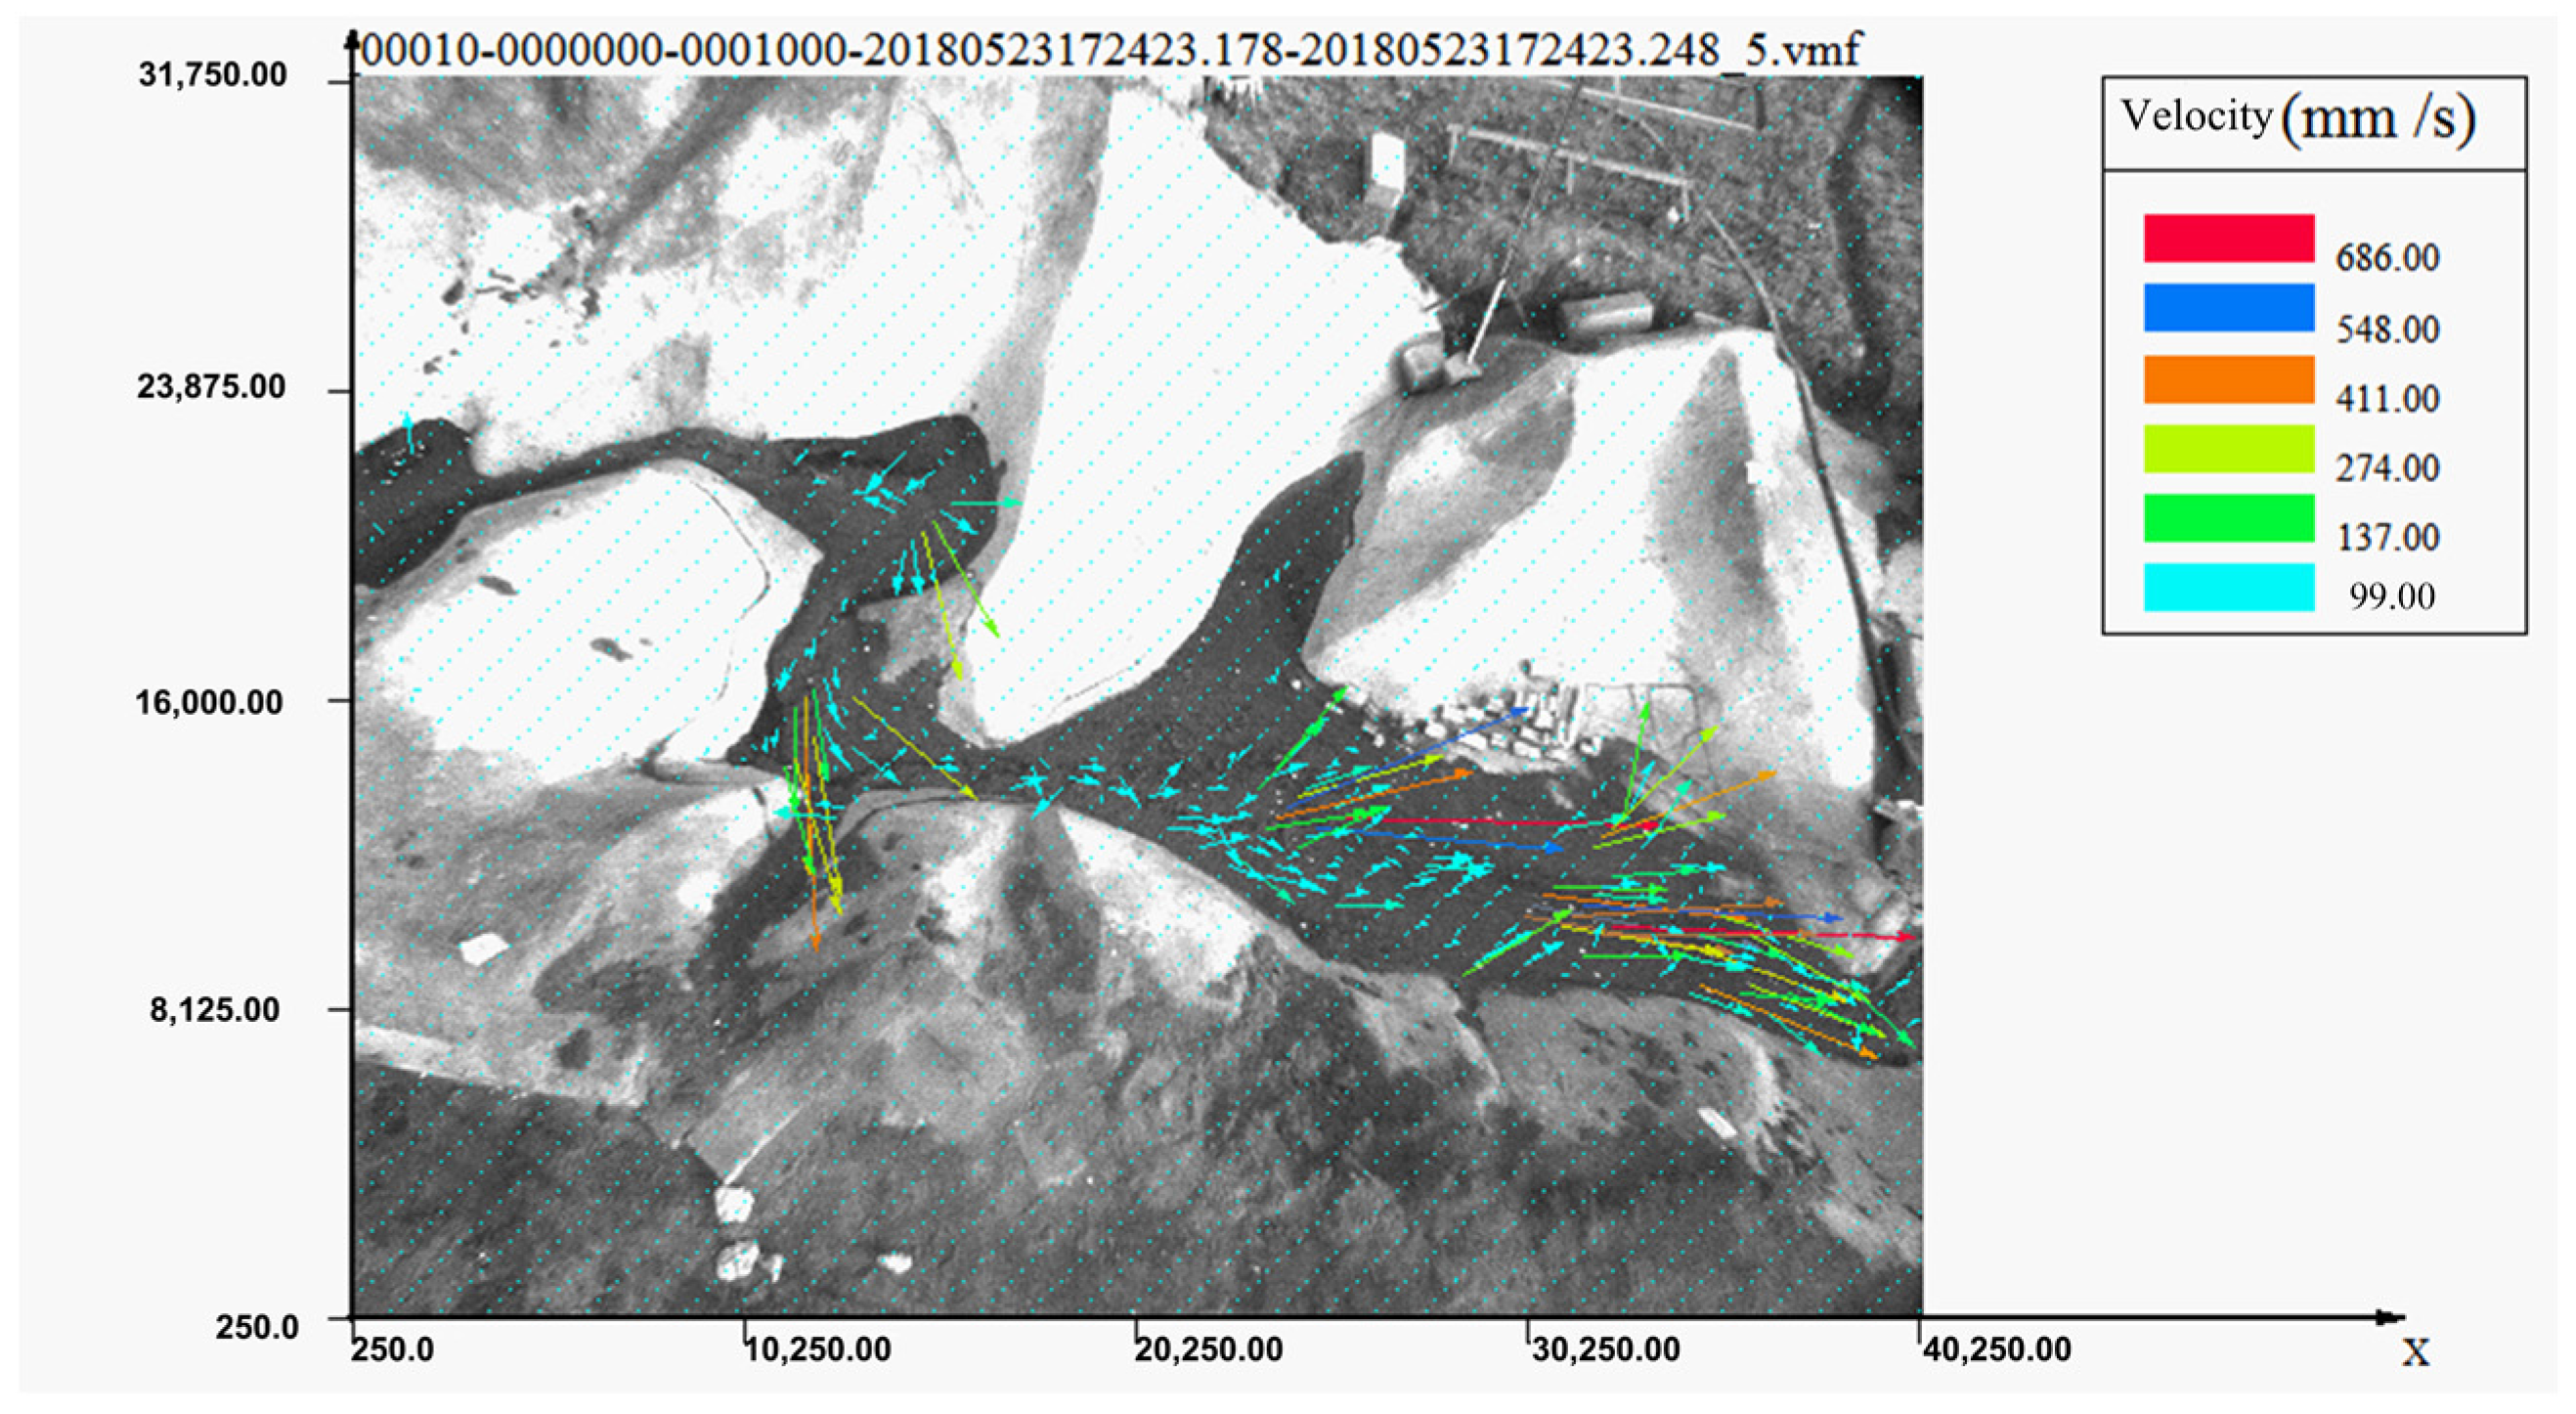
Figure 21 shows the surface flow velocity vector situation during two measurement periods (19 min 10 s and 20 min 14 s) when the residential area above the dam foot was completely submerged. This period was the moment of maximum flow velocity during dam break, and most sand flow velocity in the flow field area ranged from 118 to 390 mm/s. The converted prototype flow rate was 1.45~4.78 m/s.
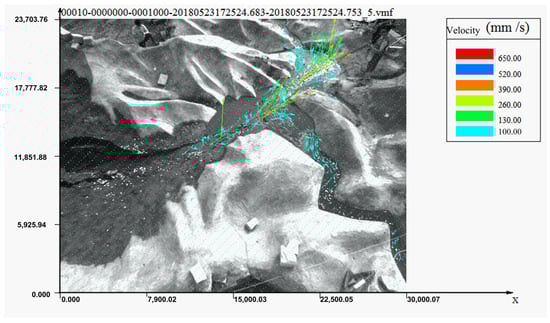
Figure 21.
Vector diagram of surface velocity from the dam foot to Shangdi Village.
According to the flow field vector diagram of the canyon section between Shangdi Village and Shizhou Village, the velocity of dam-broken water and sand flow decrease after passing Shangdi village, with a range of 137–274 mm/s or 1.68–3.36 m/s in prototype scale. The flow velocity of the collapsing body was impeded by the obstruction caused by the flow velocity in the upper reaches of Shangdi village and the dissipation of fluid kinetic energy in the open area of the Shangdi settlement, as shown in Figure 22.
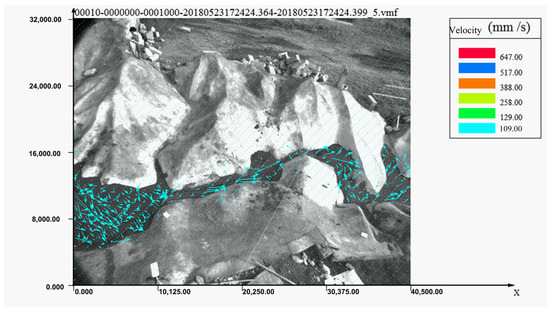
Figure 22.
Vector diagram of the surface flow field in the canyon section.
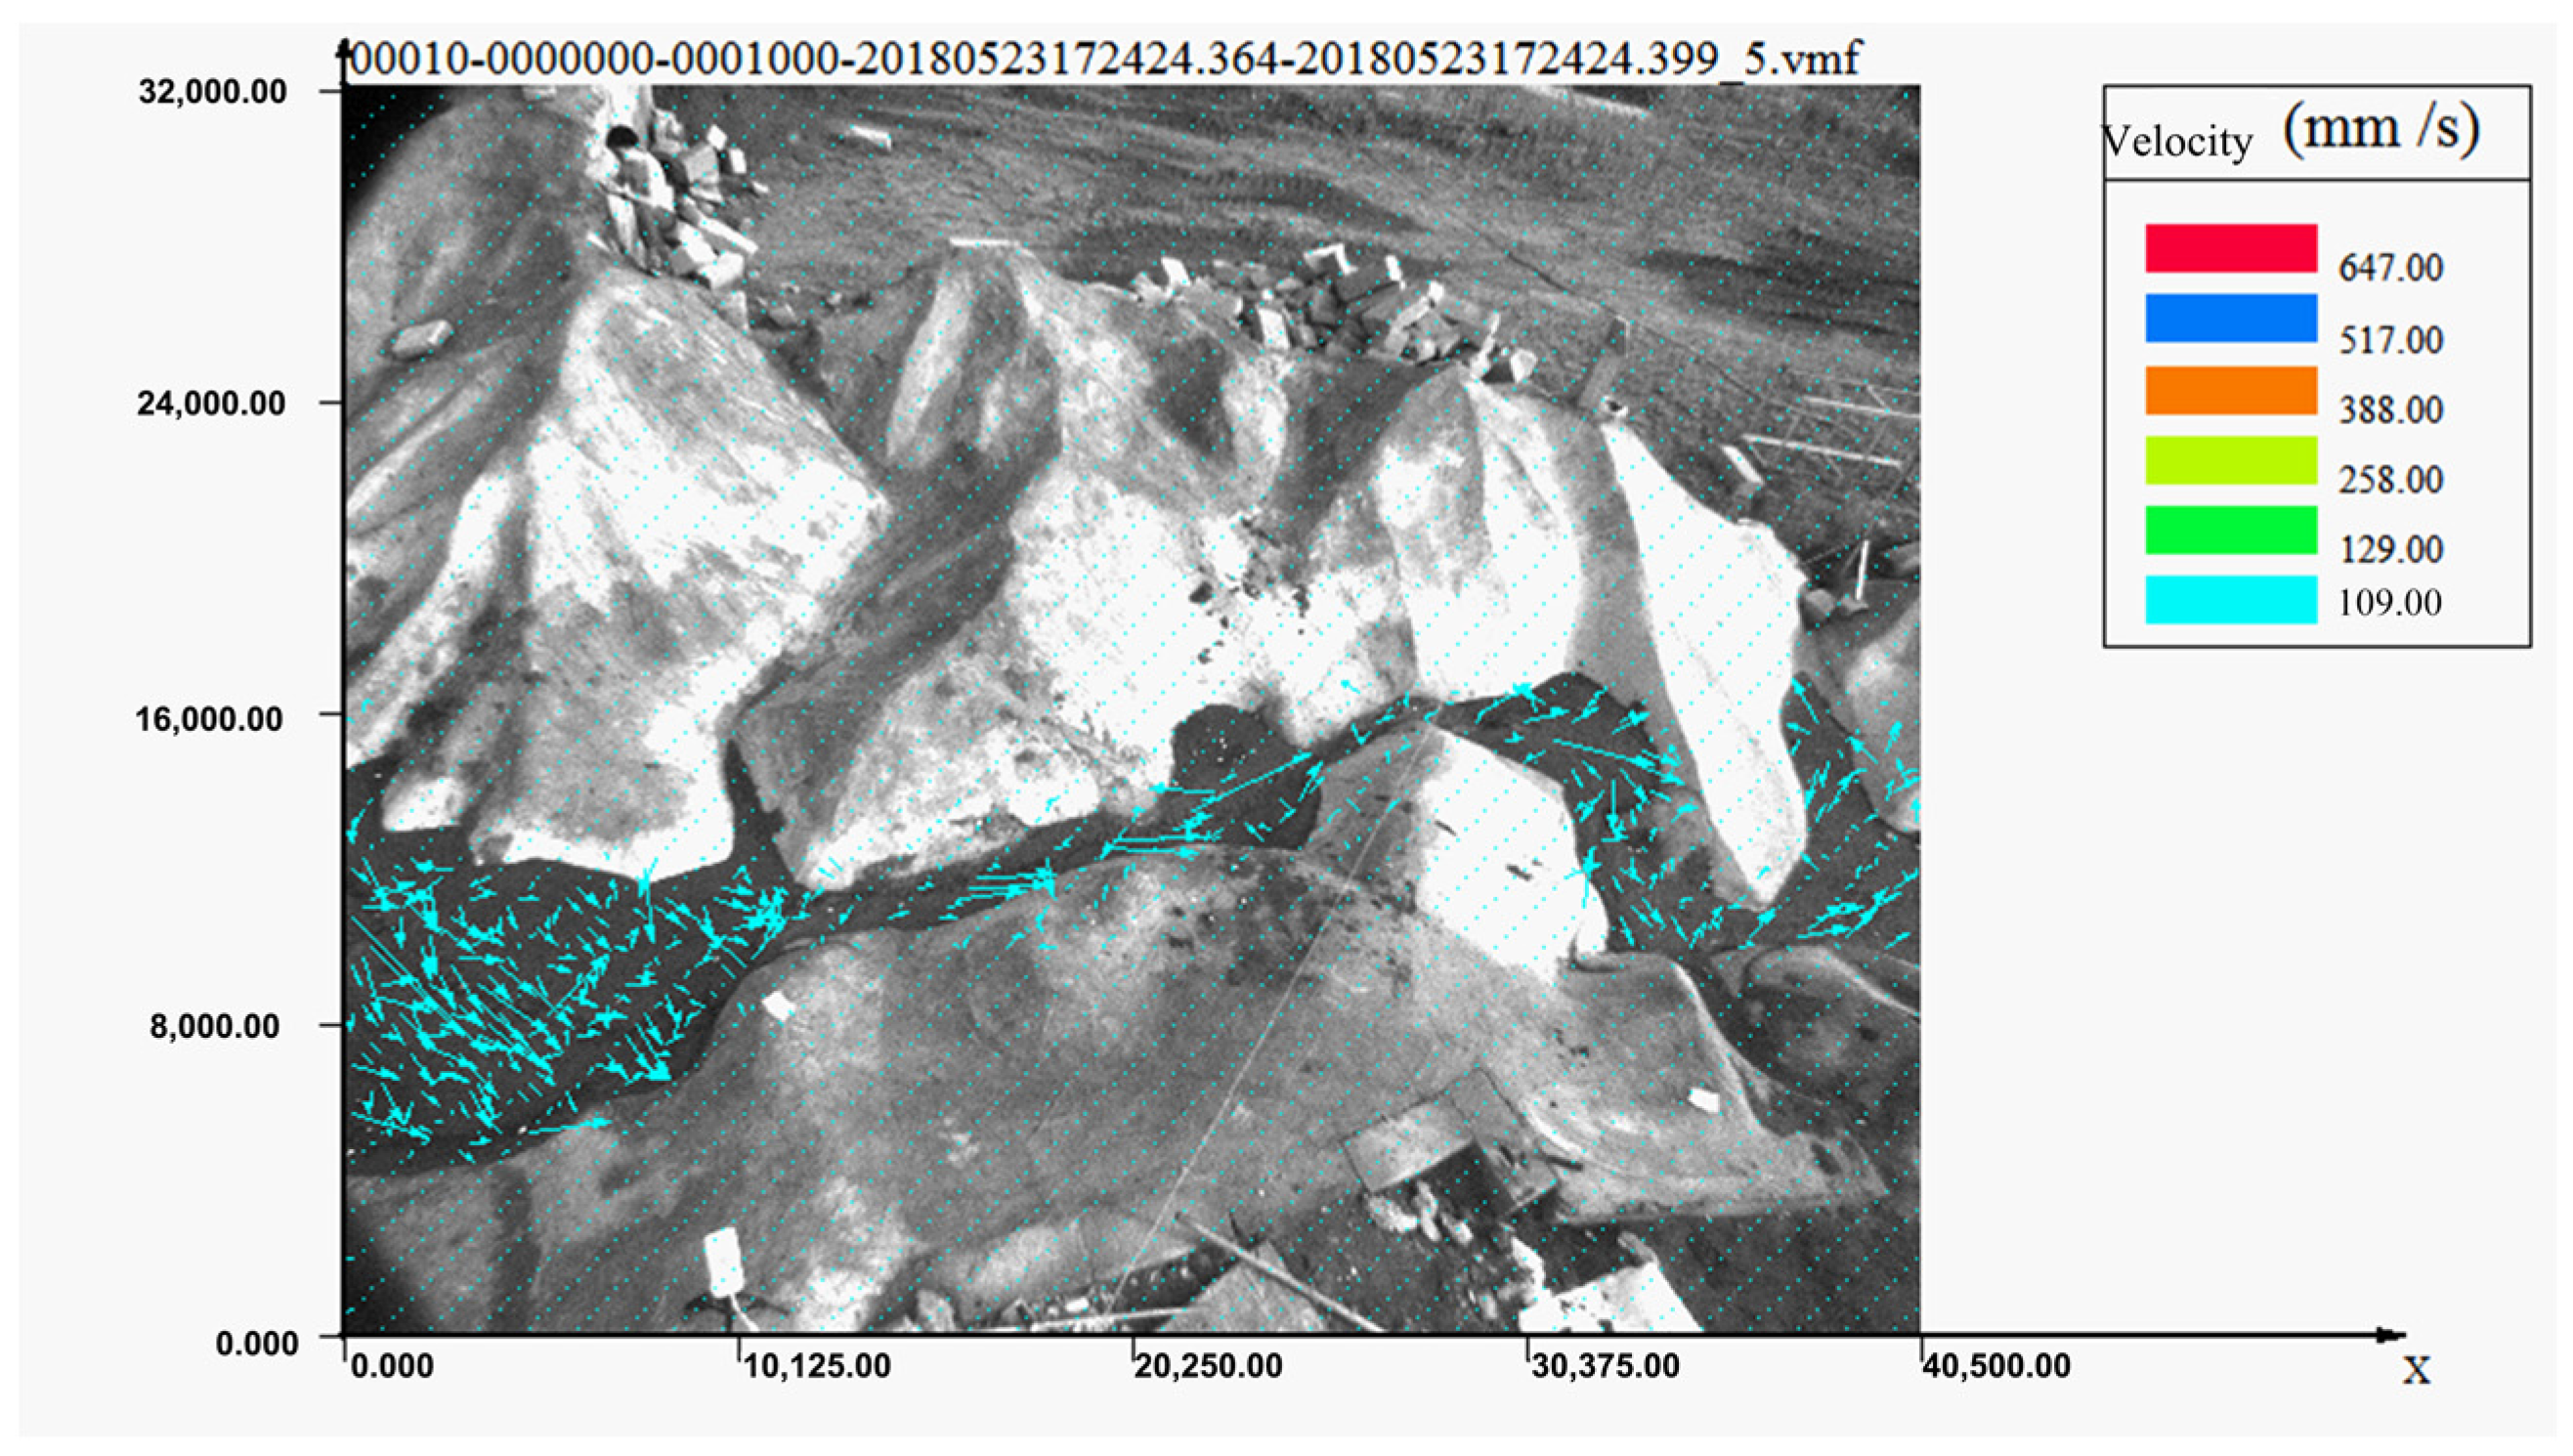
According to the vector diagram of the surface flow field in Shizhou village shown in Figure 23, abnormal data existed in the surface flow field due to vorticity-induced deflection and significant deposition of tailing sand. After eliminating the anomalous data, the majority of flow velocities in this region were below 137 mm/s, equivalent to less than 1.68 m/s in the prototype, which posed no direct threat to residential structures. The impact on Shizhou village was limited to backwater resulting from dam breakage and the gradual sedimentation of tailings.
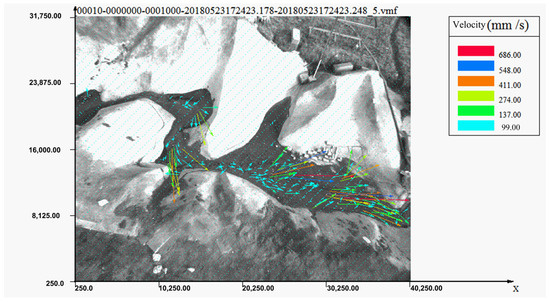
Figure 23.
Vector diagram of the surface flow field in Shizhou village.
6. Discussion
The discussion of the downstream effects of tailing after a dam failure provides a scientific basis for the risk assessment of dam failure. In order to prevent and reduce the accident of tailings pond dam break, various countries regulate the construction and management of tailing ponds through legislation and stipulate that strict evaluation must be carried out in the process of design, construction, operation, and monitoring of tailing ponds to prevent dam break accidents of tailing ponds [18]. At present, there are three main methods to study dam break: theoretical analysis, numerical simulation, and a physical model test. Many scholars have conducted numerical simulation on the safety and environmental evolution of tailings DAMS, indicating that flushing distance, sediment depth, and impact pressure are key factors in the prediction of tailings pond dam break [19,20]. The physical model test is commonly used as an empirical method to predict these three key factors in tailings pond dam rupture studies, which are mutually verified and supplemented by numerical simulation methods. However, different numerical simulation methods use different mathematical models, and their basic theories, calculation formulas, and equations are also different, such as using different numerical calculation methods or schemes (such as the finite element method, finite volume method, conceptual finite difference method, digital elevation model (DEM) method, smoothed particle hydrodynamics, SPH method, shallow wave equation method), and different constitutive models (such as Bingham, HBP, Voellmy, Cross, and Viscous) are used to analyze the complex collapse characteristics of tailing ponds, which also leads to the large differences in dam break conclusions.
RAMMS software uses a two-parameter Voellmy friction model to express the friction movement between flowing debris. Research shows that the Voellmy friction model can simulate the movement trajectory of tailing flow more accurately [21]. The RAMMS software typically needs to refer to well-documented historical events during the calibration of Voellmy models and to determine the best set of fitting parameters that can be used in subsequent analyses. In addition, RAMMS software can also fuse the results of DEM or DSM (digital surface model), modify topographic data, and increase the number of additional parameters, which is convenient for the prediction of tailings flow [22]. However, actual tailings pond dam breaks have not verified these studies. Unlike the slope debris flow, tailings pond dam break has a tall flow channel, a larger volume, a larger flow depth, and it may carry harmful substances. Therefore, it is necessary to carry out the verification application of RAMMS software in tailings pond dam break.
In this study, the physical model test method and RAMMS numerical simulation method were employed to simulate the downstream terrain movement of tailings flow following a dam break at its final height. By comparing and verifying the results of model testing and numerical calculations, we obtained a comprehensive understanding of the evolution process and potential impact range of tailings flow during dam breaks in tailings ponds. The research results of this paper can predict the impact of tailings flow on the downstream after the dam break of the proposed tailings pond and can provide a scientific basis for the risk assessment of similar tailings ponds with dam break risk. According to the research results of this project, the probability of dam failure is lower when the middle line method is used in the construction of similar projects. The method presented in this paper can predict the risk of dam break during the construction of similar tailings pond dams and enable the formulation of special evacuation measures for potentially affected areas to safeguard lives and property.
7. Limitations
Every experimental setup and simulation will have its limitations. Physical models cannot precisely simulate real field conditions, and the study did not consider the meteorological conditions at the time of the dam breach, nor the lifting phenomenon of the tailings. However, the physical model test for the wake pond followed the similarity criterion and was made into a reduced model for experimental study. The model reproduces natural forms similar to the prototype, makes observations, obtains data, and then extends this data to the prototype based on specific similarity criteria to reveal the actual phenomena and properties of the prototype. We refer to the rules that must be followed to maintain similarity between the physical phenomena of the model and prototype as similarity criteria. This model satisfies geometric similarity, flow similarity, and dynamic similarity. As for the models that study the impact of dam break tailings on downstream flooding, they are mainly siltation models. The lifting phenomenon of the wake can be neglected, and the similarity criterion for wake initiation can be relaxed. The key is to satisfy three conditions: similar settling of the tailings, similar sand carrying by the flow, and similar scouring and deposition deformation.
8. Conclusions
- (1)
- The particle size distribution of model sand should be moderate, and the composition of particle gradation significantly affects the post-failure deformation behavior of the dam body. When the sand body contains more coarse particles, its porosity increases, which may lead to a pipe surge phenomenon. When there are too many small particles, the cohesion increases, and the collapse width is relatively small due to viscosity, making it easy to produce compaction phenomena. The level of the wetting line determines the saturation degree of tailings in the reservoir and has a significant impact on outburst form during dam break. Therefore, controlling the head of the wetting line during testing is crucial to ensure that it matches that of the prototype.
- (2)
- The breach was situated at the mid-point of the dam crest, and the volume of water that infiltrated into the reservoir during its occurrence was 0.313 m3. Based on flow ratio analysis, this amount equated to 1.78 times that of a 1000-year flood event and 1.19 times that of a PMF flood. The entire process of dam failure, which lasted for 27 min and 36 s, took approximately 4.1 h in the prototype. The plane area of the silting zone measured 24.8 m2, equivalent to about 0.558 km2 in the prototype, while the volume of tailings collapse was estimated at 3.848 m3 (approximately 1.3 × 10⁷ m3 in the prototype), accounting for roughly 14% of total reservoir capacity. The rupture attained a maximum extent of approximately 1.5 m and a depth of roughly 1.4 m, and the prototype measured 225 m in width by 210 m in depth.
- (3)
- The time taken for the dam-broken water to reach Shangdi village was 1 min and 49 s, which was reduced from the prototype’s 22 min. The inundation of houses in Shangdi village by the dam break sand flow occurred within 2 min and 6 s, compared to the prototype’s 26 min. Since then, the sand flow resulting from the dam break continued to intensify, impacting Shangdi village for a duration of 5 min and 13 s (equivalent to 1.1 h in prototype time). It took approximately 3 min for the water to reach Zhou village (31 min in prototype time), after which it flowed only along the river and low-lying areas with a gradual rise in water level. After 12 min and 20 s, the houses in Shizhou Village with an elevation below 457 m were subject to backwater impact. At the time of 15 min and 34 s, equivalent to a prototype duration of 3.2 h, houses in Shizhou Village with an elevation lower than 461 m were affected by backwater.
- (4)
- From the analysis of water level elevation, it is evident that both Shangdi village and houses below 461 m in Shizhou Village are affected by flooding and sand flow. From the analysis of the surface flow field, it can be observed that the village located upstream of the dam exhibited the highest flow velocity. The terrain surrounding the dam has effectively obstructed and dissipated multiple instances of sand flow from a potential dam break, resulting in significant energy release and reduction in debris flow velocity. When the debris flow resulting from the dam break passed through the Shizhou village area, a majority of the fluid was diverted towards low-lying farmland downstream of the village. The impact on Shizhou village was limited to backwater effects caused by broken dam flow and the gradual siltation of tailings.
Author Contributions
Methodology, D.L.; resources, B.X.; writing—review and editing, C.L. All authors have read and agreed to the published version of the manuscript.
Funding
This research was funded by the National Natural Science Foundation of China (nos. 42061011 and 41977236), the Jiangxi Province key research and development project (20232BBE50025), the Jiangxi Province Natural Science Foundation project (nos. 20223BBG71W01 and 20202ACBL204016), the Xinjiang Corps science and technology plan project (2020AB003), the Key project of advantageous science and technology innovation team of Jiangxi province in 2017 (“5511” project) (20171BCB19001), the funding program for major disciplines academic and technical leaders of Jiangxi provincial in 2017 (20172BCB22022), and the key science and technology research project in Jiangxi province department of education (GJJ151096).
Institutional Review Board Statement
Not applicable.
Informed Consent Statement
Not applicable.
Data Availability Statement
The datasets used and analyzed during the current study are available from the corresponding author upon reasonable request.
Conflicts of Interest
The authors declare no conflict of interest.
References
- Yekti, M.I.; Adityananta, I.K.E.B.; Pariartha, I.P.G.S. The Tamblang Dam Break Analysis Using HEC-RAS 5.0.7 and PenRis Hazard Classification in Indonesia. Arab. J. Geosci. 2023, 16, 365. [Google Scholar] [CrossRef]
- Chen, M.; Jing, X.; Xie, D.; Li, X.; Zhang, Y.; Liu, X. Prediction Model Investigations of the Reinforced Fine-Grained Tailings Dam Overtopping Failure. Front. Earth Sci. 2023, 10, 1075588. [Google Scholar] [CrossRef]
- Dumergue, L.E.; Abadie, S. Numerical Study of the Wave Impacts Generated in a Wet Dam Break. J. Fluids Struct. 2022, 114, 103716. [Google Scholar] [CrossRef]
- Mattas, C.; Karpouzos, D.; Georgiou, P.; Tsapanos, T. Two-Dimensional Modelling for Dam Break Analysis and Flood Hazard Mapping: A Case Study of Papadia Dam, Northern Greece. Water 2023, 15, 994. [Google Scholar] [CrossRef]
- Aleixo, R.; Ozeren, Y.; Altinakar, M. Tailings Dam-Break Flow Analysis by Means of a Combined PIV-PTV Tool. In Proceedings of the Conference on Fluvial Hydraulics, Lausanne, Switzerland, 3–5 September 2014. [Google Scholar]
- Schaefer, M.; Bugnion, L. Velocity Profile Variations in Granular Flows with Changing Boundary Conditions: Insights from Experiments. Phys. Fluids 2013, 25, 063303. [Google Scholar] [CrossRef]
- Sánchez-Peralta, J.A.; Beltrán-Rodríguez, L.N.; Trujillo-Vela, M.G.; Larrahondo, J.M. Flows of Liquefied Filtered Tailings: Laboratory-Scale Physical and Numerical Modeling. Int. J. Civ. Eng. 2020, 18, 393–404. [Google Scholar] [CrossRef]
- Gao, J.; Fourie, A. Using the Flume Test for Yield Stress Measurement of Thickened Tailings. Miner. Eng. 2015, 81, 116–127. [Google Scholar] [CrossRef]
- Le Nguyen, Q.T.; Nguyen, V.D.; Coorevits, P. Scouring of a Granular Bed by Dam Break: Experimental Study and Numerical Simulation by a VOF-LPT Coupling. Int. J. Sediment Res. 2023, 38, 432–445. [Google Scholar] [CrossRef]
- Hamza, M.H.; Saegh, A.M. Flash Flood Risk Assessment Due to a Possible Dam Break in Urban Arid Environment, the New Um Al-Khair Dam Case Study, Jeddah, Saudi Arabia. Sustainability 2023, 15, 1074. [Google Scholar] [CrossRef]
- Özgenç Aksoy, A.; Doğan, M.; Oğuzhan Güven, S.; Tanır, G.; Güney, M.Ş. Experimental and Numerical Investigation of the Flood Waves Due to Partial Dam Break. Iran. J. Sci. Technol. Trans. Civ. Eng. 2022, 46, 4689–4704. [Google Scholar] [CrossRef]
- Yu, D.; Tang, L.; Ye, F.; Chen, C. A Virtual Geographic Environment for Dynamic Simulation and Analysis of Tailings Dam Failure. Int. J. Digit. Earth 2021, 14, 1194–1212. [Google Scholar] [CrossRef]
- Chen, C.; Ma, B. Safety Assessment of Dam Failure of Tailings Pond Based on Variable Weight Method: A Case Study in China. Min. Metall. Explor. 2022, 39, 2401–2413. [Google Scholar] [CrossRef]
- Ma, J.; Guan, J.; Duan, J.; Huang, L.; Liang, Y. Stability Analysis on Tunnels with Karst Caves Using the Distinct Lattice Spring Model. Undergr. Space 2021, 6, 469–481. [Google Scholar] [CrossRef]
- Ma, J.; Guan, J.; Gui, Y.; Huang, L. Anisotropic Bounding Surface Plasticity Model for Porous Media. Int. J. Geomech. 2021, 21, 04021033. [Google Scholar] [CrossRef]
- Ma, J.; Chen, J.; Chen, W.; Huang, L. A Coupled Thermal-Elastic-Plastic-Damage Model for Concrete Subjected to Dynamic Loading. Int. J. Plast. 2022, 153, 103279. [Google Scholar] [CrossRef]
- Melo, M.; Eleutério, J. Probabilistic Analysis of Floods from Tailings Dam Failures: A Method to Analyze the Impact of Rheological Parameters on the HEC-RAS Bingham and Herschel-Bulkley Models. Water 2023, 15, 2866. [Google Scholar] [CrossRef]
- Lyu, Z.; Chai, J.; Xu, Z.; Qin, Y.; Cao, J. A Comprehensive Review on Reasons for Tailings Dam Failures Based on Case History. Adv. Civ. Eng. 2019, 2019, 4159306. [Google Scholar] [CrossRef]
- Kean, J.W.; McCoy, S.W.; Tucker, G.E.; Staley, D.M.; Coe, J.A. Runoff-Generated Debris Flows: Observations and Modeling of Surge Initiation, Magnitude, and Frequency. J. Geophys. Res. Earth Surf. 2013, 118, 2190–2207. [Google Scholar] [CrossRef]
- Chen, H.-X.; Li, J.; Feng, S.-J.; Gao, H.-Y.; Zhang, D.-M. Simulation of Interactions between Debris Flow and Check Dams on Three-Dimensional Terrain. Eng. Geol. 2019, 251, 48–62. [Google Scholar] [CrossRef]
- Konzuk, J.S.; Kueper, B.H. Evaluation of Cubic Law Based Models Describing Single-Phase Flow through a Rough-Walled Fracture. Water Resour. Res. 2004, 40, 178. [Google Scholar] [CrossRef]
- Christen, M.; Kowalski, J.; Bartelt, P. RAMMS: Numerical Simulation of Dense Snow Avalanches in Three-Dimensional Terrain. Cold Reg. Sci. Technol. 2010, 63, 1–14. [Google Scholar] [CrossRef]


Disclaimer/Publisher’s Note: The statements, opinions and data contained in all publications are solely those of the individual author(s) and contributor(s) and not of MDPI and/or the editor(s). MDPI and/or the editor(s) disclaim responsibility for any injury to people or property resulting from any ideas, methods, instructions or products referred to in the content. |
© 2023 by the authors. Licensee MDPI, Basel, Switzerland. This article is an open access article distributed under the terms and conditions of the Creative Commons Attribution (CC BY) license (https://creativecommons.org/licenses/by/4.0/).