Article

Research on the Influence of Backfilling Mining in an Iron Mine with Complex Mining Conditions on the Stability of Surface Buildings

1
State Key Laboratory of Safety and Health for Metal Mines, Maanshan 243000, China
2
School of Safety Science and Engineering, Anhui University of Science and Technology, Huainan 232001, China
3
School of Mining Engineering, Anhui University of Science and Technology, Huainan 232001, China
4
College of Energy and Mining Engineering, Shandong University of Science and Technology, Qingdao 266590, China
*
Author to whom correspondence should be addressed.
Sustainability 2023, 15(20), 14733; https://doi.org/10.3390/su152014733
Submission received: 1 September 2023 / Revised: 30 September 2023 / Accepted: 3 October 2023 / Published: 11 October 2023

Abstract

:
The safe and efficient extraction of ore bodies under buildings contributes to the continued exploitation and utilization of mineral resources. To effectively reduce the mining-induced disturbance caused to surface buildings, the Vertical Crater Retreat (VCR) delayed backfilling method was applied at the Wuji iron mine according to mining theory and engineering experience, and the surface deformation under buildings was investigated through numerical simulation and on-site monitoring. The results show that stress concentration occurs at the top of the ore body and in surrounding rocks between ore veins, and the direction of the principal stress coincides with that of the main bearing capacity of the rock mass. With the increasing distance between the surrounding rock and the ore body, the stress disturbance in the surrounding rock attenuates gradually. The surface subsidence and deformation caused by ore mining exhibits the same northwest trend as the strike of the ore body, and the surface deformation in the X direction is greater than that in the Y direction. The surface deformation of the mining area near the 1# air shaft, Wuji village, steam autoclave workshop of the brick factory, and 1# substation is relatively large, while the surface subsidence, horizontal deformation, inclination, and curvature are all smaller than the critical values allowed for buildings and structures. This research provides a theoretical basis and engineering guidance for the prevention and control of surface deformation during mining under buildings and structures.

1. Introduction

In China, there exist ample mineral resources located under buildings (structures), water bodies, and railways, and a significant proportion of ore bodies are located under buildings [1,2,3]. Previous studies have shown that the iron ore bodies under structures, water bodies, and railways total 3.26 billion tons in China [4]. Mining under structures, water bodies, and railways can further realize the utilization of underground resources, improve economic benefits from mining, and reduce damage to the geological and natural environment. However, surface deformation and subsidence can be caused during mining under these conditions. Therefore, research on safe mining under structures, water bodies, and railways is of great significance for the development and utilization of mineral resources in China.
At present, research on and application of coal mining under buildings has been widely conducted, and regulations for coal mining under structures, water bodies, and railways have been formulated in China. Nonetheless, a comprehensive theory and corresponding regulations for metal mining in the same situation have not been fully developed [5]. The characteristics of ore rocks in metal mines differ from those in coal mines, which are characterized by heterogeneous lithology and multiple structures. As a result, theory and methods developed for coal mining under structures, water bodies, and railways cannot be used directly for metal mines [6,7,8].
In recent years, studies on metal mining technology under buildings have been conducted by several research institutions in China. When mining the ore body under buildings, appropriate mining methods should be employed based on the occurrence conditions of the ore body, so that the deformation of surface buildings caused by underground mining can be controlled within the allowable range. Based on the mining practice under structures and waterbodies in the South Tannery, Jing Wenyu et al. [9] put forward a two-step backfilling mining method for gently inclined ore bodies, illustrated the mechanism of mining pressure in the stope, and proposed a mining pressure control scheme (that is, mining from the middle to the two wings, multiple unloadings in different zones, and stable settlement) to fully recover underground resources and extend the service life of the mine. Through numerical simulation, Wang Shanfei et al. [10] simulated different mining sequence schemes for the mining of the Sanshandao gold mine under buildings and waterbodies, and concluded that alternating room-and-pillar mining is beneficial for controlling surface deformation. Based on existing experience and the occurrence conditions of the Panlong lead–zinc ore body, Guo Mingming et al. [11] used a mechanized upward horizontal layered backfilling mining method, and verified that this method will not cause damage to surface highways. Wu Zhenyu et al. [12] simulated the use of a sublevel open stoping with delayed backfilling method and the pillar-retaining method on the shallow ore body in an iron ore mine. The results showed that the surface deformation is relatively small, and this mining method can ensure the safety of surface buildings. To prevent surface deformation during iron mining under buildings and highways, Guo Qi et al. [13] adopted sublevel open stoping with the delayed backfilling method and the pillar-retaining mining method, which can ensure the stability of surface buildings and roads. Although retaining safety pillars can mitigate the issue of significant surface deformation, it also entails a loss of mineral resources.
Surface deformation can be used to measure the safety of mining under structures, water bodies, and railways. Researchers have also conducted extensive investigations of surface deformation around mining areas after comprehensively analyzing and adopting appropriate mining methods under these conditions [14,15,16,17,18]. By using an electronic dumpy level, Zhao Yunchang [19] monitored the surface deformation and studied the subsidence mechanism around a mining area, and obtained a theoretical and scientific basis for mining subsidence, compensation for collapsed land, and comprehensive utilization. Xia Kaizong et al. [20,21,22] used GPS and a Leica DNA03 digital level to monitor surface deformation around the Chengchao iron mine. The results showed that, with the expansion of mining in depth and plane, the horizontal stress in the mining area releases continuously and a failure zone can be formed. Through the use of statistics and correlation analysis, Feng Yi [23] summarized the relationship between mining subsidence control and drilling and grouting, and proposed grouting and subsidence control techniques in the mine, which alleviate the mining subsidence caused by the exploitation of mineral resources under the three bodies. Based on ground deformation GPS data, dumpy level, and 3D laser scanning, Song Xugen et al. [24] studied the ground deformation above and around the mining site and goaf, established the mechanical model of surrounding rock failure around the goaf, and described the rock movement and mechanism of deformation at the measuring points. Huaizhan Li et al. [25] analyzed the influence of strip super-high water filling mining on surface buildings by means of theoretical analysis, numerical simulation and field monitoring. In Zhiqiang Yang et al.’s study [26], according to the site-specific geological conditions, the stability of the backfilling body and the characteristics of surface subsidence due to mining of −450 m level were analyzed using physical modeling. Furthermore, the surface subsidence and the stability of the stope were achieved using FLAC3D. Binglei Li et al. [27] studied the NMR-based damage characterization of backfill material in host rocks under dynamic loading using a true-triaxial testing machine. Due to the complexity of the occurrence of metal deposits, control measures to solve the surface deformation caused by underground mining are not unified, and the methods for analyzing surface deformation are relatively limited. Therefore, a combination of multiple analysis methods is needed to conduct in-depth research on the impact of mining of ore bodies under buildings on surface deformation.
In the early mining stage, the safety pillar-retaining method was used in the Wuji iron mine to protect surface buildings and structures, resulting in a large accumulation of mineral resources in the shallow area. To safely mine the remaining shallow and deep ore bodies, the occurrence conditions of ore bodies were analyzed, various mining methods were comprehensively compared and analyzed, and the most appropriate mining method was determined in this study. Additionally, numerical simulations and on-site monitoring were used to obtain the surface deformation caused by mining under buildings, such as surface subsidence, horizontal displacement, inclination, and curvature. Based on the Chinese standard of the Code for Design of Nonferrous Metal Mining, the influence of backfilling mining in iron mines with complex mining conditions on the stability of surface buildings was illustrated.

2. Selection of Mining Methods

2.1. Geological Conditions of the Mining Area

Wuji iron mine is located in Huoqiu County, Anhui Province. The deposit is located on the south bank of the middle and upper reaches of the Huaihe River. It belongs to the Huaihe River Class II terrace, with relatively flat terrain and an elevation of +40~+57 m. The deposits are covered by the quaternary system, with a thickness ranging from 32 m to 157 m. The hanging wall of Wuji iron mine is mainly biotite plagioclase gneiss and the footwall is mainly magnetite hornblende plagioclase gneiss. A YT-28 rock drill is used for drilling, the depth of the blast holes is 1.8 m and the diameter of blast holes is 38~40 mm. The falling height of each layer is controlled within 2.0 m. The blasting ore is transported to the ore pass by a 2 m 3 scraper, and then transferred to the main transport level.
Wuji iron mine is located in the east wing of the Zhouji inverted steering area. The trend of the ore body in the southern area is 30–45° NW; the direction of the ore body in the northern area is north–south, and the ore body is inclined SW–W. In the shallow part of exploration line 4, the ore body is inclined to the northeast, and the dip angle of the ore body is generally 35–60°, with certain local sections exceeding 70°. The ore body of Wuji iron mine exhibits a gradual slope in the southern area and a steep incline in the northern area, while, vertically, it gradually descends into deeper levels and becomes steeper. The ore body is a monoclinal structure with an inverted skew wing at the north and south ends. Due to several tectonic changes, secondary folds have developed. The structural stress of exploration lines 0–8 is more prominent, showing an S-shaped form. The deposit is approximately 4000 m long from north to south and 150–600 m wide from east to west, with an average length of about 300 m. The burial depth of the ore body is about 45–1000 m, with an elevation of around 0–950 m. The planned mining elevation is +54–−650 m.
Within the boundary of the surface movement of the Wuji iron mine, there is a large number of mine-owned buildings and villages. Figure 1 shows the overall distribution of buildings and villages. The numbers in Figure 1 represent the exploration line. If the traditional method of retaining safety pillars is used to protect surface structures, the long-term development of the mine will be hindered. As the mining activities gradually extend deeper, the retaining scope of the safety pillars becomes larger, until almost all deep ore bodies in the mine are within this scope of safety pillars. According to satellite images, there are nearly one thousand private houses in Wuji village alone. If the scheme of relocating surface villages and industrial buildings is adopted, it will lead to huge labor costs and substantial economic and time expenditures, which will directly affect the normal production of the mine. To improve the effective utilization of mineral resources, appropriate mining methods should be selected to reduce the impact of mining on surface deformation.

2.2. Selection of Mining Methods

In the Wuji iron mine, the ore body is mainly inclined (an inclination angle of about 50°), thick, and large (an average thickness of about 20 m). Therefore, this type of ore body was selected for research. Based on the engineering geological conditions and experience with mining, three schemes were preliminarily selected: sublevel open stoping with the delayed backfilling method (Scheme I), the VCR delayed backfilling method (Scheme II), and the lateral caving stage open stope delayed backfilling method (Scheme III).
To obtain the appropriate method for mining in Wuji, the advantages and disadvantages of the three mining methods were analyzed. In Scheme I, medium deep hole blasting was adopted; it is a simple, safe process with high production capacity. However, this scheme requires sublevel rock drilling engineering, which requires a large amount of mining preparation work. Additionally, it is difficult to manually charge up deep holes and control the boundary of the mining site, which may lead to over-mining and over-blasting. In Schemes II and III, down hole drilling, large hole blasting, and scraper mining were used. This method is characterized by highly technical equipment, high production efficiency, a simple stope structure, a small amount of development and mining preparation work, and a large production capacity of the stope. However, a large drilling depth and complex blasting process are required, which is expensive and may cause the punching phenomenon induced by blasting, and inability to support the upper wall roof. Scheme III will inevitably cause a large amount of blasting through lateral collapse blasting and a high rate of large blocks, which cause significant disturbance to adjacent mining areas or backfilling bodies.
In addition, a comprehensive evaluation was conducted on the three mining schemes from the perspectives of mining techniques, mining safety, and economic benefits. Table 1 shows the relative evaluation of the comprehensive qualitative indicators.
The above schemes were compared qualitatively and quantitatively. Although the recovery rate of Scheme I is relatively high, the difficulty in controlling the boundary of the upward fan-shaped deep hole stope may lead to over-blasting and over-mining, and the cutting ratio is large and the cost is high. Thus, Scheme I was ruled out. During the application of Scheme III in inclined or steeply inclined ore bodies, mining from the hanging wall to the footwall can lead to significant depletion. Additionally, a large blasting volume is required in this scheme, and it can have a significant impact on blasting vibration. Considering the characteristics of deep mining at Wuji iron mine (southern area), Scheme III is not recommended. After analysis and comparison, Scheme II was selected for mining, as shown in Figure 2. When the VCR delayed backfilling method is used for mining, it is necessary to arrange a rock drilling chamber horizontally on the upper part of the ore block. The rock drilling truck is used to drill down the vertical deep hole to the bottom level of the lower part of the ore body, and the ball charge funnel blasting is adopted. The bottom structure of the ore extraction forms a trench, and the two mining sites share a common ore extraction roadway.

3. Estimation of Mechanical Parameters of Rock Mass

3.1. Rock Mechanical Experiments

According to the international experimental standards of rock mechanics, the rock was processed into φ 50 × 100 mm and φ 50 × 50 mm cylinders with coring machines, cutting machines, and stone grinding machines in the laboratory for uniaxial compression, Brazilian splitting tests, and shear tests, respectively. Mechanical tests were conducted on samples from the surrounding rock, ore, weathering zone, and quaternary of Wuji iron mine using a testing machine. Additionally, cemented tailings were used as the backfill material, and the backfill was composed of tailings and cement in a ratio of 8:1. The physical and mechanical parameters of different types of rocks were obtained, as shown in Table 2.

3.2. Hoek–Brown Parameters

Based on the Griffith strength theory, Hoek and Brown proposed the Hoek–Brown strength criterion, and later put forward a modified version based on the geological strength index (GSI). The expression is shown below.
σ 1 = σ 3 + σ c i ( m b σ 3 σ c i + s ) a
where σ1 is the maximum principal stress; σ3 is the minimum principal stress; σci is the uniaxial compressive strength of intact rock; mb, s, and a are Hoek–Brown constants of the rock mass, which can all be expressed as functions of the GSI.
The Hoek–Brown failure criterion was used to determine the rock mass properties. Hoek et al. [28] proposed the following equations for calculating the constants (mb, s, and a) of the rock mass:
m b = m i exp ( G S I 100 28 14 D )
s = exp ( G S I 100 9 3 D )
a = 1 2 + 1 6 ( e G S I / 15 e 20 / 3 )
where mi refers to the complete rock material constant. The ore body and surrounding rock are mainly migmatite. As shown in Table 3, mi = 29 [28,29]. The rock mass in the weathered zone is mainly composed of gneiss, schist, migmatite, migmatite granite, and the iron ore body of the neoarchean Wuji Formation. The lower limit of mi is 12. The mb refers to the material constant of the rock mass; s and a are the characteristic constants of the rock mass; D is the disturbance coefficient, which is related to the degree of damage to the rock mass during excavation. Most rock masses in the deep part of the ore body are less disturbed by blasting, and, as shown in Table 3, D = 0.5 [28,29]. The calculated Hoek–Brown constants are listed in Table 3.

3.3. Mechanical Parameters of Rock Mass

According to the mechanical parameters of rock mass obtained from laboratory tests and rock mass quality evaluation, the Hoek–Brown strength criterion was used to estimate the uniaxial compressive strength, tensile strength, deformation modulus, Poisson’s ratio, shear strength, and other mechanical parameters of different rock masses.
Uniaxial compressive strength of rock masses can be obtained as follows:
σ c m a s s = σ c i s a
Uniaxial tensile strength of rock masses can be obtained as follows:
σ t m a s s = s σ c i / m b
The expression for the deformation modulus Em of the rock mass is:
E m = { ( 1 D 2 ) σ c 100 10 ( G S I 10 40 ) , ( σ c 100 M P a ) ( 1 D 2 ) 10 ( G S I 10 40 ) , ( σ c > 100 M P a )
The expressions for shear strength of rock mass (c and φ values) are:
c = σ c i [ ( 1 + 2 a ) s + ( 1 a ) m b σ 3 n ] ( s + m b σ 3 n ) α 1 ( 1 + a ) ( 2 + a ) 1 + ( 6 a m b ( s + m b σ 3 n ) a 1 ) / ( ( 1 + a ) ( 2 + a ) )
φ = sin 1 [ 6 a m b ( s + m b σ 3 n ) α 1 2 ( 1 + a ) ( 2 + a ) + 6 a m b ( s + m b σ 3 n ) a 1 ]
where σ3n = σ3max/σc, and σ3max is the upper limit value of the limit stress in the relationship between the Hoek–Brown criterion and Mohr–Coulomb criterion; σci is the uniaxial compressive strength of the rock mass.
The relationship between σ3max and the strength σcmass of rock mass is:
σ 3 m a x σ c m a s s = 0.47 ( σ c m a s s γ H ) 0.94
where σcmass is the uniaxial compressive strength of the rock mass, MPa; γ is the bulk density of the rock mass, MN/m3; and H is the burial depth of the study area, m. When the horizontal stress is greater than the vertical stress, γH is replaced by horizontal stress.
The above equations are used to calculate the mechanical parameters of different rock masses, as shown in Table 4.

4. Numerical Simulation Analysis of Surface Deformation

4.1. Establishment of Numerical Simulation

The mining range of the ore body from the planned mining elevation of +54 m to −650 m was simulated, the surface deformation characteristics during the mining process were studied, and the impact on the stability of surface buildings after complete mining of the ore body was obtained.
The three-dimensional numerical calculation of the mining and backfilling process of the ore body was carried out using FLAC3D software. First, a mining geological model was established by connecting the ore bodies of each section with the geological boundary in the vertical direction by the 3D mine software. Second, Midas software was imported, and a 3D solid model of the mine suitable for meshing was established through Boolean operations. The ore body grid was encrypted. After meshing and grouping the model, a 3D numerical mesh model was finally established (see Figure 3). The range of the three-dimensional numerical grid model was 4000 m in the EW direction and 5300 m in the NS direction. Tetrahedral grids were used, with a total of 1.35 million grids and 300,000 nodes established.
The Mohr–Coulomb strength criterion was used to describe the strength characteristics and failure criteria of rock mass in the simulation. The self-weight stress was set as the initial stress field, and normal constraints were applied around the model and on the ground. The top surface of the model was a free surface without any constraints. According to the physical and mechanical parameters of rock mass in Table 4, the material parameters of different rock masses in the model were assigned. After the establishment of the three-dimensional numerical model of the mine, the initial stress balance was carried out. The maximum principal stress at the bottom of the numerical model was about 24.5 MPa, which was consistent with the actual principal stress in the project.

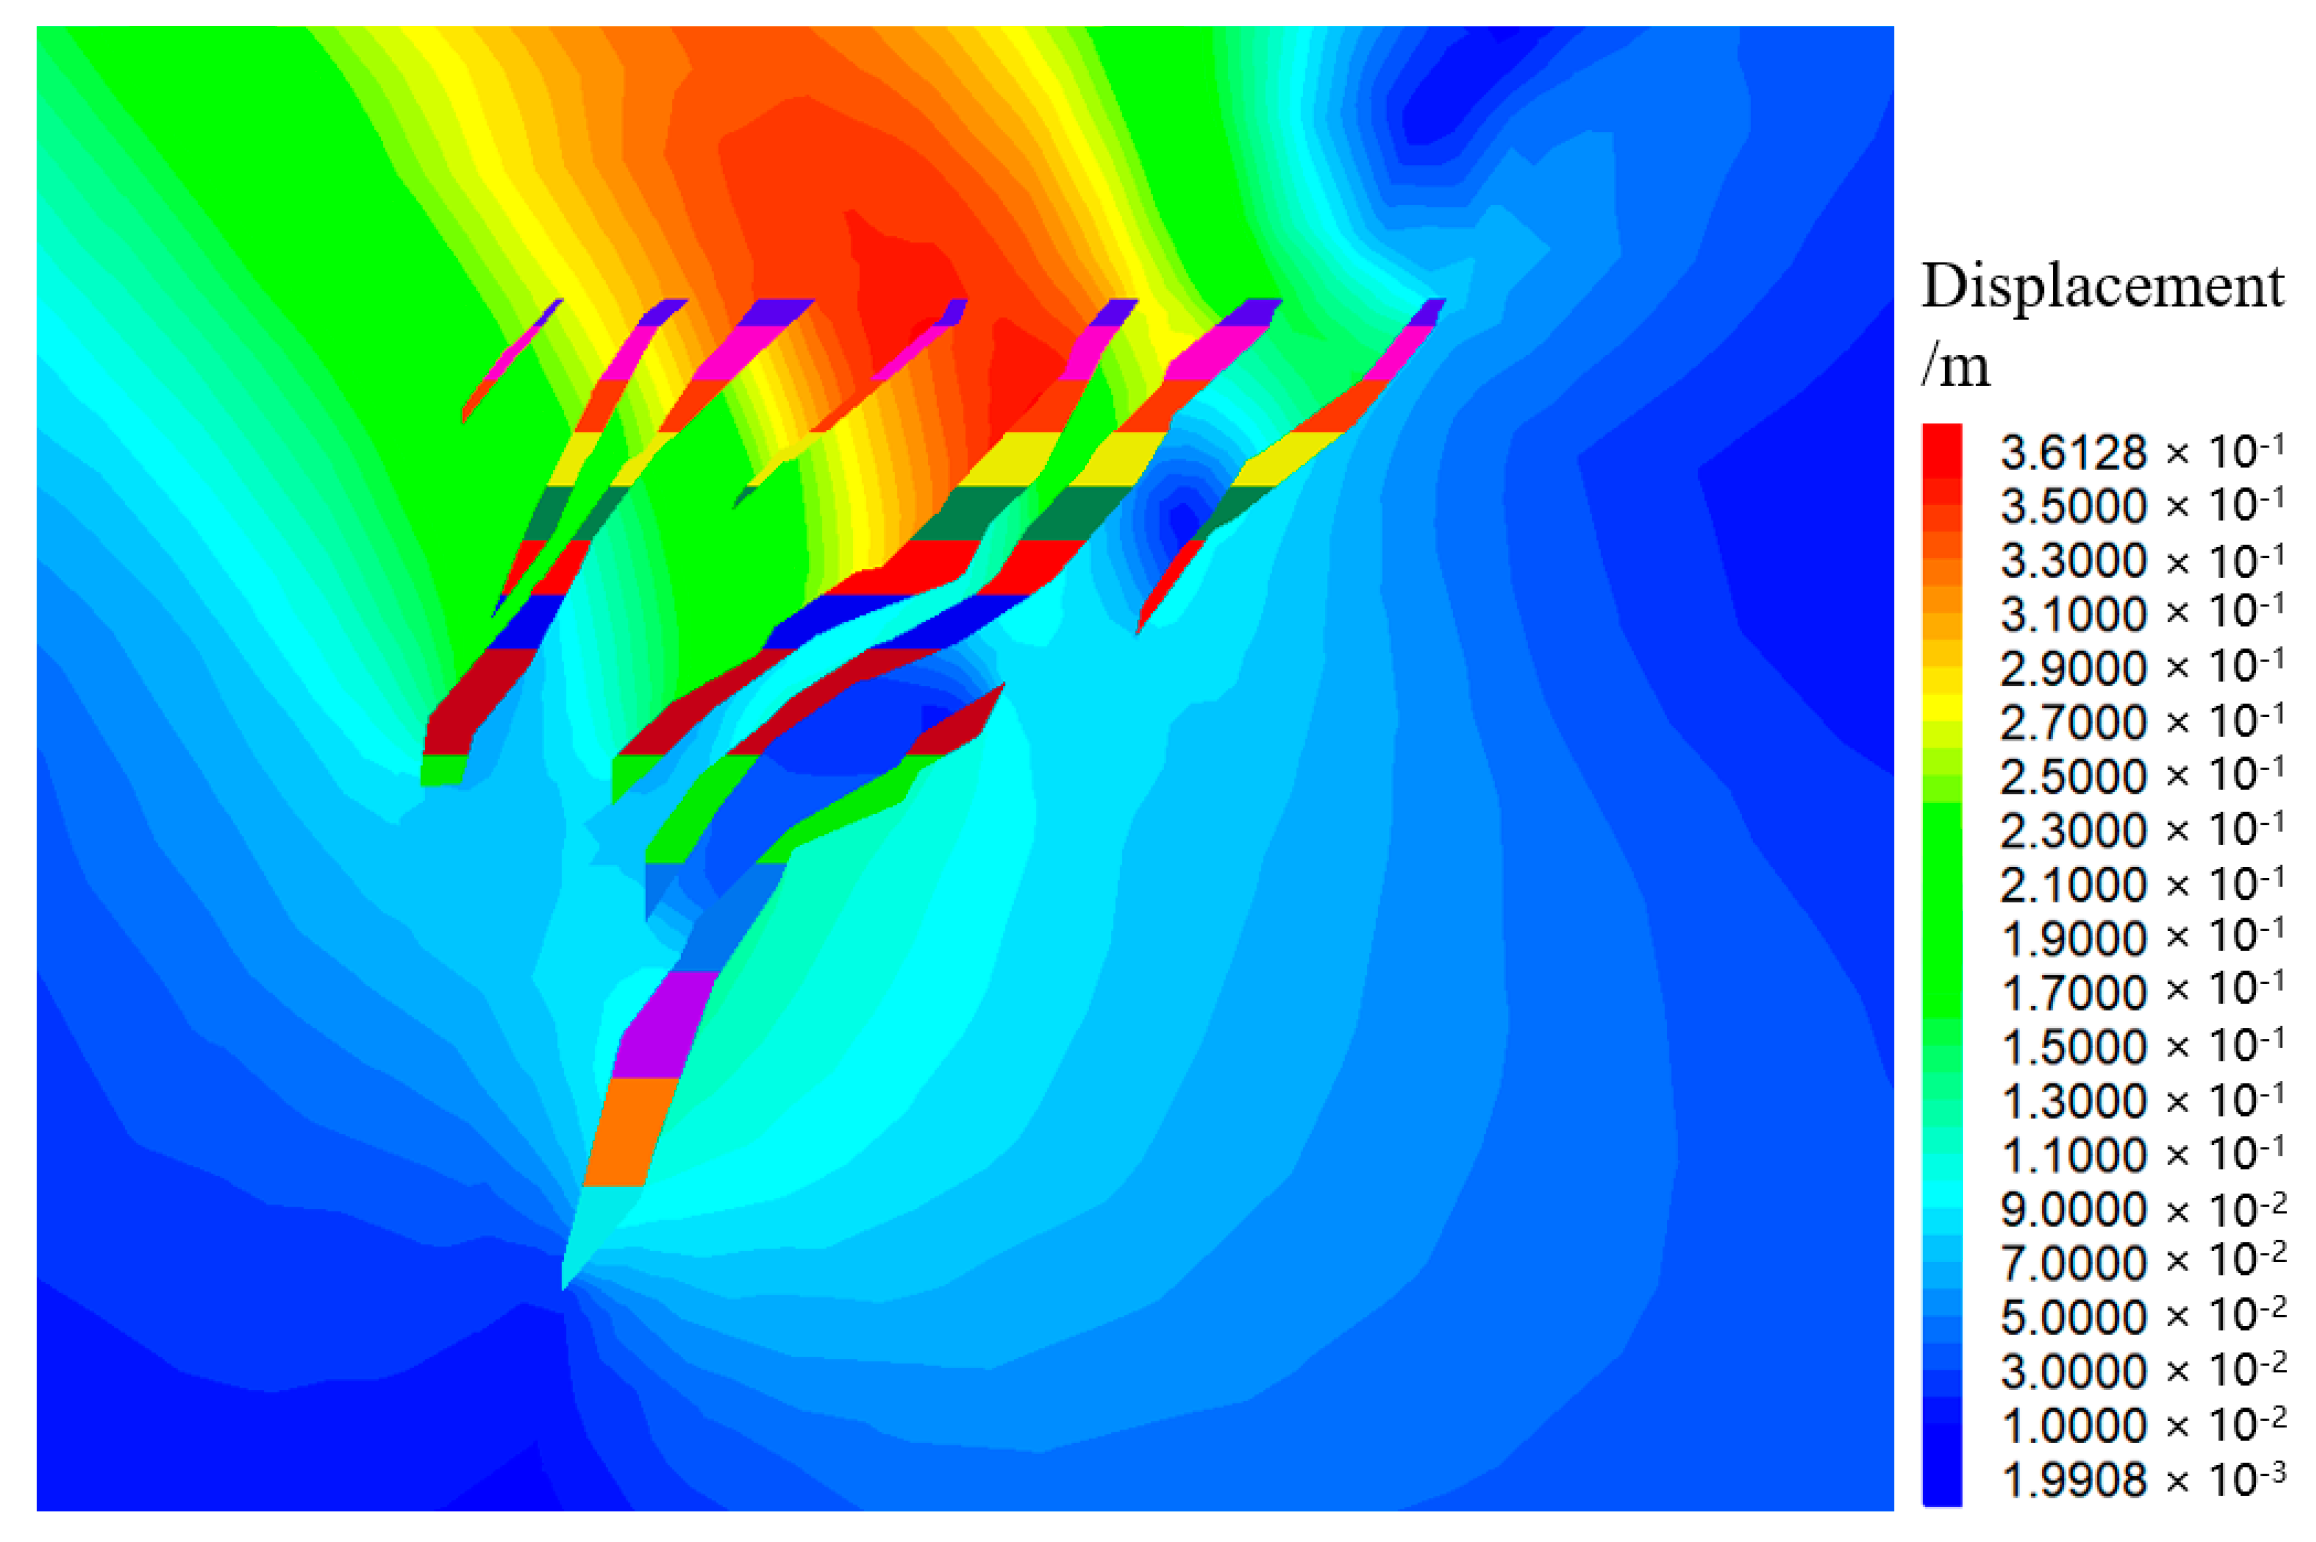
4.2. Stress and Displacement Analysis of Ore Body Surrounding Rock

The stability of the mining stope is an important factor affecting the surface displacement of mines. The cumulative displacement of surrounding rocks in each stope results in the final displacement of the mining surface. Therefore, analyzing the changes in stress and displacement of the stope-surrounding rock during the mining process is of great significance for studying surface deformation.
Figure 4 and Figure 5 show the stress vector and displacement of the Wuji iron mine, respectively. It can be seen that reduction in the principal stress occurs in the surrounding rock of the hanging wall of the ore body, and the stress concentration occurs in the top of the ore body and some surrounding rocks between the ore veins. The direction of principal stress in the stress concentration area at the top of the ore body is nearly horizontal, and that of the rock mass between the ore veins is in the inclined direction of the ore body. The stress concentration at the top of the ore body is mainly caused by the rock mass in ore veins supporting the surrounding rock at the top, indicating that the rock mass in the ore veins bears a certain amount of upper rock load. The direction of the principal stress is the direction of the main bearing capacity of the rock mass, indicating that the surrounding rock in the ore veins plays an important supporting and protective role in the mining process. Therefore, the surrounding rock of the hanging wall and the footwall of the ore vein should be protected to reduce the damage caused by blasting to the surrounding rock during the mining process.
The mining-induced displacement of the surrounding rock of the ore body mainly occurs on the hanging wall of the ore body and gradually extends to the surface. Among them, the maximum settlement displacement of the surface located at the hanging wall of the ore body is relatively large, about 33 cm. The vertical displacement near the rock pillar in the ore veins significantly decreases. This is because the rock pillar bears the upper stress and slows down the settlement of the hanging wall of the ore body. It can be seen that with the gradual accumulation of the surrounding rock displacement at each stope, the magnitude of surface displacement will be ultimately affected. Therefore, it is necessary to strengthen the support of the surrounding rock in the hanging wall of the mining area during the mining process.

4.3. Numerical Simulation Analysis of Surface Deformation

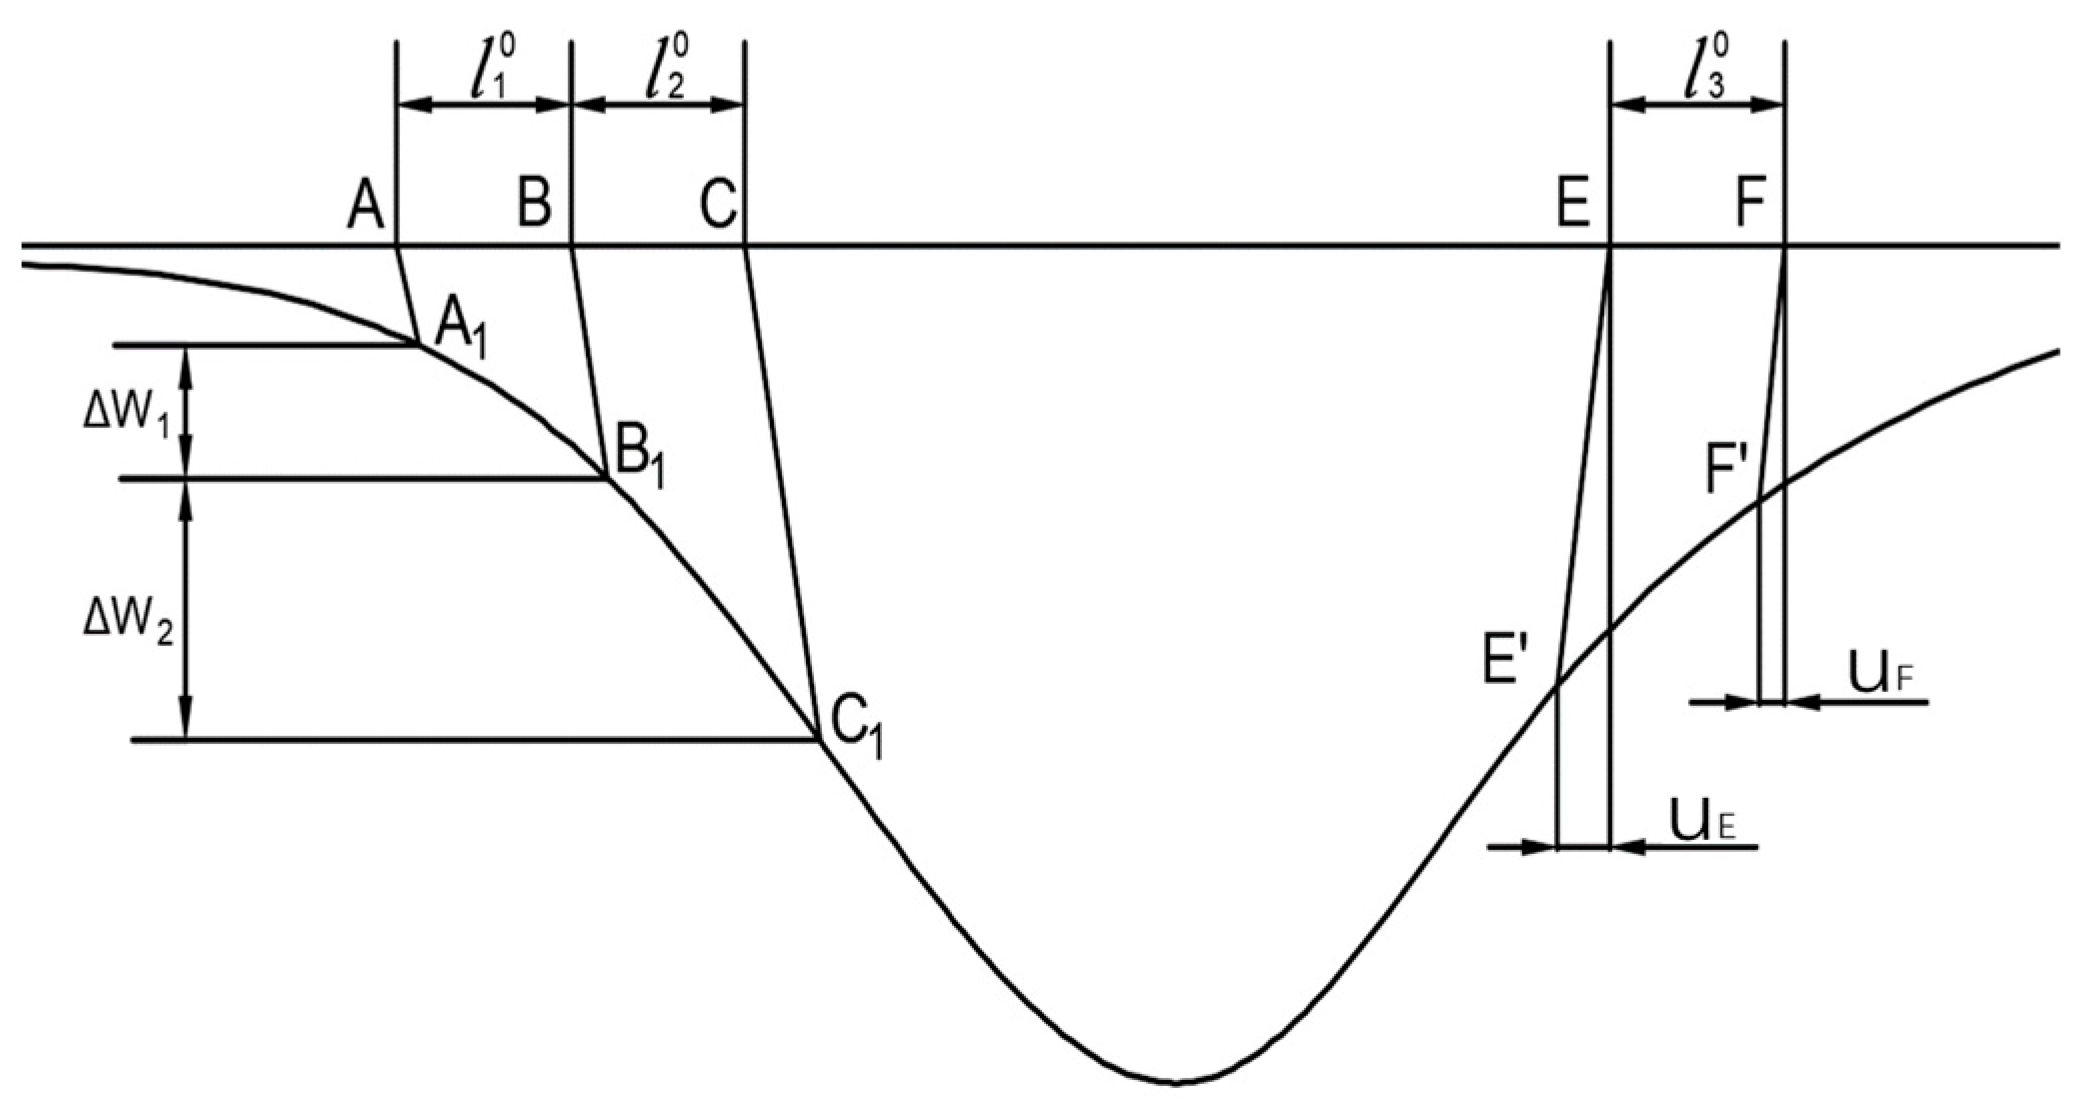
4.3.1. Calculation Principles and Limits of Surface Deformation

The analysis of the stability and damage done to surface buildings and structures within the range of influence of underground mining is of great significance for safety and maintaining the normal life of residents. The main patterns of surface deformation caused by underground mining include settlement, horizontal deformation, inclination, and curvature, and their calculation functions are shown in Equations (11)–(14). Figure 6 shows the calculation diagrams of various parameters of surface deformation.
W max = q m cos α
ε = u E u F E F = Δ u l 2 0
i A B = w B w A l A B 0 = Δ w l A B 0
k B = i B C i A B 0.5 ( B C + A B ) = Δ i 0.5 ( l 2 0 + l 1 0 ) × 10 3
where Wmax, ε, iAB, and kB represent surface subsidence, horizontal deformation, inclination, and curvature, respectively; q is the subsidence coefficient, and q = 0.15 is taken in the backfilling mining method; m is the mining thickness.
The Code for Design of Nonferrous Metal Mining (GB-50771-2012) provides a more detailed classification of the levels of buildings and structures that need to be protected on the surface. Different critical deformation values are used for buildings and structures with different protection levels, as shown in Table 5. Based on the theory of surface deformation and the relevant regulations, the allowable critical values for the displacement and deformation of surface buildings in Wuji iron mine are as follows: the surface inclination i = 3 mm/m, the surface curvature k = 0.2 × 10⁻³/m, and the surface horizontal deformation ε = 2 mm/m. Based on the simulated surface deformation data, the impact of underground mining on surface structures in the Wuji iron mine is evaluated below.

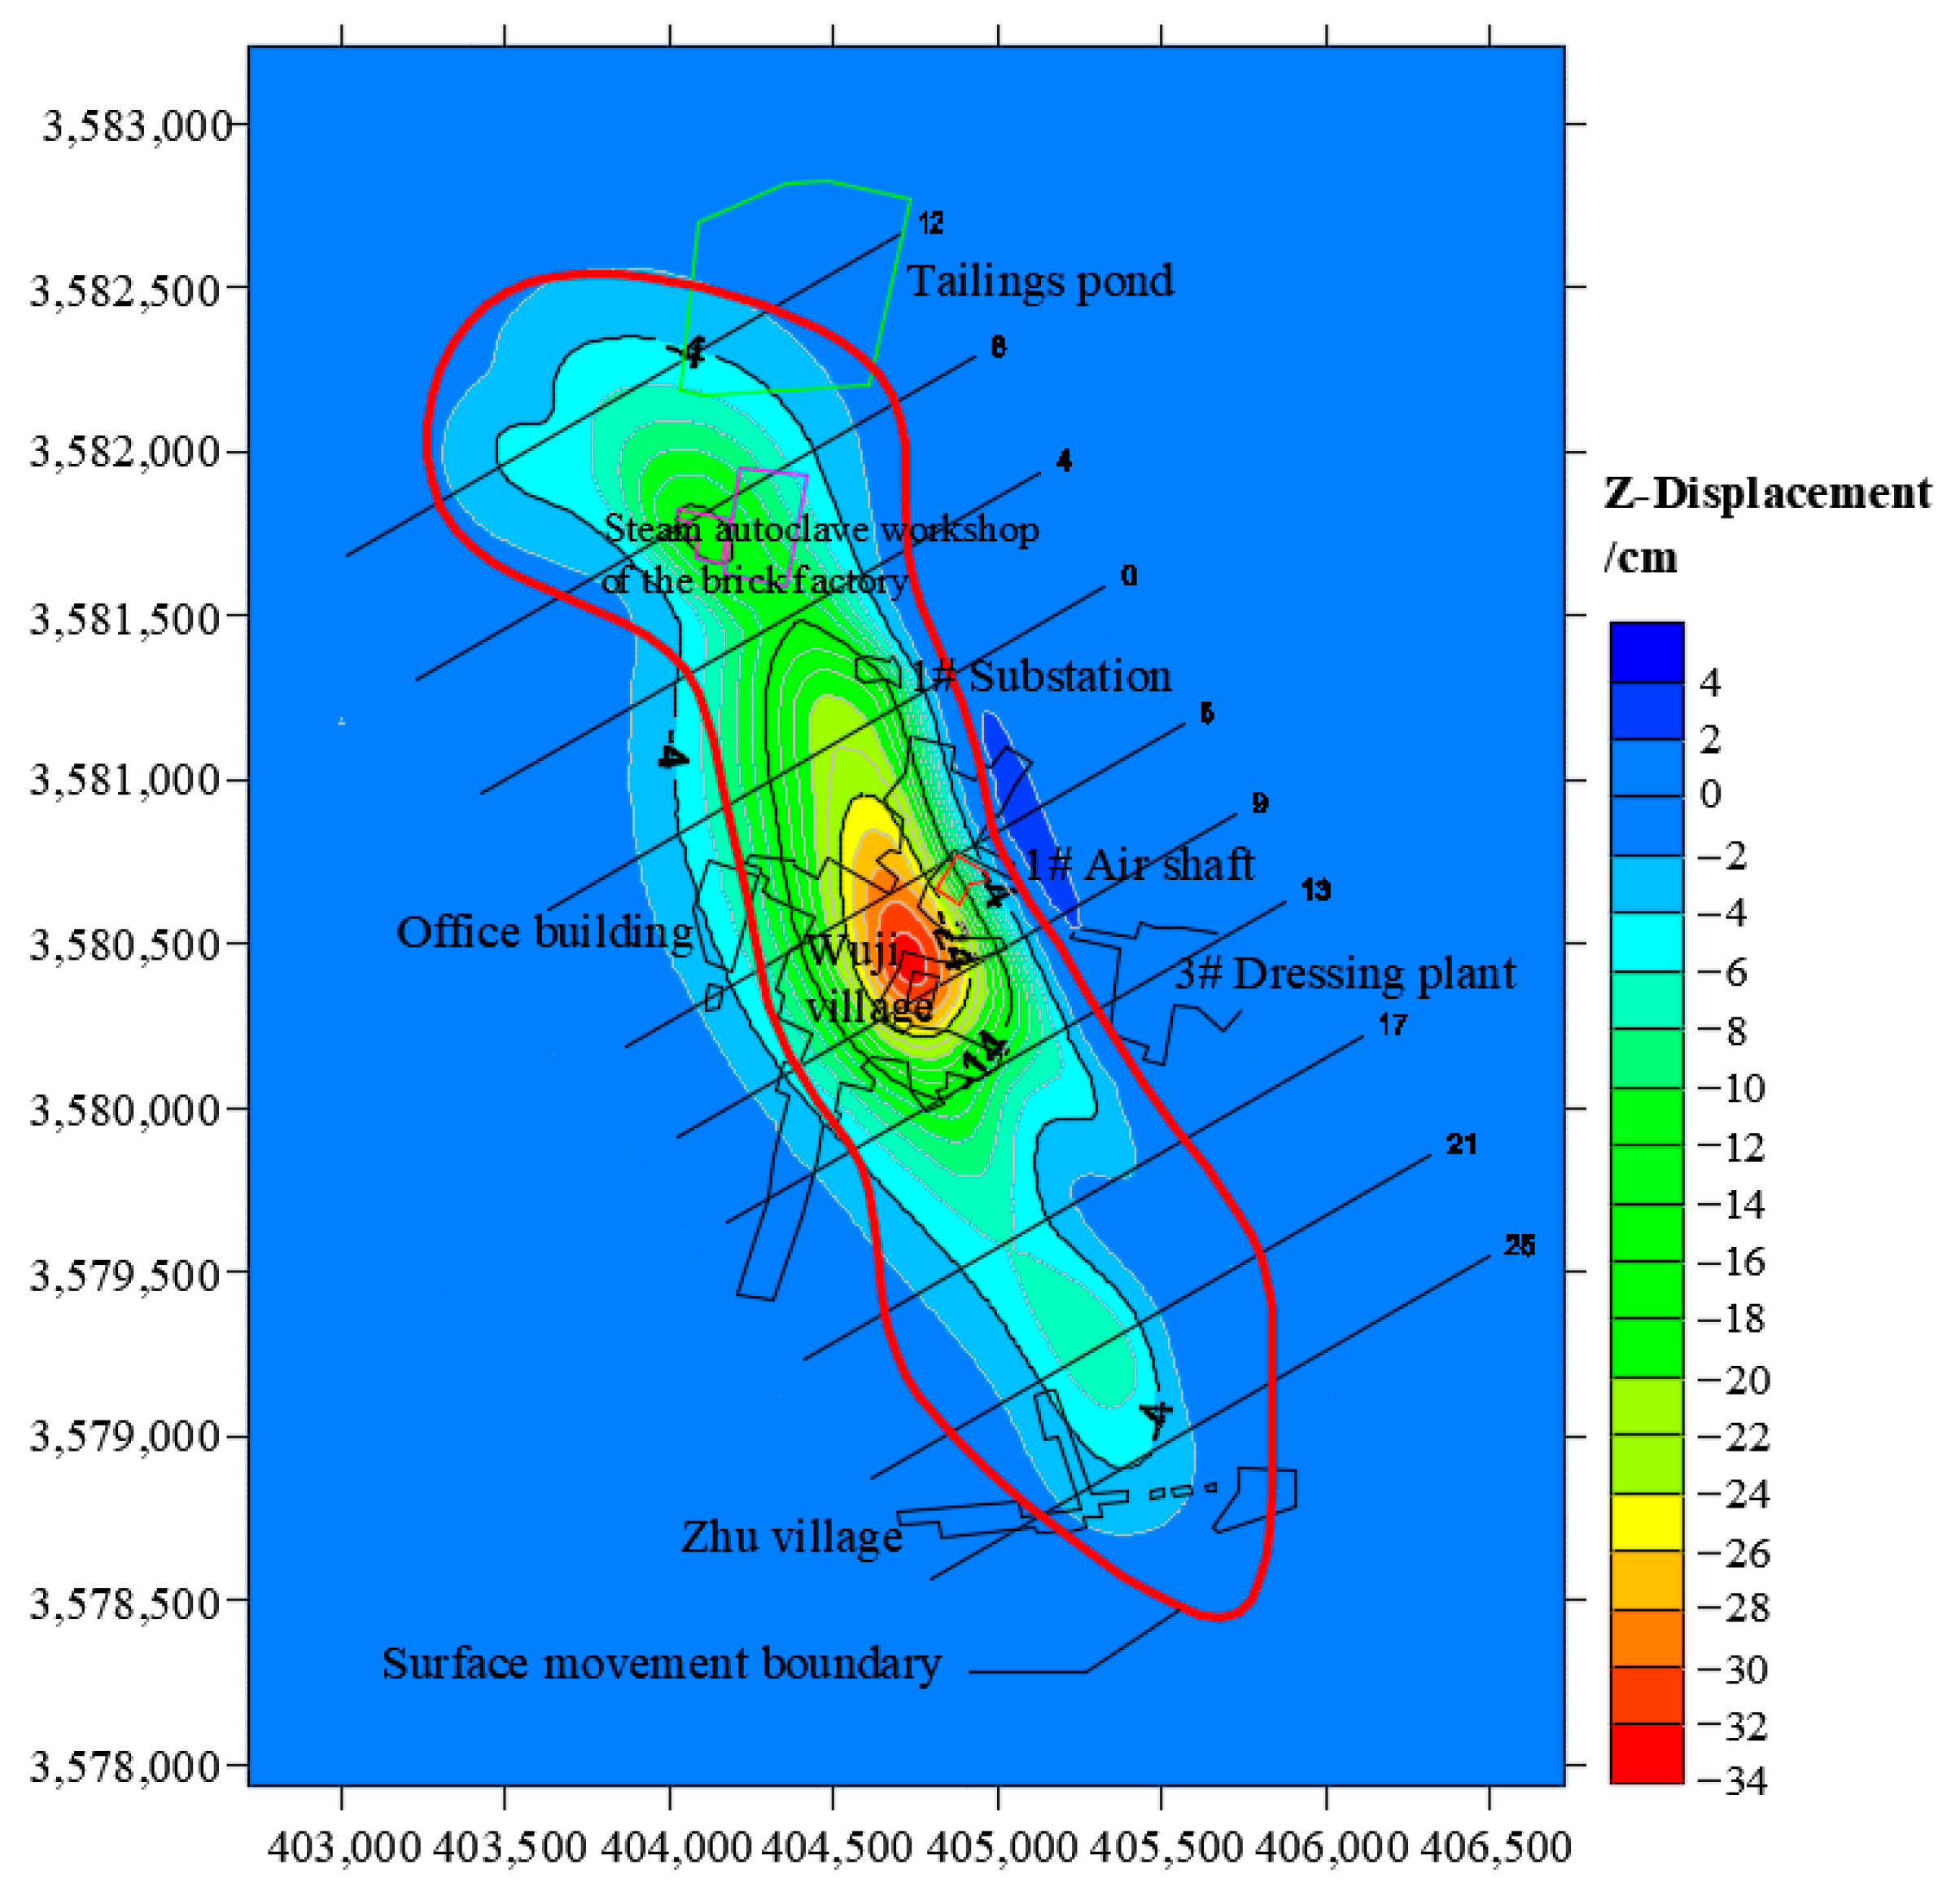
4.3.2. Surface Subsidence

The mining of ore bodies causes the displacement and deformation of surrounding rock, and when the displacement of surrounding rock develops and reaches the surface, subsidence and deformation can be caused. To scientifically analyze the impact of underground mining on the surface buildings and structures at the Wuji iron mine, a surface subsidence cloud map of the Wuji iron mine was simulated, as shown in Figure 7. The relevant displacement data were extracted, and Tecplot, Sufer, and other software types were applied for data processing. Finally, the three-dimensional diagram of land surface subsidence was obtained, as shown in Figure 8.
It can be seen that the surface subsidence range of the mining area is distributed in a narrow strip, and the overall distribution of surface subsidence is located above the ore body in a northwestern direction, which is consistent with the trend of the ore body. The surface subsidence is distributed in three regions: north, central, and south. The area of maximum subsidence occurs in the center of the ore body, followed by the northern area, with the smallest amount of subsidence occurring in the southernmost end of the ore body.
To further observe the changes in surface subsidence, cross-sections of subsidence were made along lines 8, 5–9, and 21, and longitudinal sections were made along the surface subsidence area, as shown in Figure 9 and Figure 10. There are three extreme points of surface subsidence in space, which are located near the steam autoclave workshop of the brick factory (line 8, 14.8 cm), the center of Wuji village in the central area (lines 5–9, 33 cm), and in the southern area (line 21, 7.9 cm). The amount of surface subsidence is the greatest at lines 5–9, and the monitoring of surface subsidence should be strengthened at these positions. The surface subsidence increases in line 8 and line 21, which means that further detection and monitoring are required at this location. Additionally, the reasons for the increase in subsidence should be analyzed to ensure safe mining under buildings.

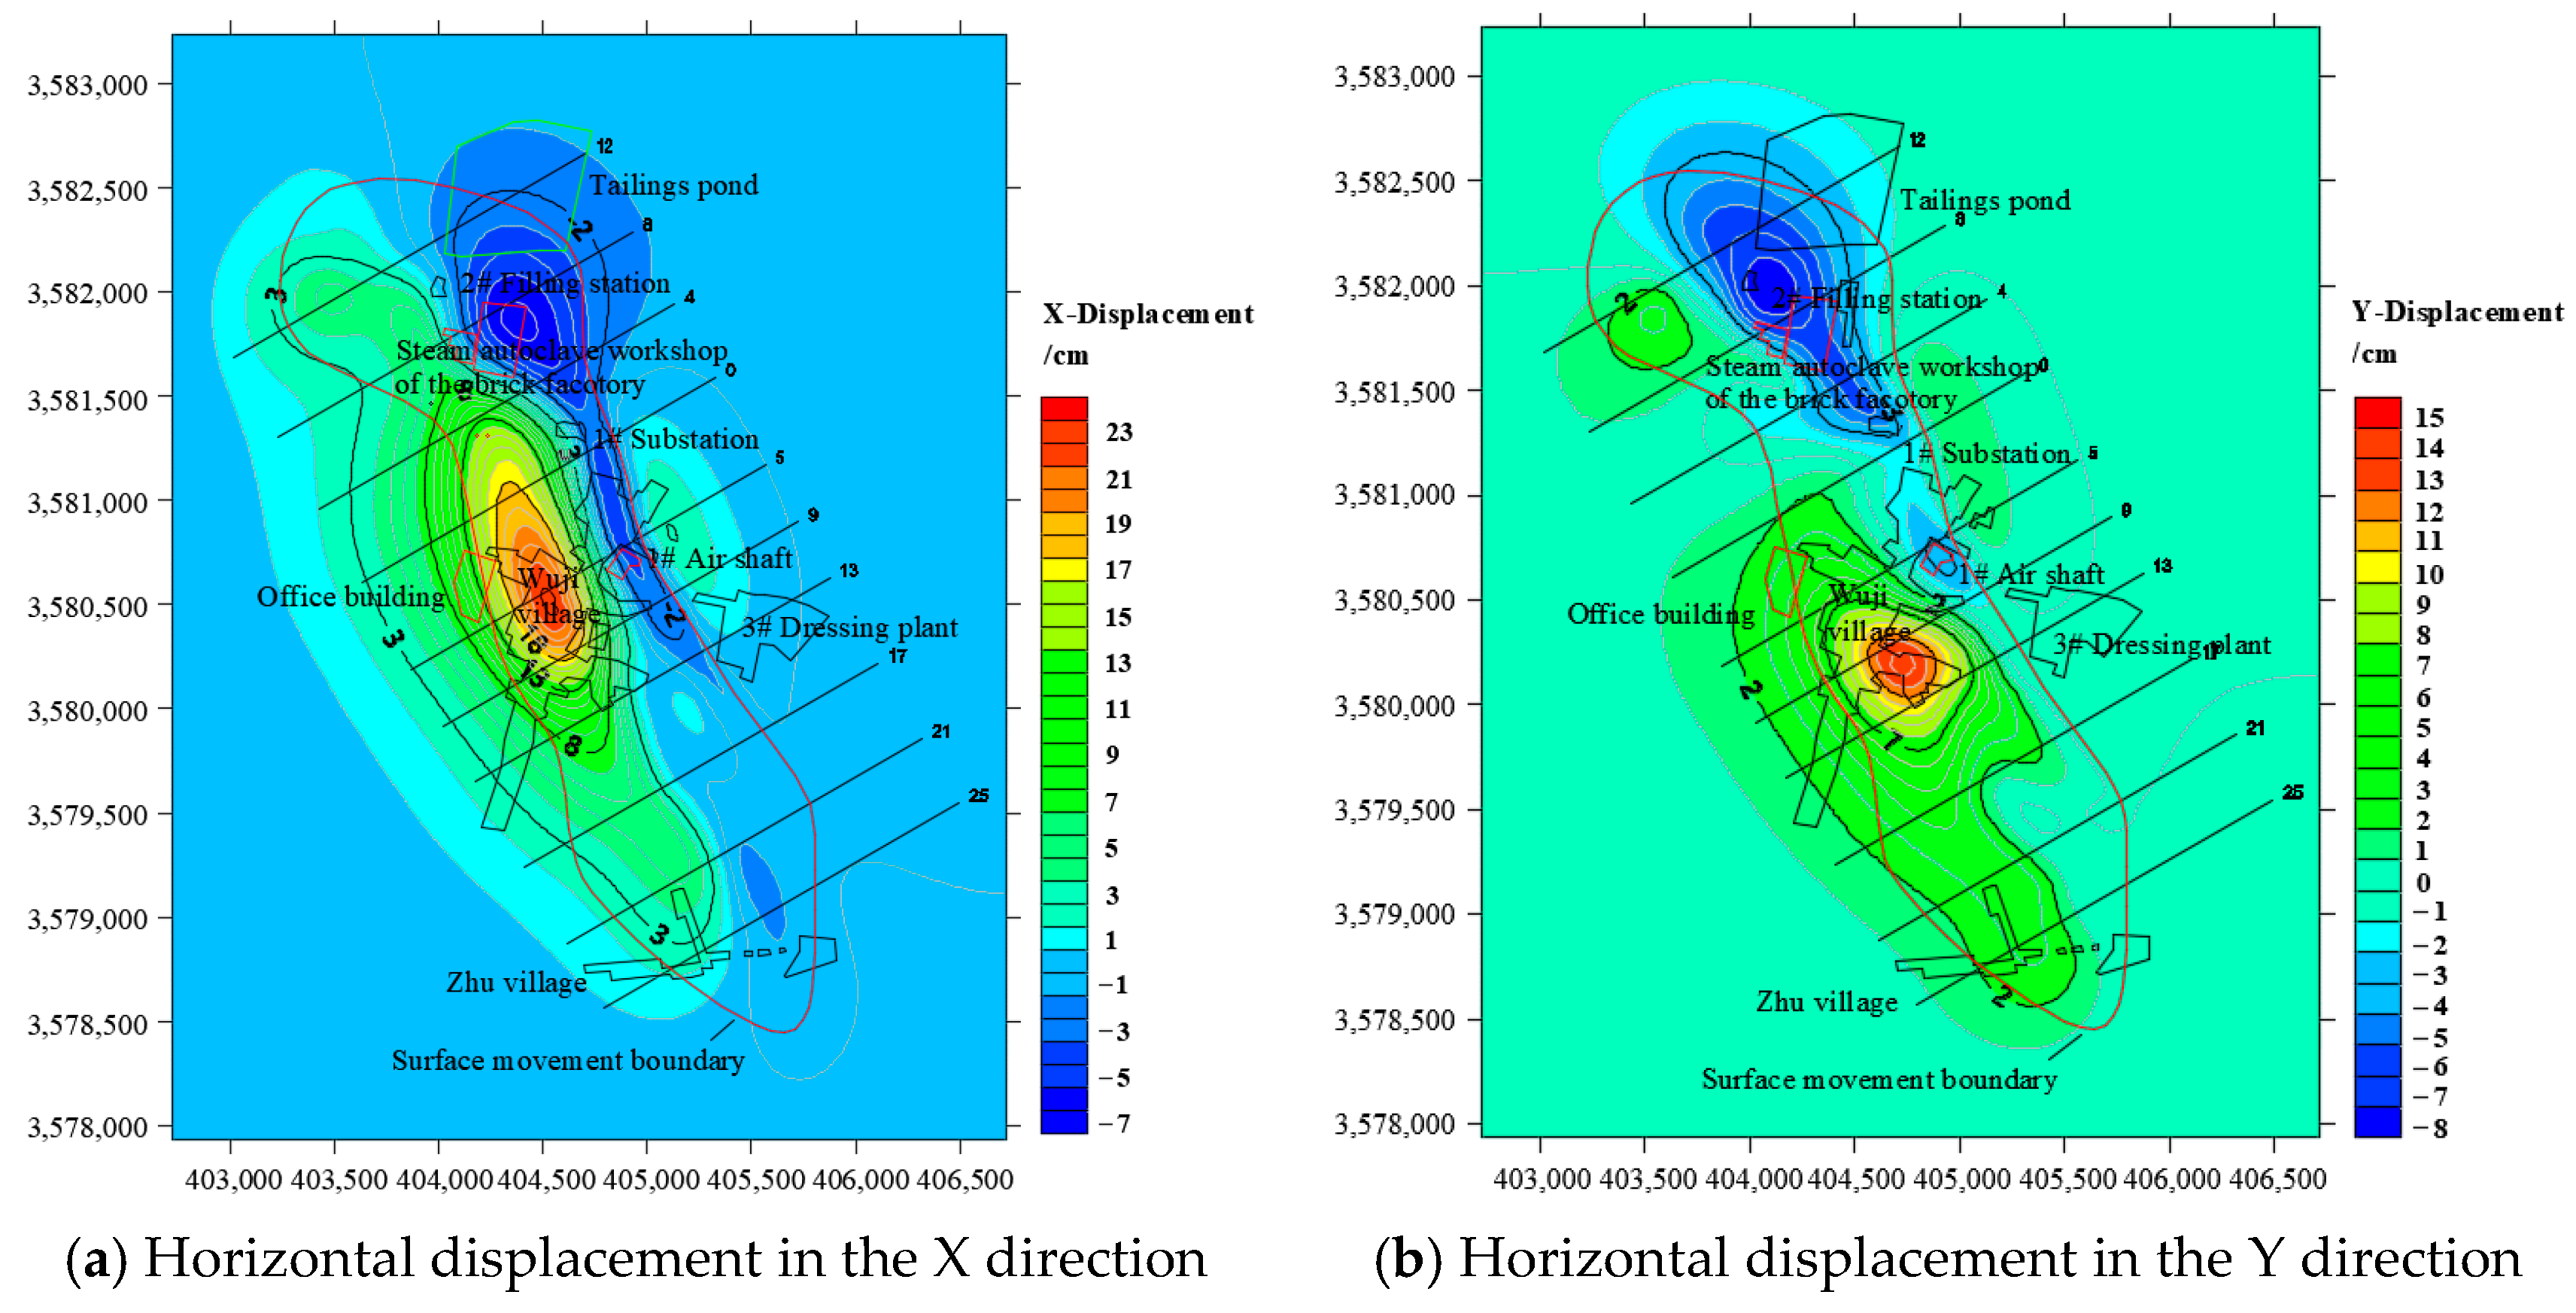
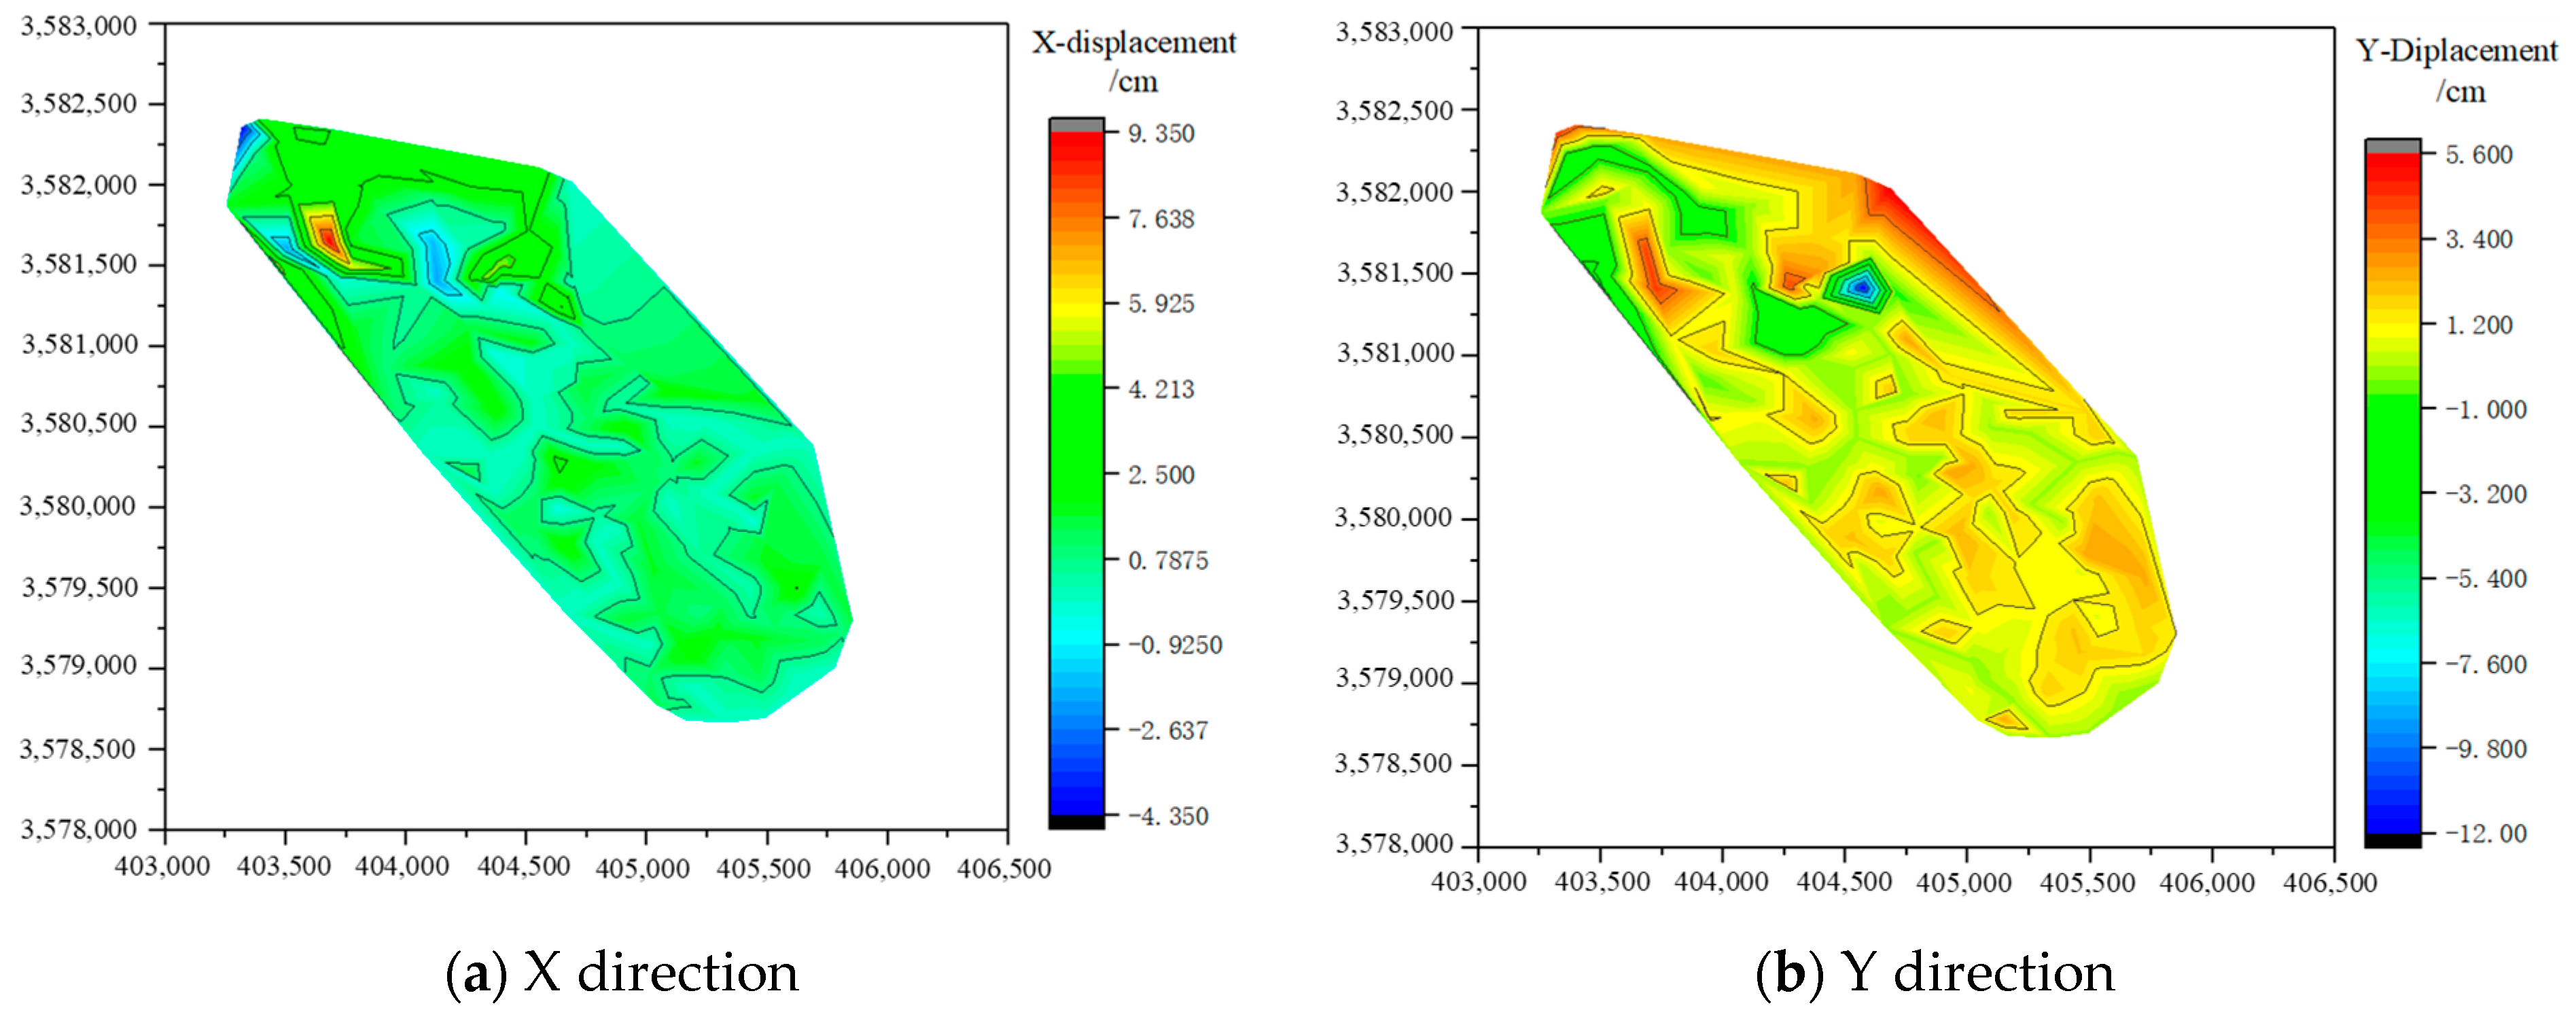
4.3.3. Horizontal Deformation of the Surface

The horizontal deformation of the surface has a significant destructive effect on buildings, especially the impact of tensile deformation. Figure 11 shows the cloud map of surface horizontal displacement in the X and Y directions, while Figure 12 shows the cloud map of surface horizontal deformation in the X and Y directions. It can be seen that there are two extreme points for horizontal displacement and deformation in the X direction, located near the steam autoclave workshop of the brick factory (line 8) and in the center of Wuji village (lines 5–9). The extreme points of horizontal displacement and deformation in the Y direction are located near the filling station (line 8), near the 1# air shaft (line 5), and in the center of Wuji village (line 9). Although there are fewer extreme points for horizontal deformation in the X direction, the deformation value is greater than that in the Y direction. The maximum horizontal deformation values in the X and Y directions near the steam autoclave workshop are 1.05 mm/m and 0.47 mm/m, respectively. This is mainly because the distribution pattern of horizontal deformation on the surface is closely related to the occurrence status of ore bodies, and the extreme point of deformation mainly appears in the upper wall of the inclined ore body and the edge of the horizontal ore body. The ore body in the Wuji iron mine ranges from tilted to steeply inclined, and has a SW–W tendency. Horizontal surface displacement frequently occurs on the hanging wall of the ore body, mainly in the SW–W direction. Therefore, the surface displacement in the X direction is relatively large, while the displacement in the Y direction is relatively small. According to the relevant provisions of the Code for Design of Nonferrous Metal Mining, the above surface deformation values are all lower than the allowable critical deformation value of buildings and structures by 2 mm/m.

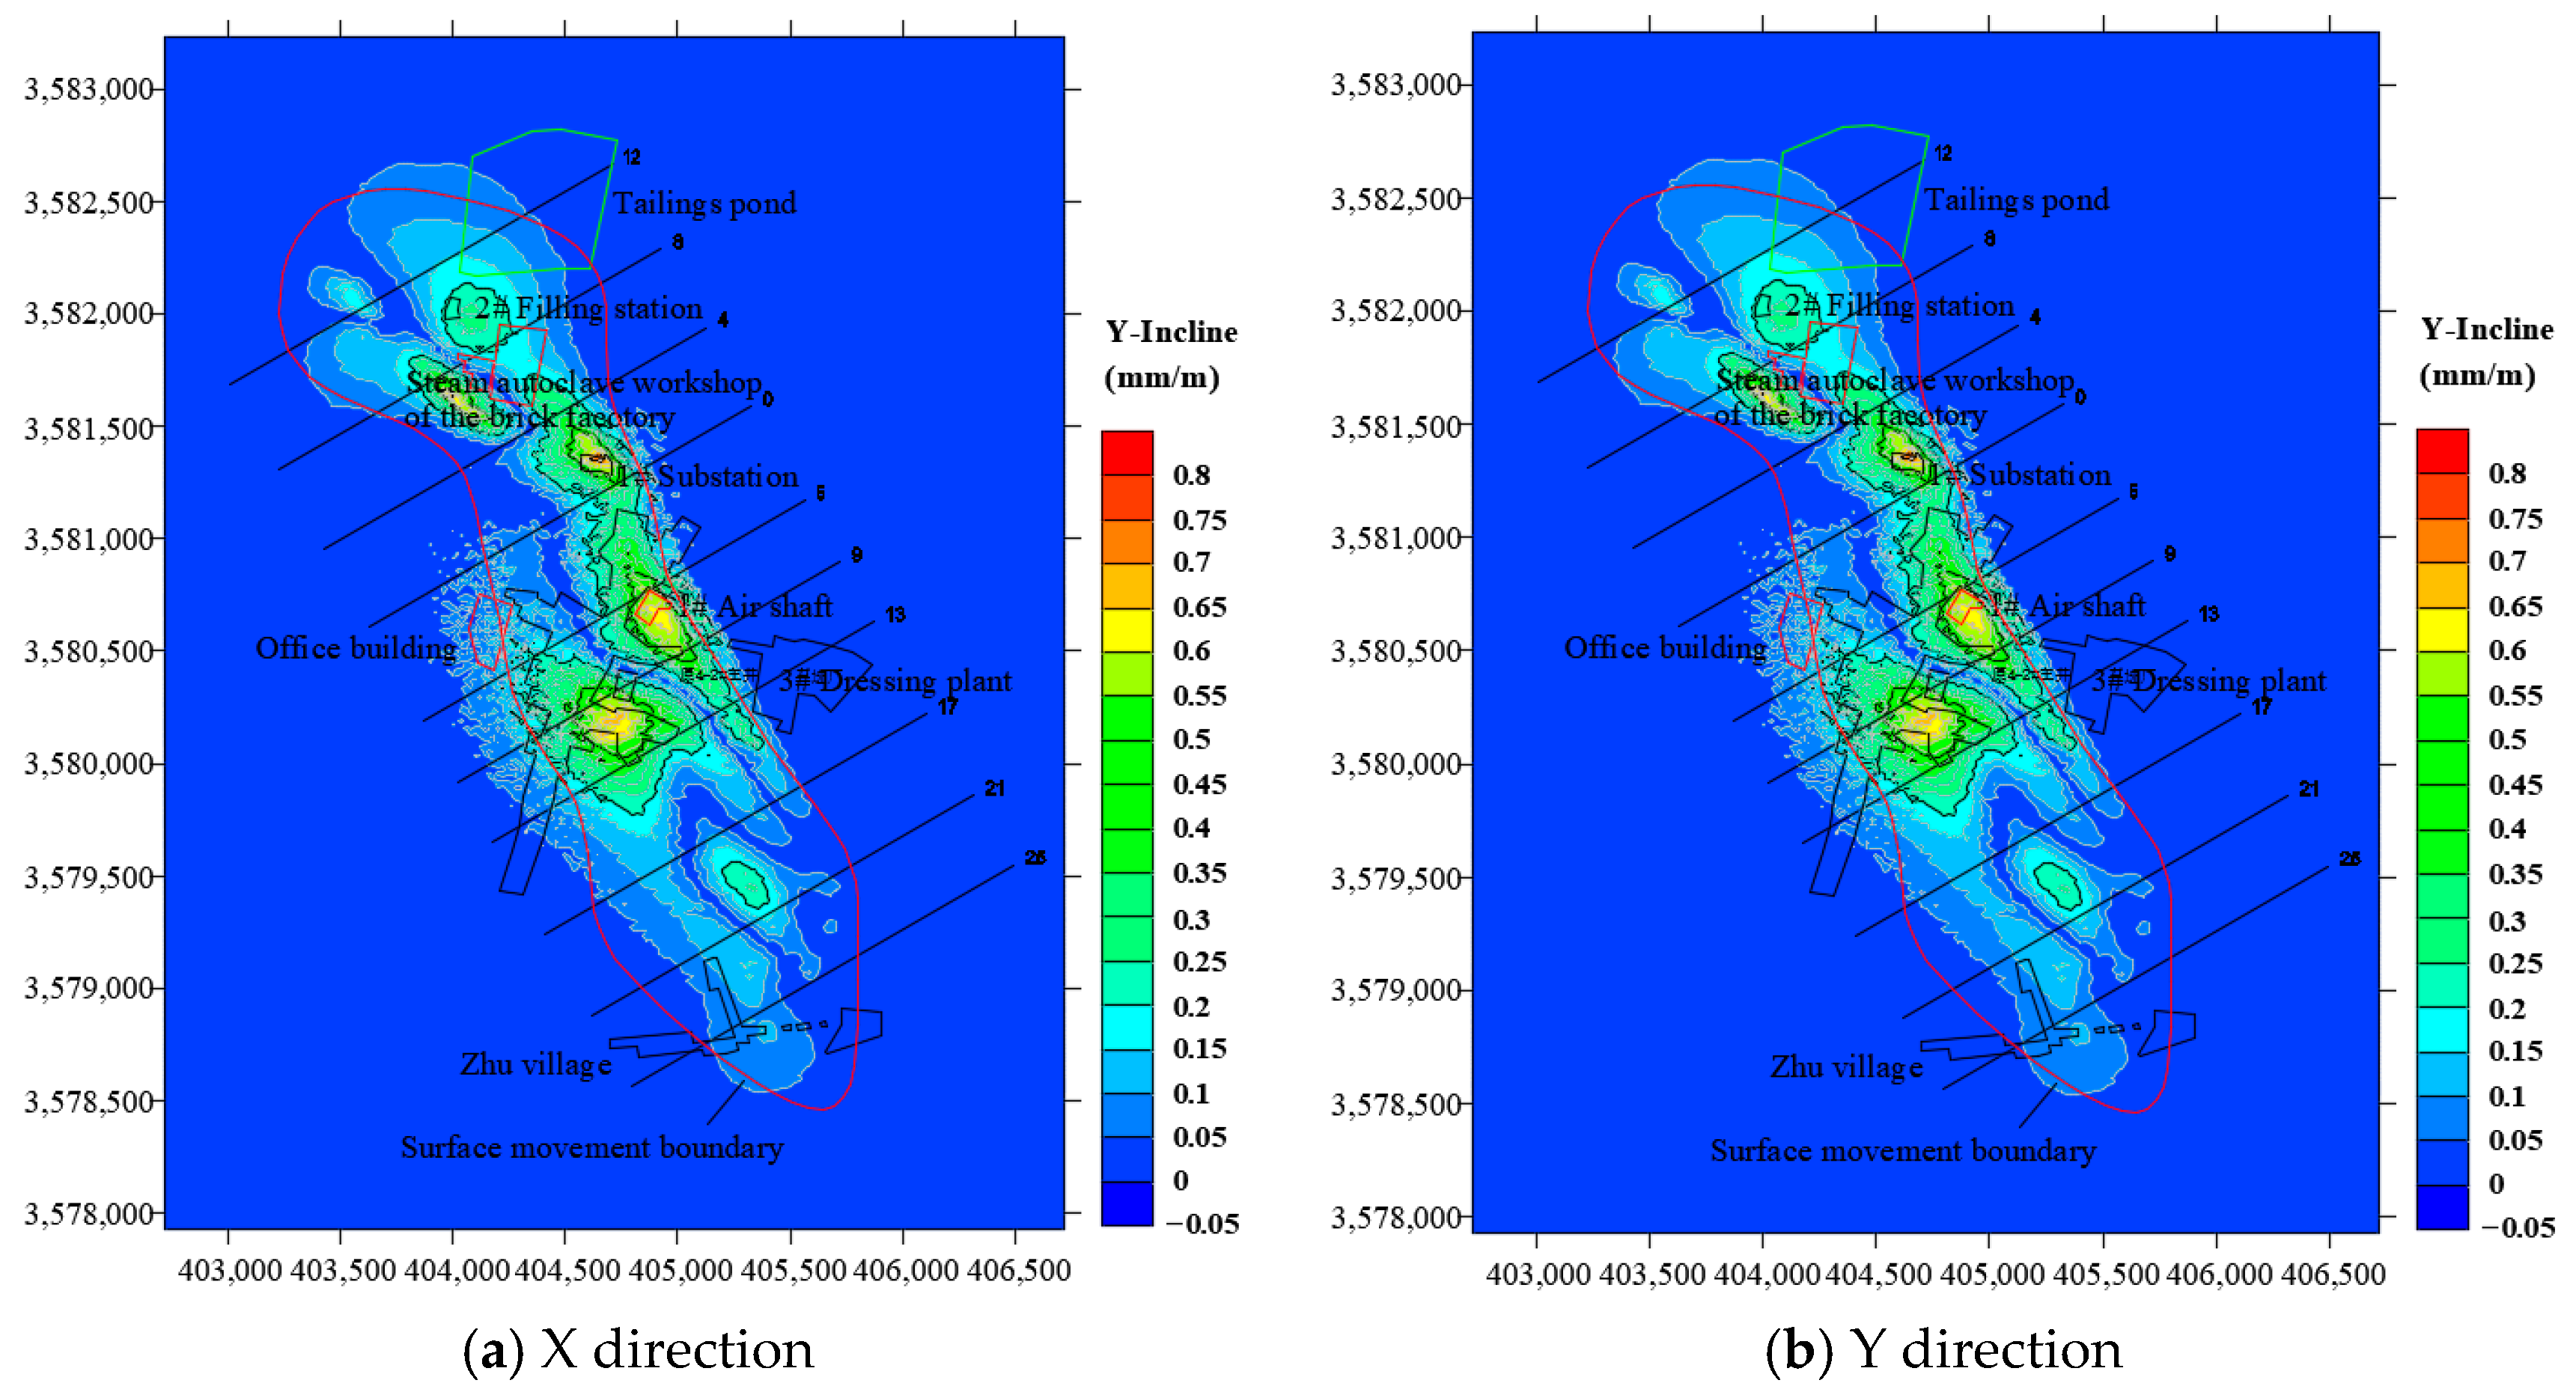
4.3.4. Surface Inclination Characteristics

The ground inclination can cause the center of gravity of buildings to shift. This not only affects the stability of the building, but also causes additional stress inside the building and the redistribution of the bearing capacity of the foundation. Figure 13 shows a cloud map of the surface inclination. It can be seen that the distribution of surface inclination is related to the ore body. The surface inclination in the X direction is distributed in a strip along the direction of the ore body, while that in the Y direction displays a block-like distribution. There are two extreme points in the surface inclination of the X direction, which are all located near line 5. One is from the 1# air shaft to Wuji village (1.24 mm/m), and the other is in the central area of Wuji village (0.87 mm/m). There are four extreme points in the surface inclination of Y located near the steam autoclave workshop of the brick factory (lines 4–8, 0.71 mm/m), the 1# substation (line 0, 0.76 mm/m), the 1# air shaft (line 5, 0.66 mm/m), and the southeast of Wuji village (lines 9–13, 0.69 mm/m). Although there are fewer extreme points of surface inclination in the X direction than in the Y direction, the extreme values in the X direction are all greater than those in the Y direction. According to the relevant provisions of the Code for Design of Nonferrous Metal Mining, the above surface deformation values are all lower than the allowable critical deformation value for buildings and structures by 3 mm/m.

4.3.5. Surface Curvature Characteristics

Surface curvature represents the degree of change in surface inclination. The existence of surface curvature makes the surface change from its original plane to a curved surface, and then causes the redistribution of foundation reactions in buildings and structures, changing from the original uniform foundation reaction and forming loading and unloading zones. Figure 14 shows the cloud map of surface curvature in this mining area. It can be seen that the distribution range of surface curvature in the mining area is relatively large, but there are no exact extreme points of the surface curvature. The maximum curvature of the mining area in the X direction is 0.02 × 10⁻³/m, and that in Y direction is 0.017 × 10⁻³/m. According to the relevant provisions of the Code for Design of Nonferrous Metal Mining, the above surface deformation values are all lower than the allowable critical deformation value of 0.2 × 10⁻³/m for buildings and structures. Therefore, the damage caused to buildings by the underground mining activities would be relatively small.

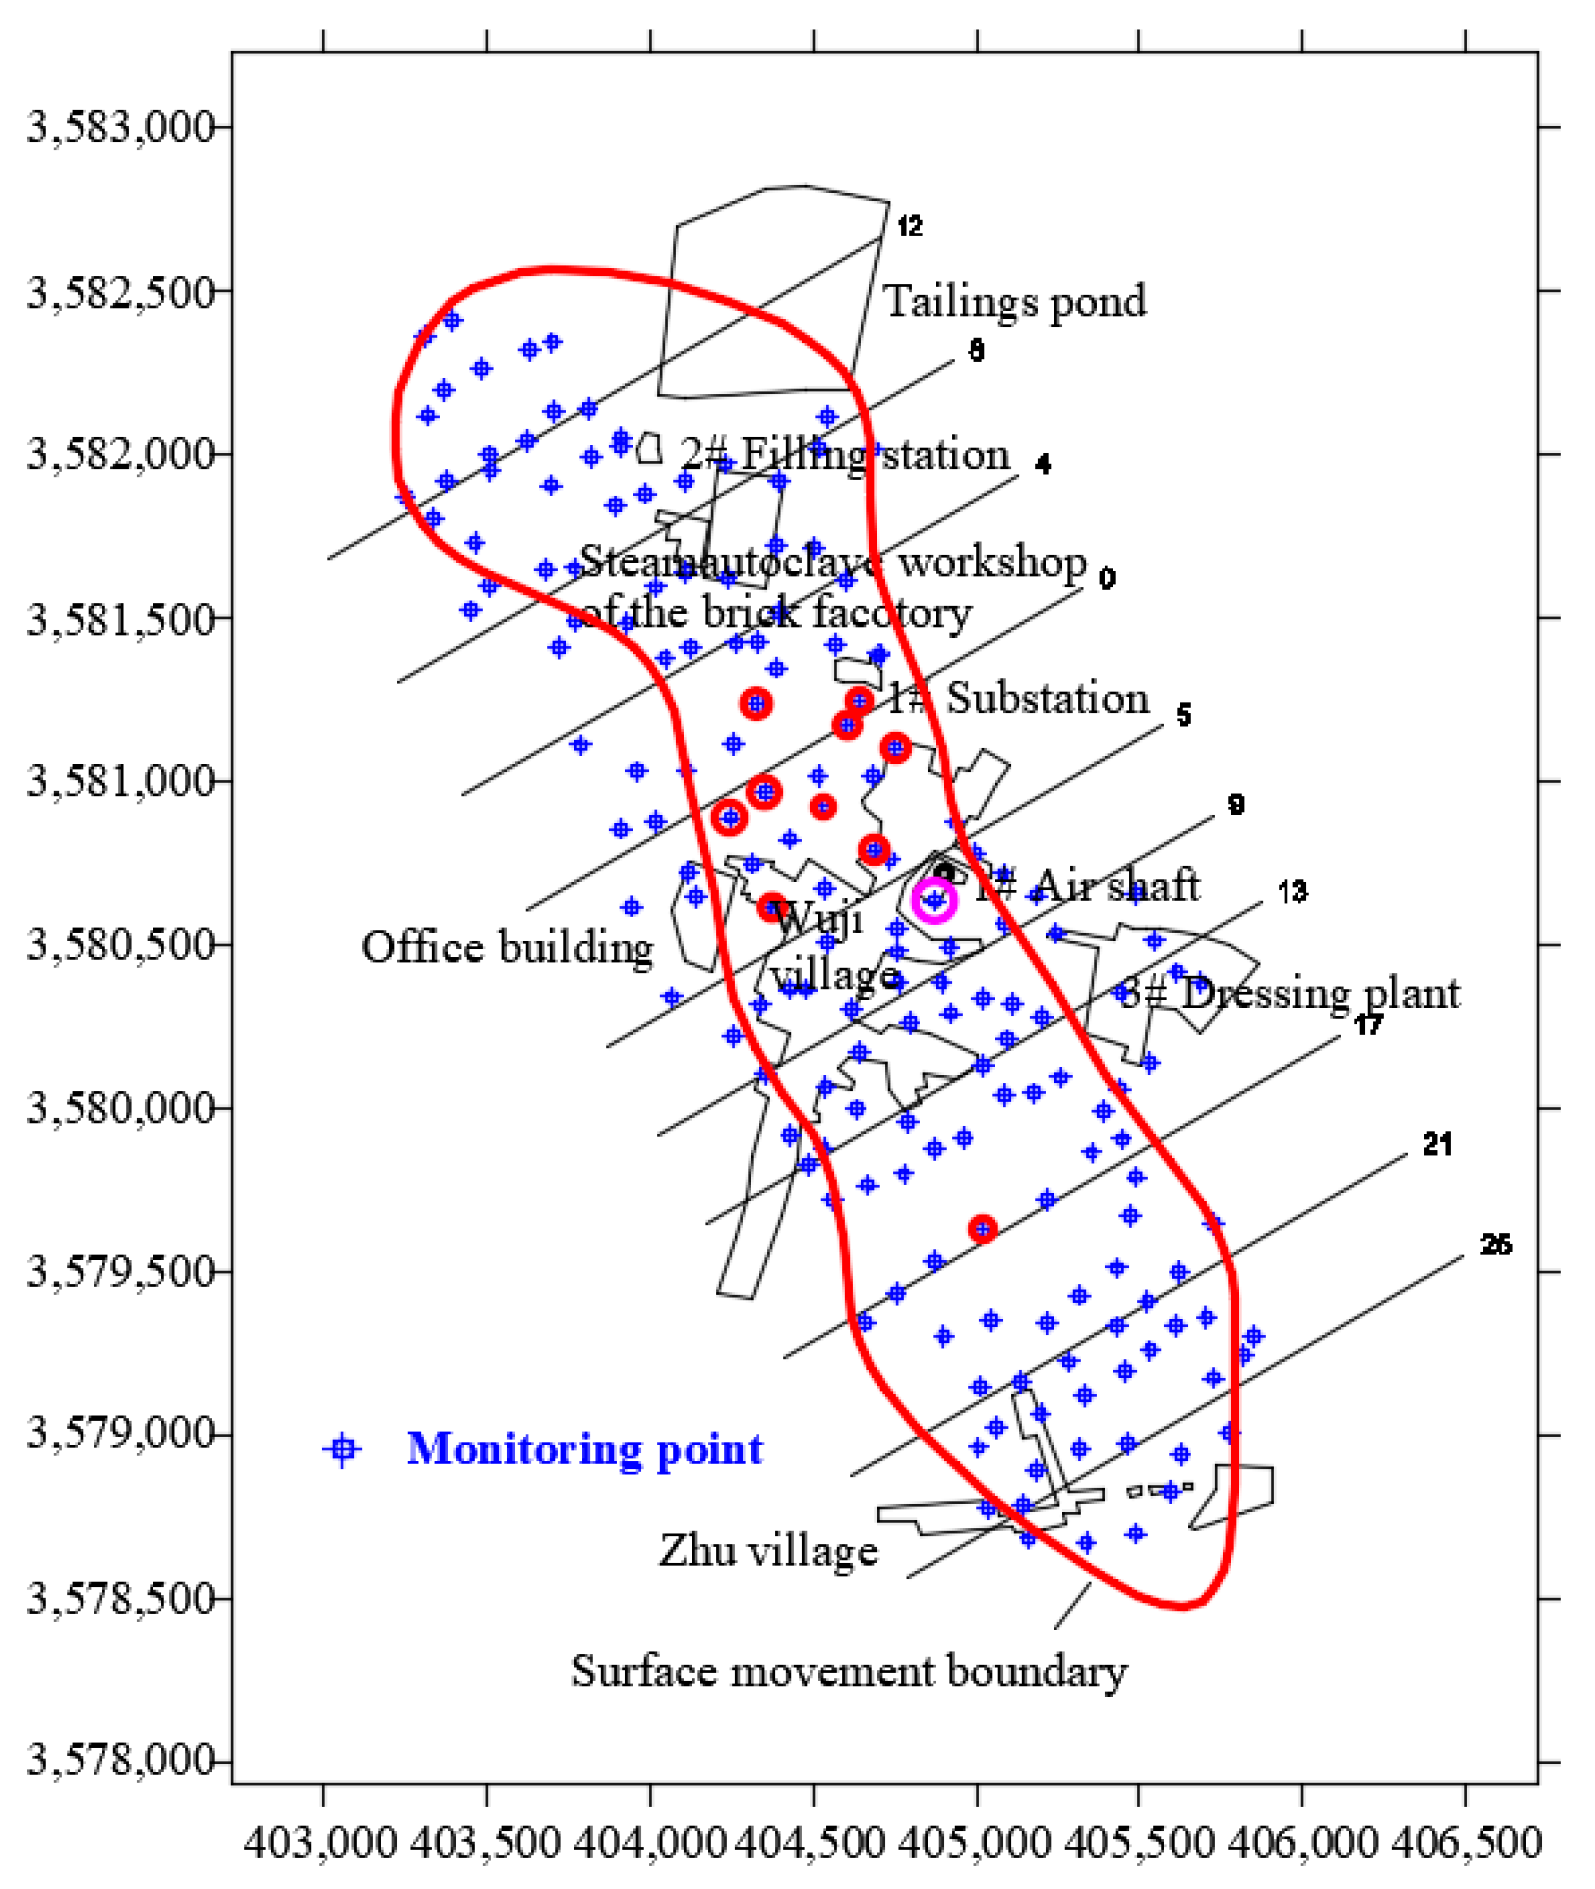
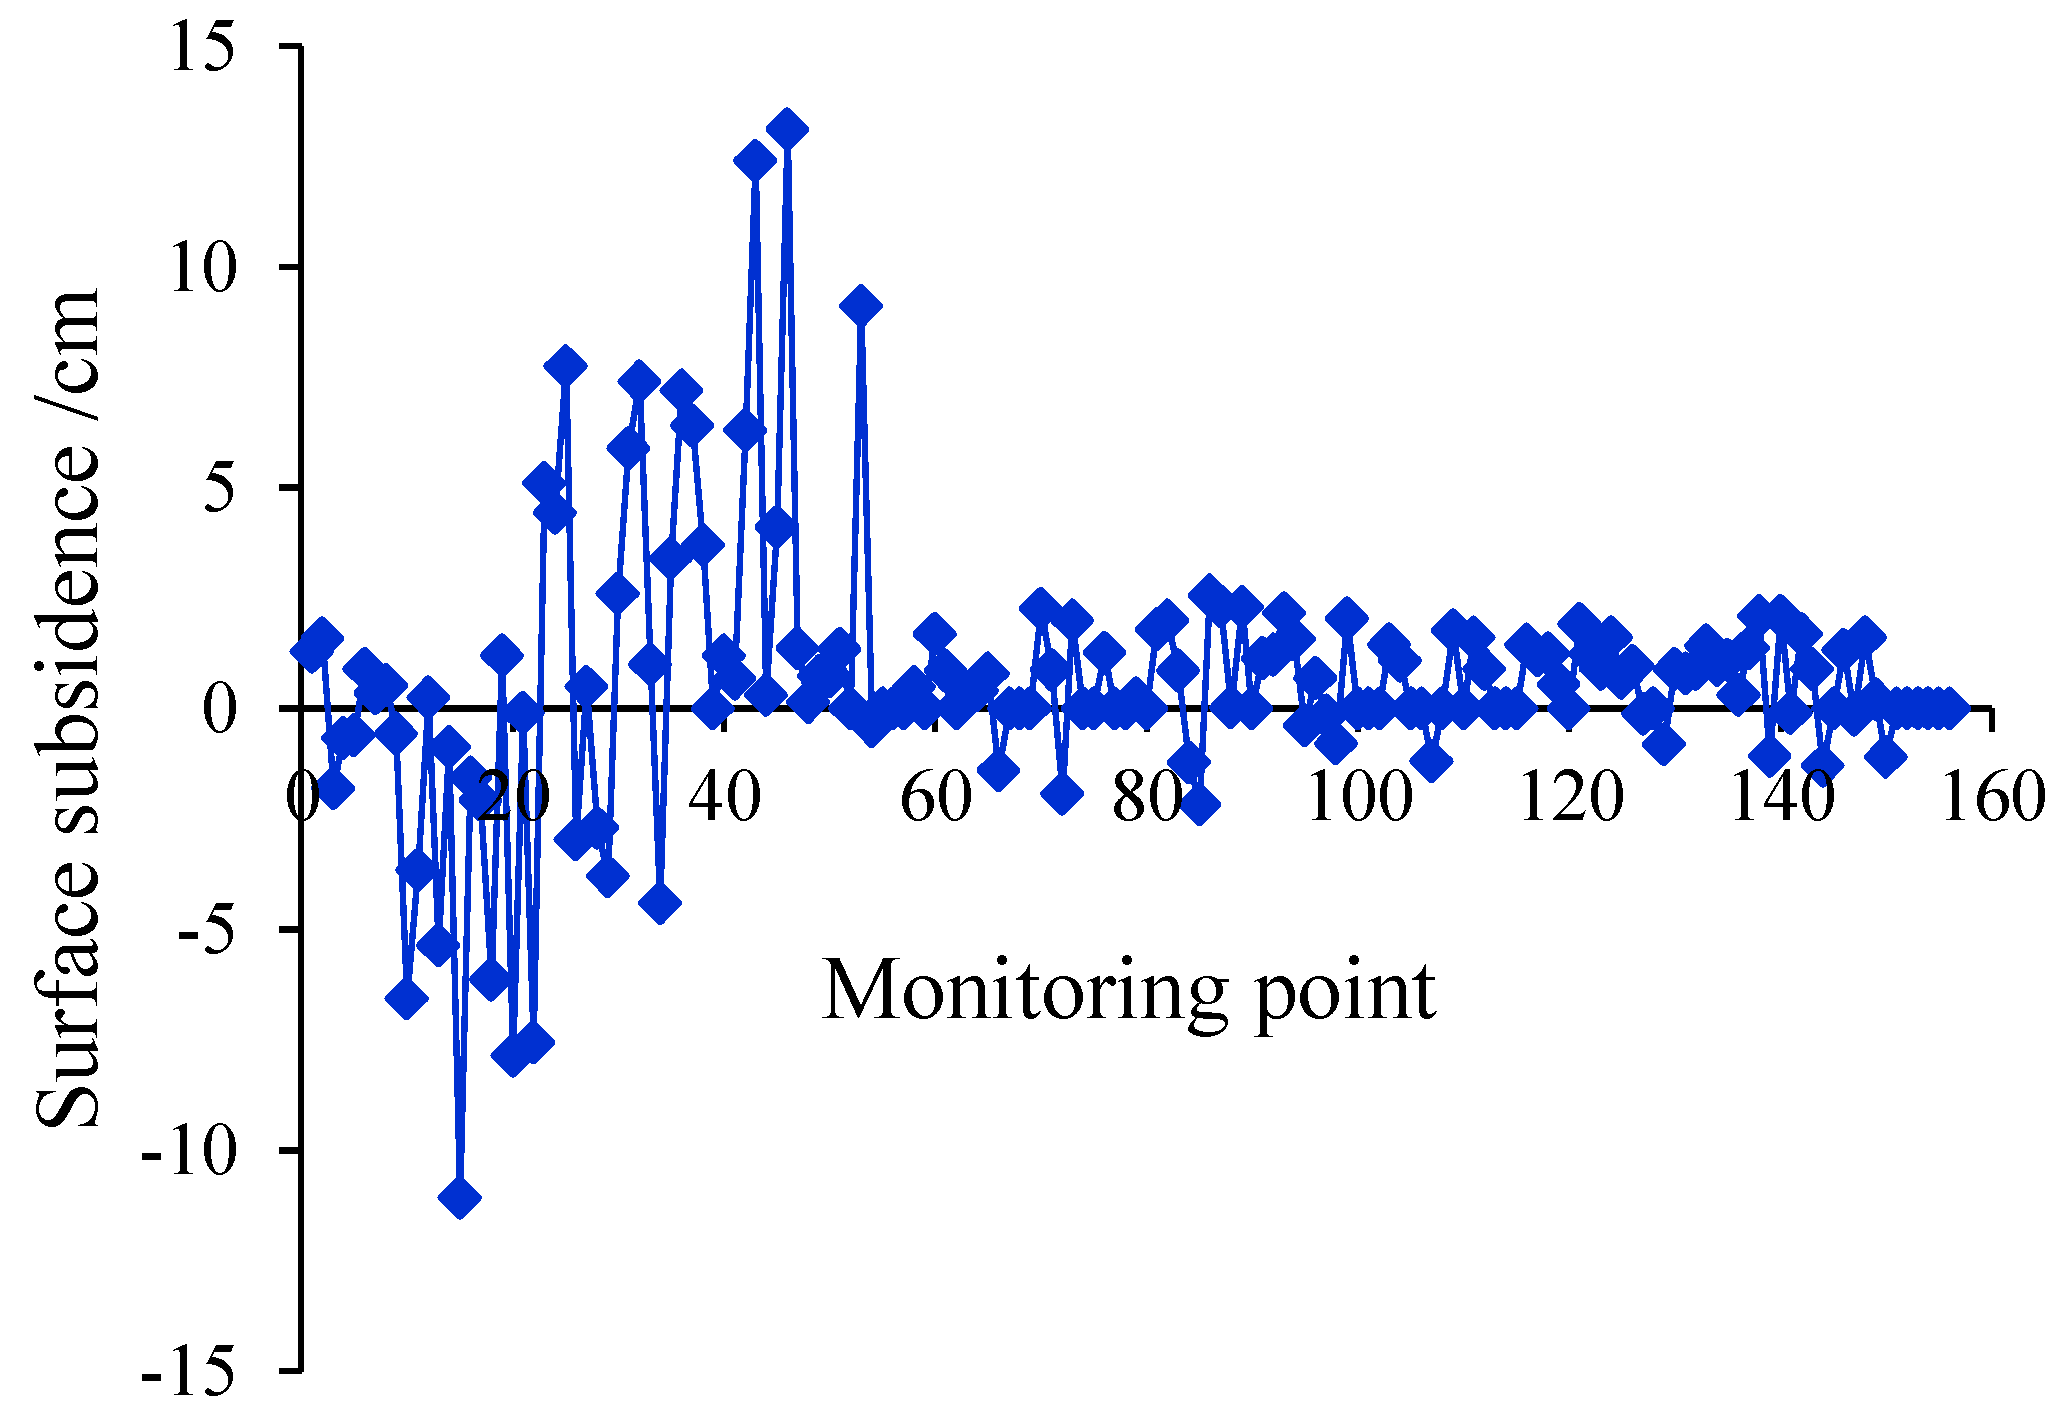
5. On-Site Monitoring

To protect surface buildings and structures in the mine, shallow ore bodies are not mined and roof pillars are left in. According to the distribution of surface buildings and structures, the maximum mining depth in the area north of line 0 is −95 m, while that in the area south of line 0 is −130 m. As of June 2021, the mining area has reached the middle section of −310 m.
To accurately study the surface deformation law caused by the underground mining of the Wuji iron mine, 156 displacement monitoring points were arranged on the surface of the mining area in 2013. The RTK and electronic dumpy level were used for displacement monitoring. Figure 15 shows the location distribution of surface displacement monitoring points.
According to the surface displacement monitoring data of the mine from June 2021, the settlement and horizontal displacement of each monitoring point were plotted, as shown in Figure 16 and Figure 17. Due to the large number of monitoring points, some monitoring points were selected longitudinally along the ore body. The maximum subsidence value is 11 cm with local fluctuation, and the maximum fluctuation value is 13 cm. The maximum surface displacement in the X direction of the mining area is 8 cm, and that in the Y direction is 12 cm.
To study the change in surface deformation at different locations, the distribution of surface subsidence and horizontal displacement was obtained, as shown in Figure 18 and Figure 19. It can be seen that the surface deformation of the mining area is consistent with the mining direction of the ore body. The larger values of surface subsidence and horizontal displacement in the mining area occur in the area north of line 0. This is mainly because the depth of the highest mining middle section in the mining area north of line 0 is shallower than the highest mining depth in the mining area south of line 0. Moreover, there are more ore bodies extracted in the mining area north of line 0, and the surface is severely affected by mining. The distribution of surface displacement and subsidence in the mining area is consistent with the current mining situation.

6. Conclusions

Based on underground mining theory and engineering practice, the mining method of the mining area was determined, a detailed study was conducted on the surface deformation under this mining method, and the movement of ground under buildings during complex iron ore mining was described.
(1)
Based on the engineering geological conditions of the Wuji iron mine, a comprehensive evaluation was conducted of the mining scheme in terms of mining technology, mining safety, economic benefits, and other aspects, and the VCR delayed backfilling method was finally selected for mining.
(2)
The stress concentration occurs at the top of the ore body and in some surrounding rocks between the ore veins. This is mainly because the rock mass between the ore veins supports the top surrounding rock, and the direction of the principal stress is consistent with that of the main bearing capacity of the rock mass. Therefore, the surrounding rocks of the hanging walls and footwalls of ore veins should be protected to reduce damage to the surrounding rock caused by blasting during the mining process.
(3)
The distribution pattern of surface subsidence obtained from numerical simulation is the same as that obtained by on-site monitoring, which is consistent with that of the ore body (NW trend). After the mining of the ore body is completed, the maximum subsidence area appears in the middle zone of the ore body, followed by the northern zone, and the stress concentration is the smallest in the southernmost zone of the ore body.
(4)
The gradual accumulation of deformation in the surrounding rock is the main cause of mining-induced rock deformation in the mining area, ultimately affecting surface deformation. The maximum value of surface settlement in this mining area is 33 cm, which is less than the specified critical value of surface subsidence.
(5)
The surface deformation is related to the strike of the ore body, and the surface deformation in the X direction is greater than that in the Y direction of the mining area. The maximum horizontal deformation in the X and Y directions are 1.05 mm/m and 0.47 mm/m, respectively, the maximum curvature in the X and Y directions are 0.02 × 10⁻³/m and 0.017 × 10⁻³/m, respectively, and the maximum inclination in the X and Y directions are 1.24 mm/m and 0.76 mm/m, respectively. The above surface deformation values are all smaller than the allowable critical deformation values of buildings and structures specified in the Code for Design of Nonferrous Metal Mining.
(6)
This research provides a theoretical basis and engineering guidance for the prevention and control of surface deformation during mining under buildings and structures.

Author Contributions

All the authors contributed to publishing this paper. H.L. conceived and designed the research. Z.G. performed the field investigations and experiments, presented the numerical simulation. X.H. and H.L. wrote the original manuscript. B.D., X.Z. and Y.Z. participated in the data analysis and manuscript modification. All authors have read and agreed to the published version of the manuscript.

Funding

The State Key Laboratory of Safety and Health for Metal Mines (2021-JSKSSYS-02), Key project of Natural Science research in Universities of Anhui Province (KJ2021A0455), and Research Start-up Fund for introduction of talents of Anhui University of Science and Technology (2021yjrc01).

Institutional Review Board Statement

Not applicable.

Informed Consent Statement

Not applicable.

Data Availability Statement

Data are available upon request from the authors.

Acknowledgments

Great appreciation goes to the editorial board and the reviewers of this paper.

Conflicts of Interest

No potential conflict of interests were reported by the authors.

References

  1. Lian, D.; Wang, Y. Comprehensive evaluation system of “three under” coal mining. J. China Univ. Min. Technol. 2005, 1, 100–104. (In Chinese) [Google Scholar]
  2. Cheng, L.; Li, X.; Ye, Z.; Sun, X. Surface stability analysis of “three under” mining within subsidence basin in a gold mine. Met. Mine 2019, 3, 56–61. (In Chinese) [Google Scholar]
  3. Guo, W.; Ma, Z.; Bai, E. Current status and prospect of coal mining technology under buildings, water bodies and railways, and above confined water in China. Coal Sci. Technol. 2020, 48, 16–26. (In Chinese) [Google Scholar]
  4. Xu, M. Mining Induced Failure Characteristics and Deformation Prediction Method of High-Grade Highway; China University of Mining and Technology: Beijing, China, 2017. [Google Scholar]
  5. Yi, Z. Research on Safety Technology of “Three Under” Resources Exploitation of Xinqiao Mining; Central South University: Changsha, China, 2008. [Google Scholar]
  6. Villegas, T.; Nordlund, E.; Dahnér-Lindqvist, C. Hangingwall surface subsidence at the Kiirunavaara Mine, Sweden. Eng. Geol. 2011, 121, 18–27. [Google Scholar] [CrossRef]
  7. Villegas Barba, T.F.; Nordlund, E. Numerical analyses of the hangingwall failure due to sublevel caving: Study case. Int. J. Min. Miner. Eng. 2013, 4, 201–223. [Google Scholar] [CrossRef]
  8. Marschalko, M.; Yilmaz, I.; Křístková, V.; Fuka, M.; Bednarik, M.; Kubečka, K. Determination of actual limit angles to the surface and their comparison with the empirical values in the Upper Silesian Basin (Czech Republic). Eng. Geol. 2012, 124, 130–138. [Google Scholar] [CrossRef]
  9. Jing, W.; Zhang, G. Study on “Three-under” mining techniques in South area of the Xikuangshan mine. Hunan Nonferrous Met. 2003, 6, 1–4. (In Chinese) [Google Scholar]
  10. Wang, S.; Wang, K.; Ma, F.; Lu, R. Optimization of three-underground mining technology and disaster prevention in Sanshandao gold mine. Gold Sci. Technol. 2020, 28, 734–742. (In Chinese) [Google Scholar]
  11. Guo, M.; Li, J.; Li, H.; Dongxu, C. Safety impact analysis of “three under” mining for Panlong lead-zinc mine. Nonferrous Met. Eng. 2020, 10, 107–112. (In Chinese) [Google Scholar]
  12. Wu, Z.; Wang, J.; Liu, P.; Li, Z.; Chen, H. Analysis on the influence of security pillar mining on surface structures of an iron mine in shandong province. Mod. Min. 2022, 38, 207–211. (In Chinese) [Google Scholar]
  13. Guo, Q.; Ma, C.; Chen, Y. Optimization on shaft safety pillar and numerical simulation on surface deformation in “three under” mining. Min. Res. Dev. 2020, 40, 117. (In Chinese) [Google Scholar]
  14. Guo, W.; Ma, Z.; Jiao, Y.; Chen, X.; Bai, E. Coal mining under television signal tower and its dynamic tilt adjustment protection technology. J. China Coal Soc. 2023, 48, 15–27. (In Chinese) [Google Scholar]
  15. Ma, F.; Zhao, H.; Zhang, Y.; Guo, J.; Wei, A.; Wu, Z.; Zhang, Y. GPS monitoring and analysis of ground movement and deformation induced by transition from open-pit to underground mining. J. Rock Mech. Geotech. Eng. 2012, 4, 82–87. [Google Scholar] [CrossRef]
  16. Ma, F.; Zhao, H.; Yuan, R.; Guo, J. Ground movement resulting from underground backfill mining in a nickel mine (Gansu Province, China). Nat. Hazards 2015, 77, 1475–1490. [Google Scholar] [CrossRef]
  17. Zhao, H.; Ma, F.; Zhang, Y.; Guo, J. Monitoring and analysis of the mining-induced ground movement in the Longshou Mine, China. Rock Mech. Rock Eng. 2013, 46, 207–211. [Google Scholar] [CrossRef]
  18. Cai, L.; Liu, Y.; Meng, W.; Xu, Z.; Wang, S. High-voltage power lines pylons foundation subsidence dynamic prediction and monitoring method in mining area. Metal Mine 2016, 3, 168–171. (In Chinese) [Google Scholar]
  19. Zhao, Y. Mechanism analysis of surface subsidence based on the application of “three under” coal mining technology. Bull. Surv. Mapp. 2020, 6, 156–157+162. (In Chinese) [Google Scholar]
  20. Xia, K.Z.; Liu, X.M.; Chen, C.X.; Fu, H.; Zhang, H.; Zhang, J.; Wu, Y. Surface deformation in west area of Chengchao iron mine induced by underground mining. Chin. J. Rock Mech. Eng. 2014, 33, 1572–1588. (In Chinese) [Google Scholar]
  21. Long, L.; Chen, C.; Xia, K.; Deng, Y.Y. Research on the surface subsidence laws during underground mining in the west of Chengchao iron mine. Min. Res. Dev. 2016, 36, 47–52. (In Chinese) [Google Scholar]
  22. Deng, Y.; Chen, C.; Xia, K. Cause analysis of surface collapse in western area of Chengchao iron mine. Rock Soil Mech. 2019, 40, 743–758. (In Chinese) [Google Scholar]
  23. Feng, Y. Mining Subsidence Control and Drilling Grouting Engineering Example Analysis. Coal Geol. China 2022, 34, 33–38. (In Chinese) [Google Scholar]
  24. Song, X.; Chen, C.; Pang, H.; Kai-Zong, X.; Shan, C.; Kuo-Yu, Y.; Chao-Yi, S. Study of relationship between underground mining and surface deformation in metal mines. Rock Soil Mech. 2018, 39, 425–436. [Google Scholar]
  25. Li, H.; Guo, G.; Zhai, S.C. Mining scheme design for super-high water backfill strip mining under buildings: A Chinese case study. Environ. Earth Sci. 2016, 75, 1–12. [Google Scholar] [CrossRef]
  26. Yang, Z.; Zhai, S.; Gao, Q.; Li, M. Stability analysis of large-scale stope using stage subsequent filling mining method in Sijiaying iron mine. J. Rock Mech. Geotech. Eng. 2015, 7, 87–94. [Google Scholar] [CrossRef]
  27. Li, B.; Lan, J.; Si, G.; Lin, G.; Hu, L. NMR-based damage characterisation of backfill material in host rock under dynamic loading. Int. J. Min. Sci. Technol. 2020, 30, 329–335. [Google Scholar] [CrossRef]
  28. Hoek, E.; Carranza-Torres, C.; Corkum, B. Hoek-Brown failure criterion-2002 Edition. In Proceedings of the North American Rock Mechanics Society, Toronto, QC, Canada, 7–10 July 2002. [Google Scholar]
  29. Hoek, E.; Brown, E.T. Practical estimates of rock mass strength. Int. J. Rock Mech. Min. Sci. 1997, 34, 1165–1186. [Google Scholar] [CrossRef]
Figure 1. Distribution of surface buildings in Wuji iron mine.
Sustainability 15 14733 g001
Figure 2. VCR delayed backfilling method.
Sustainability 15 14733 g002
Figure 3. 3D Numerical grid model of Wuji iron mine.
Sustainability 15 14733 g003
Figure 4. Stress vector in the surrounding rock.
Sustainability 15 14733 g004
Figure 5. Displacement cloud diagram.
Sustainability 15 14733 g005
Figure 6. Schematic diagram for calculation of surface inclination, curvature, and horizontal deformation.
Sustainability 15 14733 g006
Figure 7. Cloud map of surface subsidence.
Sustainability 15 14733 g007
Figure 8. 3D schematic diagram of surface subsidence.
Sustainability 15 14733 g008
Figure 9. Cross-section of surface subsidence along the exploration line.
Sustainability 15 14733 g009
Figure 10. Longitudinal section of surface subsidence in the mining area.
Sustainability 15 14733 g010
Figure 11. Cloud map of surface horizontal displacement.
Sustainability 15 14733 g011
Figure 12. Cloud map of horizontal surface deformation.
Sustainability 15 14733 g012
Figure 13. Cloud map of surface inclination.
Sustainability 15 14733 g013
Figure 14. Cloud map of surface curvature.
Sustainability 15 14733 g014aSustainability 15 14733 g014b
Figure 15. Distribution of surface monitoring points in the mining area.
Sustainability 15 14733 g015
Figure 16. Subsidence values of surface monitoring points in the mining area.
Sustainability 15 14733 g016
Figure 17. Horizontal displacement of surface monitoring points in the mining area.
Sustainability 15 14733 g017
Figure 18. Subsidence distribution map of surface monitoring points in the mining area.
Sustainability 15 14733 g018
Figure 19. Horizontal displacement distribution of surface monitoring points in the mining area.
Sustainability 15 14733 g019
Table 1. Qualitative relative evaluation of mining methods.
No.ContentScheme IScheme IIScheme III
1Mining techniquesSimpleSimpleSimple
2Backfilling techniquesComplexComplexComplex
3Adaptability to ore bodyPoorPoorPoor
4Worker proficiencySkilledRequires trainingSkilled
5Production efficiencyGeneralHighHigh
6Safe working conditionsExcellentGeneralGeneral
7Mining equipment investmentHighHighHigh
8Bulk fractionHighHighHigh
9Mining costs66 CNY/t64 CNY/t63 CNY/t
10Recycling rateHighMediumLow
Table 2. Physical and mechanical parameters of rock samples.
CategoryDensity
(g/cm3)
Compressive Strength
(MPa)
Tensile Strength
(MPa)
Elastic Modulus
(GPa)
Poisson Ratio μCohesion (MPa)Internal Friction Angle (°)
Surrounding rock2.84124.567.6260.230.2316.6043.85
Ore body3.49163.5915.0162.340.2053.2542.43
Weathering zone2.6850.475.5534.970.2611.0844.36
Quaternary 1.921.650.170.230.350.0325.00
Backfilling body1.834.350.310.570.250.5660.00
Table 3. Hoek–Brown parameter values.
Rock FormationGSI Valuemimbsa
Ore body65295.4770.00940.502
Surrounding rock45292.1130.00070.508
Weathering zone20120.6890.00010.544
Table 4. Physical and mechanical parameters of rock masses.
CategoryCompressive Strength
(MPa)
Tensile
Strength
(MPa)
Deformation
Modulus
(GPa)
Poisson Ratio μCohesion (MPa)Internal Friction Angle
(°)
Surrounding rock31.760.7521.140.231.8642.38
Ore body45.922.7625.120.203.7241.76
Weathering zone12.630.5311.260.261.5343.12
Quaternary0.410.040.120.350.0118.00
Backfilling body4.350.310.570.250.5620.00
Table 5. Allowable values for surface displacement and deformation of buildings and structures.
Buildings and
Structures
Protection Level
Inclination
(mm × mm)
Curvature k
(10−3/m)
Horizontal
Deformation ε
(mm × mm)
±3±0.2±2
±6±0.4±4
III±10±0.6±6
IV±10±0.6±6
Disclaimer/Publisher’s Note: The statements, opinions and data contained in all publications are solely those of the individual author(s) and contributor(s) and not of MDPI and/or the editor(s). MDPI and/or the editor(s) disclaim responsibility for any injury to people or property resulting from any ideas, methods, instructions or products referred to in the content.

