Article

Recycling of Metallized Plastic as a Case Study for a Continuous Sustainability Improvement Process

1
Institute of Applied Resource Strategies IARS, SRH Berlin University of Applied Sciences, Ernst-Reuter-Platz 10, 10587 Berlin, Germany
2
ABCircular GmbH, Magnusstraße 11, 12489 Berlin, Germany
3
Fraunhofer Applied Research Centre for Resource Efficiency ARess, Brentanostr. 2a, 63755 Alzenau, Germany
4
Fraunhofer Research Institution for Materials Recycling and Resource Strategies IWKS, Aschaffenburgerstr. 121, 63457 Hanau, Germany
*
Author to whom correspondence should be addressed.
Sustainability 2023, 15(20), 14737; https://doi.org/10.3390/su152014737
Submission received: 28 July 2023 / Revised: 18 September 2023 / Accepted: 25 September 2023 / Published: 11 October 2023

Abstract

:
Emerging technological processes should be designed and operated according to the highest technological performance and sustainability standards. For this reason, assessments should be included during the design stage to track technological, environmental, economic, and social sustainability impacts. This study presents the concept of a Continuous Sustainability Improvement Process (CSIP) with the case study of project ReComp (Development of an Economically and Ecologically Sensible Recycling Method for Metal/Plastic Composites). In this project, metallized plastic production waste from the automotive industry was recycled to produce high-purity copper (Cu), chromium (Cr), and plastic, i.e., Polycarbonate/Acrylonitrile Butadiene Styrene (PC/ABS). Through CSIP, two stages of ReComp were developed, ReComp I and ReComp II. ReComp I was found to provide a significant environmental improvement compared to the primary production for Cu, Cr, and PC/ABS (>90% improvement for all environmental indicators). However, it was calculated as making 17,000 EUR/annum loss, with a unit processing cost of 103 EUR/kg of waste input and therefore was deemed as not economically sustainable. From this outcome, ReComp II was developed with the purpose of improving the economic outcome by increasing the process’s throughput without the need for significant additional costs. Therefore, the mechanical treatment at the first process step was modified in such a way that the metallized plastics were separated into two fractions, metal flakes and plastic particles. Using these fractions in two parallel process streams, the cycle time was reduced from 15 to 5 days, and throughput of the process-limiting step (electrochemical treatment) increased. Although still not profitable, ReComp II was shown to reduce the process cost per kg of waste input by 93% compared to ReComp I, whilst maintaining the same revenue per kg of waste input. Additionally, ReComp II was shown to provide an improved environmental outcome compared to ReComp I. Therefore, this study proves an important result that a more ecologically sustainable solution can correlate with a more economically sustainable process, due to lower waste formation as well as less material and energy use.

Graphical Abstract

1. Introduction

Metallized plastics are widely used in the automotive industry, primarily for decorative features, such as exterior and interior trims, grilles, emblems, and other similar parts. In decorative plating, a polymer-based material is usually electroplated with a coating of copper, nickel, and chrome for a shiny surface finish [1].
Despite their useful features, there are several environmental issues associated with the use of primary produced metallized plastics in the automotive industry. Firstly, this industry produces high amounts of scrap material (between 10 and 30%) due to the high rejection rate during manufacturing [1,2]. In 2015, a total of 1630 tonnes of metallized plastic was scrapped from eight (8) of the twelve (12) largest German electroplating producers [2]. Following the closure of China’s borders in January 2018, much of this scrap material is now processed in countries such as Thailand and Malaysia [3]. Here, improper recycling and disposal lead to environmental pollution, overfilling of landfills, and health problems [4,5]. Furthermore, the primary production of copper, chromium, and nickel is associated with land-use-related biodiversity loss and dangerous working conditions [6]. The potential for ongoing impacts is worsened with these materials’ high demand and economic importance [7]. There are also environmental concerns associated with the use of primary produced plastics, and their dependency on non-renewable resources. According to the OECD [8], in 2019, plastic production and conversion of fossil fuels contributed 1.6 gigatonnes of greenhouse gas emissions (2.9% of global emissions).
Current studies focus primarily on the separation of the plastic substrate from the metallic coating to recover a mixed metal residue and plastic substrate. These processes involve mechanical treatment, the dissolution of the metal via chemical treatment, or its vaporization through pulse arc discharges [2,9,10,11]. Such methods require high energy and compromise the effective separation of all materials into high-purity products. For closed-loop recycling, the recovery of all metals and the plastic should be realised.
The project ReComp (Development of an Economically and Ecologically Sensible Recycling Method for Metal/Plastic Composites) focuses on the technological development of an ecologically and economically sustainable recycling route for metallized plastics. Its main aim is to recover all incorporated materials (copper, chromium, nickel, and plastic) in a high-purity form from automotive metallized-plastic production waste, whilst at the same time avoiding the formation of toxic hexavalent chromium. It was funded between December 2019 and February 2022 by the German Federal Ministry for Economic Affairs and Climate Action (BMWK) via the funding programme Central Innovation Program for Small and Medium Sized Enterprises (SMEs) (ZIM), Project No. ZF4774501CM9. The research and development activities were conducted in the laboratory of IARS (Institute of Applied Resource Strategies) at SRH Berlin University of Applied Sciences and at Fraunhofer Applied Research Center for Resource Efficiency ARess together with the industrial partner Krall Kunststoff-Recycling GmbH. After the funding period for ReComp I, further process developments for ReComp II were conducted between IARS, Krall Kunststoff-Recycling, and ABCircular GmbH. The aim of ReComp II was to improve the economic sustainability of ReComp I, with the overall purpose of making the process not only more environmentally friendly but also economically profitable. Thus, from the technical and sustainable development of ReComp I to ReComp II, the concept of the Continuous Sustainability Improvement Process (CSIP), an extension of the well-established Continuous Improvement Process (CIP), was developed.
CIP is an approach that has traditionally been adopted in companies with the main purpose of improving their performance as an organisation [12,13]. In this way, the company pursues a continuous improvement in processes, procedures, and systems with the aim of achieving a products’ improved quality, efficiency, and customer and employee satisfaction. The concept of CIP plays a fundamental role in a company’s quality management system, further evidenced with its inclusion in ISO 9001:2015 Quality Management Systems [14] through the Plan, Do, Check, Act (PDCA) cycle. The PDCA, as defined in ISO 9001:2015, can be briefly described as follows:
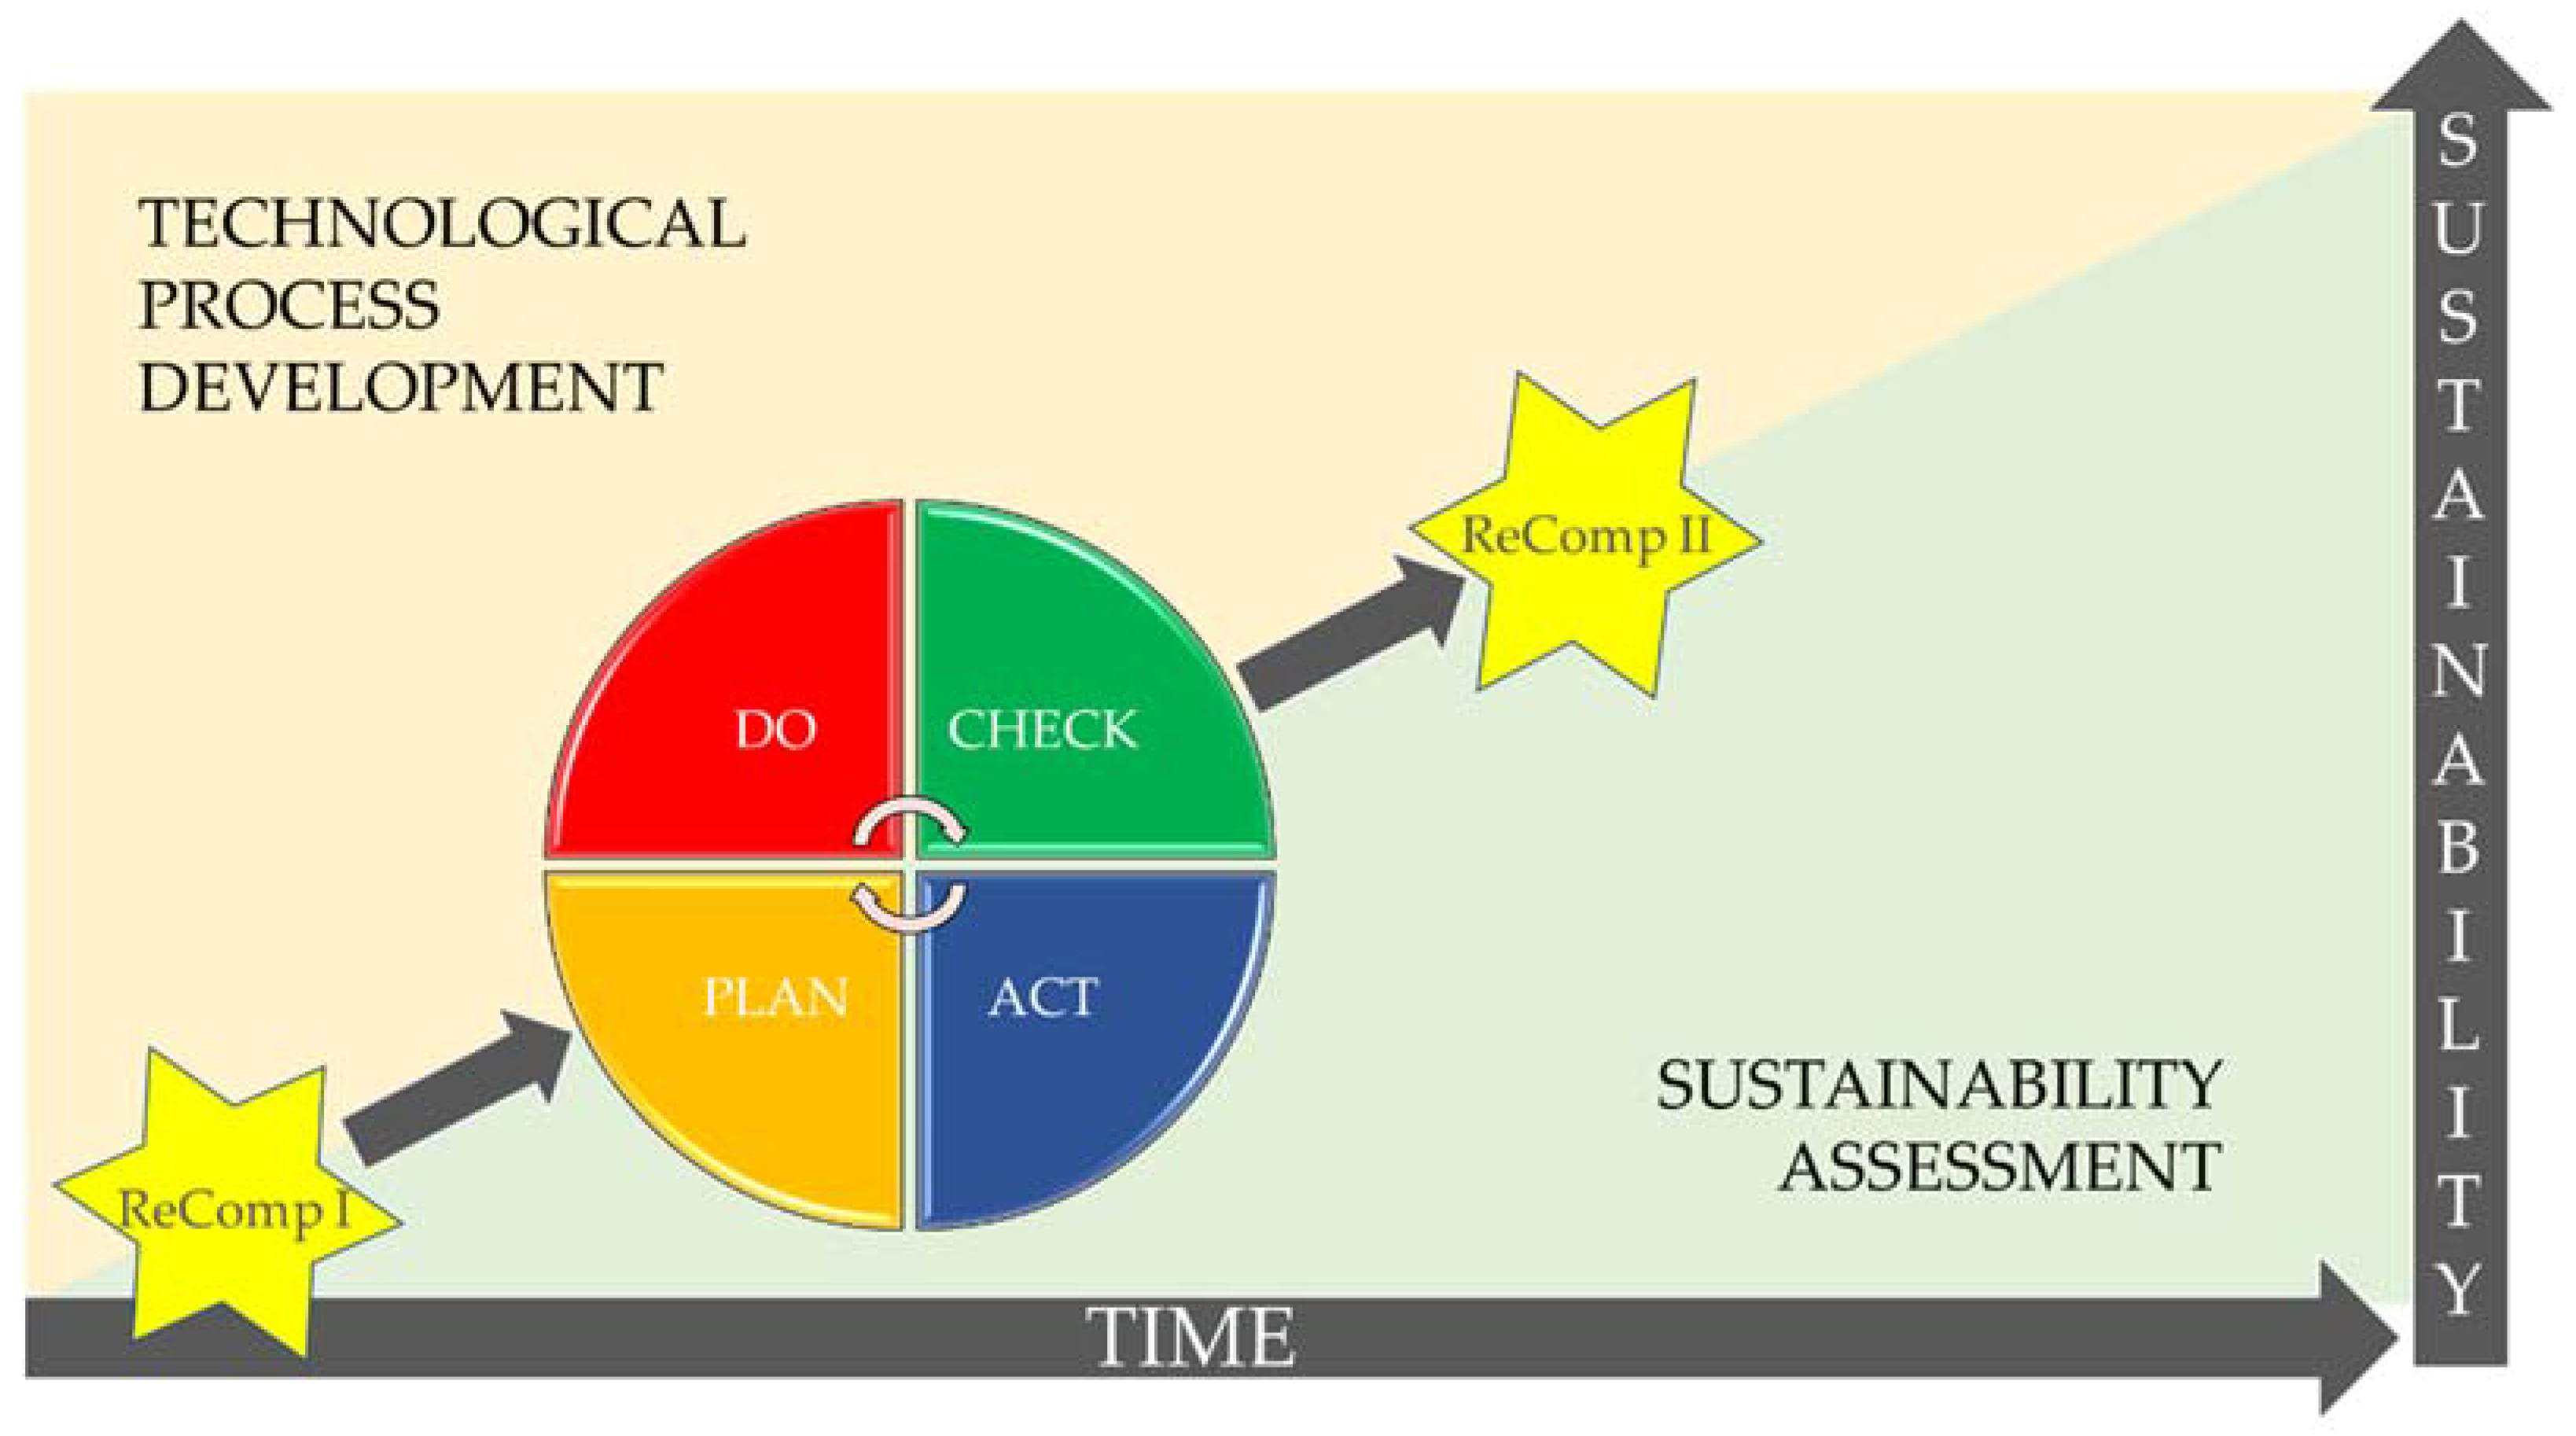
  • Plan: establish the objectives, the resources required, and identify and address risks and opportunities in meeting customer requirements.
  • Do: implement what was defined in the “plan”.
  • Check: monitor and measure the performance against the objectives and policies as defined in the “plan”.
  • Act: take actions to improve what was implemented (“do” stage).
Although CIP has been shown to play a critical and strategic role for organisations [12], and for waste reduction in manufacturing industries [15,16], its application to the design of new technologies from a holistic sustainability perspective has not been as thoroughly explored. To fill this gap, the Continuous Sustainability Improvement Process (CSIP) was developed at the IARS, a research institute at SRH Berlin University of Applied Sciences, together with ABCircular GmbH, a startup for sustainability consulting in Berlin, with the main goal of structuring the CIP for the sustainable development of new technologies. The idea is sketched in Figure 1, using the ReComp project as an example. Here, the PDCA cycle is arranged between the technical development and sustainability assessment. Figuratively speaking, the PDCA cycle “pushes” the sustainability performance of the process up the ramp. Accordingly, the horizontal and vertical axes of the image show progression over time and sustainability. The positions of the process routes ReComp I and II are arranged in this diagram.
In more detail, the CSIP consists of two lobes, a technological and sustainability route (compare Figure 2). At the centre of both lobes lies stakeholder engagement and definition of project objectives and goals. The concept is as follows: The researchers/engineers/designers start with engaging stakeholders and defining key technological and sustainability objectives and goals. Then, the technological route starts, including process design (2), research and development experiments in the laboratory (3), and upscaling experiments (4). Following this, the key technological results are summarised and interpreted (5) and compared to the technological goals. The sustainability route is then embarked. The sustainability route starts with the economic and environmental assessments conducted using Material Flow Cost Accounting (MFCA) and Environmental Life Cycle Assessment (E-LCA) (6 and 7). Other sustainability assessment tools can also be included at this stage (for example, Life Cycle Costing or Social Life Cycle Assessment). Following the sustainability assessment, the results are interpreted and compared to the original objectives and goals (8). Finally, improvement options are identified (9). These improvement options are then fed back into the design of the technological route, following engagement of stakeholders and a revisiting of the key objectives and goals.
These steps can be summarised according to the PDCA cycle, where the numbers refer to the stages shown in Figure 2:
  • Plan: The researchers/engineers/designers start with engaging stakeholders and defining key technological and sustainability objectives and goals (1).
  • Do: Process design (2), research and development experiments in the laboratory (3), and upscaling experiments (4).
  • Check: Key technological results are analysed, and interpreted (5) and compared to the technological goals. The sustainability of the technological improvements is then checked (6–8).
  • Act: Take actions to improve what was implemented. Identify improvement options (9). Start again at plan (1) and do (2) to (4).
This study aims to demonstrate the application of the CSIP in the technical and sustainable development of recycling technologies using the case study of ReComp. Using a “two-spheres” approach (via the CSIP) to the design and development of the recycling process, an improved recycling process was developed. The paper starts with a general overview of the technological route development in Section 2.1, including characterisation, research and development in the laboratory, and upscaling experiments. Section 2.2 outlines the methods for the sustainability route, including an economic analysis via MFCA and environmental assessment via E-LCA. The key technological results for ReComp I are discussed in Section 3.1, followed by the results from the sustainability assessment in Section 3.3. The technological developments of ReComp I to ReComp II are summarised in Section 3.4, and impact on the project’s sustainability performance is examined in Section 3.5. Key improvements identified from the CSIP are also identified in these sections. The paper finishes with the final summary and conclusion, outlining that through CSIP, a 4% (on average) improvement in environmental outcomes and 92% improvement in annual cost per kg of waste input processed were achieved.

2. Method and Materials

2.1. Technological Route

The technological route consisted of design, research and development in the laboratory, as well as upscaling experiments, and analytical characterisation.

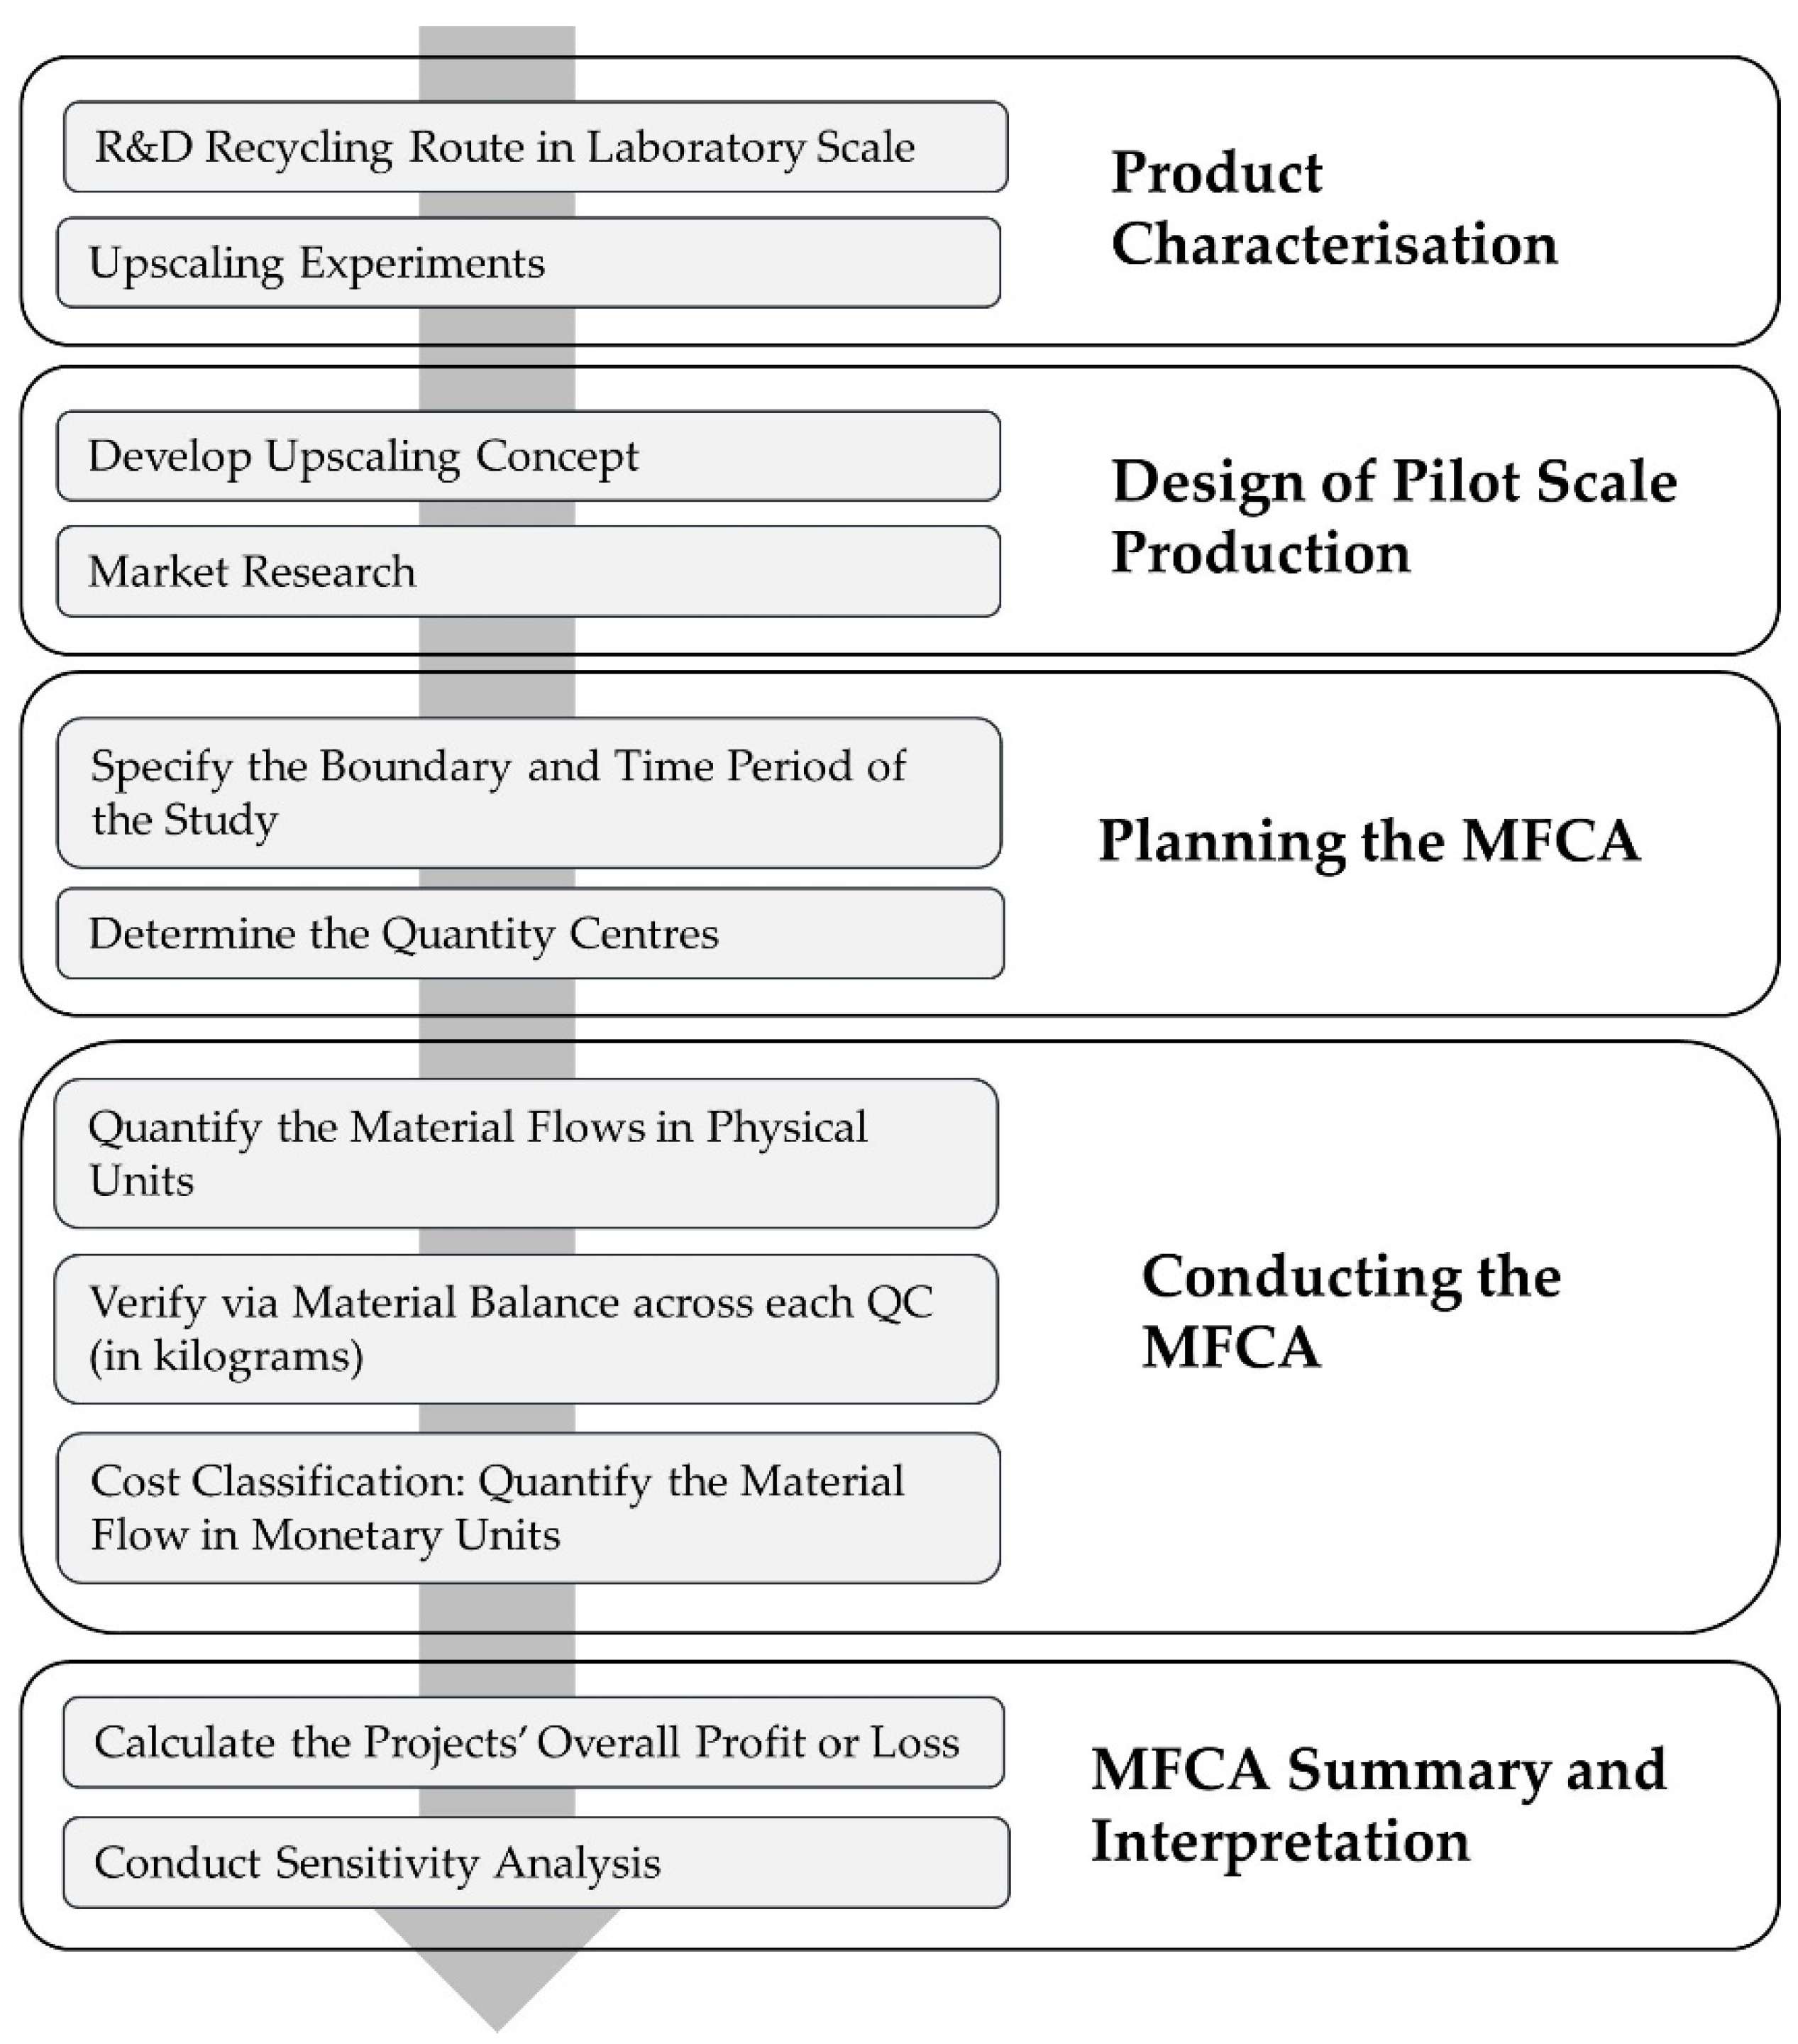
2.1.1. Characterisation

The first stage of the design of the recycling route involved the characterisation of the feedstock. Furthermore, the purity and yield of the outputs of each process step and of the final products were characterised. A Keyence VHX-6000 digital microscope was used for optical characterisations and an Ametek Spectroscout Geo+ X-ray Fluorescence (XRF) Analysis and Oxford Instruments Xmax-80 Energy Dispersive X-ray Spectroscopy (EDX) within a Scanning Electron Microscope (SEM) Zeiss Crossbeam XB540 (manufacturer: Zeiss, location: Oberkochen, Germany) were used to identify elemental compositions. A Kern ADJ 200-4 analytical balance (measurement error: ±0.0004 g) was used to measure the sample mass. During process optimisation, Perkin Elmer Optima 8300 ICP-OES (Inductively Coupled Plasma Optical Emission Spectrometry) was used to identify and quantify the metal contents in the electrolyte and leaching agents. The electrochemical experiments were conducted using a VersaSTAT 3 measurement bridge (manufacturer: Ametek, location: Meerbusch, Germany).

2.1.2. Research and Development in the Laboratory

The core process step of ReComp is the removal of the metal coating from the plastic, together with the recovery of different metals. This is achievable via either chemical leaching and electrodeposition of the metals or precipitation of metal salts or electrochemical treatment combined with simultaneous electrodeposition (and/or precipitation).
All chemical leaching experiments were conducted in a three-necked flask, tempered with a heating plate. A reflux condenser was connected to avoid evaporation losses. In the experiments, 200 mL of 1-molar-concentration (M) methane sulfonic acid (CH3SO3H, purity: 99.5%, manufacturer: Carl Roth GmbH & Co. KG, location: Karlsruhe, Germany) was heated to the operating temperature (30 °C, 60 °C, or 90 °C) and after reaching the temperature, 10 g of the shredded metallized plastic was added. The suspension was stirred continuously at 250 rpm. After adding the feedstock to the acid, the first sample was taken immediately and then every 30 min thereafter. The samples of the acid were analysed with ICP-OES. In two leaching experiments, 0.5 mL of hydrogen peroxide (35%, Carl Roth GmbH & Co. KG) was also added to investigate the influence of an oxidising agent. After 180 min, the experiments were stopped.
For the electrochemical experiments, a 0.08 L conventional laboratory drum electrode (made of polylactic acid, PLA) was used. Such conventional electrodes are normally used as cathodes for the deposition of metal coatings on different parts (e.g., silver jewellery). In ReComp, the drum had to function as an anode to oxidise the waste material. Consequently, the copper wire, which is normally used to provide an electrical contact of the materials within the drum to the outer electrical circuit, was replaced with platinum. The drum was lined with a platinised titanium mesh (manufacturer: Metakem GmbH, location: Usingen, Germany), covering nearly the whole inner plastic surface of the drum. The mesh was connected with a platinum wire to the outer electrical circuit to provide an electrical contact over the whole inner surface of the drum.
The electrochemical experiments involved placing about 10 g of input waste material into the drum. The drum electrode was then placed in an acid-resistant vessel filled with 1-molar methane sulfonic acid. Different metals (aluminium, steel, and copper of 99.8% purity) were used as cathodes and a platinum foil or standard hydrogen electrode was used as the reference electrode. All experiments were conducted at room temperature. First, cyclovoltammetry was used to study the system between −0.5 and +2.0 V. Later, experiments were executed at potentiostatic conditions (at different voltages) for 30 min up to 14 days. The voltage and time were varied to identify the most suitable parameters for complete dissolution of the metal coating, without the development of hexavalent chromium.
After the electrochemical experiments, the drum and the cathode were removed and washed with deionised water until a neutral pH value was reached. The residue in the drum and the cathode was removed, dried, and characterised. Furthermore, the electrolyte was filtrated with a ceramic filter. The filtered material and the electrolyte were analysed qualitatively and quantitatively according to their elemental composition.
The electrolyte was finally purified with fractional distillation. The aim of the distillation was to separate the dissolved salts, the acid, as well as the water and to obtain the last two (water and acid) as pure fractions. This was possible because the boiling point of the acid (T = 167 °C) is vastly different from the boiling point of water. The precipitated salt was also characterised (according to weight, purity, and composition) after drying.

2.1.3. Upscaling Experiments

Upscaling experiments were conducted for the electrochemical treatment step because this step dictates the maximum volume of waste that can be processed in one cycle. The setup of the electrochemical treatment step also has economic and technical consequences on the overall process flow. This is because the volume of the drum is cost-intensive due to the expensive electrode material (i.e., the platinised titanium mesh). Furthermore, the efficiency of the treatment is strongly dependent on the volume ratio of the input material to the drum. The other steps did not require such a detailed analysis, as they are generally much easier to upscale from both the economic and technological perspectives.
For the upscaling of the electrochemical step, larger setups of the drum electrode were specially designed using FreeCAD software (version 0.19) and printed using a Creality Ender 3 3D printer. Polylactide (PLA) was used as the drum electrode material, as it has a suitable chemical resistance and is a common Fused Deposition Modelling (FDM) printing material. Platinised titanium meshes were used as electrical contacts. The largest drum printed is shown in Figure 3a. It had a capacity of 150 g of metallized PC/ABS (input of ReComp I) per batch and about 450 g of metal flakes (input of ReComp II). The reason for the higher capacity (by mass) for the metal flakes was because of their approximately three-times higher density compared to the metallized plastic. The electrical contacts were installed as eight surfaces on the drum electrode, each with platinised conductors. The connection during the rotation was maintained using a slip ring made of platinum wiring. To allow for the drum to rotate, it was mounted in a suspension made of polypropylene (PP) and driven by a stepper motor. Figure 3b shows the setup of this drum as an electrode in the experiment.
The upscaling experiments were conducted first as cyclovoltammetric measurements and then potentiostatic to determine the most effective voltage (between −0.5 and 2 Volt). Furthermore, the potentiostatic experiments were run for up to 10 days. Additionally, these experiments were used to study if and how these parameters would be adapted for different compositions and amounts of input materials. The residue in the drum as well as the electrodeposited materials at the cathode, precipitates, and the electrolyte were analysed (see Section 3.1.1).

2.2. Sustainability Route

The sustainability route consisted of economic and environmental sustainability assessments to quantify the economic and environmental impact of the technological development.

2.2.1. Economic

MFCA is a method that evaluates the economic performance of a process by quantifying and assigning costs to the material and energy flows through a process [17]. In this case, MFCA was used to identify the main cost drivers of the metallized plastic recycling process, such as material, energy, labour, machinery, and waste management, offset using the sale of products and cost savings from byproducts. In this study, products were defined as any output that was marketable and therefore could bring revenue to ReComp. In comparison, byproducts were defined as non-marketable products that still provide other benefits, e.g., chemicals that can be recycled and thereby reduce waste management and material input costs. The MFCA was conducted according to the framework and guide of ISO 14051: 2011 [18].
A summary of the MFCA method and interaction with product characterisation and design of the pilot level production is shown in Figure 4.
The project boundaries for the MFCA included all steps encompassed using ReComp I and II, excluding shredding, as this occurs at the consortium partner’s facility and would not constitute an extra process step should the process be installed. The period of data collection was 3 years (the project’s research duration), and the time period used for the assessment was 1 year. The MFCA quantity centres were defined according to the process steps for each project, and the material flows were defined from the upscaling experiments. The units of measurement used for the input/output are summarised in Table 1.
Following quantification of the material flow in physical units, a cost classification step was undertaken, whereby costs were assigned to each material flow. The assumptions for the cost classification of the materials, energy, and labour costs are shown in Table 2.
The cost classification for the machinery and waste management costs were as follows:
  • The machinery cost calculation consisted of three parts: the purchase price of the equipment, salvage value, and depreciation rate. The purchase prices were obtained from vendor quotes. All machinery was given a zero-salvage value, with 5 years of depreciation.
  • The waste management costs included all fees associated with the handling and disposal of waste by third parties. The cost of disposal of wastes other than wastewater were from the Berliner Stadtreinigung (BSR) price list for disposal from trade, crafts, commerce, and services with volumes less than 500 kg per producer and year [22]. The costs for disposing chemicals were obtained from waste disposal company quotes. The cost of wastewater was obtained from BWB and priced at 0.0022 EUR/kg [19].
The products considered included high-purity copper electrodeposited on the copper electrode, chromium flakes, and PC/ABS around 2–8 mm long. Although nickel in salt form was also obtained from the process, it was not of high enough purity to be considered revenue and instead treated as a waste. The product price was adopted from the average price of each mineral during a 24-month period (January 2021 to December 2022). These were calculated as 2.36 EUR/kg, 6.95 EUR/kg, and 168 EUR/kg for PC/ABS (source: Plasticker [23]), copper (source: Schrott24 [24]), and chromium (source: Strem Catalog [25]).

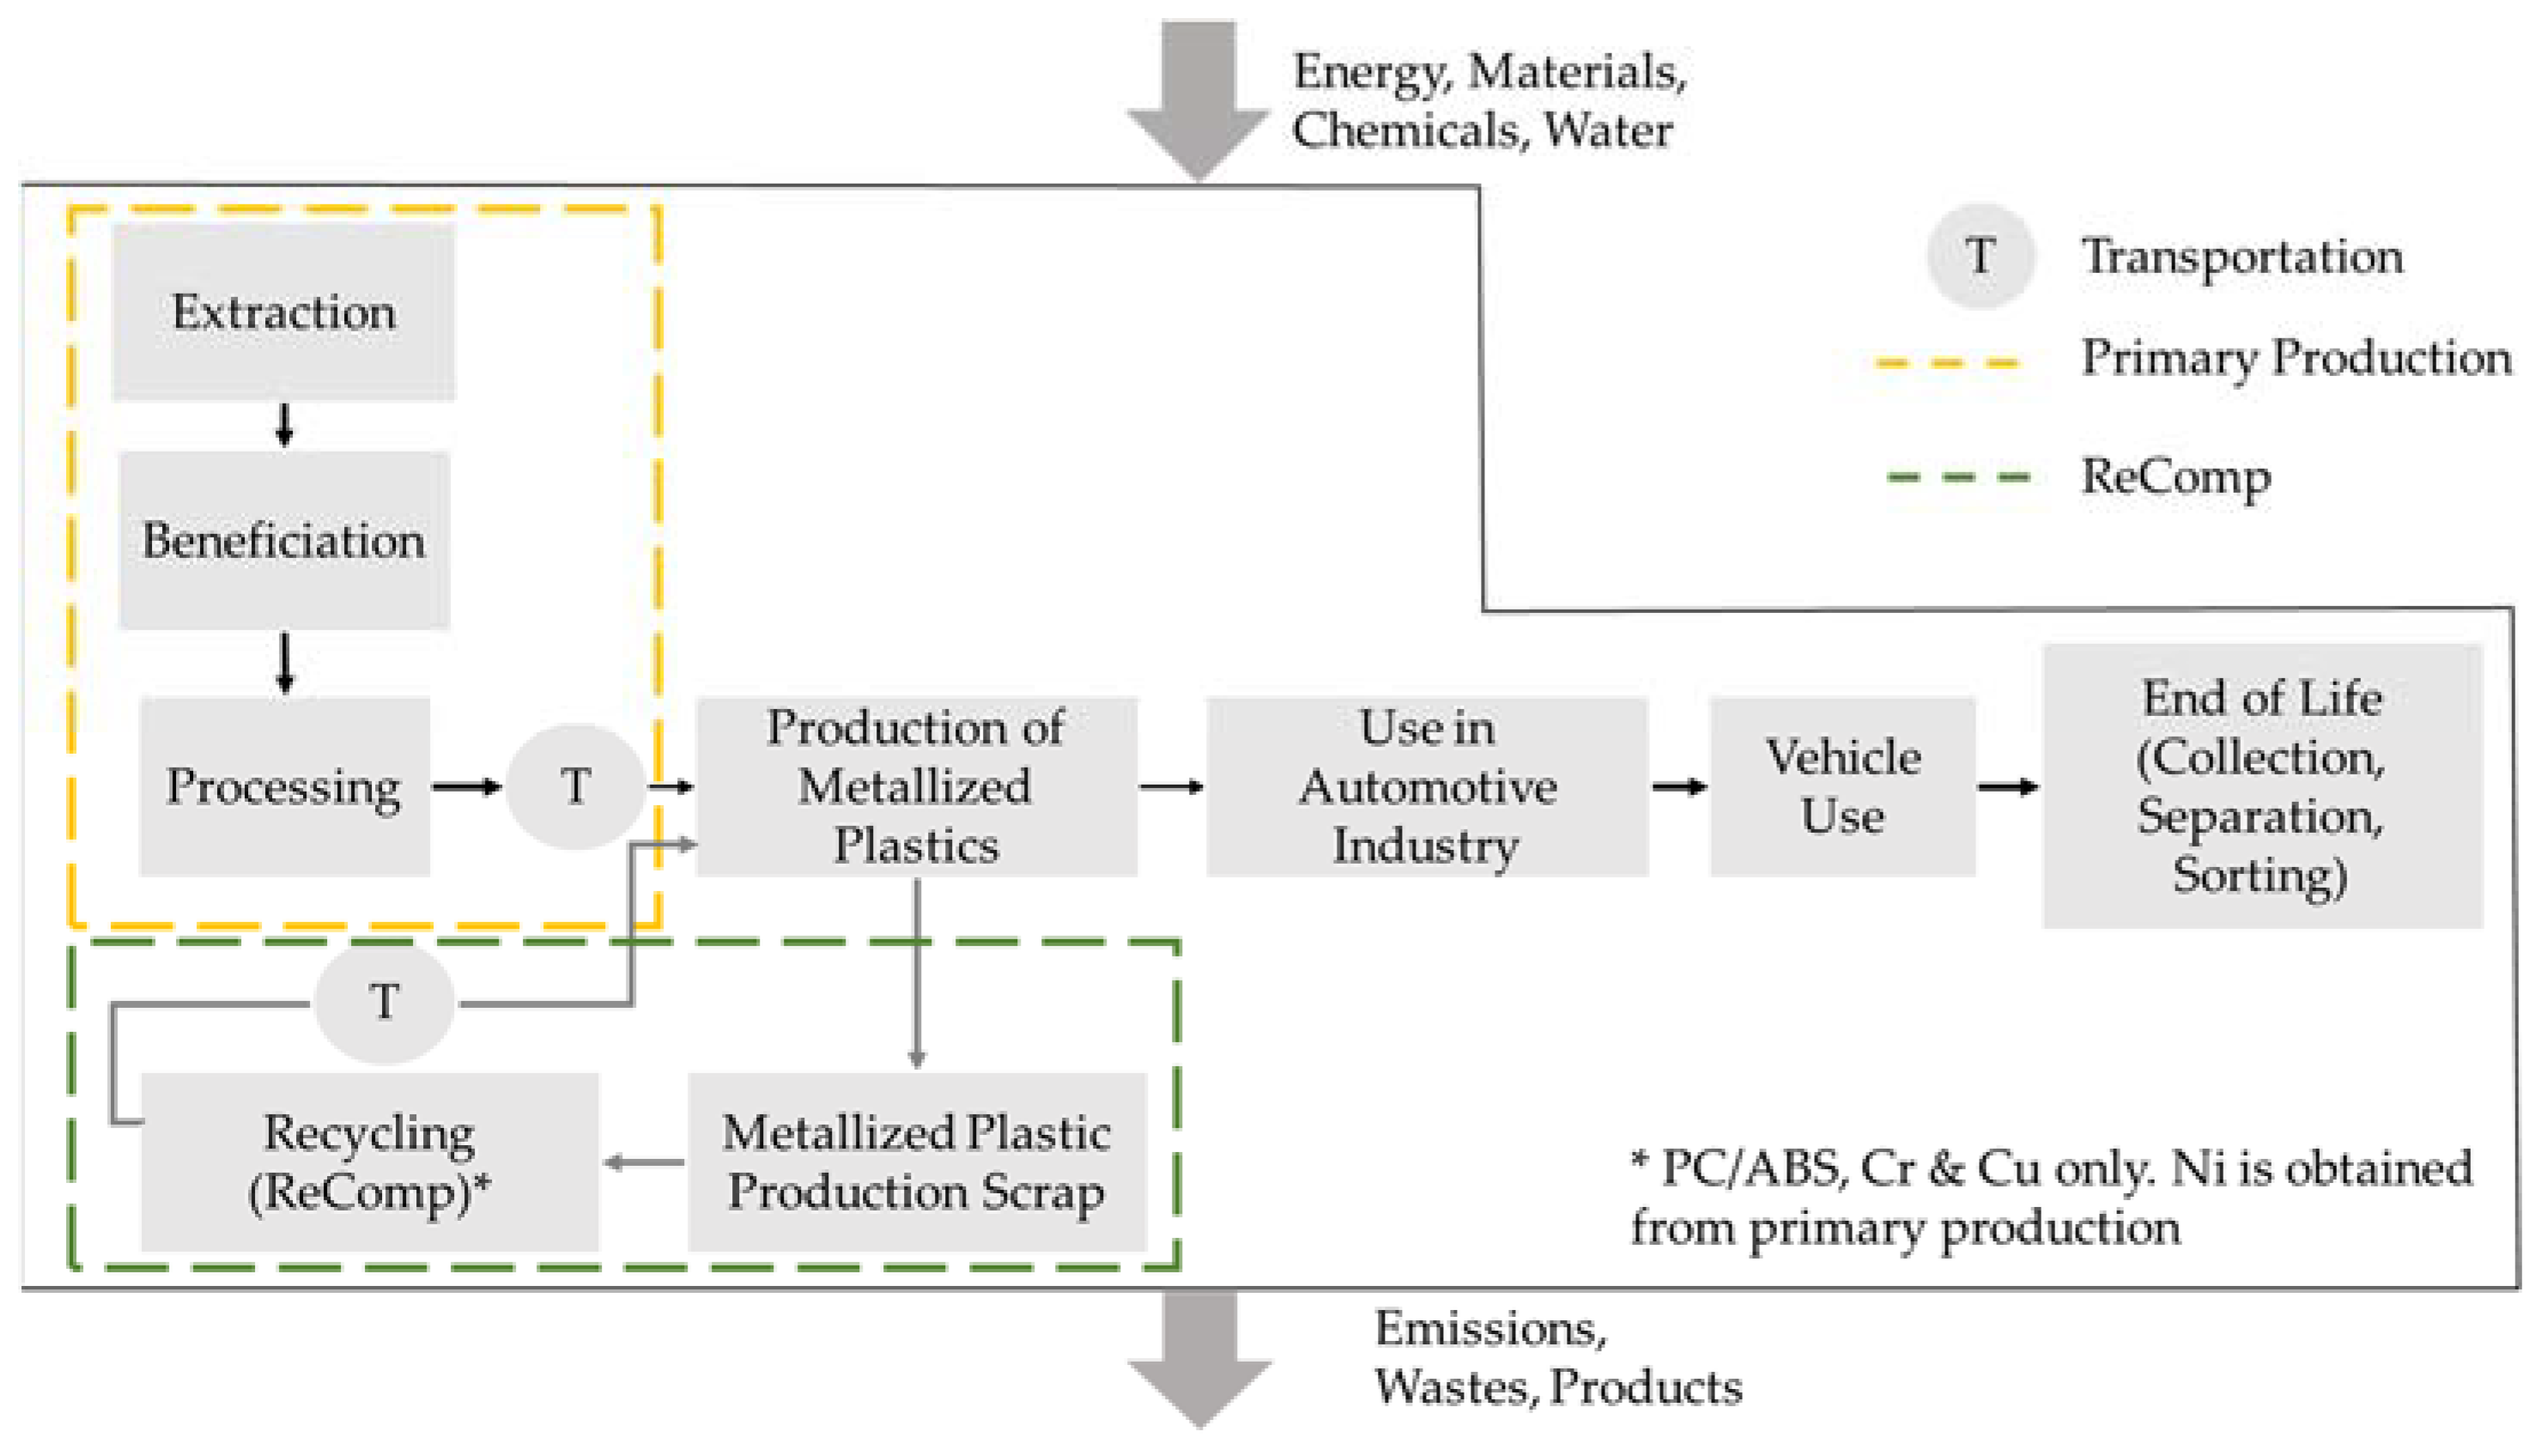
2.2.2. Environmental

E-LCA was used to evaluate the environmental feasibility of upscaling the metallized plastic recycling process according to ReComp I and ReComp II. The environmental impacts of the recycling process were compared to the primary production of metallized plastics using primary sourced chromium (Cr), copper (Cu), nickel (Ni), and PC/ABS. Note that for ReComp, Ni was assumed to be obtained from primary production, because the Ni produced from ReComp was a Ni-salt, and not of high enough quality to be marketable. Production of the metallized plastic flakes was not included in the study boundary since it is the same process for both ReComp and primary production. The functional unit for the assessment was 1 kg of metallized plastic of the following composition: 13.9 wt.% Ni, 7.9 wt.% Cu, 0.2 wt.% Cr, and 78.0 wt.% PC/ABS.
The Life Cycle Impact Assessment (LCIA) was based on ReCiPe 2016 v1.1 (mid-point impact categories). ReCiPe 2016 was selected as it addresses relevant impact categories in the mining industry for both humans and the environment, such as human carcinogenic and non-carcinogenic toxicity, global warming, mineral resource scarcity, land use, and water consumption, as recommended by the metal industry for European and global LCAs [26]. The E-LCA was conducted in accordance with ISO 14040:2006 [27] and ISO 14044:2006 [28].
The boundaries for the assessment are shown in Figure 5.
The E-LCA was conducted according to the following assumptions:
  • Processing Country: China (for primary production), Germany (ReComp).
  • Primary production inventory data were sourced from the Ecoinvent 3.7.1 database, adjusted to suit the specific conditions of this study.
  • The ReComp I and II inventory data came from experimental data collected during the technological investigations (primary data).
  • Transportation from China to Germany for production of metallized plastics through medium cargo transport vessels with a capacity of 20,000 t.
  • Transport of recycled metallized plastics through Germany via Lorry Euro 6.

3. Results and Discussion

This section starts with a description of the main results of the laboratory and upscaling experiments (Section 3.1) and a summary of the developed process flow for ReComp I (Section 3.2). The results of the sustainability assessment for ReComp I are then discussed (Section 3.3.1 and Section 3.3.2), and recommended technological improvements identified (Section 3.3.3). Finally, the impact of incorporating such technological improvements on the process flow of ReComp (Section 3.4) and the sustainability results of ReComp II are discussed with respect to ReComp I (Section 3.5).

3.1. Technological Results

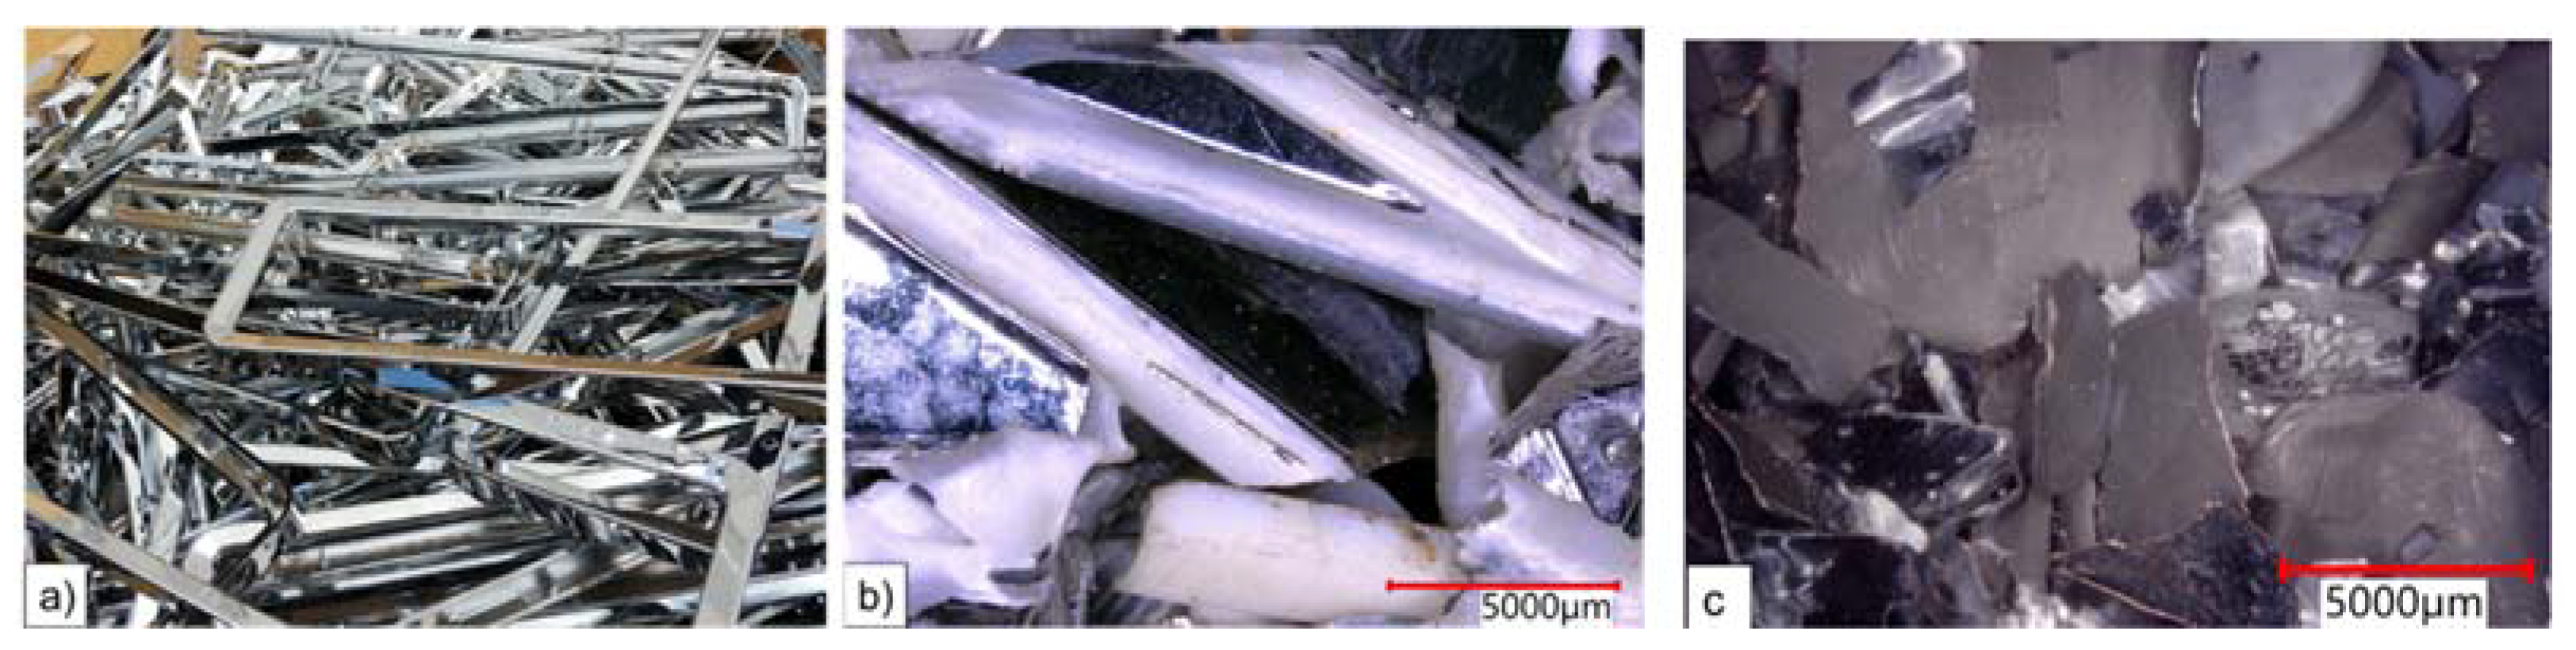
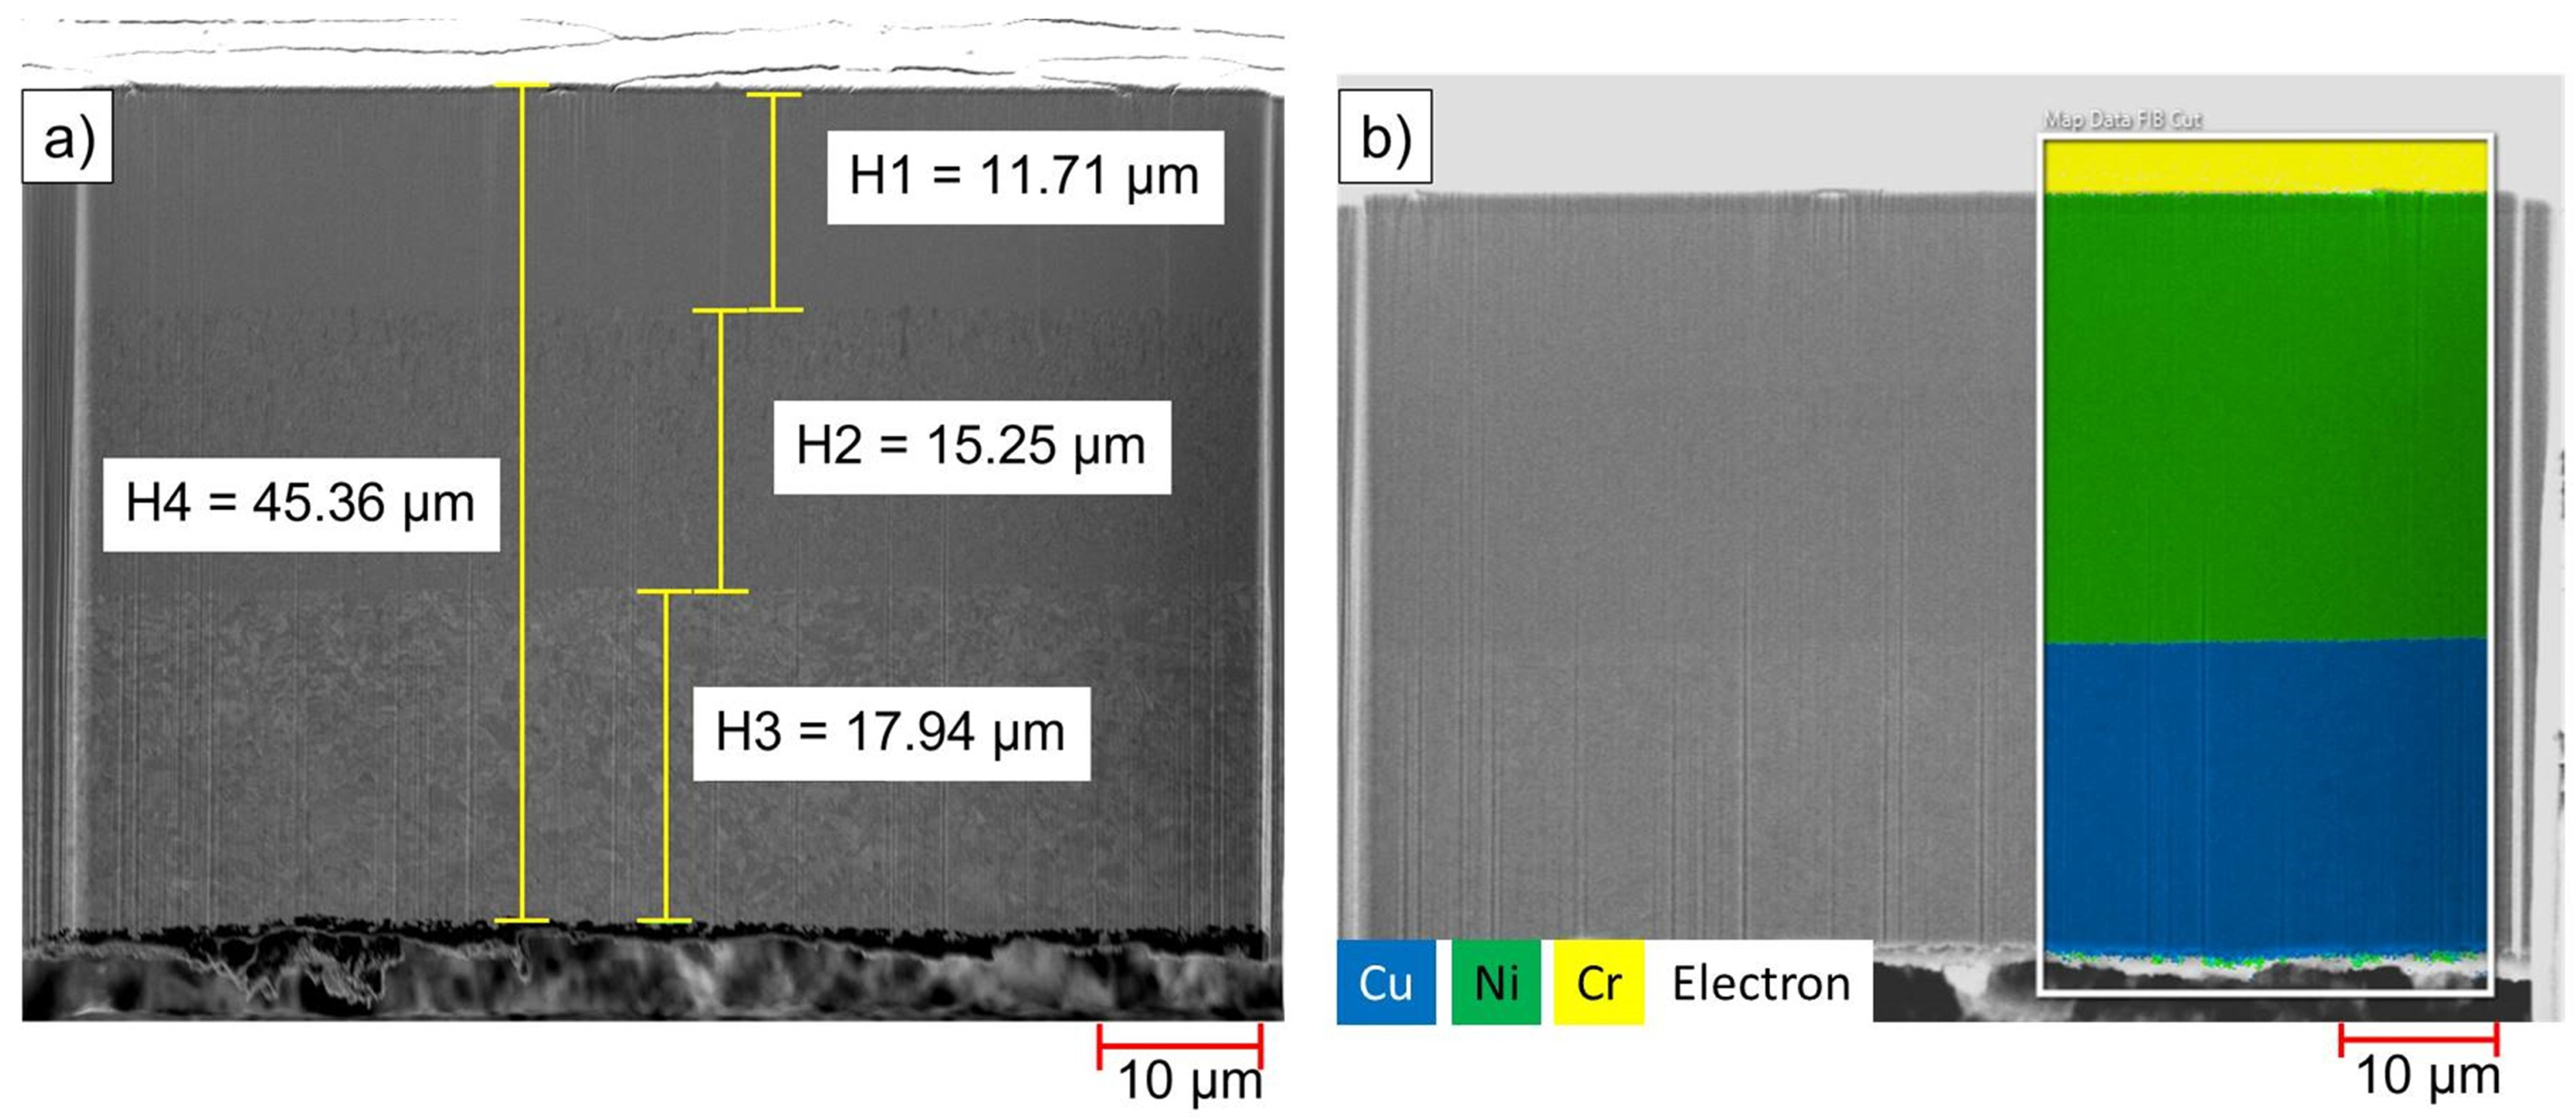
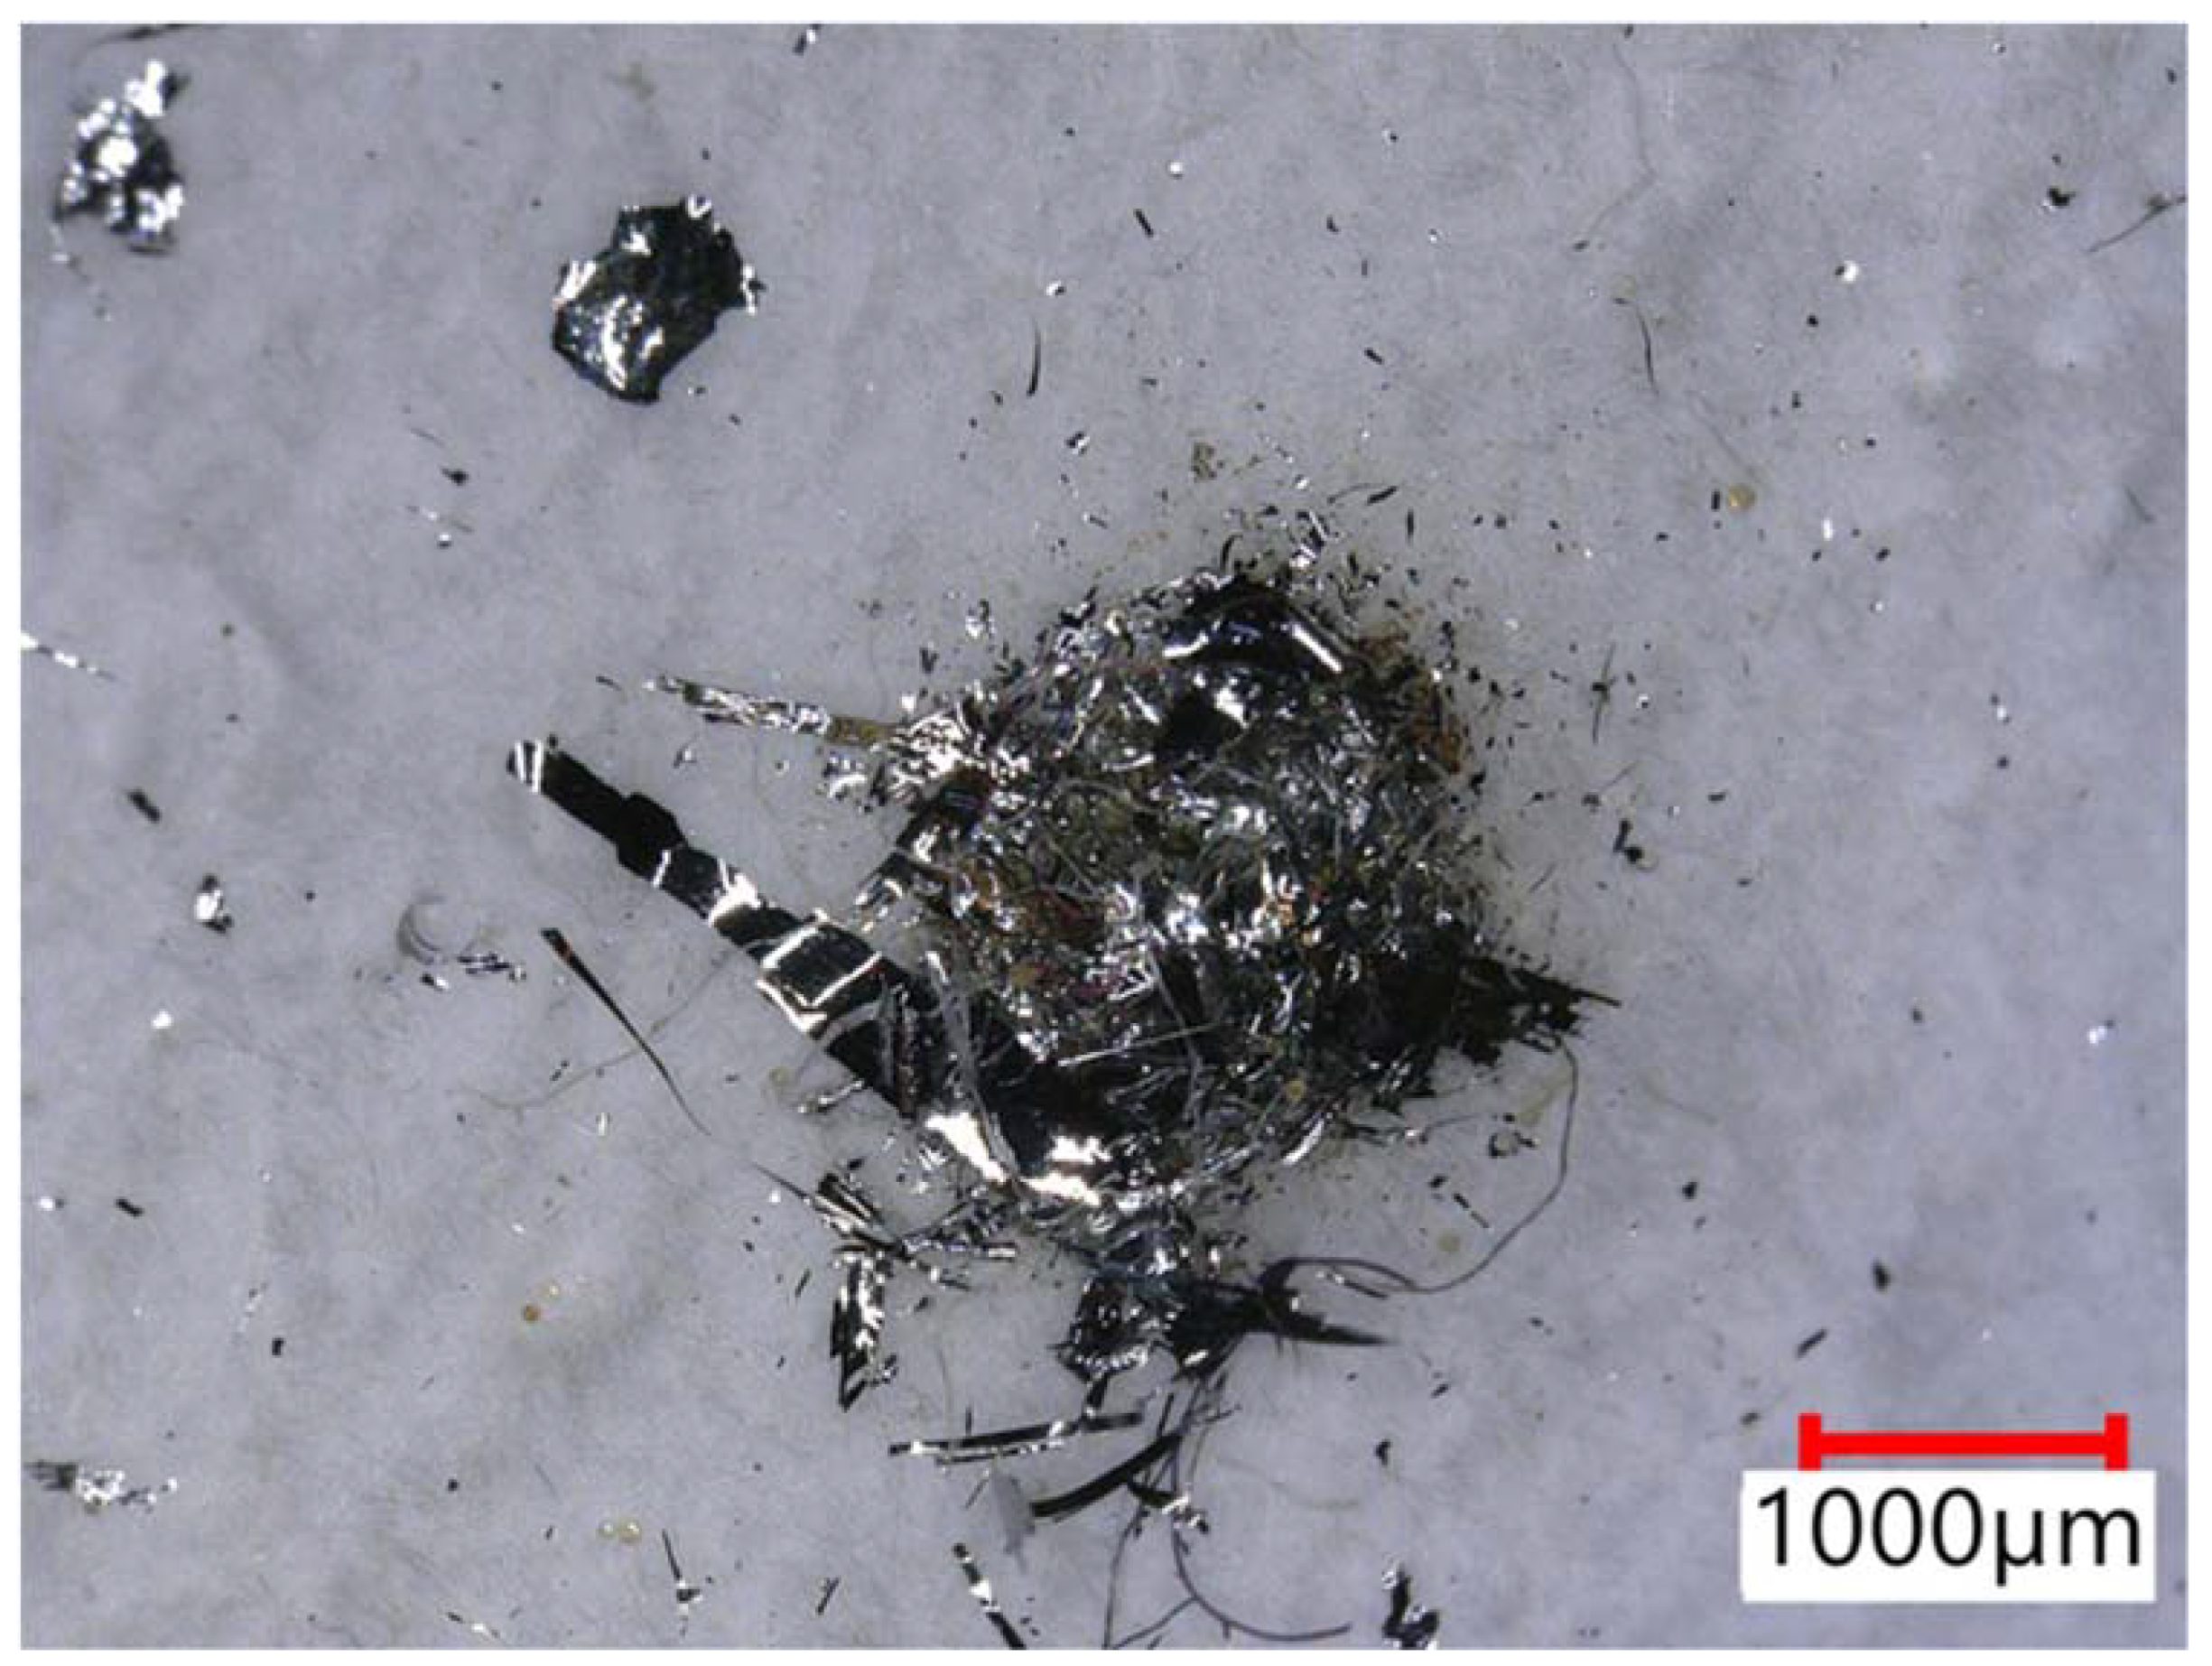
3.1.1. Composition of Input Material

Typical automotive production waste input material for ReComp is shown in Figure 6. In this figure, automotive number plate frames can be seen. These were shredded in different ways. Figure 6b shows the ReComp I input material, shredded into 5–8 mm pieces. Here, the white plastic and silver metal coating are evident. For ReComp II, the automotive components were also shredded but in such a manner that the metal flakes (Table 3 Input A, ReComp II) were nearly completely separated from the plastic pieces (Table 3 Input B, ReComp II) during the shredding process. The metal flakes are shown in Figure 6c. Small traces of remaining plastic pieces can also be seen in this figure.
In Figure 7, the SEM image together with the EDX mapping of the feedstock (compare Figure 7a) are shown. Successive layers of Cu (blue), Ni (green), and the initial part of the Cr layer (yellow) (from bottom to top) can be recognized on the plastic substrate (PC/ABS).

3.1.2. Leaching Experiments

As discussed in Section 2.1.2, the leaching experiments were conducted at 30 °C, 60 °C, and 90 °C. At 30 °C, the metal coating was not sufficiently dissolved, but at 60 °C and 90 °C, a complete removal of the metal coating was achieved after 3 h. Figure 8 shows the metal yields of the leaching experiments at 60 °C in methane sulfonic acid. As demonstrated in this figure, the copper was entirely dissolved with the addition of hydrogen peroxide and use of ultrasound. It is also noticeable that nickel was only dissolved to approximately 40% and chromium not at all under these conditions. Accordingly, the formation of hexavalent chromium can be avoided with such treatment and the remaining non-dissolved nickel and chromium remain as a solid residue together with the plastic.

3.1.3. Electrochemical Treatment

During the electrochemical treatment of the shredded input material (see Figure 6b), the metal coatings separated almost completely from the plastic particles. The most complete separation was achieved after 7 days using a voltage of 0.6 V. During electrochemical treatment, the copper and nickel dissolved from the inner layers of the composite. Copper was simultaneously electrodeposited onto the cathode, whilst nickel remained dissolved in the electrolyte. This released the chromium layer, which remained in its metallic form and settled at the bottom of the container (see Figure 9).
After the 7-day treatment, approximately 54% of copper was successfully recovered as an electrodeposited mono-material. Additionally, XRF measurements showed that the electroplated copper contained less than 0.2% chromium and nickel. XRF and microscopy investigations on the PC/ABS revealed that the metal layers were nearly completely removed, with only a few isolated traces of metal coatings with maximum diameters of 50 µm observable.
When the metal flakes were used as input material (ReComp II, Input A in Table 3 and Figure 6c), the electrochemical treatment time reduced from 7 to 3 days. The reason for this faster process time was due to the improved electrical conductivity of the metal flakes compared to the metallized plastic particles. Copper was recovered with a yield of 23% (see Table 4) and purity of 99.8%. A higher yield of copper could be achieved with an increase in the duration of the electrochemical treatment. The rest of the copper was dissolved in the electrolyte. The yield of chromium was 98% with a purity of 99.4%.

3.1.4. Fractionated Distillation

Methane sulfonic acid was recovered by removing the water with distillation. In doing so, a nickel–copper salt precipitated.

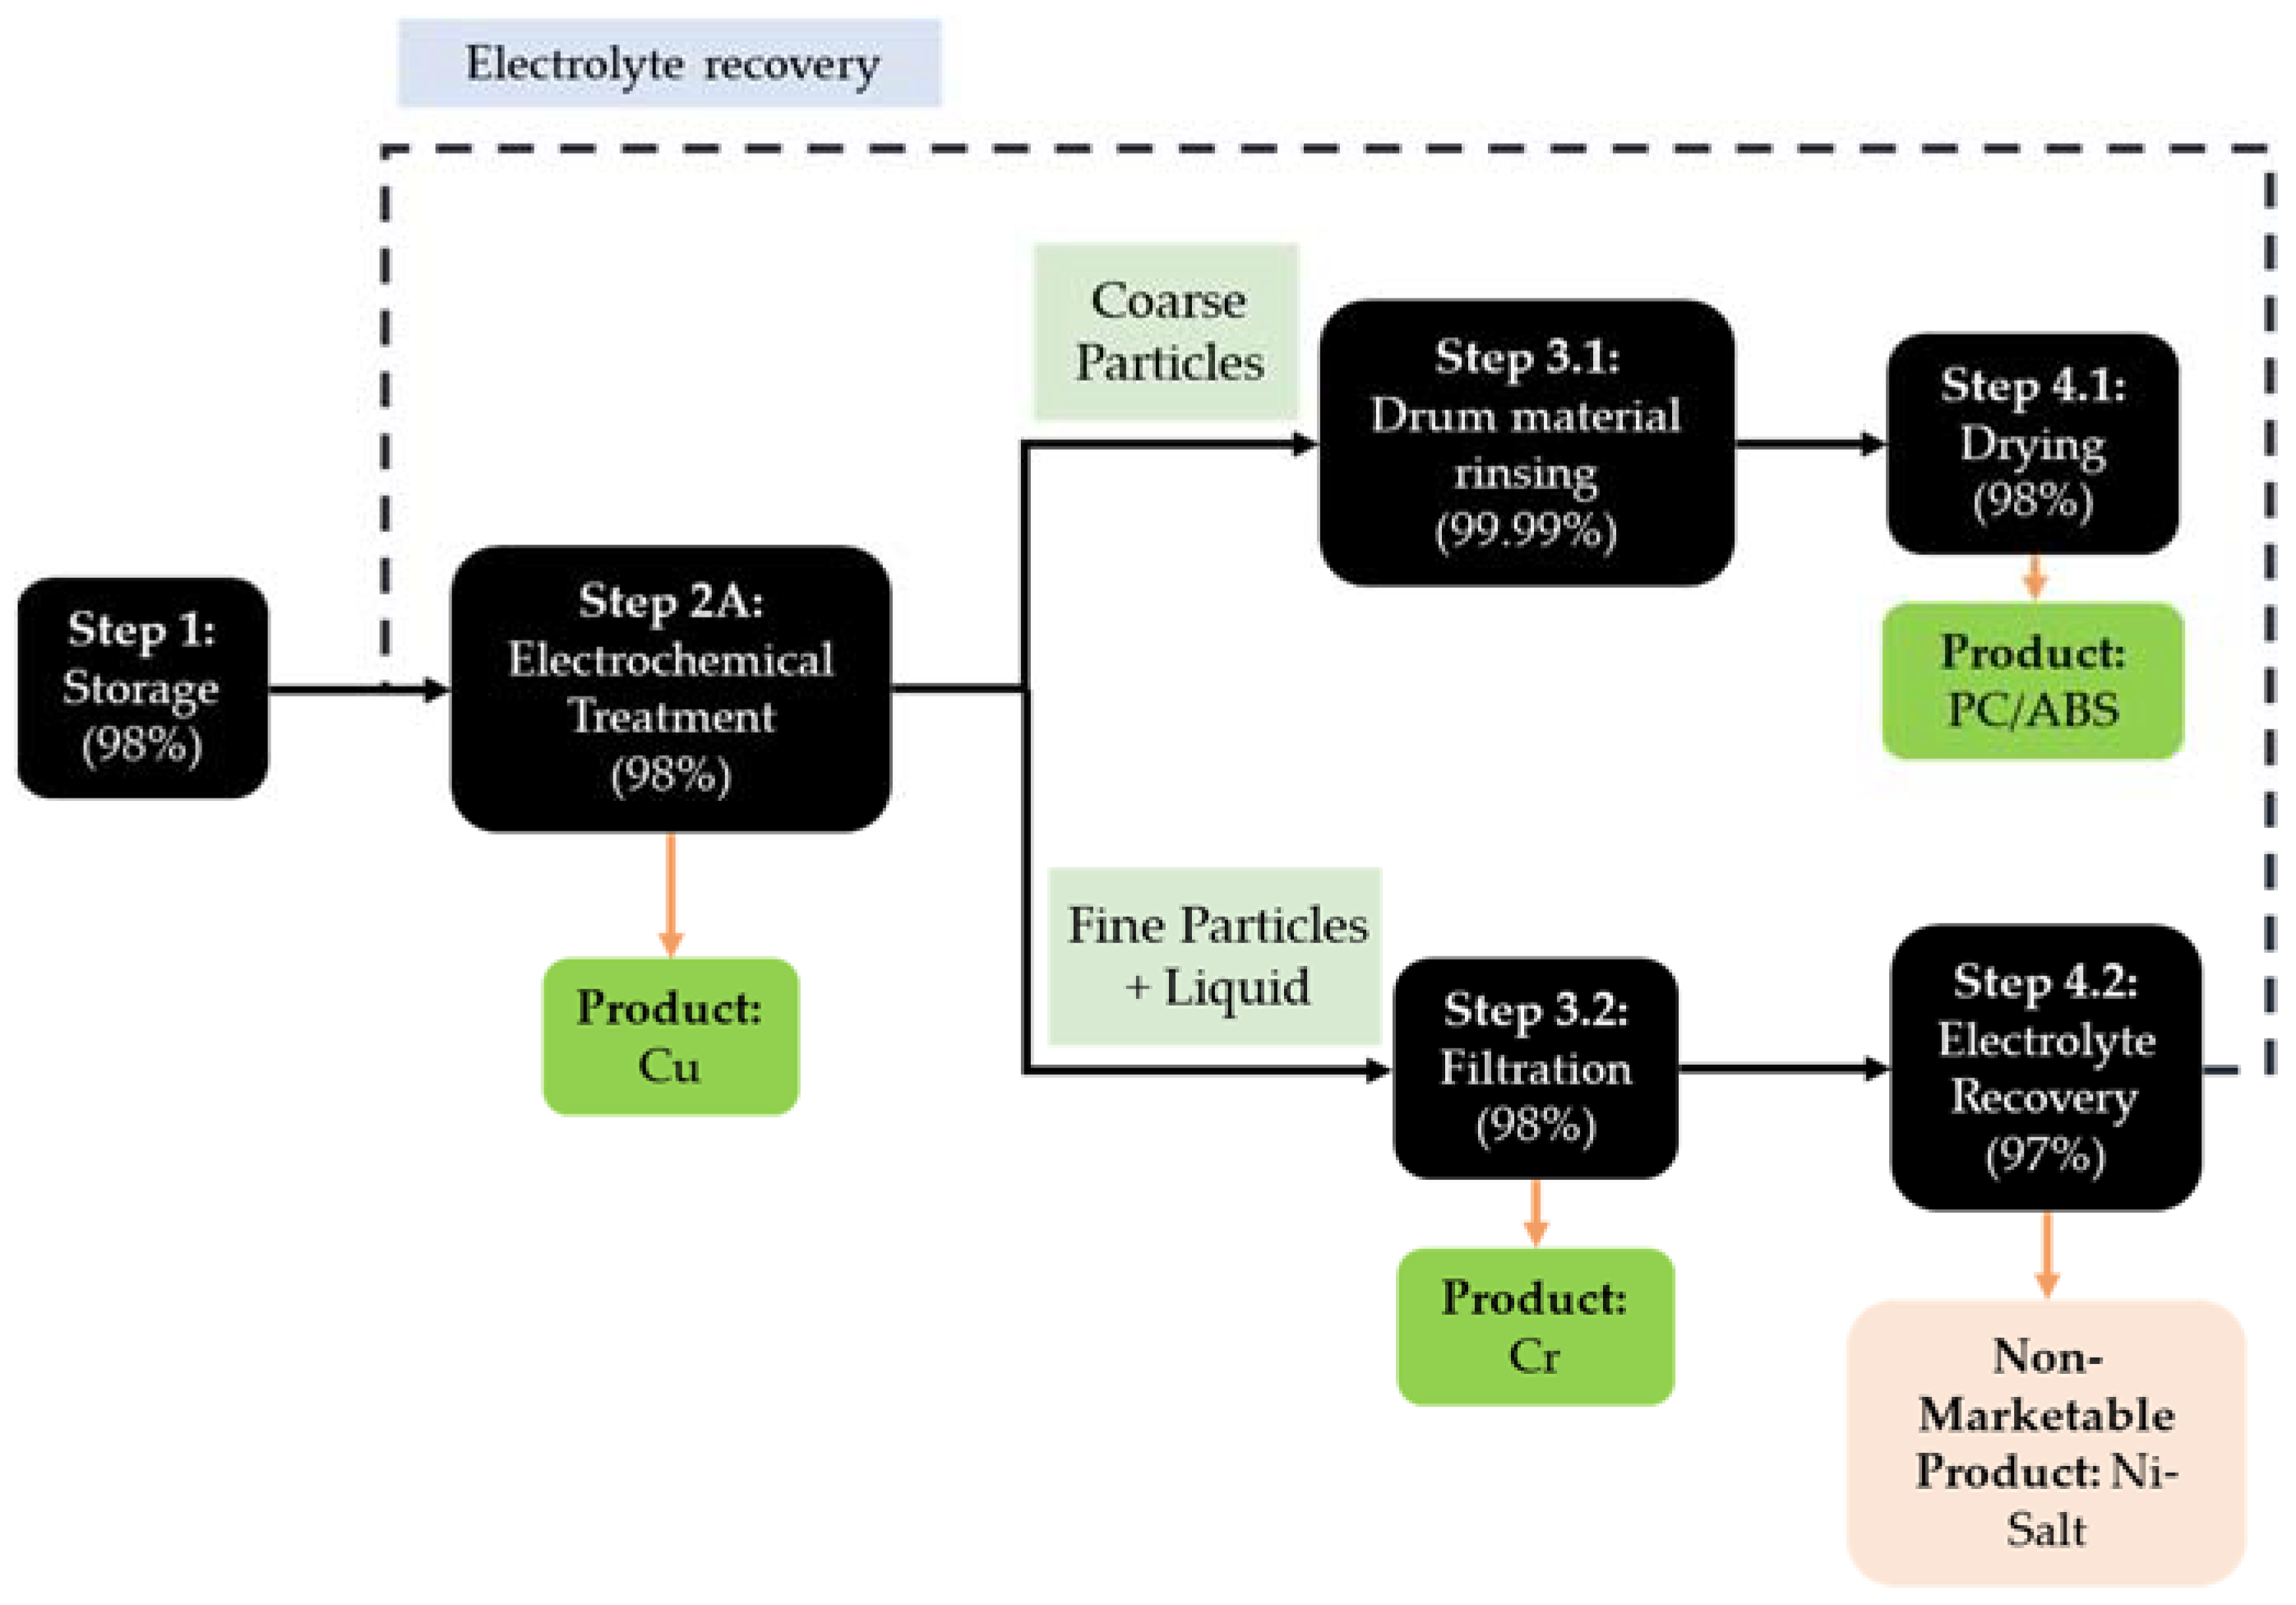
3.2. ReComp I Process Flow

Based on the experimental results, the ReComp I pilot-scale process flow was developed. As shown in Figure 10, following storage of the shredded material, the process proceeded to electrochemical treatment, after which the two main fractions were divided into two process streams: (1) coarse particles (mostly PC/ABS) and (2) fine particles and liquid (chromium, nickel, and the electrolyte from the electrochemical treatment). The maximum throughput and cycle time for ReComp I was limited to 10 kg of metallized plastic per 15-day cycle (constituting 8 kg of metal and 2 kg of PC/ABS). The cycle time and throughput were limited by the capacity of the rotary drum electrode due to contact requirements between the metallized plastic and drum electrodes. The process required 80 L of the electrolyte per cycle, resulting in a total of 170 kg of metallized plastic processed per year. The efficiencies of each process step are shown in brackets at each process step.

3.3. Sustainability Assessment of ReComp I

3.3.1. Economic Assessment of ReComp I with MFCA

The material flow model for ReComp I was defined according to six process steps (see Figure 10), simply termed “quantity centres” for the MFCA. Table 5 provides a qualitative description of the inputs and outputs for the categories of energy (E), materials (M), labour (L), output materials (OM), wastes (W), products (P), and byproducts (BP).
The results of the cost flow analysis are shown in Figure 11 (values are rounded to two significant figures). This diagram summarises the results of the cost allocation step of the MFCA procedure, and shows the cost input into each quantity centre, broken down by type (material, energy, labour, and machinery). The costs were then distributed to either the product or waste management (including material losses) according to the nominated efficiencies (see Table 5). According to the material flows, the product costs for ReComp I were predominantly attributed to the fine particles and liquid fraction (due to the higher mass flow that goes through these quantity centres). Waste management costs were kept low until QC4.2 at which point the Ni salt had to be disposed. The total cost of the process was 17,500 EUR/annum, with EUR 15,400 associated with product costs, and EUR 2100 associated with waste management costs. Normalised with the waste input, this equates to a process cost of 103 EUR/kg of waste input.
Table 6 summarises the revenue from product sales in ReComp I. As shown in this table, PC/ABS contributed the greatest revenue to ReComp I, due to the large quantity produced. The next largest contributor was copper, followed by chromium. The average revenue per kg of product sales is 3 EUR/kg. ReComp I was calculated to make a loss of 17,000 EUR/annum, which is equivalent to 100 EUR/kg of waste input.

3.3.2. Ecological Assessment of ReComp I with LCA

The results of the impact assessment of the E-LCA using ReCiPe 2016 (mid-point impact categories) for primary production versus ReComp I are shown in Table 7 and Figure 12. In Figure 12, the maximum result (primary production) is set to 100% and the results of ReComp I are displayed relative to it. As shown here, ReComp I has a lower environmental impact for all impact categories, compared to primary production.

3.3.3. Identification of Improvement Methods

Although the environmental performance of ReComp I was significantly improved compared to the primary production, the economic results indicated that ReComp I was not financially viable. Therefore, the main improvement options were focused on improving the economic result by increasing the output of marketable products (thereby bringing in more revenue for the process). Given that the limiting process step of ReComp I was the electrochemical treatment, the improvement options were focused here. The overall aim was to reduce the processing time and increase the capacity of the drum, preferably without the need for significant equipment upgrades. This could be achieved by improving the contact between the input material and drum electrodes.
Based on these requirements, the option of segregating the metallized plastic feedstock into metal flakes and plastic particles was explored. The theory behind this was that by separating the feedstock into two streams (metal flakes and plastic particles), the processing time of the electrochemical treatment would reduce (due to improved contact between the drum electrodes and metal flakes), and three times more material per cycle (by weight) would be processed (the density of the metal flakes is three times more than the metallized plastic).
These recommended improvements were explored from the technological and economic and environmental sustainability perspectives in ReComp II.

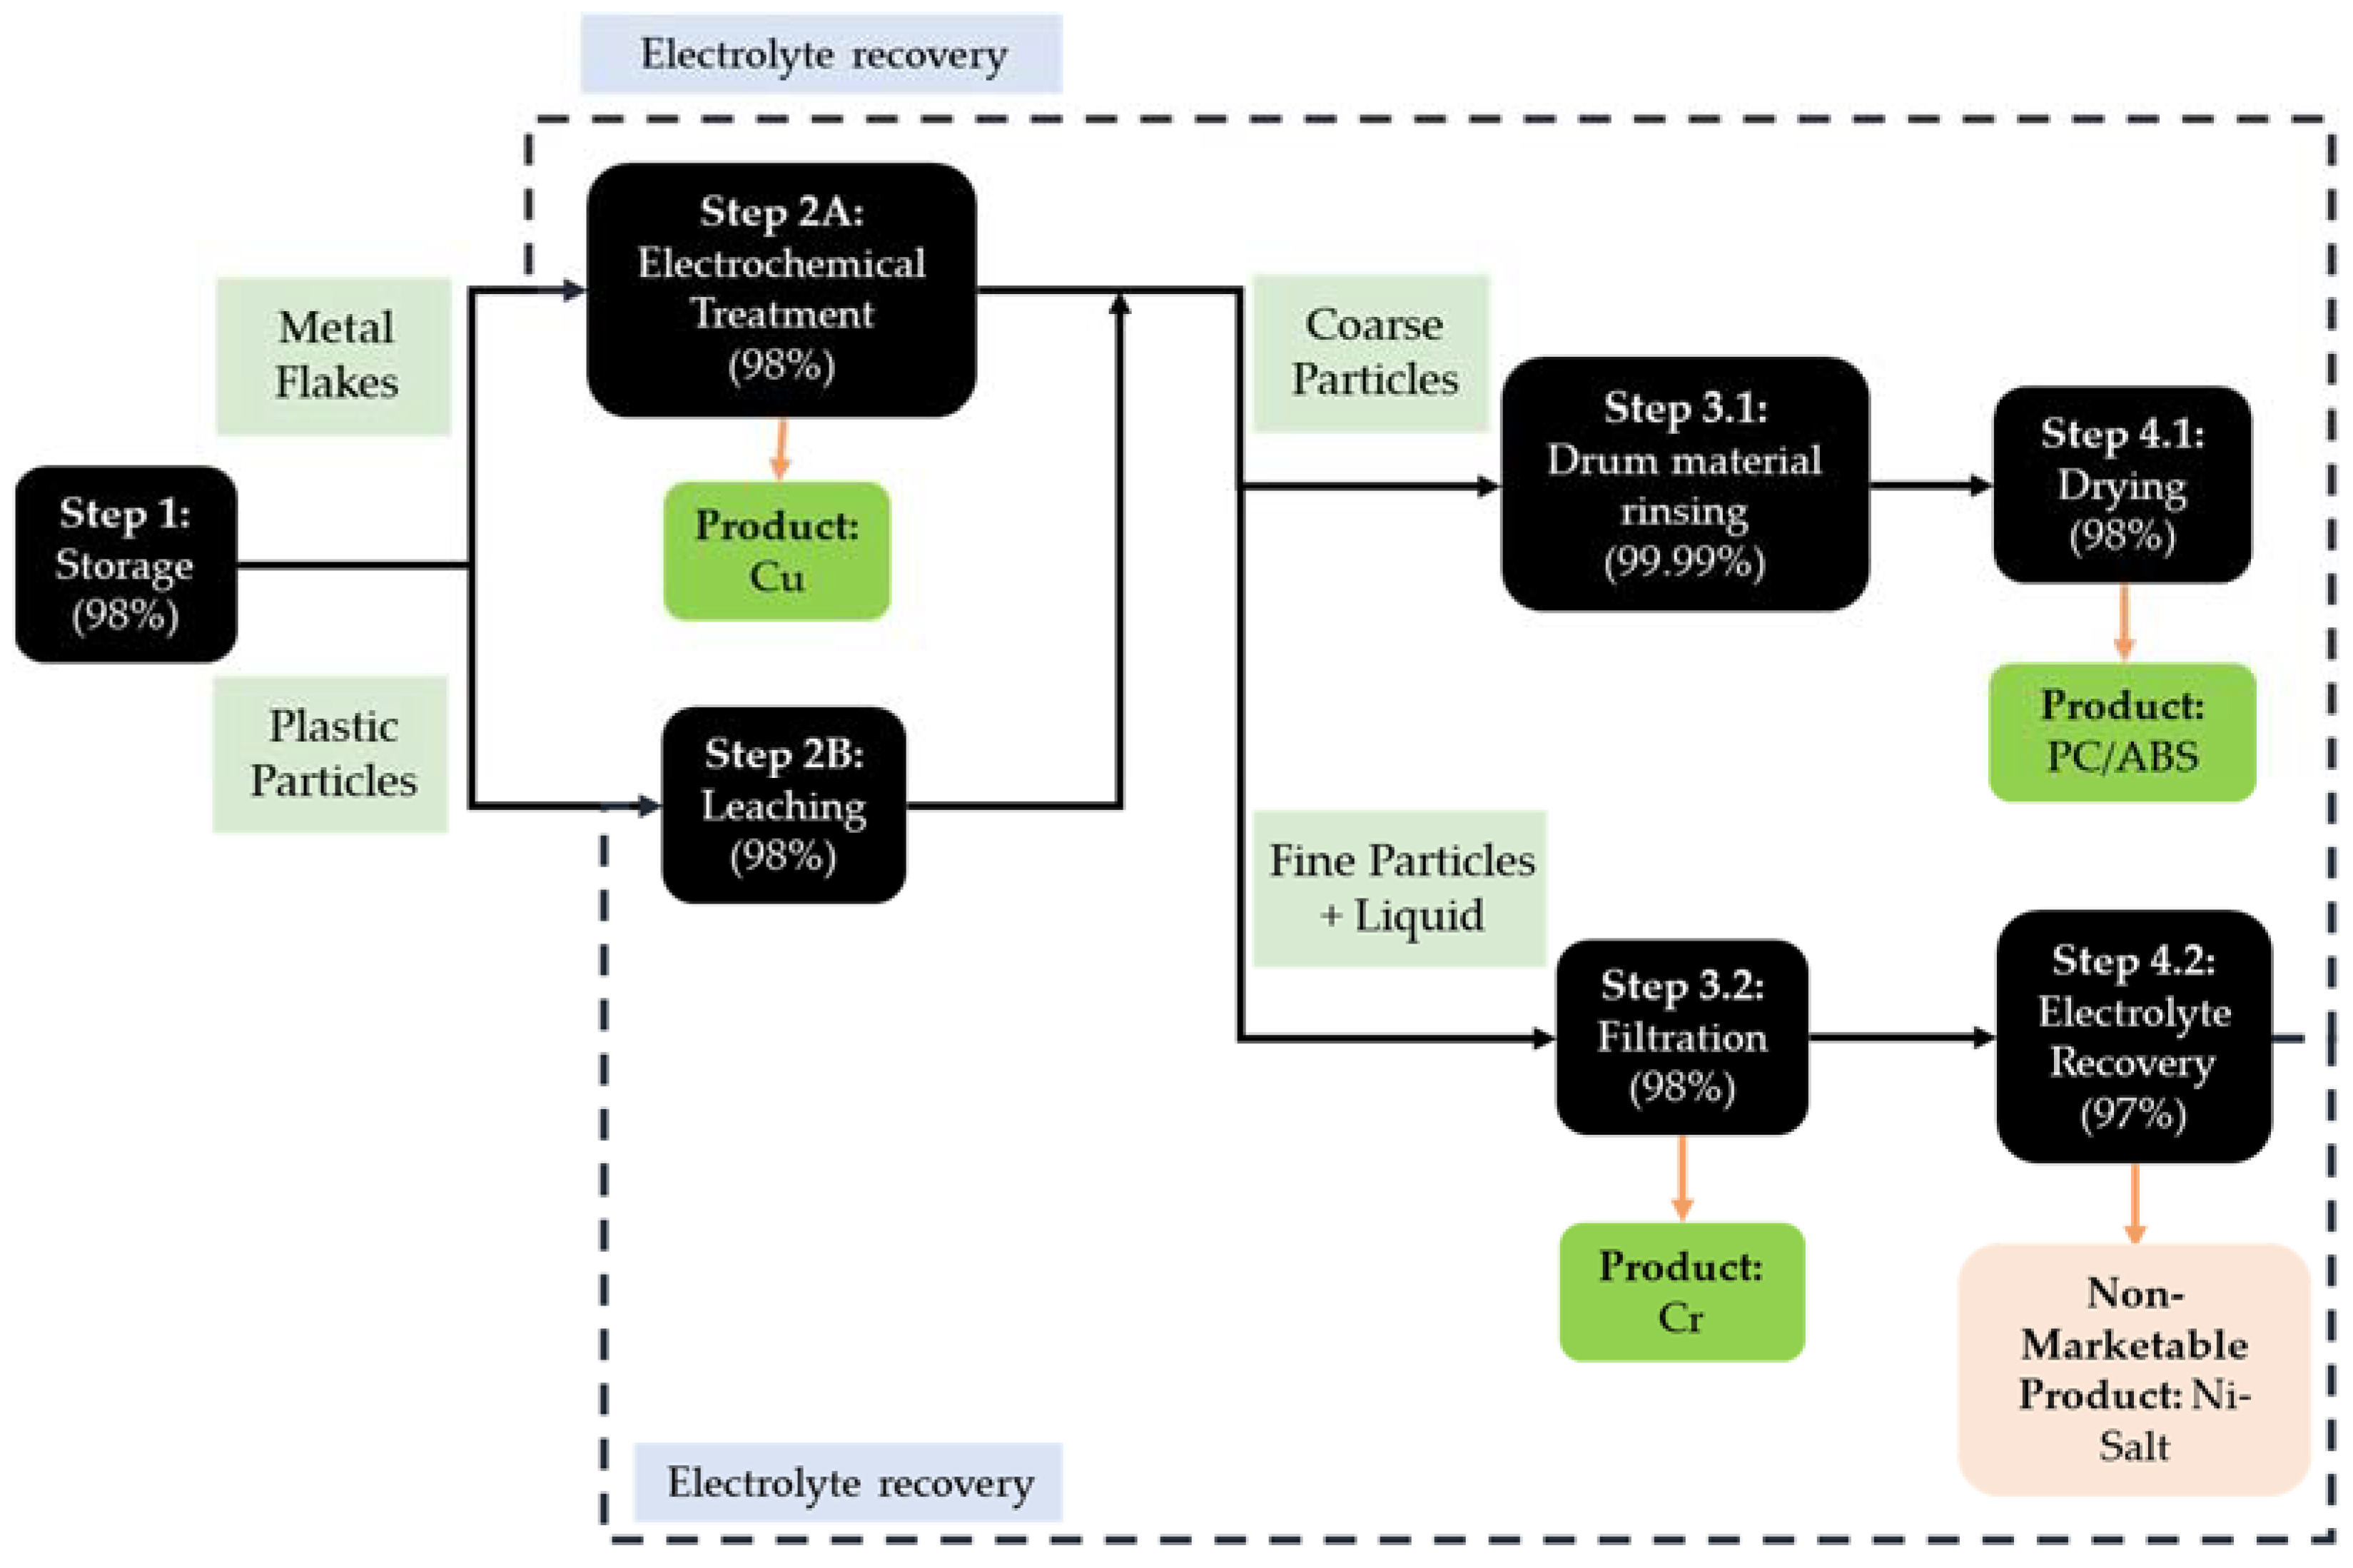
3.4. Process Flow of ReComp II and Comparison to ReComp I

ReComp II was developed with the goal of improving the financial viability of the process by increasing the output of marketable products, preferably also with an improvement in environmental outcomes. This was achieved through changing the feedstock from a mixed metallized plastic stream to a feedstock with two distinct material types (metal flakes and plastic particles).
The resultant process is shown in Figure 13. From storage, the metal flakes were directed to electrochemical treatment (Step 2A) whilst the plastic particles were directed to leaching (Step 2B). The remaining process steps were then somewhat similar to ReComp I, whereby the coarse particles (plastic particles) were processed through drum material rinsing (Step 3.1) and drying (Step 4.1), whilst the metal flakes and electrolyte were processed through filtration (Step 3.2). The electrolyte was recovered (Step 4.2) and recirculated back to electrochemical treatment and leaching. Based on this setup, the cycle time of ReComp II was reduced from 15 days (in ReComp I) to 5 days, due to the faster processing time in the electrochemical treatment step. During each cycle, 30 kg of metal flakes and 120 kg of plastic particles could be processed, requiring 210 L of the electrolyte, and resulting in 1500 kg of metal flakes, and 6100 kg of PC/ABS (or 7600 kg of waste input) processed per year.
A description of the process steps for ReComp I and ReComp II is provided in Table 8, which also highlights the differences between each process.

3.5. Sustainability Assessment of ReComp II and Comparison to ReComp I

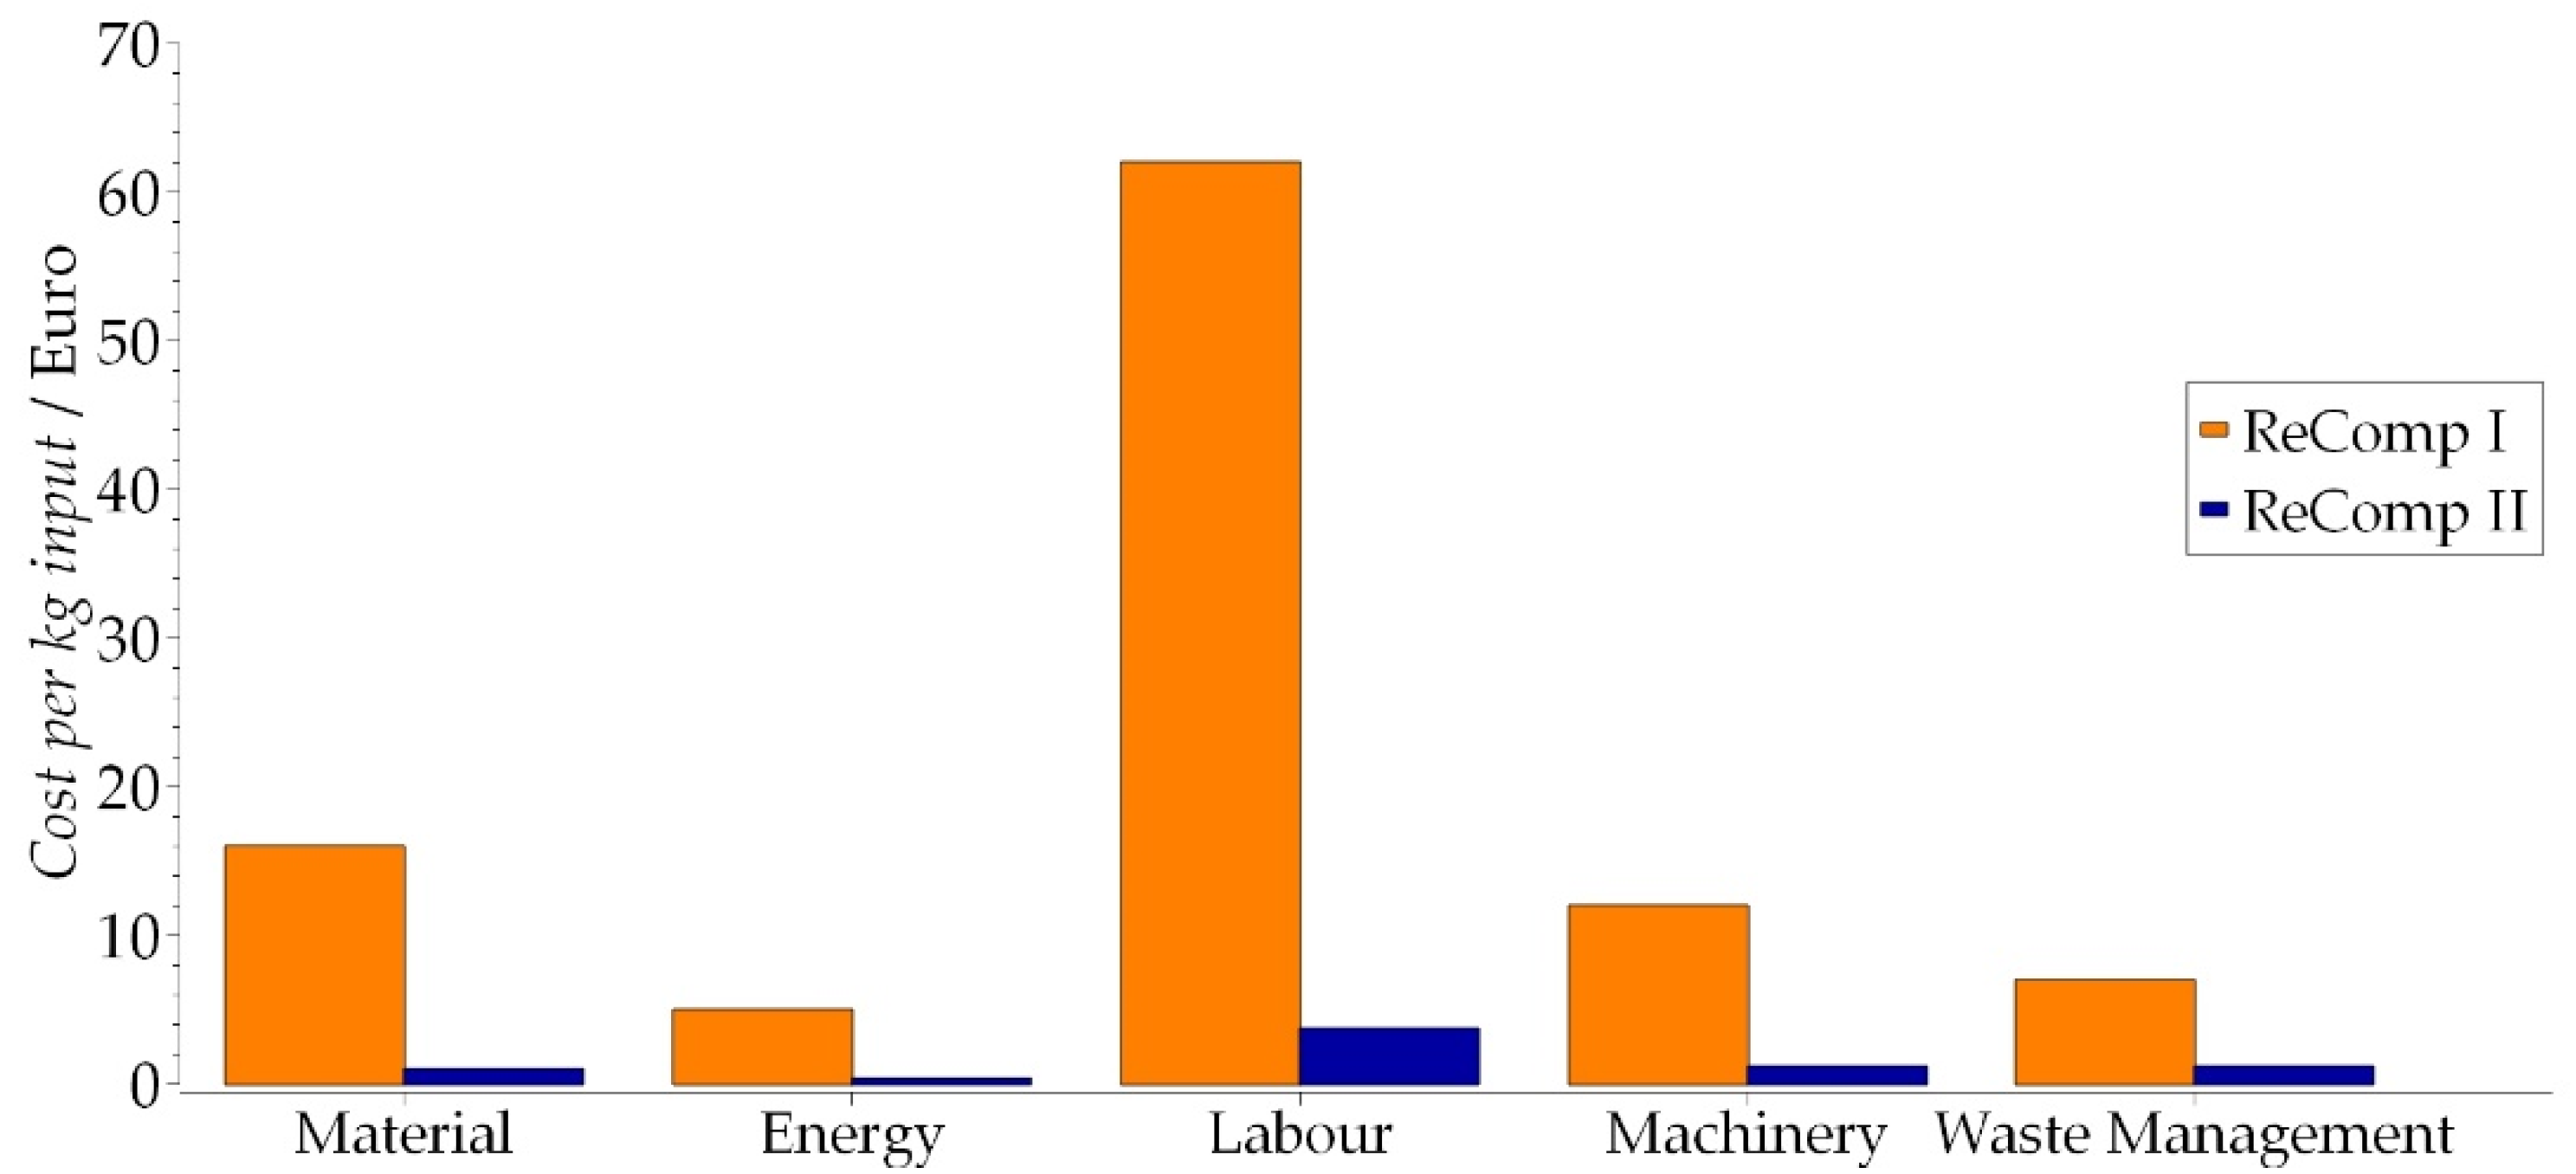
3.5.1. Economic Assessment of ReComp II with MFCA and Comparison

The material flow model for ReComp II was defined according to the process steps (see Figure 13) and consisted of seven quantity centres due to the addition of Step 2A, leaching. Table 9 provides a qualitative description of the inputs and outputs for the categories of energy (E), materials (M), labour (L), output materials (OM), wastes (W), products (P), and byproducts (BP).
The cost flow result for ReComp II is shown in Figure 14 (values are rounded to two significant figures). This diagram provides details regarding the allocation of costs to either waste (waste management and material loss) or final products.
As shown in ReComp II (see Figure 14), there was an initial greater cost flow from QC1 to QC2B due to the larger mass of plastics treated (120 kg per 5-day cycle) compared to the metals (30 kg per 5 day-cycle). Even after QC2B, once the electrolyte was sent to QC3.2 for further treatment and recovery, the higher cost stream remains in the plastic-rich fraction. In all cases, the costs were allocated to the material streams based on their relative mass. The total cost of the process was 56,000 EUR/annum, with EUR 45,000 associated with product costs, and EUR 11,000 associated with waste management costs. Based on the process flow improvements, the cost of the process per kg of input waste material reduced from c. 103 EUR/annum in ReComp I to c. 7 EUR/annum in ReComp II (i.e., 93%). Figure 15 shows a comparison of the project costs against each cost category (per kg of input).
Table 10 summarises the revenue from the sale of copper, PC/ABS, and chromium. These are in total c. 18,700 EUR/annum, with an average revenue per kg of product sale of 3 EUR/kg (similar to ReComp I). Despite the process flow improvements, ReComp II was calculated at a loss of c. 37,000 EUR/annum, equivalent to c. 5 EUR/kg of waste input. This represents a 95% improvement compared to ReComp I (c. 100 EUR/kg of waste input; see Section 3.3.1).

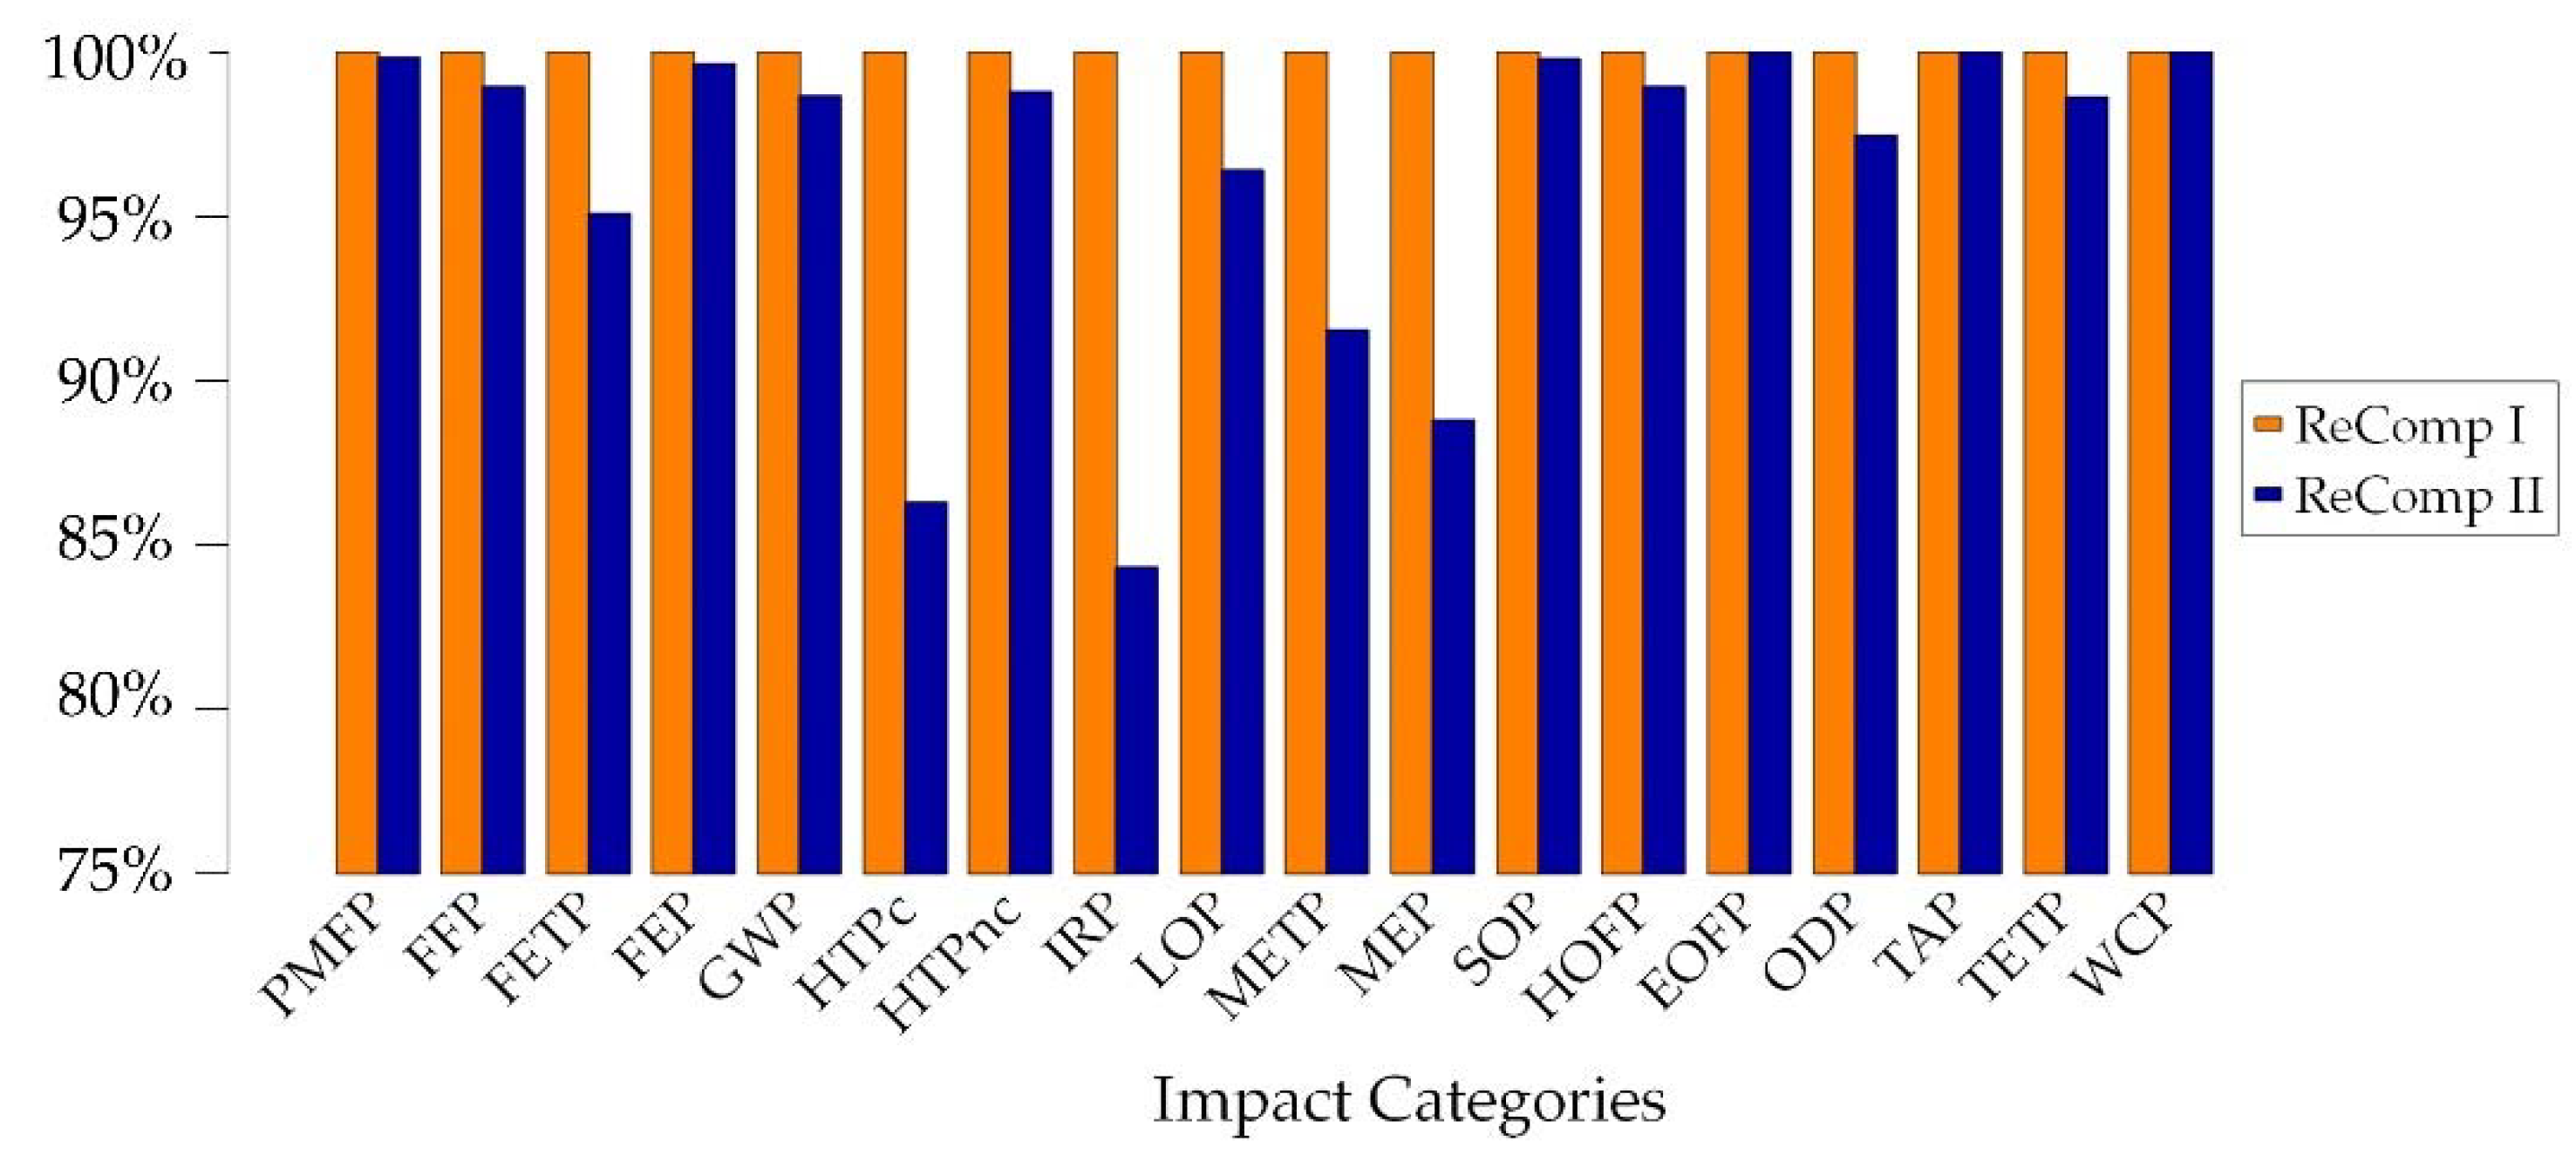
3.5.2. Ecological Assessment of ReComp II with LCA and Comparison to ReComp I

The results of the impact assessment of the E-LCA using ReCiPe 2016 (mid-point impact categories) for ReComp I versus ReComp II are shown in Table 11 and Figure 16. As for the ecological result of ReComp I versus primary production, the maximum result (ReComp I) was set to 100% and the results of ReComp II are displayed relative to it. As shown here, ReComp II had a lowered environmental impact compared to ReComp I for all 18 impact categories.
Based on a modelled annual throughput of 170 kg of metallized plastic and GWP of 2.24 kg of CO2 eq/kg of metallized plastic (for ReComp I), and modelled throughput of 7650 kg of metallized plastic and GWP of 2.21 kg of CO2 eq/kg of metallized plastic (for ReComp II), ReComp II has the potential to save 16.5 tonnes of CO2 eq per annum. This is a 44-time increase in savings compared to ReComp I.

3.5.3. Identification of Improvement Options

The economic performance of ReComp II, compared to ReComp I, was significantly improved by 95 EUR/kg of waste input by separating the waste stream into two components, the metal flakes and plastic particles. This is because the separated waste stream allowed for an increase in throughput through the electrochemical treatment step due to the feedstocks’ increase in density and electrical conductivity. This reduced the overall cycle time from 15 to 5 days and allowed for a three-fold increase in drum capacity, without the need for significant investments. The environmental performance of ReComp II across the impact categories also improved compared to ReComp I by up to 15%/kg of metallized plastic. This is because the increase in processing capacity was achieved without the need for significant machinery upgrades or energy input.
Further improvements to the process as “ReComp III” would involve purifying the nickel salt to marketable quality. This would reduce the waste management costs of QC 4.2 by around 5000 EUR/annum as well as bring revenue from the marketable product. Therefore, process steps would have to be developed to precipitate a high-purity nickel salt (e.g., nickel chloride) or deposition of high-purity nickel. Based on a current market value of 42 EUR/kg [29], the sale of nickel chloride (99.5% purity) provides a significant economic potential of a 110,000 EUR/annum income. Alternatively, nickel (99.8% purity) could be sold for 19 EUR/kg [30]. The environmental benefit of ReComp III would also likely improve when compared to ReComp II due to the reduced waste and dependency on primary production of nickel. A detailed analysis of the cost development and environmental impact would be necessary to understand the overall benefit when compared to the additional economic and environmental burdens associated with the nickel purification process steps.

4. Summary and Conclusions

By applying the CSIP approach to ReComp, a technological route was developed to recover high-purity copper and chromium, high-purity PC/ABS, and the recovery and reuse of the electrolyte. The ReComp CSIP consisted of two project phases, ReComp I and ReComp II.
ReComp I, although significantly more environmentally friendly (>90%) than the primary production of copper, chromate, and PC/ABS, was not economically sustainable due to its EUR 17,000 loss per annum. Additionally, it had a high process cost of 103 EUR/kg of input material. This was due, in part, to the limited capacity of ReComp I to a maximum throughput of 170 kg/annum as a result of the mixed waste’s low density and operability of the drum electrode. Therefore, using CSIP, improvements were focused on finding solutions to reduce the overall processing time and increasing the throughput (focusing on the electrochemical treatment). The goal of these improvements was to increase the process rate, product output, and subsequent revenue from marketable products. These improvements took the form of ReComp II. In ReComp II, by implementing a shredding method that produced two separate “nearly pure” feedstock streams, metal flakes and plastic particles, the cycle time of ReComp was reduced from 15 to 5 days. This was due to the improved contact between the drum electrodes and metal flakes. Additionally, the throughput (by weight) of the waste material per cycle increased three-fold (due to the three times higher material density of the metal flakes compared to metallized plastic). In parallel, the plastic particles were purified with a simple chemical leaching process. Therefore, ReComp II was modelled as being able to process 7600 kg of metallized plastic per annum, with a reduced process cost per kg of waste input of 93% compared to ReComp I. However, despite this improvement in process efficiency, ReComp II was still calculated as making a loss of 37,000 EUR/annum due to the low market value of the products. From an environmental perspective, ReComp II provided a 4% on average improvement across the environmental indicators compared to ReComp I. Therefore, this study provides not only a case study of the implementation of CSIP but also proves an important result that an improvement in environmental performance can also correlate to an improved economic result, due to lower waste management, material, and energy input costs. It also proves the result that despite process improvements, economic outcomes are dependent on the market value of products. Without an appropriately priced market, recycling cannot achieve economic viability.
Further iterations of ReComp will focus on improving the economic and environmental result. One method that will be explored will be including additional processes to purify the nickel salt to marketable quality, either in the form of nickel or nickel chloride. This would reduce the waste management costs and provide additional revenue from product sales that could result in a profitable recycling process for metallized plastics from automotive production scrap material. Methods to achieve this could include precipitation of a specific nickel salt or electrodeposition of pure nickel. Additionally, the yield of copper could be improved by increasing the duration of electrolysis. As per the CSIP, a detailed analysis of the cost development and environmental impact would be conducted in this third ReComp iteration. This analysis would be conducted to understand the overall benefit of the additional process steps when compared to the economic and environmental burdens associated with them.

Author Contributions

Investigation, A.B.-O., B.-K.C., H.K., M.G. and J.R.; Rotating drum design and 3D model printing, A.D. and S.V.; MFCA and LCA assessment and validation, C.W., A.R.K.P., M.G. and G.B.; Writing—original draft preparation, C.W., B.-K.C., A.R.K.P., A.B.-O., H.K. and G.B. All authors have read and agreed to the published version of the manuscript.

Funding

This project is funded by the German Federal Ministry for Economic Affairs and Climate Action (BMWK) via the Central Innovation Programme for Small and Medium Sized Enterprises (ZIM), Project No. ZF4774501CM9.

Institutional Review Board Statement

Not applicable.

Informed Consent Statement

Not applicable.

Data Availability Statement

That data presented in this study are available on request from the corresponding author. The data are not publicly available due to privacy restrictions.

Acknowledgments

This article was developed as part of the research project ReComp. The authors acknowledge the support of Krall Kunststoff-Recycling GmbH for providing the feedstock material.

Conflicts of Interest

The authors declare no conflict of interest. The funders had no role in the design of the study; in the collection, analyses, or interpretation of data; in the writing of the manuscript; or in the decision to publish the results.

References

  1. Melentiev, R.; Yudhanto, A.; Tao, R.; Vuchkov, T.; Lubineau, G. Metallization of polymers and composites: State-of-the-art approaches. Mater. Des. 2022, 221, 110958. [Google Scholar] [CrossRef]
  2. Knappich, F.; Schlummer, M.; Mäurer, A.; Prestel, H. A new approach to metal- and polymer-recovery from metallized plastic waste using mechanical treatment and subcritical solvents. J. Mater. Cycles Waste Manag. 2018, 20, 1541–1552. [Google Scholar] [CrossRef]
  3. Federal Statistical Office of Germany. Press Release No. N 035. 7 June 2022. Available online: https://www.destatis.de/EN/Press/2022/06/PE22_N035_51.html (accessed on 23 February 2023).
  4. Numfor, S.A.; Omosa, G.B.; Zhang, Z.; Matsubae, K. A Review of Challenges and Opportunities for End-of-Life Vehicle Recycling in Developing Countries and Emerging Economies: A SWOT Analysis. Sustainability 2021, 13, 4918. [Google Scholar] [CrossRef]
  5. Turner, A.; Filella, M. Hazardous metal additives in plastics and their environmental impacts. Environ. Int. 2021, 156, 106622. [Google Scholar] [CrossRef] [PubMed]
  6. International Energy Agency. The Role of Critical World Energy Outlook Special Report Minerals in Clean Energy Transitions. 2021. Available online: https://www.iea.org/reports/the-role-of-critical-minerals-in-clean-energy-transitions (accessed on 23 February 2023).
  7. European Commission, Directorate-General for Internal Market, Industry, Entrepreneurship and SMEs; Blengini, G.; El Latunussa, C.; Eynard, U.; Torres De Matos, C.; Wittmer, D.; Georgitzikis, K.; Pavel, C.; Carrara, S.; Mancini, L.; et al. Study on the EU’s List of Critical Raw Materials (2020)—Final Report; Publications Office of the European Union: Luxembourg, 2020; Available online: https://data.europa.eu/doi/10.2873/11619 (accessed on 27 July 2023).
  8. The Organisation for Economic Cooperation and Development (OECD). Global Plastics Outlook: Economic Drivers, Environmental Impacts and Policy Options; OECD: Paris, France, 2022. [Google Scholar] [CrossRef]
  9. Nagashima, T.; Akiyama, H.; Namihira, T.; Katsuki, K. Recycle of metal-plating on plastics by pulse arc discharge. In Proceedings of the 2007 16th IEEE International Pulsed Power Conference, Albuquerque, NM, USA, 17–22 June 2007; IEEE: Piscataway, NJ, USA, 2007; pp. 1437–1440. [Google Scholar] [CrossRef]
  10. Elsayed, D.M.; Abdelbasir, S.M.; Abdel-Ghafar, H.M.; Salah, B.A.; Sayed, S.A. Silver and copper nanostructured particles recovered from metalized plastic waste for antibacterial applications. J. Environ. Chem. Eng. 2020, 8, 103826. [Google Scholar] [CrossRef]
  11. Knappich, F.; Hartl, F.; Schlummer, M.; Mäurer, A. Complete Recycling of Composite Material Comprising Polybutylene Terephthalate and Copper. Recycling 2017, 2, 9. [Google Scholar] [CrossRef]
  12. Cardenas-Cristancho, D.; Monticolo, D.; Muller, L.; Lhoste, P. CIGI 2021 Continuous Improvement process model: A Knowledge Management approach. In Proceedings of the Conférence Internationale de Génie Industriel—QUALITA, Grenoble, France, 5–7 May 2021; Available online: https://hal.science/hal-03288224 (accessed on 5 June 2023).
  13. Aleu, F.G.; Van Aken, E.M. Systematic literature review of critical success factors for continuous improvement projects. Int. J. Lean Six Sigma 2016, 7, 214–232. [Google Scholar] [CrossRef]
  14. ISO 9001:2015; Quality Management Systems—Requirements. International Organisation for Standardisation (ISO): Geneva, Switzerland, 2015.
  15. Realyvásquez-Vargas, A.; Arredondo-Soto, K.; Carrillo-Gutiérrez, T.; Ravelo, G. Applying the Plan-Do-Check-Act (PDCA) Cycle to Reduce the Defects in the Manufacturing Industry. A Case Study. Appl. Sci. 2018, 8, 2181. [Google Scholar] [CrossRef]
  16. Arredondo-Soto, K.C.; Blanco-Fernandez, J.; Miranda-Ackerman, M.A.; Solis-Quinteros, M.M.; Realyvasquez-Vargas, A.; Garcia-Alcaraz, J.L. A Plan-Do-Check-Act Based Process Improvement Intervention for Quality Improvement. IEEE Access 2021, 9, 132779–132790. [Google Scholar] [CrossRef]
  17. Christ, K.L.; Burritt, R.L. Material flow cost accounting: A review and agenda for future research. J. Clean. Prod. 2015, 108, 1378–1389. [Google Scholar] [CrossRef]
  18. ISO 14051:2011; Environmental Management—Material Flow Cost Accounting—General Framework. International Organisation for Standardisation (ISO): Geneva, Switzerland, 2011.
  19. Berlin Wasserbetriebe (BWB). Our Tariffs for Drinking Water and Drainage. 2023. Available online: https://www.bwb.de/en/1720.php (accessed on 26 February 2023).
  20. Carl Roth—Germany. Methanesulphonic acid, 1 l, CAS No. 75-75-2. Available online: https://www.carlroth.com/de/en/a-to-z/methanesulphonic-acid/p/4090.3 (accessed on 3 March 2023).
  21. Bundesverband der Energie- und Wasserwirtschaft e.V (BDEW). Industrial Electricity Prices Including Tax Germany 1998–2022|Statista. Available online: https://www.statista.com/statistics/1050448/industrial-electricity-prices-including-tax-germany/?fbclid=IwAR1-dsnrDrKSxUtuzvp_wegPGoQXOoZD_XiMHGoK0kvLePfvfqE9t9PwMVw (accessed on 26 February 2023).
  22. Berliner Stadtreinigungsbetriebe (BSR). Entgelte Schadstoffe; BSR: Berlin, Germany, 2023; Available online: https://www.bsr.de/assets/downloads/Gebuehren_Recyclinghof_Abfaelle_und_Schadstoffannahme_bf.pdf (accessed on 1 March 2023).
  23. Plasticker. Plasticker: Market & Prices. Available online: https://plasticker.de/preise/preise_monat_single.php (accessed on 27 February 2023).
  24. Schrott24. Kupfer schwer, Berry min. 98% Cu. 2023. Available online: https://www.schrott24.de/altmetall-ankauf/kupfer/kupfer-1-a-98-cu-berry/ (accessed on 11 September 2023).
  25. Strem. Strem Catalog: 93-2456 Chromium › Chromium Pieces (99.3%). 2023. Available online: https://www.strem.com/catalog/v/93-2456/15/chromium_7440-47-3 (accessed on 11 September 2023).
  26. Mistry, M.; Gediga, J.; Boonzaier, S. Life cycle assessment of nickel products. Int. J. Life Cycle Assess 2016, 21, 1559–1572. [Google Scholar] [CrossRef]
  27. ISO 14040:2006; Environmental Management—Life Cycle Assessment—Principles and FRAMEWORK. International Organisation for Standardisation (ISO): Geneva, Switzerland, 2006.
  28. ISO 14044:2006; Environmental Management—Life Cycle Assessment—Requirements and Guidelines. International Organisation for Standardisation (ISO): Geneva, Switzerland, 2006.
  29. SuboLab GmbH Fine and Industrial Chemicals. Nickel (II) Chloride Nickel Chloride. Available online: https://www.subolab.de/en/nickelchlorid.html (accessed on 11 September 2023).
  30. Deutsche Rohstoffagentur (DERA) in der Bundesanstalt für Geowissenschaften und Rohstoffe (BGR). Preismonitor Juli 2023. July 2023. Available online: https://www.deutsche-rohstoffagentur.de/DERA/DE/Aktuelles/Monitore/2023/07-23/2023-07-preismonitor.pdf;jsessionid=02A12583C235C11EE7F84104C6AD7A33.internet012?__blob=publicationFile&v=3 (accessed on 11 September 2023).
Figure 1. The idea of the Continuous Sustainable Improvement Process (CSIP) in a sustainability–time diagram with a PDCA cycle between “technological process developments” and “sustainability assessment”. The PDCA cycle helps to increase the sustainability of ReComp I to ReComp II.
Sustainability 15 14737 g001
Figure 2. Detailed steps of the Continuous Sustainability Improvement Process.
Sustainability 15 14737 g002
Figure 3. (a) A 3D-printed PLA drum electrode with eight platinised titanium-mesh electrodes and filled with shredded metallized plastic. (b) Experimental setup in 1 M methane sulfonic acid.
Sustainability 15 14737 g003
Figure 4. Summary of the MFCA approach for emerging technologies.
Sustainability 15 14737 g004
Figure 5. Boundaries of E-LCA.
Sustainability 15 14737 g005
Figure 6. (a) Metallized PC/ABS automotive parts (number plate frames); (b) shredded metallized plastic (input material, ReComp I); (c) metal flakes (input A, ReComp II).
Sustainability 15 14737 g006
Figure 7. (a) SEM image of the metallic coating cross-section; (b) EDX mapping showing the elemental composition of the different layers of the metal coating on PC/ABS (top layer: Cr (yellow), middle layer: Ni (green), and inner layer on plastic: Cu (blue)).
Sustainability 15 14737 g007
Figure 8. Metal yield in the electrolyte of Cu, Ni, and Cr after 3 h of leaching at 60 °C.
Sustainability 15 14737 g008
Figure 9. Microscopic image of recovered metal: chromium flakes.
Sustainability 15 14737 g009
Figure 10. ReComp I process flow.
Sustainability 15 14737 g010
Figure 11. ReComp I cost flow diagram.
Sustainability 15 14737 g011
Figure 12. Graphical representation of E-LCA results for primary production vs. ReComp I.
Sustainability 15 14737 g012
Figure 13. ReComp process flow diagram. Target products: Cu, Cr, and PC/ABS. Recovery of electrolyte for reuse in the process.
Sustainability 15 14737 g013
Figure 14. ReComp II cost flow diagram.
Sustainability 15 14737 g014
Figure 15. Comparison of project cost per kg of input material for ReComp I and ReComp II.
Sustainability 15 14737 g015
Figure 16. A graphical representation of E-LCA results for ReComp I vs. ReComp II.
Sustainability 15 14737 g016
Table 1. Material model flows and units of measurement.
EnergyMaterials
(Solids)
Materials
(Liquids)
LabourMachineryWastesProductsByproducts
Kilowatt HourKilogramLitresHoursNumber of machines
Years (for depreciation)
KilogramKilogramKilogram
Table 2. Costs for auxiliary materials used in ReComp I and II.
Cost ClassificationDescriptionPrice
(excl. VAT)
Price UnitsSource
Direct MaterialsMetallized Plastics (ReComp I)0N/AZero cost
Industrial production waste streams and a small portion from end-of-life vehicles.
Metal Flakes and Plastic Particles (ReComp II)
Indirect MaterialsDeionised Water0.05182 EUR/LBerlin Wasserbetriebe (BWB) [19]
CH3SO3H (Purity: 99.5% p.a. ACS)94.90EUR/LCarl Roth GmbH and Co. KG [20]
EnergyElectricity 0.27EUR/kWhAverage industrial prices including tax in Germany for 2022 [21]
Labour CostsProduction Worker20EUR/hCompany data
Engineer30EUR/hCompany data
Table 3. Sample waste chemical composition in weight percentage determined with XRF (wt.%).
MaterialNickel/wt.%Copper/wt.%Chromium/wt.%PC/ABS/wt.%
Input, ReComp I
(Shredded particles of metallized plastic)
13.97.90.278.0
Input A, ReComp II
(Shredded metal flakes)
42.752.00.64.7
Input B, ReComp II
(Shredded plastic particles)
tracestracestraces~100
Table 4. Electrolysis experiment results (Applied voltage: 0.8 V, max. current: 1.0 A, duration: 3 days).
MaterialRecovery Yield %Purity %
Cathode (Cu)2399.8
Filtrate (Cr)9899.4
Table 5. Qualitative description of inputs and outputs for ReComp I.
InputQCOutput
Metallized plastic (M), technician (L), container (Ma), hand forklift (Ma), IBC tank (Ma)QC1: StorageMetallized plastic (OM), loss of metallized plastics (2%) (W)
Electricity (E), metallized plastic (M), electrolyte (M), technician (L), galvanic system electrodes (Ma)QC2: Electrochemical TreatmentWet and acidic PC/ABS (OM), used electrolyte with Cr particles (OM), loss of metallized plastics (2%) (W), Cu (P)
Electricity (E), wet and acidic PC/ABS (M), technician (L), water bath (Ma)QC3.1: Drum Material RinsingWet PC/ABS (OM), acidic water (W), loss of PC/ABS (0.01%) (W)
Electricity (E), wet PC/ABS (M), technician (L), dewatering machine (Ma)QC4.1: Plastic DewateringWater (W), loss of PC/ABS (2%) (W), PC/ABS (P)
Electricity (E), used electrolyte with Cr particles (M), technician (L), filter bags (Ma), IBC container (Ma), pump set (Ma)QC3.2: FiltrationUsed electrolyte (OM), loss of Cr particles (2%) (W), Cr particles (P)
Electricity (E), used electrolyte (M), technician (L), distillation apparatus (Ma), pump set (Ma)QC4.2: Electrolyte RecoveryDistillation residue with Ni/Cu precipitate (W), loss of electrolyte (3%), Purified Electrolyte (BP)
Table 6. ReComp I revenue from product sales.
Quantity/kg/AnnumRevenue/EUR/Annum
Copper13.090
PC/ABS130.0300
Chromium0.355
SUM143.3445
Table 7. E-LCA Numerical Results for Primary Production vs. ReComp I (ReCiPe 2016, mid-point impact categories).
No.Impact CategoryUnitPrimary ProductionReComp I
1Fine particulate matter formation (PMFP)kg PM2.5 eq 6.99 × 10 2 5.49 × 10 2
2Fossil resource scarcity (FFP)kg oil eq 2.95 5.68 × 10 1
3Freshwater ecotoxicity (FETP)kg 1,4-DCB 3.03 5.38 × 10 1
4Freshwater eutrophication (FEP)kg P eq 6.17 × 10 3 2.79 × 10 3
5Global warming (GWP)kg CO2 eq 9.55 2.24
6Human carcinogenic toxicity (HTPc)kg 1,4-DCB 5.25 × 10 1 1.97 × 10 1
7Human non-carcinogenic toxicity (HTPnc)kg 1,4-DCB 41.4 16.8
8Ionizing radiation (IRP)kBq Co-60 eq 9.01 × 10 2 2.04 × 10 2
9Land use (LOP)m2a crop eq 2.43 × 10 1 6.45 × 10 2
10Marine ecotoxicity (METP)kg 1,4-DCB 3.86 7.46 × 10 1
11Marine eutrophication (MEP)kg N eq 1.94 × 10 4 1.34 × 10 4
12Mineral resource scarcity (SOP)kg Cu eq 5.88 × 10 1 4.84 × 10 1
13Ozone formation, human health (HOFP)kg NOx eq 4.95 × 10 2 1.93 × 10 2
14Ozone formation, terrestrial ecosystems (EOFP)kg NOx eq 5.04 × 10 2 1.95 × 10 2
15Stratospheric ozone depletion (ODP)kg CFC-11 eq 7.50 × 10 7 3.14 × 10 7
16Terrestrial acidification (TAP)kg SO2 eq 2.19 × 10 1 1.82 × 10 1
17Terrestrial ecotoxicity (TETP)kg 1,4-DCB 54.3 14.7
18Water consumption (WCP)m3 41.6 33.6
Table 8. Process Descriptions for ReComp I and ReComp II.
Process StepProcess Description (ReComp I)Changes in Process (ReComp II)
Step 1: StorageThe shredded metallized plastics are stored and prepared for the next batch in this quantity centre. Shredding produces two different material streams—plastic particles and metal flakes. These are stored separately.
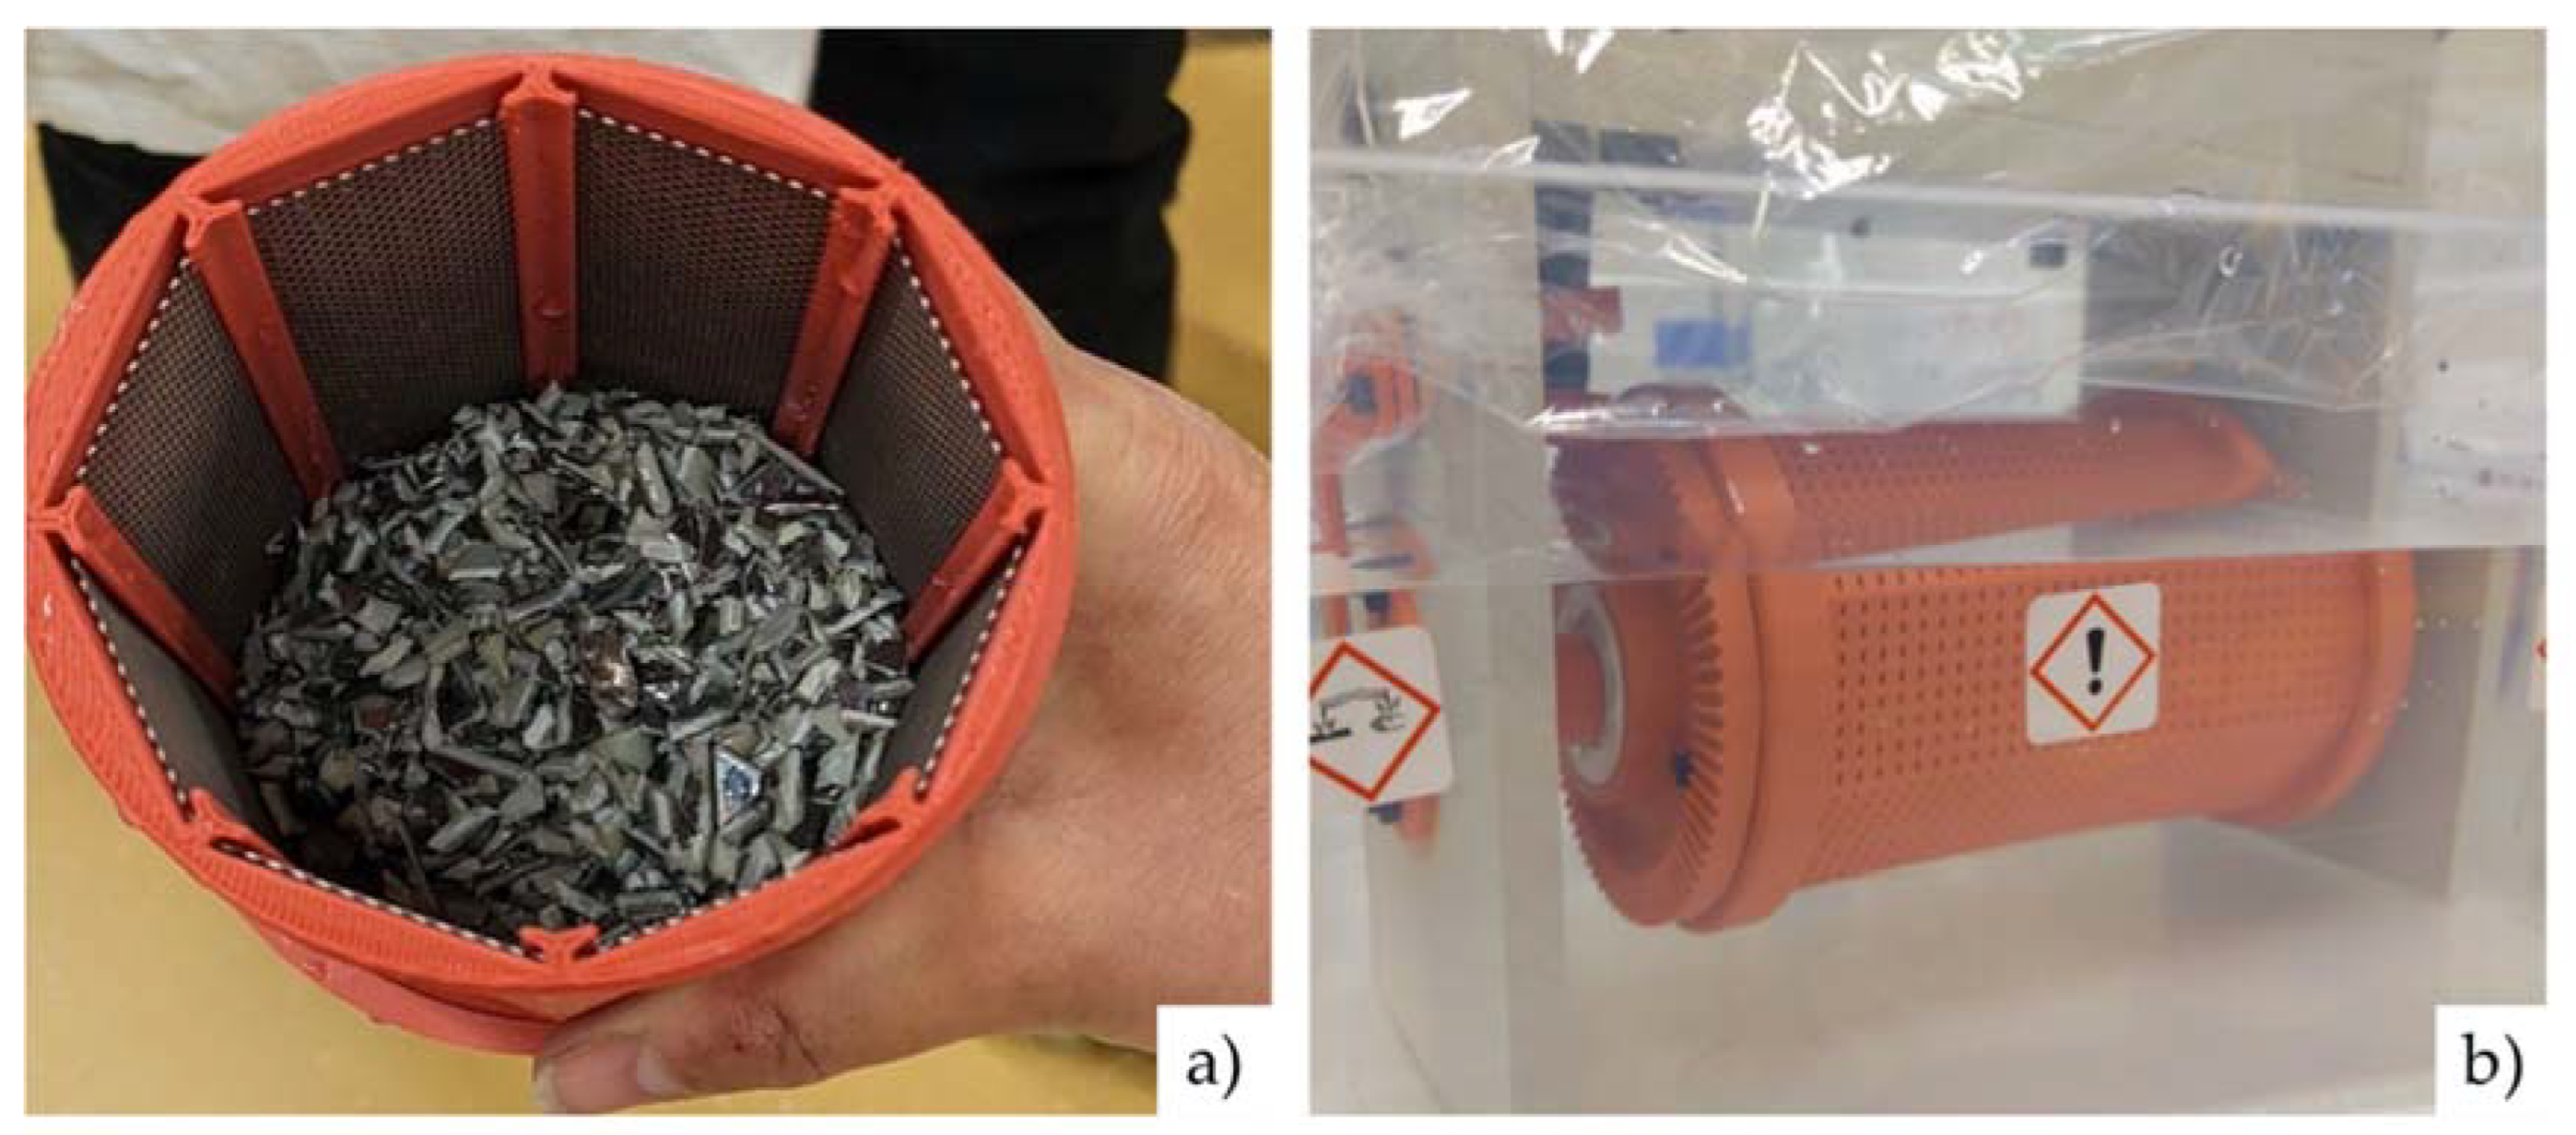
Step 2A: Electrochemical Treatment (including Cu Deposition and Recovery of Cr as Flakes)The pre-processed metallized plastic particles are filled in a rotary drum electrode. The drum is placed in a bath with an electrolyte (methanesulfonic acid, CH3SO3H) in a three-electrode setup (the drum is the working electrode, Cu foil as counter, and standard hydrogen as reference electrode). An electrical voltage is used to dissolve copper and nickel from the plastic (PC/ABS). The voltage is applied in a way that copper is deposited, and chromium is not dissolved but instead separated as metal flakes.Similar to ReComp I, except that now only metal flakes are processed in the electrochemical treatment. This reduces the overall cycle time.
Step 2B: LeachingThis process step only exists in ReComp II.This is a new step for ReComp II. The plastic flakes are held in a leaching reactor, filled with an electrolyte (methane sulfonic acid, CH3SO3H). The bath is heated and any remaining nickel and copper on the plastic flakes is dissolved.
Step 3.1: Drum Material RinsingPC/ABS is cleaned by immersing the drum from the QC2A in water. Thereby, the leftover acid is neutralised and the plastic cleaned. This process can clean large volumes of plastic very effectively.Similar to ReComp I, except that the PC/ABS is sourced from Step 2B, leaching for the plastic particles only.
Step 4.1: DryingHere, the water is removed from the plastic fraction. This process includes vacuum, centrifugation, filtration, solid–liquid separation processes, and removal of residual liquids with a filter press.No change from ReComp I
Step 3.2: FiltrationA ceramic filter is used to separate the chromium flakes from the electrolyte. The solid (chromium) parts remain on the filter, and the liquid passes through the pores.No change from ReComp I. Metal flakes are sourced from QC2B.
QC 4.2: Electrolyte RecoveryA distillation system designed to recover electrolyte with distillation. Nickel salt contaminated with the non-deposited copper is produced as a waste. The distillation system can purify and concentrate various acids and mixed acid solutions.Unlike ReComp I, where only the electrolyte from Step 2B is treated, the electrolyte recovery system in ReComp II recovers electrolyte from both processes Step 2A and 2B.
Table 9. Qualitative description of inputs and outputs for ReComp II.
InputQCOutput
Metal flakes (M), plastic particles (M), technician (L), container (Ma), hand forklift (Ma), IBC tank (Ma)QC1: StorageMetal flakes (OM), plastic particles (OM), loss of metal flakes and plastic particles (2%) (W)
Electricity (E), metal flakes (M), electrolyte (M), technician (L), galvanic system (Ma), electrodes (Ma)QC2A: Electrochemical TreatmentWet and acidic PC/ABS (OM), used electrolyte with Cr particles (OM), loss of metallized plastic (2%) (W), Cu (P)
Electricity (E), plastic flakes (M), electrolyte (M), technician (L), leaching reactor (Ma), cooling device (Ma), filter bag/collection vessel (Ma)QC2B: LeachingWet and acidic PC/ABS (OM), electrolyte with dissolved Ni and Cu (OM), Ni and Cr flakes (W), loss of electrolyte and I/ABS flakes (2%) (W)
Electricity (E), wet and acidic PC/ABS (M), technician (L), water bath (Ma)QC3.1: Drum Material RinsingWet PC/ABS (OM), acidic water (W), loss of PC/ABS (0.01%) (W)
Electricity (E), wet PC/ABS (M), technician (L), dewatering machine (Ma)QC4.1: Plastic DewateringWater (W), loss of IC/ABS (2%) (W), PC/ABS (P)
Electricity (E), used electrolyte with Cr particles (M), technician (L), filter bags (Ma), IBC container (Ma), pump set (Ma)QC3.2: FiltrationUsed electrolyte (OM), loss of Cr particles (2%) (W), Cr particles (P)
Electricity (E), used electrolyte (M), technician (L), distillation apparatus (Ma), pump set (Ma)QC4.2: Electrolyte RecoveryDistillation residue with Ni/Cu precipitate (W), loss of electrolyte (3%), Purified Electrolyte (BP)
Table 10. ReComp II revenue from product sales.
Quantity
kg/Annum
Revenue
EUR/Annum
Copper7605300
PC/ABS450011,000
Chromium142400
SUM527418,700
Table 11. E-LCA Numerical Results for ReComp I vs. ReComp II (ReCiPe 2016, mid-point impact categories).
No.Impact CategoryUnitReComp 1ReComp 2
1Fine particulate matter formation (PMFP)kg PM2.5 eq 5.49 × 10 2 5.48 × 10 2
2Fossil resource scarcity (FFP)kg oil eq 5.68 × 10 1 5.62 × 10 1
3Freshwater ecotoxicity (FETP)kg 1,4-DCB 5.38 × 10 1 5.21 × 10 1
4Freshwater eutrophication (FEP)kg P eq 2.79 × 10 3 2.78 × 10 3
5Global warming (GWP)kg CO2 eq2.24 2.21
6Human carcinogenic toxicity (HTPc)kg 1,4-DCB 1.97 × 10 1 1.70 × 10 1
7Human non-carcinogenic toxicity (HTPnc)kg 1,4-DCB 16.8 16.6
8Ionizing radiation (IRP)kBq Co-60 eq 2.04 × 10 2 1.72 × 10 2
9Land use (LOP)m2a crop eq 6.45 × 10 2 6.22 × 10 2
10Marine ecotoxicity (METP)kg 1,4-DCB 7.46 × 10 1 6.83 × 10 1
11Marine eutrophication (MEP)kg N eq 1.34 × 10 4 1.19 × 10 4
12Mineral resource scarcity (SOP)kg Cu eq 4.84 × 10 1 4.83 × 10 1
13Ozone formation, human health (HOFP)kg NOx eq 1.93 × 10 2 1.91 × 10 2
14Ozone formation, terrestrial ecosystems (EOFP)kg NOx eq 1.95 × 10 2 1.95 × 10 2
15Stratospheric ozone depletion (ODP)kg CFC-11 eq 3.14 × 10 7 3.06 × 10 7
16Terrestrial acidification (TAP)kg SO2 eq 1.82 × 10 1 1.82 × 10 1
17Terrestrial ecotoxicity (TETP)kg 1,4-DCB 14.7 14.5
18Water consumption (WCP)m3 33.6 33.6
Disclaimer/Publisher’s Note: The statements, opinions and data contained in all publications are solely those of the individual author(s) and contributor(s) and not of MDPI and/or the editor(s). MDPI and/or the editor(s) disclaim responsibility for any injury to people or property resulting from any ideas, methods, instructions or products referred to in the content.

