Article

Can Low–Carbon City Development Stimulate Population Growth? Insights from China’s Low–Carbon Pilot Program

1
School of Economics and Management, Beijing Forestry University, Beijing 100083, China
2
School of Economics and Finance, Hohai University, Nanjing 210024, China
*
Author to whom correspondence should be addressed.
Sustainability 2023, 15(20), 14751; https://doi.org/10.3390/su152014751
Submission received: 30 August 2023 / Revised: 25 September 2023 / Accepted: 29 September 2023 / Published: 11 October 2023

Abstract

:
In line with global trends, China confronts significant environmental challenges while navigating critical shifts in its population dynamics. The low–carbon pilot program, initiated in China in 2010 and spanning over 100 cities, is dedicated to reducing carbon emissions while facilitating robust economic growth. However, the program’s impact on population growth has remained uncertain. Employing a quasi–natural experiment and the Difference–in–Difference method, this study reveals a positive association between the program and population growth. The analysis of mediating effects indicates that the program potentially stimulates population growth by attracting more Investment and reducing exhaust emissions. Nevertheless, there is a lack of evidence supporting its ability to enhance population growth through the promotion of household income. Further investigation reveals a diminishing effect of the program on population growth as cities transition from eastern to middle to western regions. Notably, no substantial heterogeneity is observed concerning the impact of GDP per capita on population growth. This research contributes empirical insights into the relationship between low–carbon programs and population growth, offering valuable guidance to municipalities seeking to bolster their populations. The potency of these strategies can be augmented by attracting investment and enhancing air quality, in contrast to a sole focus on income levels. Ultimately, the study provides actionable policy recommendations in this context.

1. Introduction

Climate change, an overarching challenge confronted by nations worldwide, has brought about escalating sea levels, polar ice melt, intensified weather events, and natural calamities, profoundly impacting human existence and progress [1,2,3]. Urban areas, serving as centers of population, industry, transportation, and infrastructure, account for an estimated 75% of global energy consumption and contribute to 70% of global CO2 emissions [4]. Recognized as pivotal in carbon and climate management, many cities worldwide are proactively embarking on initiatives to curtail carbon emissions [5,6].
China, undergoing rapid urbanization and industrialization in recent decades, has become the largest global consumer of energy and emitter of CO2 [7,8], responsible for approximately 27% of global CO2 emissions as of 2022. Amidst its rapid economic expansion, the nation faces formidable challenges in addressing climate change [9]. As a response to the dual challenges of the climate challenge and sustainable economic and societal advancement [3,10,11,12], China has taken significant strides to mitigate greenhouse gas emissions [13,14]. Notably, in 2020, China unveiled an ambitious goal to peak carbon emissions by 2030 and achieve carbon neutrality by 2060.
China’s urbanization rate is on a steady rise and is projected to reach 75% by 2050. Cities within China have surpassed the industrial sector and become the largest energy consumer [15]. In pursuit of an ecological civilization, numerous endeavors have been undertaken [16,17], with the low–carbon pilot (LCP) program occupying a central position among them. Launched by the National Development and Reform Commission (NDRC) of China in three successive phases–2010, 2012, and 2017–the LCP program aims to foster sustainable economic and societal progress across diverse regions. It encompasses promoting low–carbon consumption patterns, industry restructuring, production efficiency enhancement, and establishing environmentally conscious societies. The overarching objective is not merely confined to achieving economic advancement; rather, it endeavors to address the conundrum of climate change and reduce the carbon intensity intertwined with China’s processes of industrialization and urbanization. The insights and “best practices derived from the pilot projects” are subsequently intended to transmit to non–LCP cities within China [18].
Concurrently, renowned for its status as the world’s most populous nation for an extensive period, China is facing a significant demographic shift. In 2023, China’s National Bureau of Statistics revealed the first decline in population since the 1960s [19]. Consequently, China is experiencing “negative population growth”, which poses challenges for economic progress and social development due to a shrinking working–age population and an aging demographic. This situation presents substantial and enduring tests for both the nation and its leadership. In response, the central government of China has intensified efforts to encourage larger families, while local governments have crafted diverse policies to attract populations from other cities. However, these efforts have had limited impacts, necessitating additional strategies.
As the concept of low–carbon cities garners increased attention from global policymakers, a growing number of researchers are delving into a spectrum of facets within this domain [20,21,22,23,24,25,26,27]. These include theoretical frameworks, methodologies, economic repercussions, environmental implications, and case studies associated with the development of low–carbon cities. Meanwhile, many studies have concentrated on strategies for augmenting populations [28,29,30], such as elevating income levels, enhancing public transportation systems, mitigating air pollution, and similar initiatives. Nevertheless, few studies dedicate to the demographic aspect of low–carbon cities [13,22,31]. This aspect, while not the primary initial objective of the LCP program, constitutes a significant consequential outcome of the program’s implementation. Therefore, it is worthy of exploration and analysis to comprehensively understand the relationship between low–carbon development strategies and resultant demographic trends.
Hence, to bridge this knowledge gap, we employ the LCP program as a quasi–natural experiment to analyze its impact on population dynamics. Through this rigorous analysis, we aim to offer valuable insights and recommendations that can inform policy decisions both within China and across other nations facing similar challenges. Furthermore, our research extends to investigating the mediating effects of investment (FDI), household income levels, and exhaust emissions, with the aim of shedding light on the mechanisms through which the LCP program potentially impacts population growth. Additionally, our study explores how these effects vary based on region locality and GDP per capita, unraveling potential nuances in the program’s outcomes across different contexts.
This study is structured as follows. Section 2 provides an overview of the LCP program, population issues, and the study’s potential contribution. Section 3 presents the hypotheses, research design, methodology, variables and data. Section 4 includes baseline tests, robustness checks, mediating effect analysis, and heterogeneity analysis. Section 5 concludes with findings, implications, and policy recommendations.

2. Background and Literature

2.1. Significance and Progress of China’s Low–Carbon Pilot Program

Amidst escalating environmental concerns and the steadfast ascent of economic growth as the “new normal” in China, the construction of low–carbon cities has emerged as a promising solution to simultaneously address sustainable progress and harmonize economic and environmental imperatives. This resonant concept aligns economic expansion with environmental preservation, illustrating a pathway to sustainable growth.
In line with this ethos, China’s National Development and Reform Commission (NDRC) took decisive action by establishing the initial batch of LCP regions in 2010, comprising five provinces and 8 cities, followed by the second batch in 2012 including one province and 28 cities. In 2017, another 45 cities were selected in the third batch. The selection process considered factors of geographic, socioeconomic, and representational diversity. The chosen cities demonstrated pre–existing groundwork and enthusiasm for low–carbon development, emphasizing their suitability as pilot locales. Once selected, each local government established its own carbon and energy intensity targets, using national benchmarks as reference points. Subsequently, the NDRC mandated the creation of customized low–carbon development plans, measurable objectives, and pivotal milestones for each LCP city. This comprehensive policy framework encompasses various domains, including city master planning, transportation strategies, building energy efficiency, economic incentives, greenhouse gas emissions oversight, environmental preservation, and more [20]. Specific strategies involve adjusting industrial structures, optimizing energy usage, enhancing energy efficiency, promoting low–carbon lifestyles, and establishing robust CO2 emission data management systems [21]. Note that neither the strategies nor the metrics explicitely relate to population growth.
Diverging from conventional single mandatory and market–based environmental regulations, the LCP program stands as a distinctive, comprehensive environmental regulatory mechanism. This program employs a multifaceted approach that combines binding regulations with various incentive–driven provisions. The principles and strategies of the program have garnered global attention, inspiring discussions and initiatives in many countries to pursue low–carbon urban development [4,17,32]. Serving as a demonstration of state intervention and oversight, the program illustrates how governmental authority can effectively guide national low–carbon development through voluntary policy mechanisms. Over the past decade, the program has become one of China’s primary drivers of green development [33]. Its implementation has led to significant improvements in energy efficiency [22], the adoption of energy–conserving practices in production processes, the transition to low–carbon lifestyles [23], and improvements in total factor productivity [24]. These outcomes synergistically contribute to reducing the overall carbon intensity and carbon emissions within cities [25,26]. For example, in the industrial sector, cities like Baoding, Hangzhou, Chongqing, and Nanchang are directing their efforts toward cultivating high–tech industries and augmenting the contribution of high–tech sectors to their overall value–added shares. Simultaneously, cities like Chongqing and Shenzhen have set explicit goals for developing low–carbon industries, particularly focusing on wind and solar photovoltaic manufacturing, as well as electric and alternative fuel vehicle production. In the transportation section, cities such as Hangzhou and Shenzhen have demonstrated a strong commitment to promoting public transport systems.

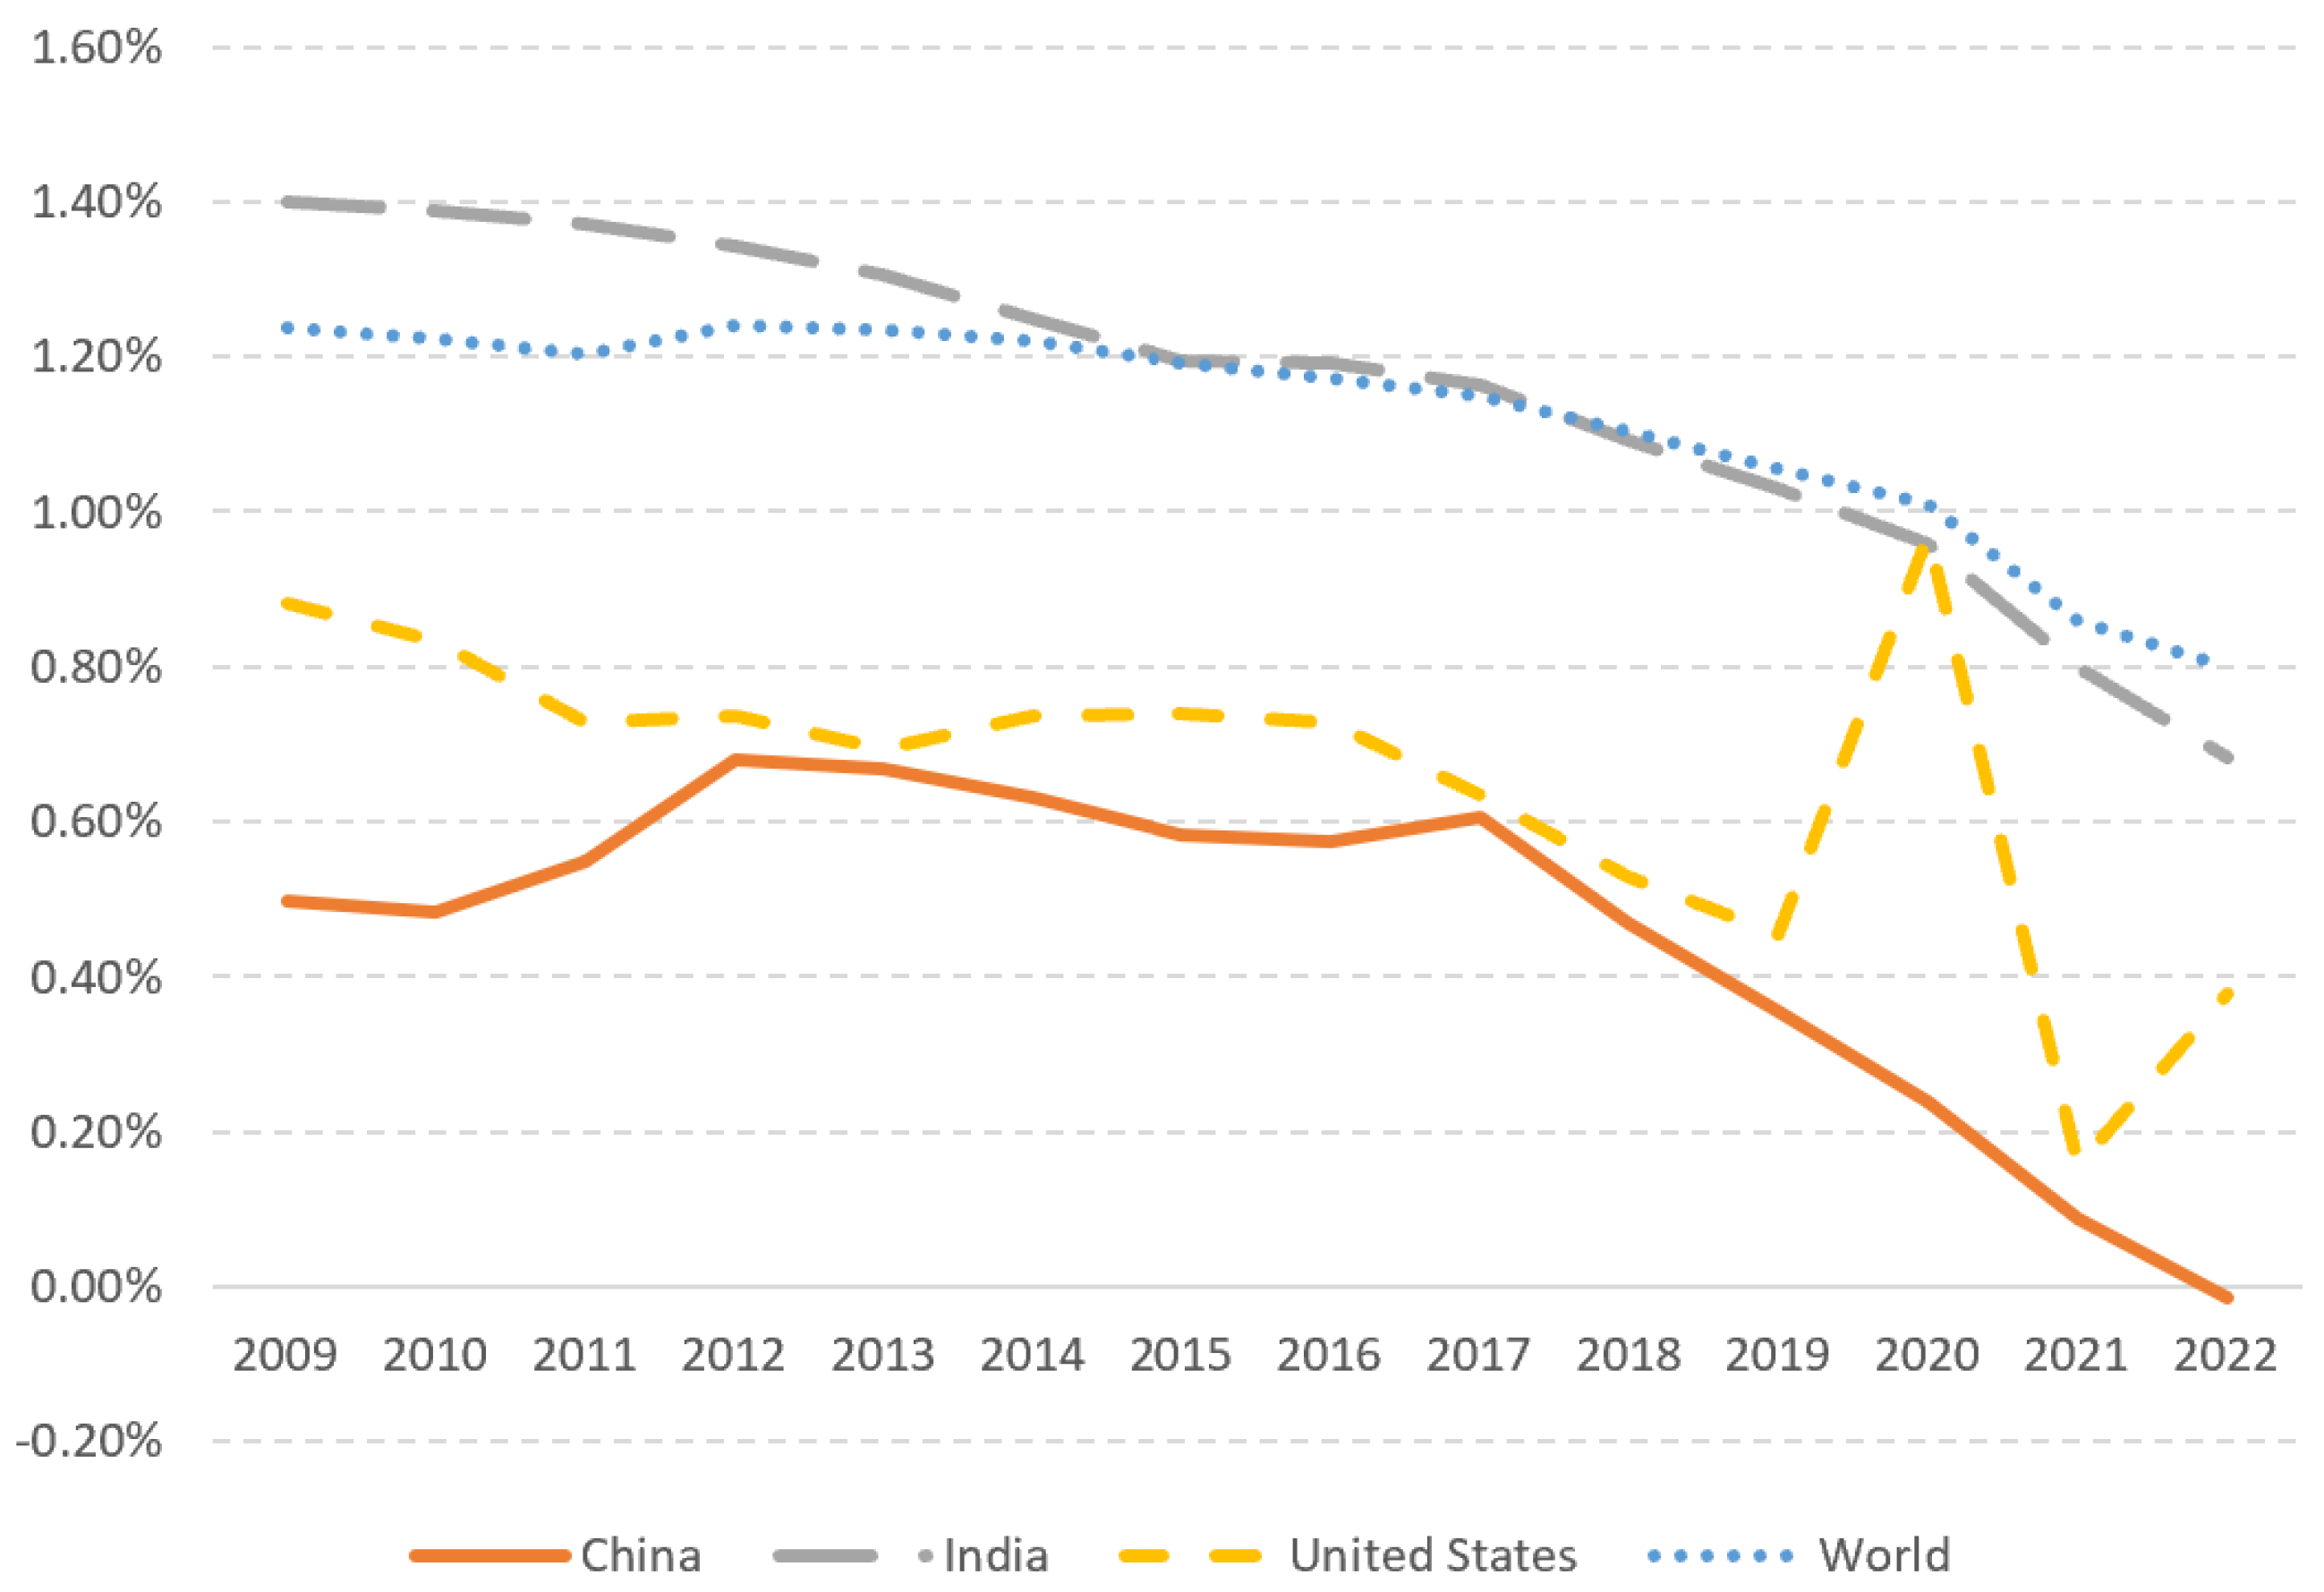
2.2. Situation and Strike of the Population Issue in China

Based on data released by the National Bureau of Statistics of China [34], mainland China’s population was 1.411 billion by the close of 2022, reflecting a decrease of 850,000 from 2021. This decline places China among a growing number of nations experiencing population shrinkage, occurring earlier than initially anticipated. As recently as 2019, the China Academy of Social Sciences projected a population peak of 1.44 billion in 2029, while the 2019 United Nations Population Prospects report suggested a peak around 2031–32, at 1.46 billion.
As depicted in Figure 1, China’s population growth has been gradually slowing in recent years, with the transition to negative growth in 2022 raising global concerns and discussions. This is of particular significance due to China’s substantial economic influence and its status as a major global manufacturer. Meanwhile, India is projected to surpass China in 2023 to become the most populous country. The United Nations predicts a decline in China’s population from 1.426 billion in 2023 to 1.313 billion by 2050, and potentially below 800 million by 2100 [35]. In comparison, the U.S. population of 337 million in 2021 is projected to grow to 394 million by 2100.
This demographic shrinkage could introduce complexities to China’s aspirations for sustained economic expansion and exacerbate challenges related to an aging workforce. Chinese state media reports that China is already approaching a “moderately aging” scenario, with 20% of the population aged 60 and above. This percentage is projected to rise to 30% by 2035, representing a classic case of “aging before affluence”. The shrinking workforce places considerable strain on the younger generation. Experts warn that China might follow a trajectory similar to Japan, which experienced three decades of economic stagnation starting in the early 1990s coinciding with its aging demographic.
This trend could potentially reverberate across the global landscape, with China’s position as the second–largest economy significantly impacting worldwide growth. While a smaller population can have positive implications, particularly regarding climate change and the environment, a rapid population decline can entail more challenges than benefits, especially within the context of China. The existing severe debt crisis among local governments is exacerbated by dwindling revenue from land sales due to a sluggish real estate market. Concurrently, China’s imperfect social security system is grappling with funding shortages. Both these pressing social issues converge on a pivotal factor: population. In response, Chinese officials have undertaken a proactive national strategy to encourage larger families. This involved the repeal of the long–standing one–child policy in 2015, allowing couples to have two children, and was further expanded to permit three children in 2021. Research indicates that the high cost of living, hectic work schedule, and stiff competition on education pose a major obstacle to raising children in China. In light of this, policies have been formulated to enhance maternity leave, offer tax deductions and allowances for families, develop elderly care programs, and reduce the burdens associated with childcare, education, healthcare, and housing.
In recent years, numerous Chinese cities have introduced tailored talent policies in alignment with regional development needs. Between 2016 and 2019, over 4000 policy documents related to talent were issued, with 214 cities implementing new rounds of talent policies during the same period, sparking a “war for talent” among cities [36]. To gain an edge in this competition for population, cities have eased household registration requirements, offered housing subsidies, financial support for businesses, entrepreneurship incentives, and preferential loans. For instance, cities like Jinan, Hangzhou, and Shenzhen are providing subsidies to families with two or three children. However, no strong evidence has demonstrated that these efforts have brought significant outcomes and their effects may require a long time to reach their goal.

2.3. Relevant Research and Contribution of This Study

Numerous studies have been dedicated to various facets of low–carbon city development. Up to June 2022, there were over a thousand papers related to the broader concept of the LCP program [27]. The research landscape covers a wide array of topics, including city planning [13,37], policy formulation and execution [38], energy efficiency [39], carbon intensity [31,40], economic and industrial advancement [41,42,43], carbon emissions [44,45,46], ecological performance [47,48,49], and the potential risks of program failure [50,51].
The literature related to this study demonstrates a degree of consensus on certain aspects. For instance, studies substantiate the positive impact of the LCP program [52], noting its substantial role in significantly reducing air pollution [53], fostering innovation at industrial and urban levels [54], and enhancing the overall health of residents [55]. Additionally, since population growth is typically associated with an increase in CO2 emissions [56,57], the concern arises that if the LCP program boosts population, it might inadvertently intensify carbon emissions within pilot cities and potentially hinder sustainable development. However, a study [58] has uncovered a contrary trend, revealing a reduction of living carbon emissions by approximately 15.3%. Further analysis showcases the program’s ability to encourage a greener transformation of lifestyles, such as a preference for public transportation, reduced electricity consumption, and the uptake of environmentally friendly products. Notably, direct energy consumption by residents primarily stems from household electricity usage and transportation [59].
Nevertheless, some viewpoints within the literature are mixed with empirical evidence. For example, conventional wisdom posits that environmental regulations could instigate intra–industry [60] and inter–industry [61] structural adjustments, leading to potential increases in production costs [62,63]. The Pollution Haven hypothesis [64] asserts that countries with stringent environmental regulations might deter FDI from polluting industries [65,66]. In contrast, research [67,68,69] reveals that environmental regulations could stimulate innovations within enterprises, thereby positively influencing productivity improvements [70,71], and ultimately attracting FDI. These complexities will be further explored in Section 3.1.
While extensive research centers on the LCP program, according to the best of our knowledge, the program’s impact on population growth remains underexplored. This subject holds particular significance as it bridges two of the most pressing challenges faced by China and numerous other countries: the imperative for low–carbon transformation and the dynamics of population growth. Consequently, our study seeks to provide empirical evidence on the relationship between low–carbon initiatives and population growth, assess the underlying mechanisms of this growth, and explore heterogeneity in outcomes. Our study goes beyond the economic and environmental aspects commonly explored in the context of low–carbon cities, shedding light on an important yet underexamined dimension.
The marginal contributions of this study to the current literature lie in (1) providing additional evidence and in–depth analysis of the LCP program’s influence on population growth; (2) offering insights into the mechanisms of how the program promotes population growth to support future low–carbon development plans; (3) investigating the variation in impact according to geographic locality and economic development, thus facilitating policymaking recommendations; and (4) leveraging an extended dataset to examine distinctions in impact across the three batches, a dimension less explored in previous research that typically focused on the initial two batches.

3. Methods

3.1. Research Hypotheses

The “push–pull” theory [72], a classical framework elucidating the interplay between urbanization and population dynamics, posits that urban population migration is driven by two opposing forces–pull and push–as well as intermediary obstructive factors [73]. The “pull” factor embodies positive aspects that attract population, such as robust economic conditions, favorable employment opportunities, and a high quality of living. Conversely, the “push” factor encompasses negative elements that repel population, including resource depletion, low income, and unfavorable living conditions.
In the context of the existing literature, on the “pull” side, the LCP program, functioning as a form of environmental regulations, enhances corporate productivity [74] and employment prospects [75], improves the ecological environment [40,41,76], and bolsters residents’ mental and physical well–being [77,78,79] and productivity [80,81,82,83]. This, in turn, fosters an influx of population. Conversely, on the “push” side, the LCP program has also hampered the growth prospects of certain enterprises, particularly those in polluting sectors [84,85]. This has prompted their relocation to other cities [86,87] to circumvent the costs and losses incurred by complying with stringent environmental regulations. Moreover, strict environmental regulations deter low–quality FDI inflows [21,66], thereby diminishing overall business allure. Both relocation and reduced attractiveness contribute to decreased labor demand and subsequent population outflow. The net impact on population growth of the LCP program hinges upon the relative strengths of the “pull” and “push” influences.
In practical terms, population growth can be achieved through three primary avenues: fostering a higher fertility rate, encouraging immigration, and lowering mortality rates. Factors like high income and robust social security systems contribute to increased fertility rates. Ample job opportunities and a high standard of living attract individuals from other regions [88]. Environmental improvements bolster residents’ health, consequently reducing mortality rates. For instance, mortality rates in pilot cities can be reduced by an average of five–ten thousandths due to air quality enhancements [89]. This constellation of factors constitutes a potent force propelling population growth.
Before delving into statistical analyses, it is valuable to gain empirical insights into the LCP program’s impact. From Figure 2, it is evident that the population growth of LCP cities surpasses that of non–LCP cities, particularly after 2016.
Consequently, we put forth the following primary hypothesis:
Hypothesis 1.
The LCP program promotes population growth.
Furthermore, if this hypothesis holds true, it becomes imperative and intriguing to explore the contributing factors and mechanisms that drive this outcome.
Firstly, research suggests that LCP cities tend to attract more FDI [21]. Increased FDI not only empowers local governments to invest in sustainable economic development, improved environments, and enhanced living standards (e.g., better healthcare facilities, city infrastructure, and social welfare), but it also amplifies the financial capacity of local businesses. This dynamic creates more job opportunities and higher income for residents, collectively fostering an environment conducive to attracting more people.
Secondly, as previously discussed, the LCP program’s positive impact on FDI can also elevate household income. Moreover, the program can boost income through other channels. Studies suggest that the program enhances local enterprises’ productivity via technological innovation and structural adjustments, resulting in improved profitability and consequently higher incomes, which in turn attract a larger population [90].
Lastly, the LCP program can elevate the cost of corporate pollution emissions and accentuate the benefits of energy conservation and emission reduction through environmental protection measures such as taxes, subsidies, and emission trading. This can lead to a reduction in exhaust emissions, improved living conditions, and enhanced resident health [91]. These improvements, in turn, increase the attractiveness of the city’s population [92] and contribute to a longer life expectancy [93].
Given the practices of LCP cities and the current body of research, we select urban investment level, per capita income, and exhaust emissions reduction as mediating factors. This prompts an in–depth exploration of the mechanisms through which the program impacts population growth. Consequently, we propose the following three hypotheses as well:
Hypothesis 2.
The LCP program promotes population growth by increasing the investment level.
Hypothesis 3.
The LCP program promotes population growth by elevating residents’ income.
Hypothesis 4.
The LCP program promotes population growth by reducing exhaust emission.

3.2. Research Model

The research model employed in this study is based on the Difference-n-Difference (DID) method, which is widely used for policy evaluation. The DID model serves as the foundation for investigating the impact of the LCP program on population dynamics in this study. The core idea of the DID model is to compare changes in an indicator between two groups: the experimental group (LCP cities) and the control group (non–LCP cities). By computing the difference in the indicator before and after policy implementation for both groups, the model can estimate the policy’s effect on the indicator. An advantage of the DID model is its ability to mitigate selection bias and the influence of external factors to a certain extent.
Given the phased implementation of the LCP program, this study utilizes a multi–period DID model. In this model, the first difference is at the city level, and the second difference is at the year level. The model is defined as follows:
L N P O P i t = α + β d i d i t + δ X i t + υ t + γ i + ε i t
where the subscripts i and t represent cities and years, respectively. The variable d i d i t is a dummy variable indicating whether the city is part of the LCP program, taking the value 1 for LCP cities and 0 for non–LCP cities. Control variables X i t are included to account for the influence of time–varying city–level factors. Given the longitudinal nature of the dataset, the model incorporates both city–fixed effects and time-fixed effects. Within the model, υ t represents the city–fixed effect, controlling for city–level attributes that remain invariant over time, such as geographic location like being a provincial capital; γ i refers to the time–fixed effect, controlling the temporal characteristics that remain constant despite regional shifts, such as macroeconomic shifts and nationwide financial crises in 2008. ε i t denotes the stochastic disturbance term, assumed to be independently and identically distributed (i.i.d.). The standard errors are clustered at the city level to account for potential heteroskedasticity and serial correlations.
Additionally, the study constructs a mediating effect model to investigate whether the increases in foreign investment, income per capita, and the reduction in exhaust emissions prompted by the LCP program directly lead to population growth. In this model, the natural logarithm of population L N P O P serves as the dependent variable, while the three aforementioned variables ( M i t ) act as mediators:
{ L N P O P i t = α + β d i d i t + δ X i t + υ t + γ i + ε i t M i t = α + β d i d i t + δ X i t + υ t + γ i + ε i t L N P O P i t = α + β d i d i t + ψ M i t + υ t + γ i + ε i t

3.3. Variables Selection

3.3.1. Dependent Variables

  • Natural Logarithm of Population (LNPOP): This is the dependent variable in the study representing the population size in each city.

3.3.2. Independent Variables

  • low–carbon Pilot Status (did): This binary variable indicates whether a city is part of the LCP program or not. Its value is set as follows:
    For LCP cities, d i d is set to 1 in the initial year they are chosen as LCP cities and remains 1 for all subsequent years, while it is set to 0 for all other years.
    For non–LCP cities, d i d remains at 0 across all years.

3.3.3. Control Variables

  • Economic Development (PGDP): The natural logarithm of GDP per capita serves as an indicator of economic development for the cities under consideration. This variable encapsulates the economic prosperity of the cities and its influence on the population dynamics.
  • Industrial Structure (Industry): The relative prominence of secondary industry–compared to the agricultural and service sectors–significantly impacts energy consumption and carbon emissions [94]. To quantify this impact, this study employs the natural logarithm of the proportion of industrial production value in GDP as a measure of industrial structure.
  • Finance Development (Finance): The level of financial industry development is an influential factor in urban growth and development. The ratio of year–end bank deposit balance to GDP in the city is utilized as a measure of financial industry development.
  • Natural Population Growth (Npop): The natural logarithm of the annual population growth rate captures inherent population dynamics.

3.3.4. Intermediary Variables

  • Foreign Investment (FI): The actual amount of foreign investment within a city serves as an indicator of its capacity to attract external investment. This variable reflects the city’s appeal to foreign investors and its potential economic opportunities.
  • Income per Capita (PI): The average salary of employees within a city is utilized as a proxy for residents’ living standards. This variable gauges the financial well–being of the city’s population.
  • Exhaust Emission Reduction (EER): An average reduction across various emissions, including industrial SO2 emissions, industrial N O x emissions, and industrial smoke and dust emissions, serves as an approximation of the overall exhaust emission reduction attributed to the LCP program.
To minimize potential heteroscedasticity in the analysis, the study employs the natural logarithm transformation for all non–ratio variables. The intermediary variables help shed light on the mechanisms through which the LCP program may influence population growth, further enriching the insights of the study.

3.4. Data Collection and Descriptive Statistics

Given data availability and the scope of the study, this research delves into the population impact at the city level, harnessing a panel dataset encompassing the timeframe from 2009 to 2020. The dataset comprises 297 cities, bifurcated into two distinct groups: a treatment group featuring 126 cities designated as LCP cities and a control group of 171 non–LCP cities. Among the LCP cities, there are 73 cities in the first batch, 25 cities in the second batch, and 28 cities in the third batch. Notably, four cities (Yan’an, Wuhan, Guangzhou, Kunming) from the second batch are omitted due to their belonging to provinces within the first batch. The rationale behind commencing the data collection from 2009 stems from significant alterations in district boundaries of several prefecture–level cities before that year, coupled with substantial data gaps prior to 2009. Similarly, the decision to conclude the data collection in 2020 is due to the unavailability of more recent data from the “China City Statistical Yearbook” when the study concludes. Other data points are sourced from publications like the China Population and Employment Statistical Yearbook and the Statistical Communique on National Economic and Social Development, as well as various statistical yearbooks of individual cities. Instances of missing data are managed through interpolation techniques.
To provide a preliminary overview of the dataset, Table 1 offers descriptive statistics for the main variables under examination.

4. Results

4.1. Baseline Test

The regression outcomes derived from Equation (1) are presented in Table 2. Notably, the impact of the LCP program on population emerges as statistically significant, regardless of whether control variables are included or not. These findings substantiate the validity of Hypothesis 1. They underscore that, even when accounting for the influence of natural population growth, the LCP program plays a constructive role in driving population growth within the cities. This observation aligns seamlessly with both the study’s conjecture and the pertinent literature.
To elaborate further, the natural logarithms of population figures for LCP cities stand at 19.11% higher than those recorded for non–LCP cities. This translates to an average annual population surge of approximately 21.06% (calculated as e 0.1911 1 ), all else being equal. Such a substantial augmentation holds particular significance, especially when considered within the context of the prevailing demographic decline trend observed in China.
The coefficients of the control variables yield intriguing insights into the study’s findings. Specifically, they are as follows:
  • PGDP (Economic Development): A positive relationship between PGDP and population growth is observed. The potential reason is that, backed by adequate financial resources, higher PGDP levels may enhance a local government’s capacity to bolster the city’s infrastructure.
  • Npop  (Natural Population Growth): A positive effect of Npop on population growth is also evident, aligning with expectations. This outcome is intuitive, as a city with an inherent population growth trend is more likely to continue attracting and accommodating new residents.
  • Industry  (Industrial Structure) and  Finance  (Finance Development): These two variables do not demonstrate statistical significance in relation to population growth. This implies that the structure of industries within a city and the extent of financial sector development may not exert a significant impact on population growth.
Similar to some research [31], the study also conducts tests to explore potential differences in the impact of the LCP program across the three batches. The results indicate that the coefficients for the three batches are 0.027 ** (significant for the first batch), 0.0905 *** (significant with a larger coefficient for the second batch), and 0.0213 (not statistically significant for the third batch). This pattern suggests that the second batch might have experienced a more pronounced impact, potentially due to a learning curve from the first batch’s experience and better resource allocation. The lack of significance in the third batch could be attributed to the relatively shorter period since its inception. Alternatively, the widespread adoption of low–carbon development practices across many Chinese cities, including non–LCP ones, might have diluted the program’s impact. The underlying reasons warrant deeper exploration in the future, particularly after a few more years of observation.

4.2. Robustness Checks

In applying the DID methodology, several assumptions must be met to ensure the validity of the results. Additionally, there might be other factors that could potentially impact population growth. To ensure the robustness of the baseline model and verify the stability of the findings, a series of robustness tests are conducted. These tests help to assess the sensitivity of the results to different specifications and potential confounding variables.
The purpose of these robustness tests is to strengthen the credibility of the study’s conclusions and provide a more comprehensive understanding of the factors influencing population growth in the context of the LCP program. By exploring various model specifications, the study aims to demonstrate the consistency and reliability of the results obtained through the initial analysis.

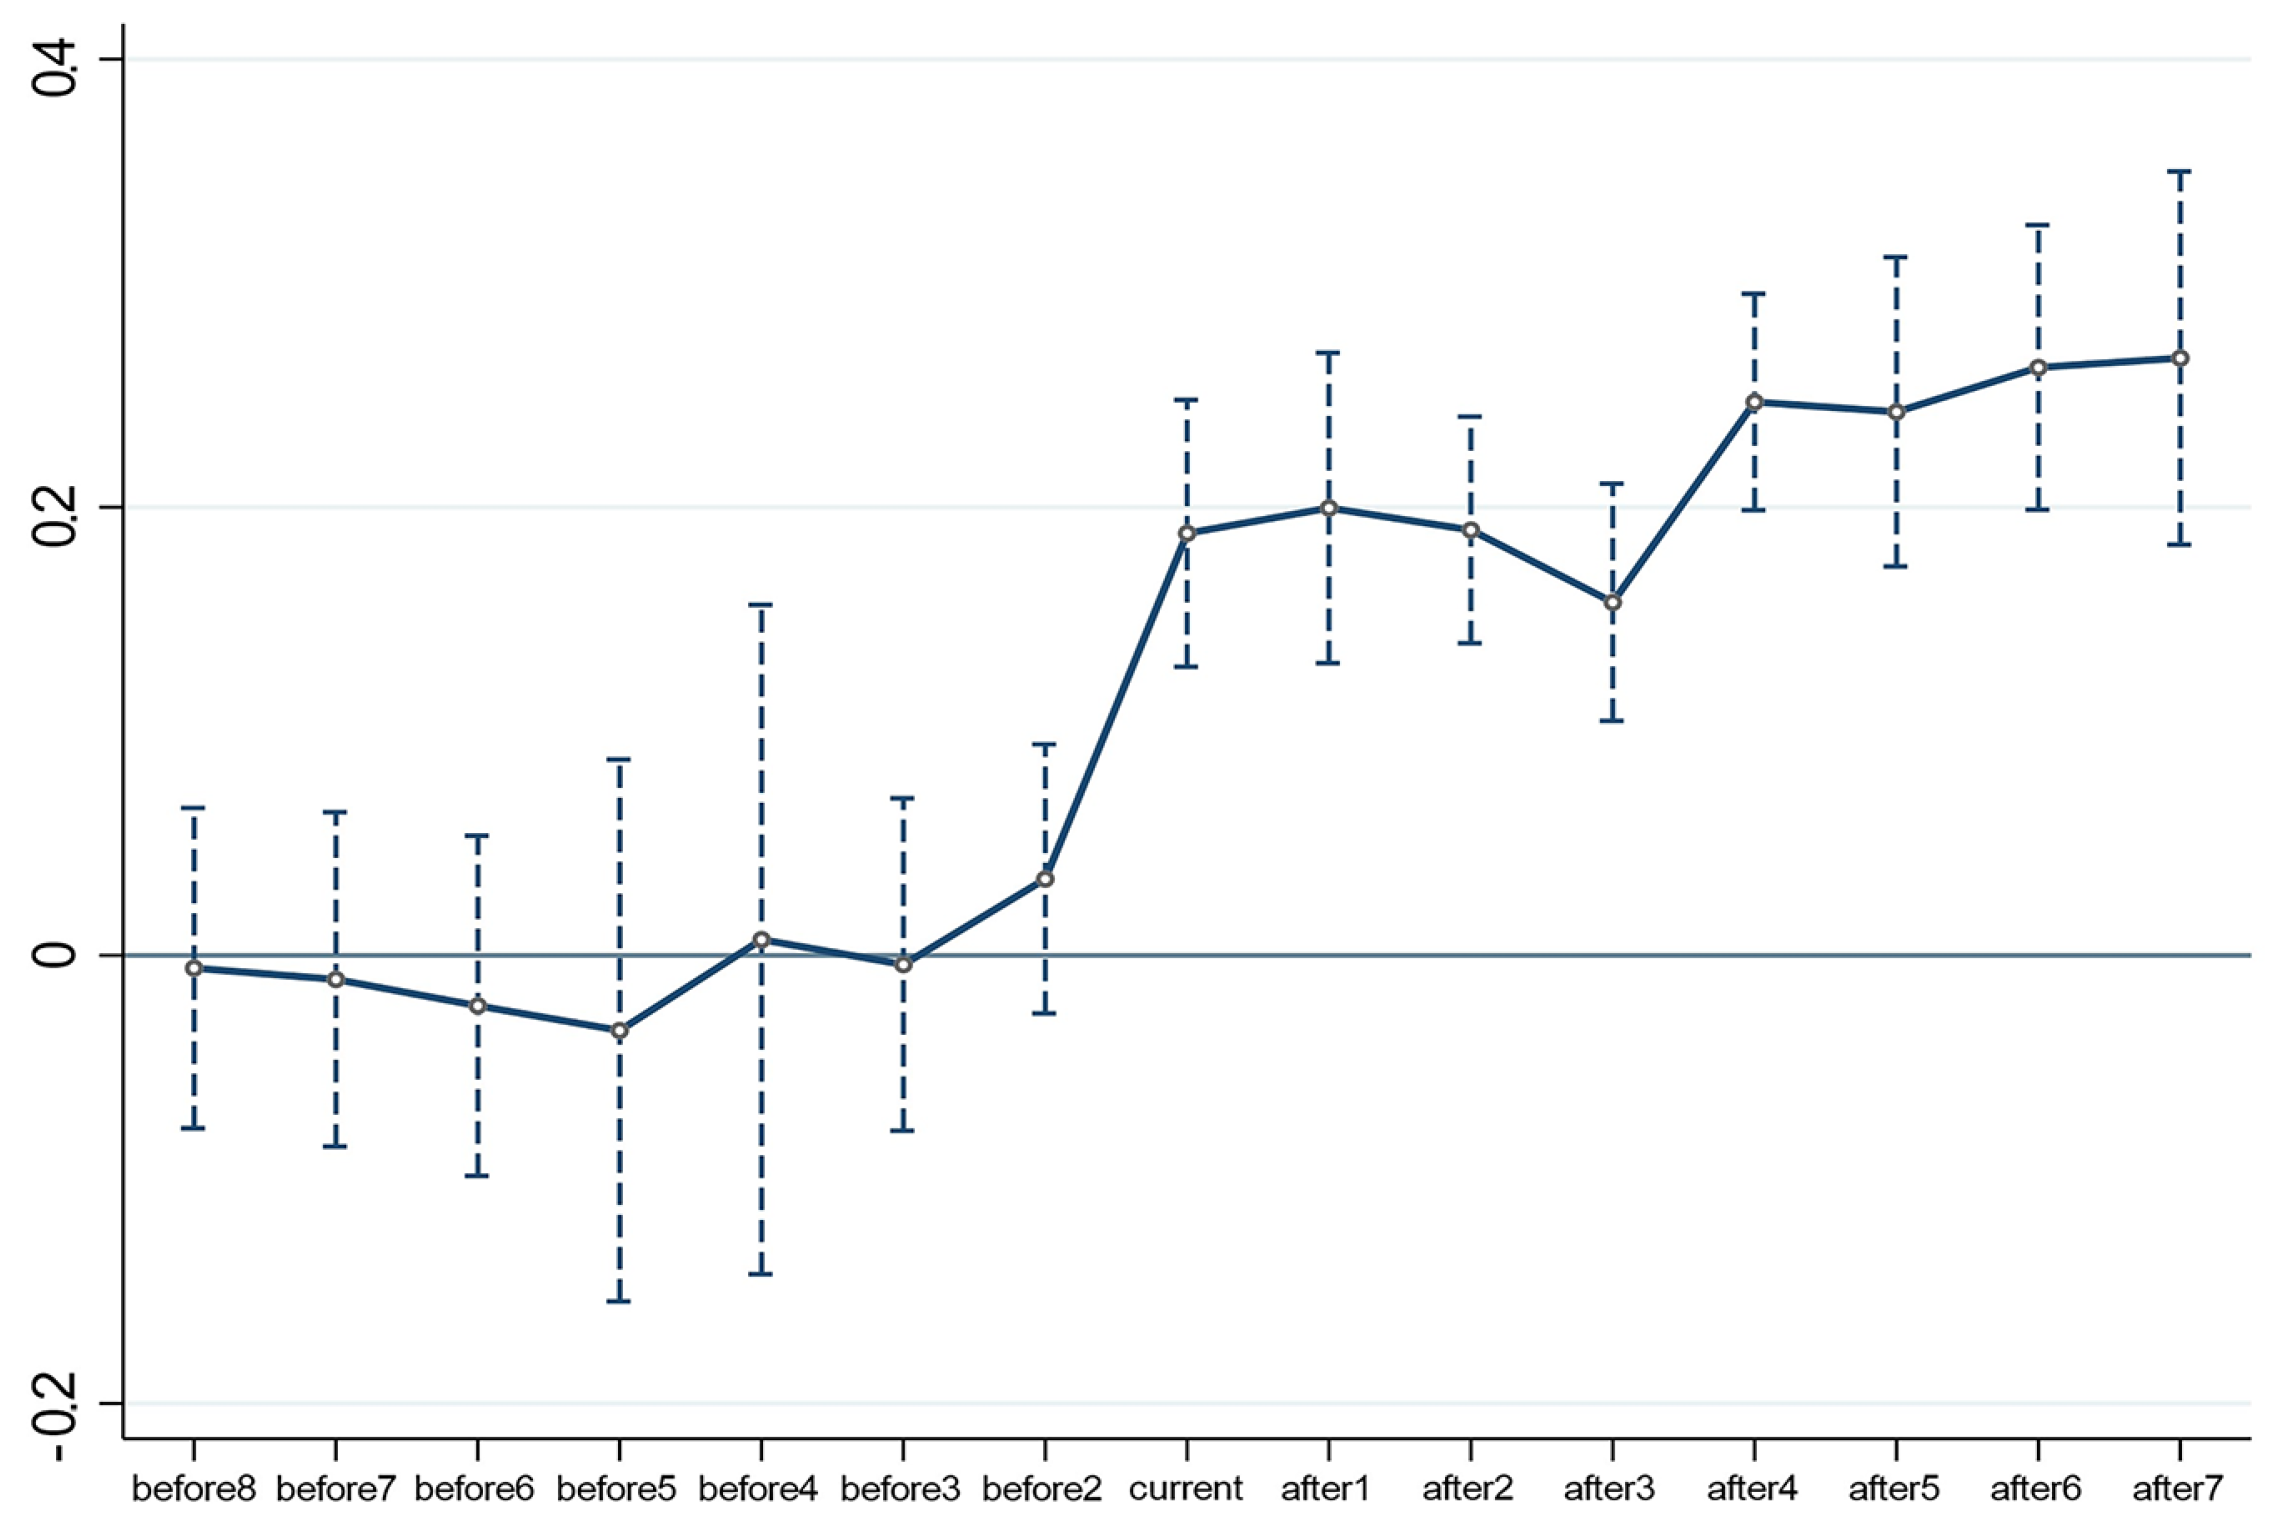
4.2.1. Parallel Trend Test

A critical assumption underlying the DID model is that the treatment and control groups exhibit similar trends prior to the introduction of the LCP program [95]. However, governments may strategically select regions for policy implementation, which could lead to substantial differences between these groups even before the program is implemented. This phenomenon is known as pre–screening bias. For instance, if the government tends to choose regions that are already more well–developed, it could result in a higher population growth rate for the treated group compared to the control group even before the program’s initiation. As a result, any better performance observed in the treated group after the program’s introduction may be attributed, to some extent, to this pre–screening effect. This bias, if not addressed, could lead to an overestimation of the true impact of the LCP program.
To mitigate this concern, it is crucial to perform a parallel trends test [96]. This test helps evaluate whether the treatment and control groups were indeed experiencing similar trends prior to the LCP program’s implementation. The goal is to ascertain whether any observed differences between the groups after the program’s introduction can be attributed to the program itself, rather than pre–existing disparities.
The parallel trends test seeks to determine if the groups’ trajectories were parallel in the absence of the program’s effect. This involves examining whether the treatment and control groups were following similar paths over time before the intervention. By conducting this test, researchers can better ensure the validity of the DID model’s underlying assumption. The testing model is as follows:
L N P O P i t = α + β i d i d i t i + δ X i t + υ t + γ i + ε i t
where d i d i is a dummy variable that indicates the presence of the pilot program in a specific year, denoted as year i, which takes the value of 1 when the LCP program is implemented in that year, and 0 otherwise. By including this dummy variable in the model, we can examine whether there was a significant change in the population growth specifically in the years when the pilot program was in effect. This is a common approach in DID analysis to isolate the effect of the policy from other time–related factors.
Figure 3 depicts the outcomes of the parallel trend test. It is evident that prior to the initiation of the LCP program, there exists no substantial disparity in population dynamics between the two groups. This observation underscores the absence of a systematic divergence in population growth rates within the treatment and control groups. Consequently, the parallel trend test is successfully met, affirming the fulfillment of the essential prerequisite for the DID model.

4.2.2. Placebo Test

Despite the inclusion of essential control variables in the baseline model, the potential for the omission of significant factors exists, which could introduce bias into the test results. To counteract the influence of these unaccounted factors on population dynamics, we adopt a placebo test approach as outlined by [97] and conduct a placebo test by randomizing the treatment group and control group. In this procedure, we introduce randomization to both the treatment and control groups. Specifically, we randomly designate an equivalent number of cities as LCP cities, and the remaining as non–LCP cities for a particular year. This random assignment is repeated 500 times, yielding 500 coefficients for the variable d i d through baseline regression. The descriptive statistics of the placebo test outcomes are presented in Figure 4. Notably, the coefficients align closely with a normal distribution with mean zero. Furthermore, a significant majority of their associated p–values surpass the 0.1 threshold. This pattern of results signifies substantial deviation from the baseline model’s outcomes. Consequently, this placebo test invalidates the notion that unobserved factors underpin the baseline results, thereby bolstering the validity of the baseline model’s argumentation.

4.2.3. Lagged Control Variables Test

Acknowledging the potential influence of the selected variables on the LCP program, we strive to mitigate prospective endogeneity concerns. To achieve this, we opt to introduce a one–period lag for all control variables before conducting the regression. The results of this examination are recorded in the “Lagged Control Variables” column in Table 3. Remarkably, the estimated coefficient signs and their statistical significance consistently align with those derived from the baseline test. The coefficients undergo slight augmentation in this instance due to the incorporation of the one–period lag, thereby somewhat attenuating the control effect. Consequently, the results of the lagged control variable test serve to corroborate the robustness of the findings obtained in the baseline text.

4.2.4. Intensity DID Test
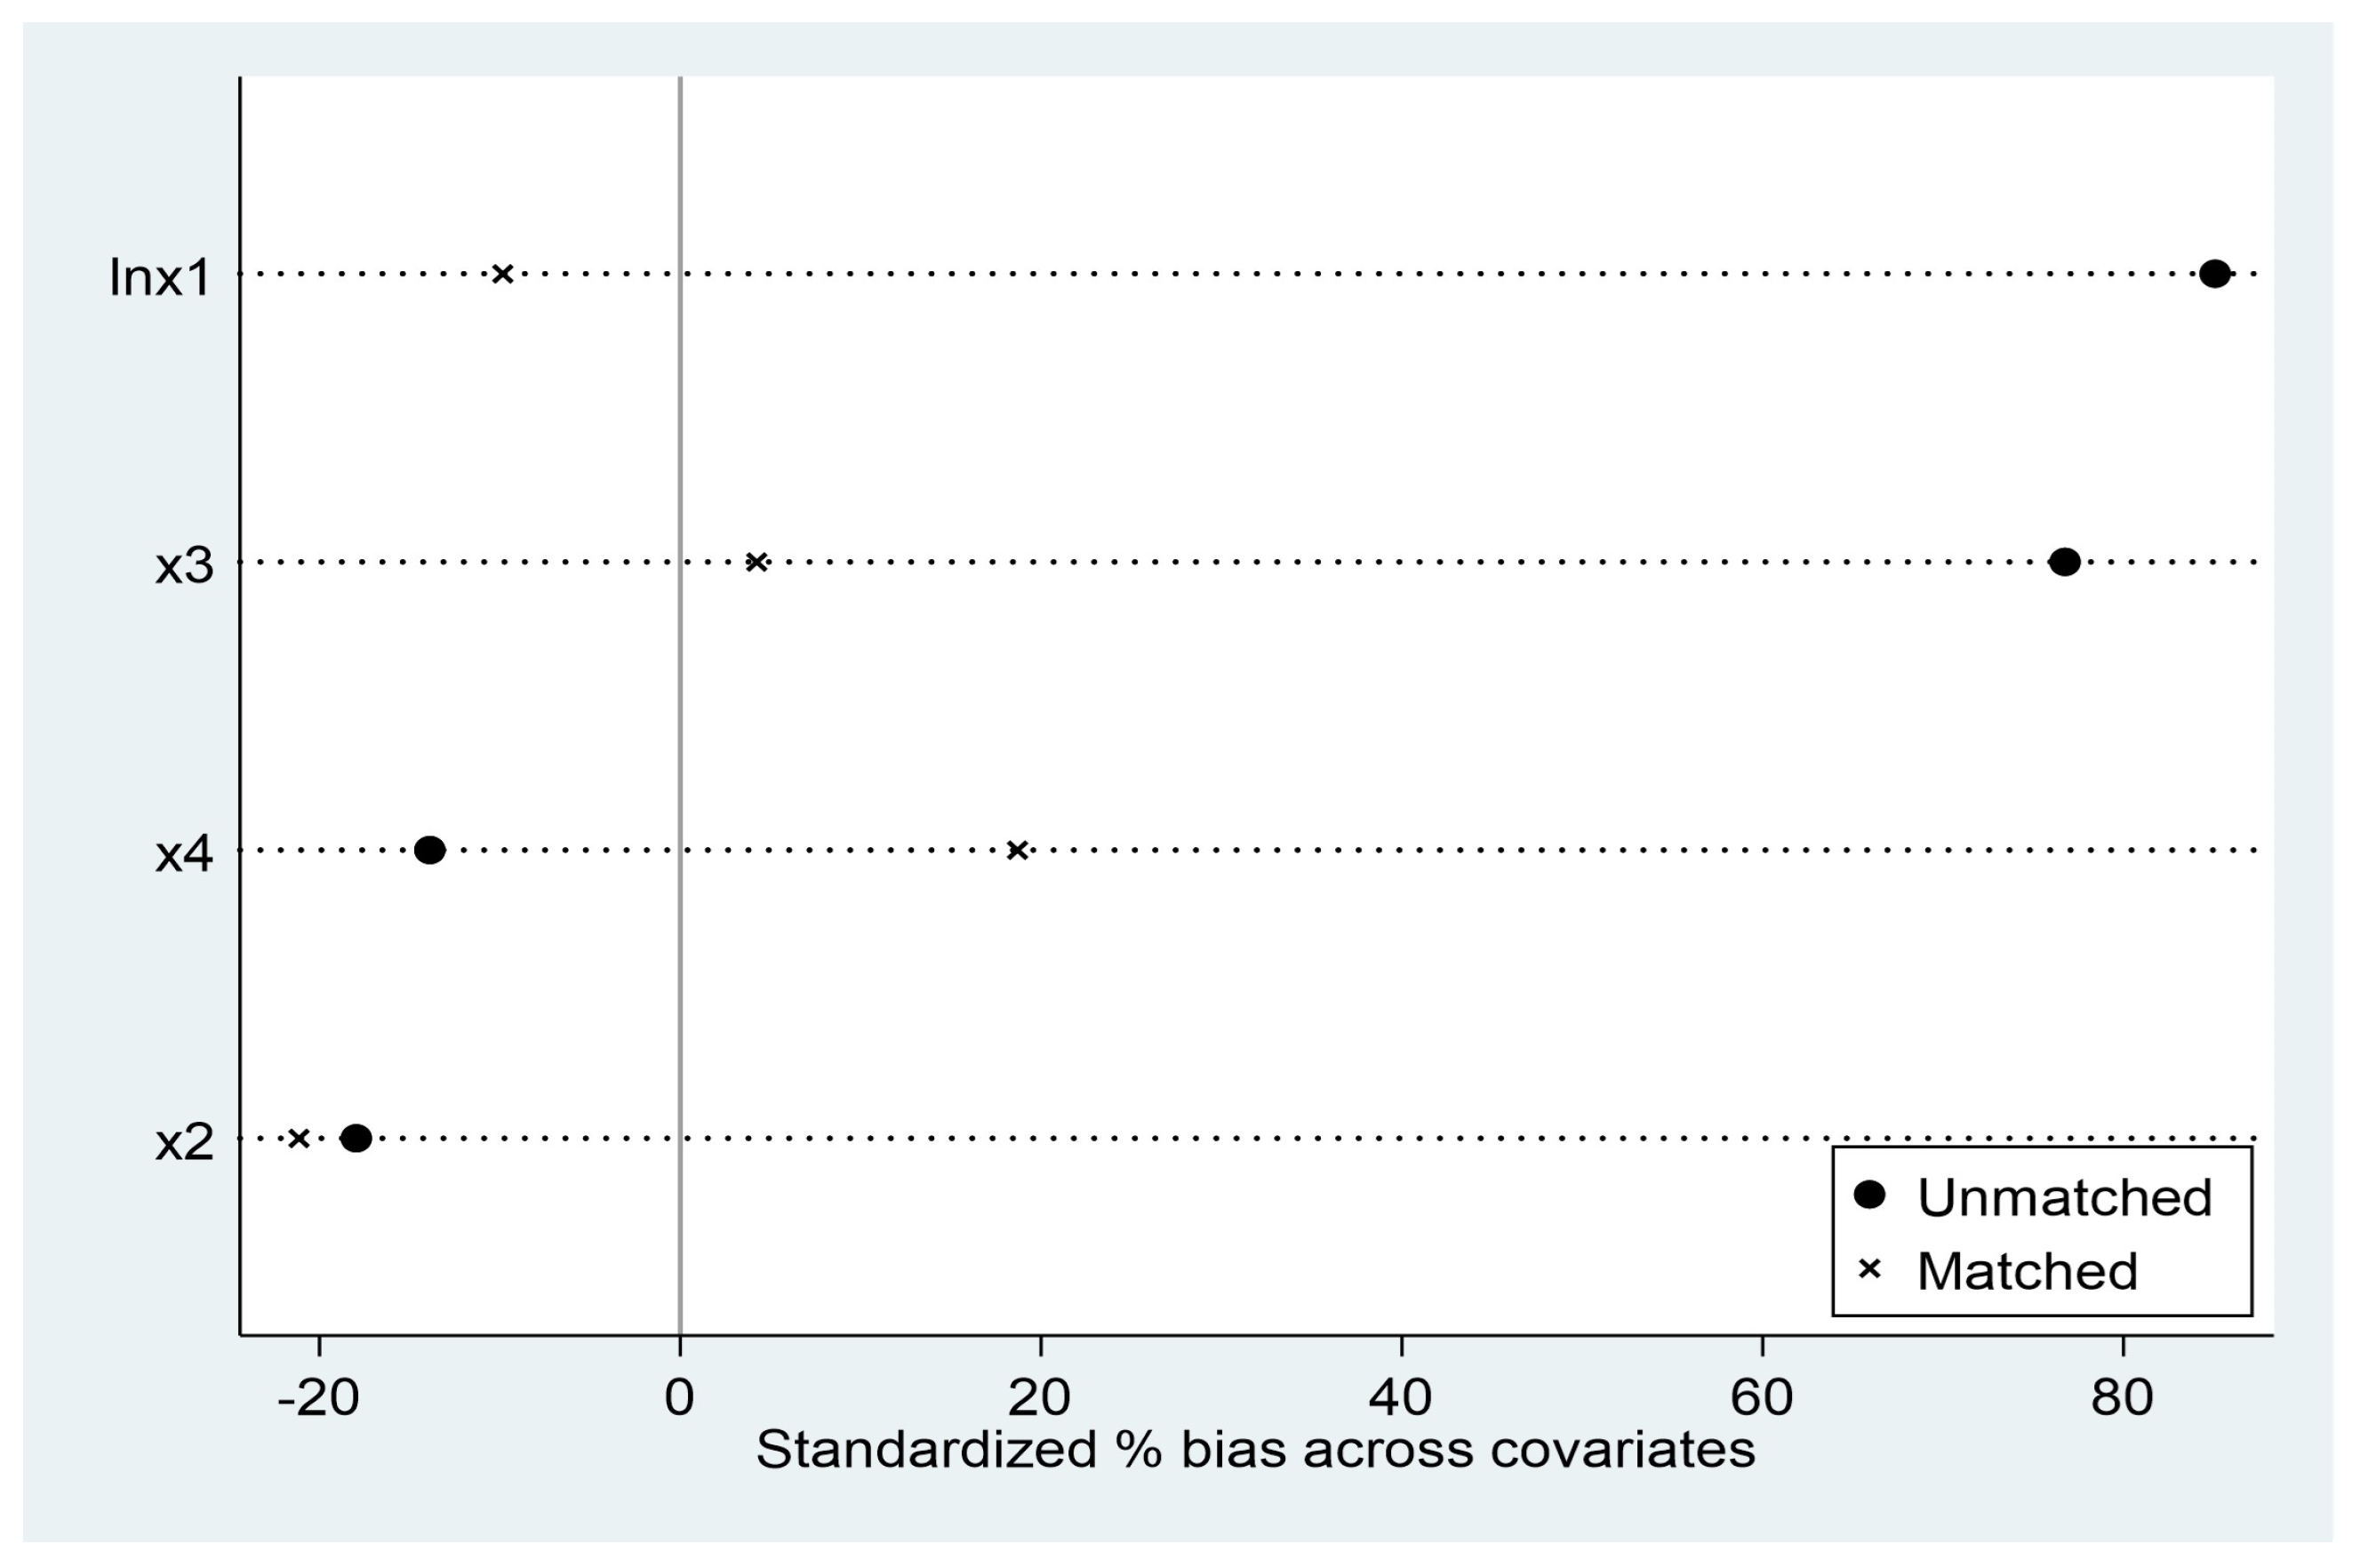
It is pertinent to realise that certain LCP cities have previously obtained approval as pilot areas within their respective provinces. This situation introduces a potential complexity in our analysis, as these cities were initially designated as pilot areas within their provinces before being subsequently approved as LCP cities. However, as the execution of the LCP program is determined and overseen by local governments, variations in the degree of implementation intensity might emerge among these LCP cities [98].
In light of this, we deploy an “intensity DID” test. Specifically, for those LCP cities whose provinces were previously authorized as pilot areas, we ascribe a d i d value of 2 to their pilot city year and the ensuing years. This approach is then employed to reevaluate the baseline test. The results of this test are presented within the “Intensity DID” column of Table 3. The estimated coefficients within this analysis demonstrate a positive orientation, thereby supporting the robustness of the baseline test.

4.2.5. PSM-DID Test

It is important to recognize that the DID method hinges on the prerequisite that there are no systematic differences between the treatment group and control group prior to the program’s implementation. However, given the vast territory and substantial variations in resources and development among Chinese cities, the process of selecting LCP cities is not entirely random. The selection process is initiated by certain cities and then candidates are chosen based on a variety of conditions such as locality, natural resources, energy consumption, economic and social development, and environmental preservation [99]. Consequently, the selection of LCP cities is not completely randomized, which might contribute to significant disparities in control variables between the treatment and control groups.
To mitigate the potential bias arising from this nonrandom assignment of LCP cities, we have employed the Propensity Score Matching (PSM) method [41] with nearest neighbor matching before applying the DID methodology. In essence, for each LCP city, we have selected a non–LCP city possessing similar characteristics, thereby ensuring a comparable predicted probability. The results of this procedure are presented in Table 4 and Table 5. Table 4 illustrates that, following the matching process, the deviations of most variables are within a 10% range, with p–values from the t–tests exceeding 0.100. Furthermore, the values in Table 5 indicate that the “Mean bias” and “Med bias” are substantially reduced after matching. The findings from these tables indicate the effectiveness of the matching process in addressing potential bias.
To assess whether the matched samples adhere to the equilibrium hypothesis in the PSM matching, a test was conducted to evaluate whether there are significant differences in the matching covariates between the treatment and control groups. The results of this test are depicted in Figure 5. Upon examination, it is evident that after the matching procedure, the covariates closely align with the standard line, and the similarity of covariate characteristics between the two groups is significantly improved. This underscores the effectiveness of the matching process. Consequently, the conditions are favorable to proceed with subsequent regression analyses.
The results of the PSM–DID test are presented in the “PSM–DID” column of Table 3. The coefficient of L N P O P is positive and statistically significant at the 1% level, thus further confirming Hypothesis 1.

4.3. Mediating Effect Analysis

To delve deeper into the factors that contribute to the finding of the baseline model, which suggests that LCP cities exhibit a significant increase in population compared to non–LCP cities, we have conducted mediating models that elucidate the pathways through which the policy exerts its influence, in accordance with established practices in the existing literature [100,101]. Building upon the rationale presented in Section 3.1 and relevant prior research, we have chosen three mediating variables: urban investment level, per capita income, and exhaust emissions reduction, representing city development, individual development, and environmental conditions, respectively.
The outcomes of the mediating analysis are displayed in Table 6. Column (1) corresponds to Model 2, wherein the coefficient of d i d is positive and statistically significant, consistent with the conclusions of the baseline model. In columns (2), (4), and (6), the regression results for foreign investment (FI), income per capita (PI), and exhaust emissions reduction (EER) are presented. It is evident that the LCP program enhances population growth by attracting more FDI and reducing exhaust emissions. However, the impact of income on population growth is not statistically significant in this analysis. This could be attributed to the fact that the LCP program may not significantly increase income or that residents value factors such as living conditions more than income level. In line with Wagner’s Law [102], as per capita income increases, individuals tend to seek expanded social protection, law enforcement, cultural education, and public welfare. The World Happiness Report 2022 highlights that since the early 21st century, the prominence of terms like GDP and income has declined significantly, while expressions related to happiness, subjective well–being, and life satisfaction have risen substantially. However, the specific reasons underlying these dynamics warrant further investigation.

4.4. Heterogeneity Analysis

It has been verified above that the construction of low–carbon cities significantly increases population. However, China has a vast territory, with prominent heterogeneity among cities in scientific and educational levels, population size, natural resources, economic development level, etc. Therefore, the administration efficiency, resource allocation ability, and environmental regulation enforcement among local governments will vary significantly as well [24]. Therefore, this paper conducts a heterogeneity analysis with the aim of delving deeper into the variations in the effects of the LCP program on population growth based on different locations and local economic development levels. This is an essential step to gain a more nuanced understanding of the program’s impact and to identify any potential patterns or trends that might not be evident when analyzing the entire dataset as a whole.

4.4.1. Locality Heterogeneity in Cities

The significant variations in infrastructure, governmental and business efficiency, as well as talent supply across different regions, prompted an investigation into whether the impact of the low–carbon city policy on population growth is consistent across these diverse regions. For this purpose, we categorized our sample cities into three distinct regions: eastern (120 cities), central (82 cities), and western (95 cities). Within these regions, 62, 30, and 34 cities, respectively, are designated as LCP cities. To explore potential regional differences, we conducted three separate DID analyses, each including an interaction term of region and d i d .
The findings, presented in Table 7, shed light on the distinct impact of the LCP program on population growth across the three designated regions. Notably, there is a discernible trend of diminishing effect as one moves from eastern to central to western cities. While the statistical significance is evident across all regions, the magnitude of the effect diminishes from east to west. This pattern aligns with expectations and is attributed to the varying developmental contexts of these regions.
Eastern cities, endowed with proximity to coastlines, abundant natural resources, and a robust talent pool, have enjoyed advanced economic development. Consequently, these cities possess a substantial advantage in terms of amassing low–carbon technologies, fostering innovation, securing fiscal resources, and benefiting from efficient administration. As a result, the LCP program’s implementation is accompanied by considerable resources and consequently, yields a substantial impact, leading to improved medical facilities, enhanced transportation infrastructure, better living conditions, and an elevated standard of living in these locales.
Conversely, western cities, characterized by their inland location, mountainous terrain, and limited resource endowments, grapple with inadequate fiscal backing, talent shortages, insufficient urban infrastructure, and a dearth of low–carbon development expertise. Given their less conducive starting point, the LCP program’s ability to transform their economic and environmental landscape, and thereby attract significant population, remains constrained. Similarly, central cities occupy an intermediate position in this spectrum, with the impact of the LCP program situated between the substantial effects observed in the east and the more limited effects experienced in the west.
In summary, the regional analysis illuminates the nuanced relationship between the low–carbon city policy and population growth. As this relationship is modulated by the unique conditions and developmental stages of each region, our findings emphasize the importance of tailoring policy approaches to the specific characteristics and requirements of each locale.

4.4.2. Heterogeneity Analysis of GDP Per Capita

Beyond regional disparities, variations in economic conditions and development levels across Chinese cities can also impact the efficacy of local government administration and the business environment, thereby influencing the extent to which the LCP program affects population growth. Given the widespread recognition of GDP as a measure of economic development, this study categorizes cities into three equal groups based on their average per capita GDP. These groups are the high per capita GDP group (High GDPPC), the medium per capita GDP group (Mid GDPPC), and the low per capita GDP group (Low GDPPC). Subsequently, the study investigates the heterogeneity in the impact of the LCP program on population growth due to GDP variation. The results are presented in columns (1), (2), and (3) of Table 8.
The analysis reveals that the LCP program has a significant impact on population growth across all three groups. However, when considering the coefficients of d i d , it is observed that the medium per capita GDP group displays the most pronounced impact. There are several possible explanations for this phenomenon. Firstly, cities with high per capita GDP in China often experience high population densities, which can limit the potential for further population growth. In certain cities, such as Beijing, local governments actively seek to curtail population expansion. Secondly, cities with medium per capita GDP often possess more opportunities and room for growth in terms of their economy, environment, living conditions, and population size. On the other hand, cities with low per capita GDP may struggle with limited fiscal resources required for the successful implementation of the LCP program. Additionally, residents in these areas may typically receive less education and consequently may not fully appreciate the benefits of a low–carbon environment.
To assess whether the observed differences in impact among the three groups are statistically significant, the study employs a more detailed analysis involving the interaction term c did × c group . The model is presented in column (4) of Table 8, and the corresponding results are displayed in column (5). The interaction term’s lack of significance implies that the impact differences are not statistically meaningful. In other words, per capita GDP appears to have a marginal impact on the influence of the LCP program on population growth.

5. Conclusions

This study was conducted to contribute insights on the impact of the LCP program on population growth. The empirical results have yielded compelling insights into the impact of the LCP program on population growth in China. Firstly, our findings consistently indicate that the LCP program has a statistically significant positive impact on population growth, which is most pronounced in the second batch of cities. This suggests that as the program matured and accumulated experience over time, its effects on attracting population growth became more prominent. Secondly, the program’s positive impact on population growth is mediated through two main mechanisms: attracting FDI and reducing exhaust emissions. These factors play a vital role in shaping cities’ attractiveness and livability, contributing to population growth. However, the effect on per capita income is not statistically significant, suggesting that income level alone may not be a primary driver of population growth in this context. Thirdly, the impact of the LCP program on population growth exhibits geographical variation. Eastern cities experience the greatest impact, while western cities experience the least. Lastly, our analysis reveals that there is no significant evidence indicating that the impact of the LCP program on population growth varies based on cities’ economic development levels.
Our analysis provides practical implications, which can serve as valuable guidance for policymakers and urban planners in developing strategies that balance economic growth, environmental protection, and demographic dynamics. Firstly, cities in China and beyond can consider adopting similar low–carbon development initiatives to attract population. It is noteworthy that the impact can be enhanced through attracting investment and improving air quality. Secondly, findings in this study regarding locality heterogeneity underscores the importance of tailored strategies for different regions. Focusing on improving the environment and attracting investment becomes crucial in such contexts. Thirdly, the finding that per capita GDP influences the impact of the LCP program while personal income levels do not highlights the significance of public welfare. This suggests that investing in public infrastructure and services may be more effective in enhancing population attractiveness than solely focusing on raising personal incomes. Lastly, the potential for the LCP program to exacerbate regional disparities in population growth warrants attention. China has been promoting “Western Development” for many years, but the effect so far is not striking. The program’s stronger effectiveness in eastern regions could potentially widen the gap between eastern and central/western regions. Addressing this imbalance requires comprehensive policy approaches that incline to central and western cities.
The limitations of our analysis and future research are as follows. Some other variables may be worth consideration in the baseline test, mediating effect analysis and heterogeneity analysis. Some reasonings in the study need more data and further investigations. The findings of this study are not guaranteed to be applicable to other countries. Due to data availability, this study focuses on population growth; however, it will provide more insights and practical implications to study the effect of age structure or talent structure. These limitations open avenues for future research, including introducing more variables, further investigating some reasonings, conducting cross–country comparisons, and exploring the impact on age or talent structures.

Author Contributions

Conceptualization, methodology and writing—review and editing, G.C.; software, formal analysis and writing—original draft preparation, C.L. All authors have read and agreed to the published version of the manuscript.

Funding

This research was funded by the Humanities and Social Sciences Research Program of the Ministry of Education of China under grant number 22YJA790015.

Data Availability Statement

All the data used in the study as shown in Table 1 were obtained from China City Statistical Yearbook, China Population and Employment Statistical Yearbook, Statistical Communique on National Economic and Social Development, and other statistical yearbooks of the cities.

Conflicts of Interest

The authors declare no conflict of interest.

References

  1. Tao, J.; Wei, W.; Jiang, L. Matching as an econometric evaluation estimator: Evidence from evaluating a Job training programme. Rev. Econ. Stud. 1997, 4, 605–654. [Google Scholar]
  2. Wang, X.; Wei, W.; Ge, J.; Wu, B.; Bu, W.; Li, J.; Yao, M.; Guan, Q. Embodied rare earths flow between industrial sectors in China: A complex network approach. Resour. Conserv. Recycl. 2017, 161, 104510. [Google Scholar] [CrossRef]
  3. Zheng, J.; Ma, G.; Wei, J.; Wei, W.; He, Y.; Jiao, Y.; Han, X. Evolutionary process of household waste separation behavior based on social networks. Resour. Conserv. Recycl. 2020, 125, 105009. [Google Scholar] [CrossRef]
  4. Tan, S.; Yang, J.; Yan, J.; Lee, C.; Hashim, H.; Chen, B. A holistic low carbon city indicator framework for sustainable development. Appl. Energy 2017, 185, 1919–1930. [Google Scholar] [CrossRef]
  5. Duren, R.M.; Miller, C.E. Measuring the carbon emissions of megacities. Nat. Clim. Chang. 2012, 8, 560–562. [Google Scholar] [CrossRef]
  6. Salvia, M.; Reckien, D.; Pietrapertosa, F.; Eckersley, P.; Spyridaki, N.A.; Krook- Riekkola, A.; Olazabal, M.; Hurtado, S.D.G.; Simoes, S.G.; Geneletti, D. Will climate mitigation ambitions lead to carbon neutrality? An analysis of the local-level plans of 327 cities in the EU. Renew. Sustain. Energy Rev. 2021, 135, 110253. [Google Scholar] [CrossRef]
  7. Wei, W.; Cai, W.; Guo, Y.; Bai, C.; Yang, L. Decoupling relationship between energy consumption and economic growth in China’s provinces from the perspective of resource security. Resour. Policy 2020, 68, 101693. [Google Scholar]
  8. Liu, Z.; Cai, B. High-Resolution Carbon Emissions Data for Chinese Cities; The Belfer Center for Science and International Affairs, Harvard University: Cambridge, MA, USA, 2018; pp. 1–29. [Google Scholar]
  9. He, G.; Liu, T.; Zhou, M. Straw burning, PM2.5, and death: Evidence from China. J. Dev. Econ. 2020, 154, 102468. [Google Scholar] [CrossRef]
  10. Jiang, M.; Li, J.; Wei, W.; Miao, J.; Zhang, P.; Qian, H.; Yan, J. Using existing infrastructure to realize low-cost and flexible photovoltaic power generation in areas with high-power demand in China. iScience 2020, 12, 101867. [Google Scholar] [CrossRef]
  11. Luo, F.; Guo, Y.; Yao, M.; Cai, W.; Wang, M.; Wei, W. Carbon emissions and driving forces of China’s power sector: Input-output model based on the disaggregated power sector. J. Clean. Prod. 2020, 268, 121925. [Google Scholar] [CrossRef]
  12. Wei, W.; Zhang, P.; Yao, M.; Xue, M.; Miao, J.; Liu, B.; Wang, F. Multi-scope electricity-related carbon emissions accounting: A case study of Shanghai. J. Clean. Prod. 2019, 252, 119789. [Google Scholar] [CrossRef]
  13. Khanna, N.; Fridley, D.; Hong, L. China’s pilot low–carbon city initiative: A comparative assessment of national goals and local plans. Sustain. Cities Soc. 2014, 12, 110–121. [Google Scholar] [CrossRef]
  14. Wang, M.; Feng, C. How will the greening policy contribute to China’s greenhouse gas emission mitigation? A non-parametric forecast. Environ. Res. 2021, 195, 110779. [Google Scholar] [CrossRef]
  15. Zhao, P.; Zhang, M. The impact of urbanisation on energy consumption: A 30-year review in China. Urban Clim. 2018, 24, 940–953. [Google Scholar] [CrossRef]
  16. Liu, J.; Deng, X. Impacts and mitigation of climate change on Chinese cities. Current Opin. Environ. Sustain. 2011, 3, 188–192. [Google Scholar] [CrossRef]
  17. Zhang, P.; Cai, W.; Yao, M.; Wang, Z.; Yang, L.; Wei, W. Urban carbon emissions associated with electricity consumption in Beijing and the driving factors. Appl. Energy 2020, 275, 115425. [Google Scholar] [CrossRef]
  18. Low Carbon City Initiative. Available online: https://en.wwfchina.org/en/what_we_do/climate___energy/mitigation/lcci (accessed on 7 July 2023).
  19. For the First Time Since the 1960s, China’s Population is Shrinking. Available online: https://www.economist.com/china/2023/01/17/for-the-first-time-since-the-1960s-chinas-population-is-shrinking?utm_medium=cpc.adword.pd&utm_source=google&utm_campaign=a.io_apac_freetrial&utm_content=conversion.non-brand.anonymous.apac_sg_en_free-trial_na_non-brand_google_subs_pmax_other_na_na&gclid=CjwKCAjwmbqoBhAgEiwACIjzEB0E-4XQMuXTyBytdrhjOchTaoTpETC3PJumRcG8rL5k9wGIfZxRjBoC-gkQAvD_BwE (accessed on 23 September 2023).
  20. Zhao, Z.Y.; Gao, L.; Zuo, J. How national policies facilitate low carbon city development: A China study. J. Clean. Prod. 2019, 234, 743–754. [Google Scholar] [CrossRef]
  21. Liu, C.; Zhou, Z.; Liu, Q.; Xie, R.; Zeng, X. Can a low–carbon development path achieve win-win development: Evidence from China’s low–carbon pilot policy. Mitig. Adapt. Strateg. Glob. Chang. 2020, 25, 1199–1219. [Google Scholar] [CrossRef]
  22. Shen, L.; Wu, Y.; Shuai, C.; Lu, W.; Chau, K.; Chen, X. Analysis on the evolution of low carbon city from process characteristic perspective. J. Clean. Prod. 2018, 187, 348–360. [Google Scholar] [CrossRef]
  23. Wang, Y.; Song, Q.; He, J.; Qi, Y. Developing low–carbon cities through pilots. Clim. Policy 2015, 15, 81–103. [Google Scholar] [CrossRef]
  24. Qiu, S.; Wang, Z.; Liu, S. The policy outcomes of low–carbon city construction on urban green development: Evidence from a quasi-natural experiment conducted in China. Sustain. Cities Soc. 2021, 66, 102699. [Google Scholar] [CrossRef]
  25. Fu, Y.; He, C.; Luo, L. Does the low–carbon city policy make a difference? Empirical evidence of the pilot scheme in China with DEA and PSM-DID. Ecol. Indicat. 2021, 122, 107238. [Google Scholar] [CrossRef]
  26. Yu, Y.; Zhang, N. low–carbon city pilot and carbon emission efficiency: Quasi-experimental evidence from China. Energy Econ. 2021, 96, 105125. [Google Scholar] [CrossRef]
  27. Wang, X.; Wang, G.; Chen, T.; Zeng, Z.; Heng, C.K. low–carbon city and its future research trends: A bibliometric analysis and systematic review. Sustain. Cities Soc. 2023, 90, 104381. [Google Scholar] [CrossRef]
  28. Yan, Y.; Huang, J. The role of population agglomeration played in China’s carbon intensity: A city-level analysis. Energy Econ. 2022, 114, 106276. [Google Scholar] [CrossRef]
  29. Wang, J.; Yu, X. Birth policy changes and the sustainability of social medical insurance funds: Implications for green growth. Econ. Chang. Restruct. 2023, 56, 2205–2225. [Google Scholar] [CrossRef]
  30. Marois, G.; Gietel-Basten, S.; Lutz, W. China’s low fertility may not hinder future prosperity. Proc. Natl. Acad. Sci. usa 2021, 118, e2108900118. [Google Scholar] [CrossRef]
  31. Lyu, J.; Liu, T.; Cai, B.; Qi, Y.; Zhang, X. Heterogeneous effects of China’s low–carbon city pilots policy. J. Environ. Manag. 2023, 344, 118329. [Google Scholar] [CrossRef]
  32. Syahza, A.; Asmit, B. Regional economic empowerment through oil palm economic institutional development. Qual. Int. J. 2019, 30, 1256–1278. [Google Scholar] [CrossRef]
  33. Liu, T.; Song, Q.; Lu, J.; Qi, Y. An integrated approach to evaluating the coupling coordination degree between low–carbon development and air quality in Chinese cities. Adv. Clim. Chang. Res. 2021, 12, 710–722. [Google Scholar] [CrossRef]
  34. National Economy Withstood Pressure and Reached a New Level in 2022. Available online: www.stats.gov.cn/english/PressRelease/202301/t20230117_1892094.html (accessed on 8 August 2023).
  35. World Population Prospects 2022. Available online: https://population.un.org/wpp/DefinitionOfProjectionScenarios (accessed on 5 August 2023).
  36. Bu, D. Empirical Analysis of the Impact of Local Government Talent Policy on Regional Enterprise Innovation and Development under the Background of “Competition for Talents”. Master’s Thesis, Shanghai University of Finance and Economics, Shanghai, China, 18 June 2022. (In Chinese). [Google Scholar]
  37. Liu, Y.; Xiao, H.; Lv, Y.; Zhang, N. The effect of new-type urbanization on energy consumption in China: A spatial econometric analysis. J. Clean. Prod. 2017, 163, S299–S305. [Google Scholar] [CrossRef]
  38. Hou, J.; Liu, Y.; Wu, Y.; Zhou, N.; Feng, W. Comparative study of commercial building energy-efficiency retrofit policies in four pilot cities in China. Energy Policy 2016, 88, 204–215. [Google Scholar] [CrossRef]
  39. Lo, K. China’s low–carbon city initiatives: The implementation gap and the limits of the target responsibility system. Habitat Int. 2014, 42, 236–244. [Google Scholar] [CrossRef]
  40. Liu, W.; Qin, B. low–carbon city initiatives in China: A review from the policy paradigm perspective. Cities 2016, 51, 131–138. [Google Scholar] [CrossRef]
  41. Huang, Y.; Liao, C.; Zhang, J.; Guo, H.; Zhou, N.; Zhao, D. Exploring potential pathways towards urban greenhouse gas peaks: A case study of Guangzhou, China. Appl. Energy 2019, 251, 113369. [Google Scholar] [CrossRef]
  42. Fan, Y.; Ji, Y.; Li, D.; Li, Y. Study on evaluation index system of low–carbon city. In Proceedings of the International Conference on Materials for Renewable Energy & Environment, Shanghai, China, 20–22 May 2011. [Google Scholar]
  43. Dong, L.; Gu, F.; Fujita, T.; Hayashi, Y.; Gao, J.; France, N. Uncovering opportunity of low–carbon city promotion with industrial system innovation: Case study on industrial symbiosis projects in China. Energy Policy 2014, 65, 388–397. [Google Scholar] [CrossRef]
  44. Gao, G.; Chen, S.; Yang, J. Carbon emission allocation standards in China: A case study of shanghai city. Energy Strategy Rev. 2010, 7, 55–62. [Google Scholar] [CrossRef]
  45. Chen, H.; Yang, L.; Chen, W. Modelling national, provincial and city-level low–carbon energy transformation pathways. Energy Policy 2020, 137, 111096. [Google Scholar] [CrossRef]
  46. Zhu, X.; Zhang, P.; Wei, Y.; Li, Y.; Zhao, H. Measuring the efficiency and driving factors of urban land use based on the DEA method and the PLS-SEM model–a case study of 35 large and medium-sized cities in China. Sustain. Cities Soc. 2019, 50, 101646. [Google Scholar] [CrossRef]
  47. Hanna, R.; Oliva, P. The effect of pollution on labor supply: Evidence from a natural experiment in Mexico City. J. Publ. Econ. 2015, 122, 68–79. [Google Scholar] [CrossRef]
  48. Cheng, J.; Yi, J.; Dai, S.; Xiong, Y. Can low–carbon city construction facilitate green growth? Evidence from China’s pilot low–carbon city initiative. J. Clean. Prod. 2019, 231, 1158–1170. [Google Scholar] [CrossRef]
  49. Song, M.; Zhao, X.; Shang, Y. The impact of low–carbon city construction on ecological efficiency: Empirical evidence from quasi-natural experiments. Resour. Conserv. Recycl. 2020, 157, 104777. [Google Scholar] [CrossRef]
  50. Zhang, Y.; Peng, Y.; Ma, C.; Shen, B. Can environmental innovation facilitate carbon emissions reduction? Evidence from China. Energy Policy 2010, 100, 18–28. [Google Scholar] [CrossRef]
  51. Liu, T.; Wang, Y.; Song, Q.; Qi, Y. low–carbon governance in China—Case study of low carbon industry park pilot. J. Clean. Prod. 2018, 174, 837–846. [Google Scholar] [CrossRef]
  52. Song, Q.; Zhou, N.; Liu, T.; Siehr, S.A.; Qi, Y. Investigation of a “coupling model” of coordination between low–carbon development and urbanization in China. Energy Policy 2018, 121, 346–354. [Google Scholar] [CrossRef]
  53. Gehrsitz, M. The effect of low emission zones on air pollution and infant health. J. Environ. Econ. Manag. 2017, 83, 121–144. [Google Scholar] [CrossRef]
  54. Song, H.; Sun, Y.; Chen, D. Assessment for the effect of government air pollution control policy: Empirical evidence from “low–carbon City” construction in China. J. Manag. World 2019, 35, 95–108+195. (In Chinese) [Google Scholar]
  55. Margaryan, S. Low emission zones and population health. J. Health Econ. 2021, 76, 102402. [Google Scholar] [CrossRef]
  56. Xia, C.Y.; Li, Y.; Ye, Y.M.; Shi, Z.; Liu, J.M. Decomposed driving factors of carbon emissions and scenario analyses of low–carbon transformation in 2020 and 2030 for Zhejiang province. Energies 2017, 10, 1747. [Google Scholar] [CrossRef]
  57. Wang, S.; Wang, J.; Li, S.; Fang, C.; Feng, K. Socioeconomic driving forces and scenario simulation of CO2 emissions for a fast-developing region in China. J. Clean. Prod. 2019, 216, 217–229. [Google Scholar] [CrossRef]
  58. Liu, X.; Xu, H. Does low–carbon pilot city policy induce low–carbon choices in residents’ living: Holistic and single dual perspective. J. Environ. Manag. 2022, 324, 116353. [Google Scholar] [CrossRef] [PubMed]
  59. Zhang, Y.; Bian, X.; Tan, W.; Song, J. The indirect energy consumption and CO2 emission caused by household consumption in China: An analysis based on the input–output method. J. Clean. Prod. 2017, 163, 69–83. [Google Scholar] [CrossRef]
  60. David, M.; Sinclair-Desgagné, B. Environmental regulation and the eco-industry. J. Regul. Econ. 2005, 28, 141–155. [Google Scholar] [CrossRef]
  61. Cole, M.A.; Elliott, R.J.R.; Shimamoto, K. Industrial characteristics, environmental regulations and air pollution: An analysis of the UK manufacturing sector. J. Environ. Econ. Manag. 2005, 50, 121–143. [Google Scholar] [CrossRef]
  62. Rogge, K.S.; Schneider, M.; Hoffmann, V.H. The innovation impact of the EU Emission Trading System–findings of company case studies in the German power sector. Ecol. Econ. 2011, 70, 513–523. [Google Scholar] [CrossRef]
  63. Greenstone, M.; List, J.A.; Syverson, C. The Effects of Environmental Regulation on the Competitiveness of US Manufacturing; Working Papers; National Bureau of Economic Research: Cambridge, MA, USA, 2011. [Google Scholar]
  64. Porter, M.E.; Van der Linde, C. Toward a new conception of the environment-competitiveness relationship. J. Econ. Perspect. 1995, 9, 97–118. [Google Scholar] [CrossRef]
  65. Chung, S. Environmental regulation and investment: Evidence from South Korea. J. Dev. Econ. 2014, 108, 222–236. [Google Scholar] [CrossRef]
  66. Cai, X.; Lu, Y.; Wu, M.; Yu, L.H. Does environmental regulation drive away inbound foreign direct investment? Evidence from a quasi-natural experiment in China. J. Dev. Econ. 2016, 123, 73–85. [Google Scholar] [CrossRef]
  67. Rubashkina, Y.; Galeotti, M.; Verdolini, E. Environmental regulation and competitiveness: Empirical evidence on the Porter Hypothesis from European manufacturing sectors. Energy Policy 2015, 83, 288–300. [Google Scholar] [CrossRef]
  68. Zhao, X.; Sun, B. The influence of Chinese environmental regulation on corporation innovation and competitiveness. J. Clean. Prod. 2016, 112, 1528–1536. [Google Scholar] [CrossRef]
  69. Skoczkowski, T.; Bielecki, S.; Weglarz, A.; Wlodarczak, M.; Gutowski, P. Impact assessment of climate policy on Poland’s power sector. Mitig. Adapt. Strat. Glob. Chang. 2018, 23, 1303–1349. [Google Scholar] [CrossRef] [PubMed]
  70. Raymond, W.; Mairesse, J.; Mohnen, P.; Palm, F. Dynamic models of R & D, innovation and productivity: Panel data evidence for Dutch and French manufacturing. Eur. Econ. Rev. 2015, 78, 285–306. [Google Scholar]
  71. Ge, J.L.; Fu, Y.; Xie, R.; Liu, Y.; Mo, W.Y. The effect of GVC embeddedness on productivity improvement: From the perspective of R&D and government subsidy. Technol. Forecast. Soc. 2018, 135, 22–31. [Google Scholar]
  72. Ravenstein, E.G. The laws of migration. J. Stat. Soc. Lond. 1885, 48, 167–235. [Google Scholar] [CrossRef]
  73. Lee, E.S. A theory of migration. Demography 1966, 3, 47–57. [Google Scholar] [CrossRef]
  74. Chen, H.; Guo, W.; Feng, W.; Wei, W.; Liu, H.; Feng, Y.; Gong, W. The impact of low–carbon city pilot policy on the total factor productivity of listed enterprises in China. Resour. Conserv. Recycl. 2021, 169, 105457. [Google Scholar] [CrossRef]
  75. Wang, F.; Ge, X. Can low–carbon transition impact employment–empirical evidence from low–carbon city pilot policy. China Indust. Econ. 2022, 5, 81–99. (In Chinese) [Google Scholar]
  76. Mulia, R.; Widayati, A.; Agung, P.; Zulkarnain, M.T. Low carbon emission development strategies for Jambi, Indonesia: Simulation and trade-off analysis using the FALLOW model. Mitig. Adapt. Strat. Glob. Chang. 2014, 19, 773–788. [Google Scholar] [CrossRef]
  77. Zhang, X.; Zhang, X.; Chen, X. Happiness in the air: How does a dirty sky affect mental health and subjective well-being? J. Environ. Econ. Manag. 2017, 85, 81–94. [Google Scholar] [CrossRef]
  78. Xie, Y.; Dai, H.; Zhang, Y.; Wu, Y.; Hanaoka, T.; Masui, T. Comparison of health and economic impacts of PM2.5 and ozone pollution in China. Environ. Int. 2019, 130, 104881. [Google Scholar] [CrossRef]
  79. Ao, C.; Dong, Y.; Kuo, P. Industrialization, indoor and ambient air quality, and elderly mental health. China Econ. Rev. 2021, 69, 101676. [Google Scholar] [CrossRef]
  80. Lichter, A.; Pestel, N.; Sommer, E. Productivity effects of air pollution: Evidence from professional soccer. Lab. Econ. 2017, 48, 54–66. [Google Scholar] [CrossRef]
  81. Chang, T.Y.; Graff Zivin, J.; Gross, T.; Neidell, M. The effect of pollution on worker productivity: Evidence from call center workers in China. Am. Econ. J. Appl. Econ. 2019, 11, 151–172. [Google Scholar] [CrossRef]
  82. Chen, S.; Zhang, D. Impact of air pollution on labor productivity: Evidence from prison factory data. China Econ. Quart. Int. 2021, 1, 148–159. [Google Scholar] [CrossRef]
  83. He, J.; Liu, H.; Salvo, A. Severe air pollution and labor productivity: Evidence from industrial towns in China. Am. Econ. J. Appl. Econ. 2019, 11, 173–201. [Google Scholar] [CrossRef]
  84. Zhao, X.; Liu, C.; Sun, C.; Yang, M. Does stringent environmental regulation lead to a carbon haven effect? Evidence from carbon-intensive industries in China. Energy Econ. 2020, 86, 104631. [Google Scholar] [CrossRef]
  85. Yu, H.; Liao, L.; Qu, S.; Fang, D.; Luo, L.; Xiong, G. Environmental regulation and corporate tax avoidance: A quasi-natural experiments study based on China’s new environmental protection law. Am. Econ. J. Appl. Econ. 2021, 296, 113160. [Google Scholar]
  86. Zhang, M.; Liu, X.; Sun, X.; Wang, W. The influence of multiple environmental regulations on haze pollution: Evidence from China. Atmos. Pollut. Res. 2020, 11, 170–179. [Google Scholar] [CrossRef]
  87. Fu, S.; Ma, Z.; Ni, B.; Peng, J.; Zhang, L.; Fu, Q. Research on the spatial differences of pollution-intensive industry transfer under the environmental regulation in China. Ecol. Indicat. 2021, 129, 107921. [Google Scholar] [CrossRef]
  88. Yao, L.; Li, X.; Zheng, R.; Zhang, Y. The impact of air pollution perception on urban settlement intentions of young talent in China. Int. J. Environ. Res. Public Health 2022, 19, 1080. [Google Scholar] [CrossRef]
  89. Liu, W.; Yu, H.; Jia, L.; Shan, S. Does the Construction of low–carbon Cities Enhance the National Health Quality? Contemp. Financ. Econ. 2022, 11, 16–26. (In Chinese) [Google Scholar]
  90. Li, B.; Huang, J.; Zhang, Y. The impacts of air pollution on immigrants’ settlement intention in China. Environ. Sci. Pollut. Res. 2023, 30, 46587–46603. [Google Scholar] [CrossRef] [PubMed]
  91. Lyu, Y.; Wu, Z.; Wu, H.; Pang, X.; Qin, K.; Wang, B.; Ding, S.; Chen, D.; Chen, J. Tracking long-term population exposure risks to PM2.5 and ozone in urban agglomerations of China 2015–2021. Sci. Total Environ. 2023, 854, 158599. [Google Scholar] [CrossRef] [PubMed]
  92. Chen, S.; Oliva, P.; Zhang, P. The effect of air pollution on migration: Evidence from China. J. Dev. Econ. 2022, 156, 102833. [Google Scholar] [CrossRef]
  93. He, G.; Fan, M.; Zhou, M. The effect of air pollution on mortality in China: Evidence from the 2008 Beijing Olympic Games. J. Environ. Econ. Manag. 2016, 79, 18–39. [Google Scholar] [CrossRef]
  94. Jiang, J.; Ye, B.; Xie, D.; Tang, J. Provincial-level carbon emission drivers and emission reduction strategies in China: Combining multi-layer LMDI decomposition with hierarchical clustering. J. Clean. Prod. 2017, 169, 178–190. [Google Scholar] [CrossRef]
  95. Beck, T.; Levine, R.; Levkov, A. Big bad banks? The winners and losers from bank deregulation in the United States. J. Financ. 2010, 65, 1637–1667. [Google Scholar] [CrossRef]
  96. Jacobson, L.S.; LaLonde, R.J.; Sullivan, D.G. Earnings losses of displaced workers. Am. Econ. Rev. 1993, 83, 685–709. [Google Scholar]
  97. Li, P.; Lu, Y.; Wang, J. Does flattening government improve economic performance: Evidence from China. J. Dev. Econ. 2016, 123, 18–37. [Google Scholar] [CrossRef]
  98. Wang, S.; Yang, D.Y. Policy Experimentation in China: The Political Economy of Policy Learning; NBER Working Papers No. 29402; NBER: Cambridge, MA, USA, 2021. [Google Scholar]
  99. Zhuang, G. Policy design logic of low–carbon city pilots in China. China Popul. Res. Environ. 2020, 30, 19–28. [Google Scholar]
  100. Li, G.; He, Q.; Shao, S.; Cao, J. Environmental non-governmental organizations and urban environmental governance: Evidence from China. J. Environ. Manag. 2018, 206, 1296–1307. [Google Scholar] [CrossRef] [PubMed]
  101. Baron, R.M.; Kenny, D.A. The moderator–mediator variable distinction in social psychological research: Conceptual, strategic, and statistical considerations. J. Pers. Soc. Psychol. 1986, 51, 1173. [Google Scholar] [CrossRef] [PubMed]
  102. Henrekeson, M. Wagner’s Law—A spurious relationship? Public Financ. 1993, 48, 406–415. [Google Scholar]
Figure 1. Population growth of selected countries in 2009–2022. Source: United Nations. Accessed on 24 July 2023.
Sustainability 15 14751 g001
Figure 2. Empirical comparison of population growth between LCP cities and non–LCP cities.
Sustainability 15 14751 g002
Figure 3. Parallel trend test result.
Sustainability 15 14751 g003
Figure 4. Placebo test results.
Sustainability 15 14751 g004
Figure 5. Equilibrium test of the covariates.
Sustainability 15 14751 g005
Table 1. Descriptive statistics of the main variables.
VariableFull Sample Treatment Group Control Group
ObsMeanMinMax ObsMeanMinMax ObsMeanMinMax
LNPOP34825.9803.8078.912 8286.0363.8076.579 26545.9623.8078.912
did34820.12301 8280.51801 2654000
LNPGDP348210.589.15012.13 82810.919.15012.13 265410.489.15012.13
Industry348247.8619.9073.23 82846.9319.9073.23 265448.1519.9073.23
Finance34821.2060.2965.013 8281.7720.6745.013 26541.0290.2965.013
Npop34825.947−8.70022.50 8285.665−8.70022.50 26546.035−8.70022.50
Source: China City Statistical Yearbook and China Population and Employment Statistical Yearbook.
Table 2. Impact of low–carbon city program on population.
VariableWithout Control VariablesWith Control Variables
did0.2015 ***0.1911 ***
(0.0215)(0.0219)
LNPGDP-0.4196 ***
(0.0535)
Industry-−0.0030
(0.0019)
Finance-−0.0047
(0.0107)
Npop-0.0040 ***
(0.0013)
Constant5.9547 ***1.6382 ***
(0.0063)(0.5172)
Year FEYesYes
City FEYesYes
N34823482
r 2 0.73530.7489
F87.470633.0228
Note: (1). Standard errors in parentheses; (2). * p < 0.1, ** p < 0.05, *** p < 0.01.
Table 3. Robustness tests results.
VariableLagged Control VariablesIntensity DIDPSM-DID
did0.1867 ***0.062 ***0.1993 ***
(0.0258)(4.10)(0.0292)
LNPGDP0.3160 ***0.000 ***0.4334 ***
(0.0765)(18.71)(0.0813)
Industry−0.0002−0.005 ***−0.0066 *
(0.0025)(−4.75)(0.0035)
Finance−0.0218−0.051 ***−0.0360
(0.0185)(−4.10)(0.0253)
Npop0.00120.0010.0085 **
(0.0014)(0.63)(0.0033)
Constant2.6662 ***6.083 ***1.6355 **
(0.7405)(105.85)(0.8008)
Year FEYesYesYes
City FEYesYesYes
N286034821408
r 2 0.71580.7190.7624
F17.960925.6620.5695
Note: (1). Standard errors in parentheses; (2). * p < 0.1, ** p < 0.05, *** p < 0.01.
Table 4. PSM–DID matching tests results.
VariableUnmatchedMean%Biast-Test
MatchedTreatedControltp > |t|
LNPGDPU10.98410.48485.16.080.000
M10.95611.014−9.9−0.580.562
IndustryU46.12147.385−18.0−1.270.204
M46.83648.835−21.1−1.200.233
FinanceU1.78171.10776.85.400.000
M1.67751.64034.20.210.833
NpopU5.56746.2557−13.9−0.950.341
M5.40094.474718.71.070.285
Note: %Bias represents standard errors.
Table 5. Results before and after PSM–DID matching.
SamplePs R2LR chi2p > chi2Mean biasMed biasBR%Var
Unmatched0.15752.490.00048.447.4105.3 *0.9525
Matched0.0173.170.53013.514.330.9 *0.6775
Note: (1). * If B > 25%, R outside of [0.5, 2]; (2). “Mean bias” represents the mean of standard errors; (3). “Med bias” represents the median of standard errors.
Table 6. Mediating effect tests results.
Variable(1)(2)(3)(4)(5)(6)(7)
LNPOPFILNPOPPILNPOPWaELNPOP
did0.1911 ***0.0962 ***0.1487 ***0.00410.1920 ***0.6496 ***0.1746 ***
(0.0219)(0.0092)(0.0227)(0.0030)(0.0219)(0.0726)(0.0220)
FI 0.4406 ***
(0.0912)
PI −0.2228 *
(0.1139)
WaE 0.0254 ***
(0.0097)
Constant1.6382 ***1.3848 ***1.0281 *2.3833 ***2.1693 ***6.2596 ***1.4795 ***
(0.5172)(0.1000)(0.5461)(0.0286)(0.5869)(0.6449)(0.5203)
Control variable effectYesYesYesYesYesYesYes
Year FEYesYesYesYesYesYesYes
N3482348234823482348234823482
r 2 0.74890.57090.75500.19710.74910.72350.7497
F33.022837.653628.54163.860528.914634.596027.8587
Note: (1). Standard errors in parentheses; (2). * p < 0.1, ** p < 0.05, *** p < 0.01.
Table 7. Impact of city locality heterogeneity.
VariableLNPOP
Eastern_did0.1468 ***
(0.0555)
Middle_did0.1177 **
(0.0548)
Western_did0.0947 *
(0.0563)
LNPOP0.4233 ***
(0.0539)
Industry−0.0029
(0.0019)
Finance−0.0053
(0.0107)
Npop0.0039 ***
(0.0013)
Constant1.5965 ***
(0.5204)
Year FEYes
City FEYes
N3180
r 2 0.7495
F45.8228
Note: (1). Standard errors in parentheses; (2). * p < 0.1, ** p < 0.05, *** p < 0.01.
Table 8. Impact of GDP per capita heterogeneity on population growth.
Variable(1)(2)(3)(4)(5)
High GDPPCMid GDPPCLow GDPPC
LnyLnyLny TC
did0.140 ***0.252 ***0.130 ***c_did0.182 ***
(6.05)(2.89)(3.49) (5.40)
LNPGDP0.298 ***0.491 ***0.250 ***c_group−0.094
(6.06)(6.91)(5.02) (−0.30)
Industry−0.000−0.001−0.004 **c_did × c_group−0.021
(−0.06)(−0.26)(−2.45) (−0.60)
Finance−0.008−0.0580.001LNPGDPsignificant
(−0.45)(−1.45)(0.07)Industrynon significant
Npop0.0020.0060.004 ***Financenon significant
(1.04)(1.34)(2.80)Npopsignificant
Year FEYesYesYesConstantsignificant
City FEYesYesYes Year fixed effect Yes
Constant2.898 ***1.0293.414 *** City fixed effect Yes
(5.76)(1.50)(7.75)Observations3482
R-squared0.8780.7200.514R-squared0.109
r a 2 0.8620.6840.449 r a 2 0.00340
F56.8020.167.908F20.46
Note: (1). t–statistics in parentheses; (2). * p < 0.1, ** p < 0.05, *** p < 0.01.
Disclaimer/Publisher’s Note: The statements, opinions and data contained in all publications are solely those of the individual author(s) and contributor(s) and not of MDPI and/or the editor(s). MDPI and/or the editor(s) disclaim responsibility for any injury to people or property resulting from any ideas, methods, instructions or products referred to in the content.

