Article

Analysis of China’s High-Carbon Manufacturing Industry’s Carbon Emissions in the Digital Process

School of Economics and Finance, University Town Campus, South China University of Technology, 382 Waihuan East Road, Panyu District, Guangzhou 510006, China
*
Author to whom correspondence should be addressed.
Sustainability 2023, 15(20), 14785; https://doi.org/10.3390/su152014785
Submission received: 12 September 2023 / Revised: 2 October 2023 / Accepted: 9 October 2023 / Published: 12 October 2023

Abstract

:
In order to realize the coordinated development of digitalization and low-carbon emissions, it is important to understand the carbon implications of the digitization of the high-carbon manufacturing (HCM) industry; therefore, this paper focuses on studying the formation and change mechanism of China’s HCM carbon emissions in the digital process. Specifically, based on input–output and energy data, we not only compute the carbon emissions embodied in the digital process of various HCM subsectors and analyze their temporal changes but also reveal the change mechanism by identifying their supply chain tiers and crucial transfer paths. The results show that (1) the digital process of HCM can reduce carbon emissions; (2) the carbon emissions embodied in the digital process of HCM are increasing with time and shifting from low-supply chain tiers to high-supply chain tiers; and (3) the embodied emissions, supply chain tiers, and crucial paths in the digital process of HCM show spatial heterogeneity. We suggest that attention should be paid to increasing embodied emissions in the supply chain tiers and regional differences during the acceleration of HCM digitization, followed by the implementation of appropriate digital carbon neutral policies.

1. Introduction

The burning of nonrenewable energy sources in the agricultural and industrial production sectors causes carbon emissions [1,2,3,4]. China’s current annual carbon emissions are about 10 billion tons, about one-quarter of the world’s total emissions, of which the electric and heat power sector accounts for about 4.5 billion tons, and other industries account for about 3.9 billion tons; therefore, China’s industrial carbon emissions account for about 85% of the total emissions. At the same time, based on China’s energy data from 1997 to 2020, manufacturing is the main contributor to industrial carbon emissions, and its emissions show obvious characteristics of sub-sectoral agglomeration, such as the emissions of ferrous metal processing and smelting, nonmetallic mineral products, petroleum, coal, and other fuel processing; the chemical industry and nonferrous metal smelting and processing accounted for more than 84.6% emissions of the entire manufacturing industry (Figure 1). In May 2021, the Ministry of Ecology and Environment issued the Guiding Opinions on Strengthening the Control of Construction Projects with High Energy Consumption and High Emissions, which clearly includes industries such as thermal power, petrifaction, chemical, iron and steel, nonferrous metal smelting and processing, and building materials; therefore, this paper defines the industries of petroleum, coal, and other fuel processing, chemistry, iron and steel, nonferrous metal smelting, and nonmetallic mineral products as the high-carbon manufacturing industry (HCM). Then, an urgent problem to solve is how to effectively solve the emission problem of HCM at a relatively low economic cost.
The Chinese government have proposed a solution: digitization. In December 2021, The State Council put forward “promoting green development in the process of digital transformation” in the Notice on the “14th Five-Year Plan for Digital Economy Development”. On 1 August 2022, the Ministry of Industry and Information Technology, the National Development and Reform Commission, and the Ministry of Ecology and Environment issued the “Implementation Plan for Carbon Peak in the Industrial Sector”, which aimed to “realize industrial low-carbon development by promoting the digital process of industry”. In the same year, the Chinese government launched a pilot policy, which selected 10 regions to accelerate the low-carbon development of industries by utilizing digital technology and summarized a specific plan that can be implemented in other regions, including Zhangjiakou in Hebei Province, Dalian in Liaoning Province, Qiqihar in Heilongjiang Province, and so on. The government is optimistic about the role that digitalization can play in industrial carbon emission reduction, especially for HCM; in fact, is digital technology linked to the low-carbon development of HCM? Is the digital transformation of HCM significant in reducing carbon emissions? Based on this background, this paper attempts to explore the change in HCM carbon emissions in the process of digital transformation.
The rest of the paper is organized as follows: Section 2 describes the literature and theories related to this study. Section 3 calculates the carbon emissions (direct and embodied) of China’s HCM and its digital process. Section 4 explores the temporal and spatial characteristics of the supply chain tiers and crucial paths of the embodied carbon emissions generated in HCM’s digital process. Section 5 concludes the study.

2. Literature Review and Theory

The emergence of digital technology has set off a new wave of scientific and technological revolution, not only greatly promoting the development of the economy and productivity but also impacting the environment. The impact of digitalization on greenhouse gases (mainly CO2) has attracted scholars’ attention, and a unanimous conclusion has not been reached on whether the development of digital technology is conducive to reducing carbon emissions. According to the international standard, the calculation of carbon emissions is divided into three ranges [5]. However, no matter which range is used for calculation, carbon emissions are generated by energy consumption. It can be seen that energy consumption is the largest factor affecting carbon emissions at this stage, which has triggered research on whether digital technology can affect carbon emissions through influencing energy consumption. Lange et al. [6] divided the impact of digitalization on energy consumption into four effects: (1) the direct influence of digital technology production, use, and disposal; (2) the improvement of energy efficiency from digitization; (3) economic growth from increased production and energy efficiency; and (4) changes in the industrial structure caused by the development of digital technology-related industries. Wang and Lee [7] empirically found national heterogeneity in the impact of digital technologies on energy consumption based on data from 34 OECD countries and 39 non-OECD countries from 2007 to 2017. Wang et al. [8] studied the impact of the digital technology industry on China’s energy consumption and found that the development of digital technology increased energy consumption and caused more carbon emissions. From the perspective of energy intensity, the impact of digital technology on electric power intensity is nonlinear. In the initial period of digital technology, the use of Internet increases electric power consumption [9]. However, with the further development of digital technology, the electric power efficiency is improved, and the electric power intensity is reduced. Moreover, there is a negative effect on the intensity of adjacent regions [10]. In the long run, digital technology can improve energy efficiency and reduce energy consumption in production [11] by changing the energy consumption structure (the proportion of fossil energy) [12], thus reducing carbon emissions [13]. However, it should be noted that the mechanism by which digitalization affects carbon emissions through influencing energy varies with different digital subjects, and there is a nonlinear relationship between the degree of digital development and carbon emissions [14].
Manufacture is an important part of society and is the main factor leading to the increase in energy consumption and carbon emissions since the industrial revolution; with the proposal of “Industry 4.0”, the manufacturing industry started digitization, and this process inevitably has an impact on the environment [15,16]. On the one hand, digital technology has a strong universality in the manufacturing industry and can be used in almost all industries to improve production efficiency and thus reduce carbon emissions [17]. Digital technology also provides a new method for manufacturing industry transformation, allowing manufacturers to shift from a single supplier of products to a service provider related to products, helping to reduce carbon emissions in the process [18], e.g., the intelligent interactive system based on the cars can not only collect energy consumption information and feed it back to automobile enterprises but also optimize the car owner’s behavior, thereby reducing energy consumption and carbon emissions [19]. In addition, digital technology has brought about a new business model of “service + sharing” from purchasing to renting products, which can potentially reduce product inventory and energy consumption and help decarbonize plastics, steel, building materials, transportation, and other industries. On the other hand, some scholars think that the digitization of manufacture has a “rebound effect” (creating new demand and consumption patterns) and creates new data storage needs, which increases energy consumption and carbon emissions [20,21,22].
After understanding the impact of digital technology on the carbon emissions of the manufacturing industry, the research closely related to the contents of this paper mainly has two aspects. One is the measurement of carbon emissions in HCM, where existing studies mainly calculate carbon emissions in the production process of HCM by using energy consumption [23] and constructing a lifecycle assessment (LCA) to calculate carbon emissions in the whole process of HCM from production to sales [24,25]. In addition, some scholars take direct carbon emissions [26] or embodied carbon emissions [27] as undesired outputs to measure the carbon emission efficiency of HCM. The other is the impact of the digitalization of HCM on its carbon emissions. Previous studies, using regression analysis, have pointed out that the digital transformation of HCM can reduce carbon emissions, mainly through fostering green technology and product innovation [28] and improving enterprise energy use efficiency [29]. Shabani and Shahnazi [30], based on Iranian data, found that the digitization of HCM had a positive impact on its direct carbon emissions. Liang et al. [31] also drew a similar conclusion in the empirical study of China’s HCM industry. In addition, the process inevitably increases the product demand of digital sectors, causing more production emissions. The demand also generates large emissions by requiring carbon-intensive intermediate inputs from nondigital industries, such as the electric power industry and basic materials industries (metal and nonmetal), which are the major sources of carbon emissions [32].
These studies improve our understanding of the impact of digitization in HCM on carbon emissions. However, one major limitation of them is that they do not reveal the amount of carbon emissions generated by the digitization of HCM and how the economic activities associated with this process drive carbon emissions. Another limitation is that they did not analyze and compare the carbon emissions generated and reduced by the HCM digitization progress in a similar framework but only studied one of them. This may lead to a serious problem; that is, government planners only know the mechanism of HCM digitization affecting carbon emissions, but there is no corresponding data support. It is then difficult to promote their economic policies of HCM digitization and low-carbon coordinated development.
To fill the abovementioned gaps, based on the input–output approaches, this paper attempts to explore the embodied carbon emissions generated by the digital process of HCM and its related mechanism through the relevant economic activities at the sector level, which is of great significance for clarifying whether the application of digital technology in HCM is low carbon. Compared with econometric approaches, the input–output approaches have proven useful in tracking both the consumption-based emissions of specific economic sectors and the exchange mechanisms of carbon flows between sectors [33,34,35].
We first assess the direct and embodied carbon emissions of China’s HCM industry and its subsectors through input–output analysis and then evaluate the emissions generated during the digital process of China’s HCM industry using a subsystem analysis. We further conduct a structural path analysis to reveal how carbon emissions accumulate along detailed supply chains in the digital process of China’s HCM. Finally, we specifically analyze the spatial and temporal changes of supply chains in the digital process of China’s HCM industry.
This study aims to extend existing studies from the following aspects. First, we calculate the direct and embodied carbon emissions of HCM at national and provincial levels, which is important for a comprehensive understanding of the sector-level carbon implications of HCM. Second, based on the input–output analysis approaches, we can not only assess the carbon emissions generated in the digital transformation process of HCM but also clarify its transfer path. Third, we compare the emissions generated and reduced by the HCM digitization process, which is crucial for understanding whether the digital process of HCM at this stage will help reduce emissions. Fourth, we supplement the existing research with empirical evidence from China, which is currently under pressure to implement strict environmental policies and faces downward pressure on economic development. The empirical results of this study will be helpful for Chinese policymakers to formulate HCM policies for the coordinated development of digitization and decarbonization.

3. Measure and Analysis of HCM Carbon Emissions

Three scopes are widely used in carbon emission measurement [5]. Scope 1 accounts for all CO2 emissions generated by energy consumption, the production of goods and services, and household consumption within a country/region boundary. Scope 2 accounts for emissions that relate to the electricity/heat consumed within the boundary of a country or region [36]. Scope 3 emissions include all indirect emissions associated with the production of the final consumption of a country/region [37].

3.1. Measure of Direct Carbon Emissions

Based on the sectoral approach of IPCC [38] and Guan et al. [39], we define all carbon emissions in Scope 1 and Scope 2 as direct carbon emissions, which mainly include two parts: energy-related emissions and process-related emissions:
C a r b o n direct , j = C a r b o n energy , j + C a r b o n process , j .
Energy-related emissions are measured as follows:
C a r b o n energy , j = i F E i j × N C V i × C C i × O i j × 44 12 ,
where FEij refers to i fossil fuel consumption in sector j, including 17 fossil fuels; N C V i × C C i × O i j × 44 12 refers to the carbon dioxide emission coefficient of i fossil fuel consumption in sector j; NCVi refers to average low calorific value; CCi refers to carbon content per unit calorific value; Oij refers to oxidation rate; and the detailed values are given in the Appendix A.
In terms of process-related emissions, this study only considers cement production, which accounts for almost 70% of China’s total process-related emissions [40], the formula for which is as follows:
C a r b o n process , j = C P j × C F j ,
where C a r b o n process , j refers to the process-related CO2 emissions from cement production; CPj refers to the cement production; CFj refers to carbon emission factor; and the value is 0.2906 [41].
It should be noted that since the electricity and heat used by all sectors are provided by the “Production and Supply of Electric Power and Heat Power” sector, in order to avoid data deviation caused by double calculation, the emissions of Scope 2 are fully included in this sector. In addition, cement is a nonmetallic mineral product; therefore, process-related emissions from cement production are allocated to the “Non-metal Mineral Products” sector.

3.2. Measure of Embodied Carbon Emission

Scope 3 emissions include emissions associated with the production of final consumption and the sectoral approach of measuring the embodied carbon emissions, which considers the environmental impacts of economic activities from production and consumption perspectives through the input–output model [42]. Therefore, this approach can be cleverly expressed as Scope 3 emissions to a certain extent; the formula is as follows:
X = ( I A ) 1 Y = L Y ,
where X = ( x k ) n × 1 refers to the vector of the sectoral output; A = ( a k j ) n × n refers to the direct consumption coefficient matrix; L = ( I A ) 1 = ( L k j ) n × n refers to the Leontief inverse matrix; Y = ( y k ) n × 1 refers to the final demand vector in input–output tables; and k = j refers to the number of sectors. Then, according to Zhou et al. [35], the embodied CO2 emissions in the final demand of all sectors can be formulated as
C a r b o n embodied = f X = f L Y ,
where f refers to a row vector of direct CO2 emission intensity with elements f j = C a r b o n d i r e c t , j / x j . Then, the embodied CO2 emissions in the final demand of each sector can be formulated as
C a r b o n embodied , j = f L Y ^
where C a r b o n embodied , j refers to a row vector containing the embodied CO2 emissions of each sector, and Y ^ refers to the diagonal matrix of final demand Y .

3.3. Data and Sector Classification

According to the approaches of Section 3.1 and Section 3.2, the original data sources of variables are given (see Table 1 below):
All data used in this paper are from two databases (NBSC and CEADs). NBSC is China’s only official statistical agency, responsible for collecting, compiling, and publishing the country’s data of economic, social, and demographic statistics. CEADs has received support from the Department of International Cooperation of the Ministry of Science and Technology of the People’s Republic of China and the National Natural Science Foundation of China. It is committed to building fine-grained carbon and energy accounting data with a unified multiscale, full-caliber, verifiable, and high spatial accuracy based on data from NBSC. The data from NBSC and CEADs are public, transparent, available from their official website, and widely used to study China’s economic, social, and demographic phenomena by scholars, which ensures the quality and credibility of the data to a certain extent. Furthermore, please note that because of the high cost of obtaining energy data for every economic subject, NBSC adopts different data collection methods for different entities. For institutions and enterprises that have reached a certain scale (e.g., industrial enterprises with annual main business income of CNY 20 million or more), NBSC forces them to submit relevant data regularly, and strictly checks the authenticity and objectivity of the data. For institutions and enterprises that have not reached a certain scale, NBSC uses regular random sample surveys for data collection; therefore, for this part, there may exist data deviation. To alleviate the deviation, NBSC conducts a comprehensive data survey (National Economic Census) including all economic subjects every five years (since 2000; 2004, 2008, 2013, and 2018) and officially revises the historical energy data in the next year; therefore, the partial energy data have been revised four times (in the 2005, 2009, 2014, and 2019 China energy statistical yearbooks). Further, in and after 2013 (Third National Economic Census), NBSC adopted more advanced technology to realize all data upload and collection through an online information system to the national data center directly, to strengthen the transparency and disclosure of the collection process, and to improve the reliability and validity of data. Therefore, we calculate the direct emissions based on the most up to date energy data published after 2019. Meanwhile China’s input–output tables only recorded the data in 2002, 2005, 2007, 2010, 2012, 2015, 2017, 2018, and 2020 and the provincial input–output tables in 2002, 2007, 2012, and 2017; hence, we obtained nine years of embodied emissions at the national scale and four years at the provincial scale. Then, the classification and specification of the sectors in the energy statistical yearbook were consistent with China’s input–output tables, and they were all based on the Industrial Classification for National Economic Activities (GB/T 4754-2017) in China (NBSC, 2017) [45]. Based on the GB/T 4754-2017, for the simplicity of illustration, we classified the sectors in a more aggregated form, with four HCM subsectors (H1–H4), two digital sectors (D1–D2), and thirty-two other sectors (O1–O32) (Table 2). Details of the 38-sector classification are given in Appendix A.

3.4. Carbon Emissions of HCM

Using Equations (1) and (6), we calculated the direct and embodied carbon emissions of China’s HCM sector in 2002, 2005, 2007, 2010, 2012, 2015, 2017, 2018, and 2020. Figure 2 shows the direct and embodied carbon emissions of the HCM sector. The total carbon emissions increased year by year, caused both by an increase in the direct and embodied emissions, but the direct emissions were always much higher than the embodied emissions. From 2002 to 2007, the growth rate of the embodied carbon emissions was higher than the direct carbon emissions, but after 2007, the ratio of embodied carbon emissions to direct carbon emissions showed a trend of continuous decline. This is possibly because, with the transfer of China’s industrial structure to tertiary industry, HCM’s products basically participated in other production activities such as raw materials or intermediate inputs; therefore, the amount needed to meet the final demand was very small. On the other hand, based on the perspective of consumer responsibility, the change in the ratio indicated to some extent that the carbon emissions caused by HCM should be borne by the industries that use HCM’s products. So, relative to the direct carbon emissions of HCM, embodied carbon emissions were not high, and we should pay more attention to direct carbon emissions, rather than embodied carbon emissions. Is this really the case?
We estimated the direct carbon emissions (Figure 3) and embodied carbon emissions (Table 3) of HCM at a more microscopic level (province). For direct carbon emissions, from 2002 to 2017, the emissions of provinces increased; only Beijing decreased, and 12 provinces began to decrease after 2012. The top five provinces in terms of emissions were Hebei, Shandong, Shanxi, Liaoning, and Jiangsu, and the three provinces with the lowest emissions were Hainan, Ningxia, and Qinghai. Surprisingly, except for Hubei and Sichuan, the provinces’ embodied carbon emissions were much higher than their direct carbon emissions since 2007, and the most prominent were Jilin, Inner Mongolia, and Guizhou. In addition, Ningxia and Qinghai had the lowest direct carbon emissions, but their embodied carbon emissions ranked first and sixth in 2012. The mathematical reason for this phenomenon is that the total of the final demand in the provincial input–output table is similar to the total output. And the reason for this is that the provincial input–output table takes the province as an independent economy and has one more item of outward inflow to other provinces than the national input–output table in final demand; that is, considering the economic connection with other provinces, a large part of the final demand in the province is exported to cover the needs of other provinces. The economic reason is that these provinces are rich in mineral resources, and based on resources, they develop the corresponding manufacture well or undertake the transfer of manufacture in developed regions. For Jilin, it is rich in nonmetallic mineral resources, some of which account for half of the total in China; therefore, it has developed a chemical industry cluster worth hundreds of billions and a nonmetallic mineral products cluster to cover domestic demand. For Inner Mongolia, it has one hundred and three minerals ranked among the top ten, among which, forty-seven rank among the top three, and twenty, such as coal, lead, zinc, silver, and rare earth metals, rank first in China; therefore, the nonferrous metals industry is an important advantageous pillar. For Ningxia, it has the world’s largest single set of coal-to-oil projects (Ningdong Energy and Chemical Industry Base) to cover domestic electrical demand, and its per capita thermal power generation ranks first in China. Similarly, Guizhou is rich in coal, nonferrous metals, and nonmetallic minerals. Qinghai is rich in nonmetallic minerals of chemical raw materials. Under the current policy orientation of stimulating domestic economic demand, the provincial carbon emission results showed that when considering the economic activities in different regions of China, the embodied carbon emissions of HCM were not as low as those calculated at the national level but rather high compared with direct carbon emissions. Therefore, when the direct carbon emissions of HCM are concerned, we should also pay attention to embodied carbon emissions.

4. Measure and Analysis of HCM Carbon Emissions in the Digital Process

4.1. Measure of HCM Carbon Emissions in the Digital Process

According to Alcántara and Padilla [47] and Butnar and Llop [48], a subsystem analysis (SA) approach is applied to calculate the carbon emissions produced by HCM subsectors and uncover their interactions with digital subsectors, that is, the carbon emissions generated in the digital process of HCM; the formula is as follows.
According to the classification of sectors in Section 3.3, the basic Leontief model can be expressed as
( A G G A G D A G O A D G A D D A D O A O G A O D A O O ) ( X G X D X O ) + ( Y G Y D Y O ) = ( X G X D X O ) .
According to Formula (4), it can be rewritten as
( A G G A G D A G O A D G A D D A D O A O G A O D A O O ) ( L G G L G D L G O L D G L D D L D O L O G L O D L O O ) ( Y G Y D Y O ) + ( Y G Y D Y O ) = ( X G X D X O ) .
Formula (8) can be rewritten as
( A G G L G G + A G D L D G + A G O L O G ) Y G + ( A G G L G D + A G D L D D + A G O L O D ) Y D + ( A G G L G O + A G D L D O + A G O L O O ) Y O + Y G = X G ( A D G L G G + A D D L D G + A D O L O G ) Y G + ( A D G L G D + A D D L D D + A D O L O D ) Y D + ( A D G L G O + A D D L D O + A D O L O O ) Y O + Y D = X D ( A O G L G G + A O D L D G + A O O L O G ) Y G + ( A O G L G D + A O D L D D + A O O L O D ) Y D + ( A O G L G O + A O D L D O + A O O L O O ) Y O + Y O = X O .
The three equations in Formula (9) give us the production of the HCM, Digital, and Other subsectors. The first equation, showing the total production of the HCM subsectors, can be divided into three parts. The summand ( A G G L G G + A G D L D G + A G O L O G ) Y G + Y G shows the production that is needed to cover the intermediate and final demand of the HCM subsectors themselves. The term ( A G G L G D + A G D L D D + A G O L O D ) Y D shows the production required to cover the final demand of the digital sectors. The term ( A G G L G O + A G D L D O + A G O L O O ) Y O shows the production required to cover the final demand of other sectors. The second and third equations are interpreted similarly.
By using vectors f G ,   f D ,   f O , which contain the CO2 emission coefficients (measured by CO2 emissions per unit sectoral output) of the HCM, Digital, and Other subsectors, respectively, we transform Formula (9) into an emission model. Thus, the carbon emissions embodied in all sectors’ production to cover the final demand of the digital process in the HCM sectors are as follows:
E x C = f D ( A D G L G G + A D D L D G + A D O L O G ) Y G I n C = f G A G D L D G Y G .
The term f D ( A D G L G G + A D D L D G + A D O L O G ) Y G shows the emissions embodied in the production of digital sectors required to cover the final demand of HCM sectors; we can define it as external-embodied carbon emissions from the digital demand of the HCM sectors (ExC). The term f G A G D L D G Y G shows the emissions embodied in the production of the HCM sectors required to cover the final demand of the HCM sectors that involve digital sectors and can be defined as internal-embodied carbon emissions from the digital demand of the HCM sectors (InC). These two components (ExC + InC) make up the embodied carbon emissions generated by the demand for digitization in the HCM sectors.
Figure 4 shows the embodied carbon emissions from the digital process of HCM at the national level. From 2002 to 2020, the ratio of emissions from the digitization of HCM in the total embodied emissions was very small (less than 1%); thus, the digital process of HCM generated fewer emissions compared with the whole production. And the InC was higher than the ExC; the mathematical reason for this is that the direct carbon emissions generated by the HCM sectors were much higher than the digital sectors, making fG higher than fD. The economic explanation is that the emissions generated from the direct demand of the digital sectors caused by the digitization of HCM were smaller than those caused by the carbon-intensive intermediate inputs that the digital sectors required from the HCM sectors due to the HCM digital demand. Similarly, Table 3 and Table 4 show that, at the provincial level, the emissions were also much lower than the total emissions.
Then, after estimating the carbon emissions generated in the digital process of HCM, we return to the issue addressed in the introduction: at this stage, does the digital process of HCM increase or reduce carbon emissions? To answer this question, we also need to know the mechanism and quantity of carbon emissions reduction during the process. However, at present, China does not officially count and report the specific reduction in emissions after digitization at enterprise, industry, or even national levels. In this regard, the White Paper on Digital Carbon Neutrality released by the China Academy of Information and Communications Technology (CAICT) points out the following: After analyzing and quantifying the carbon emission structure of each link of industry, digital technology mainly empowers HCM energy conservation and emission reduction through two main mechanisms: first, the digital technology application of HCM can optimize product design and process flow, e.g., for Chemical-related Manufacturing (H2); based on digital technology, the chemical reaction process can be simulated online, greatly reducing the offline experiment process and accelerating the development of low-carbon products and processes. Second, the digital technology application of HCM can reduce the energy consumption of production and improve the comprehensive management of energy in the full process, e.g., for the Iron and steel industry (H4), based on digital technology, the main processes such as ironmaking, steelmaking, and steel rolling can realize intelligent closed-loop control, thereby reducing the excess energy consumption caused by unreasonable production operations, and enterprises can establish a system including the real-time docking of production and sales to achieve cross-process scheduling optimization, equipment safe operation, and whole-process energy forecasting and scheduling, so as to improve energy utilization efficiency, thus reducing carbon emissions. It can be seen that the emissions reduced by the digital technology application of HCM are mainly in scope 1 (direct carbon emissions), and the two parts account for approximately 70% of the carbon emission reduction from HCM digitization. Meanwhile, according to appendix II of the White Paper on Digital Carbon Neutrality, the carbon reduction ratio of digital technology enabling HCM is roughly 13–22% [49]. Therefore, based on Section 3.1, we can estimate the emission reduction in the digital process of HCM and then answer the question. Table 5 shows that, at the national level, the digital process of HCM has resulted in a far greater reduction in carbon emissions than it has generated. Table 6 shows the provincial results that are consistent with the national conclusion except for Beijing. Therefore, the digital process of HCM can indeed help to reduce carbon emissions at this stage. However, it is worth noting that in 16 provinces, the amount of emission reductions showed a trend of first increasing (2002–2012) and then decreasing (2012–2017). This shows that considering the carbon emissions generated by the final demand for HCM products from the intermediate inputs of other sectors between provinces, the digitization of equipment and systems at the initial stage of digital transformation can effectively reduce the direct carbon emissions of HCM. But in the future, with the development of digitization, the increase in carbon emissions from the direct demand for the digital sectors and the corresponding demand for carbon-intensive intermediate inputs generated by the digital sectors has the potential to offset the emission reductions in HCM from the application of digital technologies. Therefore, we still need to be vigilant about the carbon emissions generated by the digital process of HCM.

4.2. Analysis of HCM Carbon Emissions in Digital Process

Since 2000, the digitization progress of HCM has undergone two stages, and the carbon emissions generated in this process have also shown significant temporal changes (Figure 4). In the first stage (2002–2012), the emergence of digital technology in business stimulated the exploration of its application in all industries, including HCM, in a short period of time (2002–2005), leading to an increase in HCM’s demand for digital sector products, which led to a transient increase in emissions. However, in this stage, digital sectors were still in development, and corresponding digital technology and digital products were not mature, which made it difficult to support the development of HCM; therefore, HCM reduced the product demand for digital sectors (2005–2012), the emissions of HCM in the digital process were also reduced, and the progress of HCM digitization slowed down. In the second stage (2012–2020), after 10 years of development, the corresponding technologies and products of the digital sectors were mature and could be well embedded in the production and sales process of HCM. Meanwhile, in 2015, the Chinese government raised digital development to a national strategy, proposed the Made in China 2025 strategy, and put forward a clear development direction and goals for HCM digitization. Under the dual stimulation of the advantage of digital technology on HCM production and government orientation, the digital progress in HCM was accelerated, the demand of HCM for the digital sectors increased significantly [50], and the carbon emissions generated by this process also increased. Similarly, due to the influence of the digital sector development and government policy, the emissions of HCM’s digital process in provinces showed a two-stage temporal change (Table 4); the emissions in the second stage (2012–2017) were obviously larger than first stage (2002–2012), and with the development of HCM’s digital process, they showed an increasing trend.
According to the previous paragraph, the development of digital sectors and their technical products determines the HCM industry’s digitization progress and its emissions. And the development of digital sectors and their technical products are closely related to the level of regional economic growth [51]; therefore, we evaluated the emissions of four main districts to study the regional differences (Table 7), according to the regional classification criteria for socioeconomic development produced by the NBSC. Before 2015, the emissions in the east were much higher than in other districts because of its relative developed economy and advanced digital technology, and the number of emissions along the east→northeast→central→west decreased. After 2015, due to the Made in China 2025 strategy and government support in regions with relatively low economic development, some provinces in the west (Guizhou and Chongqing) and northeast (Heilongjiang and Liaoning) districts realized the rapid development of digitalization progress, to accelerate the digital transformation of HCM, causing more emissions than the east and central districts in 2017 [52]. Furthermore, the geographical resource endowment and the industrial scale and structure are also important factors that caused the emissions difference in the HCM digitization process in provinces (Table 4). HCM is a resource-dependent industry, and the provinces with rich resource endowments often have a greater scale of HCM, e.g., Hebei is rich in ferrous metal resources and is the largest steel production province in China, and the scale of H4 is large. When it started digitization, it needed more products from the digital sectors, causing more emissions. Similarly, Guizhou is rich in coal and mercury; therefore, the scales of H2 and H4 were large. On the contrary, Hubei’s resource endowment is relatively unremarkable so the scale of the HCM industry was not large. Also, due to the slow development of the economy and population, the scale of HCM in Qinghai was not large.
Further, we observed the supply chains and crucial paths of carbon emissions generated by the digital process of HCM. To reveal the mechanism of how carbon emissions are transferred along supply chains that are from digital sectors to HCM sectors, a structural path analysis (SPA) approach was used. Using the Taylor series approximation to expand the Leontief inverse [53], the embodied carbon emissions of sectors in Equation (6) can be rewritten as a summand of different emission layers:
C a r b o n e m b o d i e d , j = f I Y ^ + f A Y ^ + f A 2 Y ^ + f A 3 Y ^ + f A 4 Y ^ + ,
where f A t Y ^ represents the contribution of CO2 emissions from the t th sectoral production tier. For instance, assuming the case where Y ^ is the final demand of the Processing of Petroleum, Coal, and Other Fuels (H1), f I Y ^ is the direct CO2 emissions generated by the H1 enterprises (e.g., from fossil fuel combustion) in the process of gasoline, tar, coke, and other products for consumption in other industries (Tier 0). To produce these products, enterprises need to purchase crude oil, raw coal, etc., ( A Y ^ ) from their upstream suppliers, and these suppliers emit f A Y ^ CO2 in the processes of obtaining the raw materials (Tier 1). In turn, the Mining and Washing of Coal and the Extraction of Petroleum and Natural Gas (O2, O3) suppliers also need to purchase machines to dig these materials ( A 2 Y ^ ), e.g., excavators, well drills, and trunks, and thus, f A 2 Y ^ CO2 emissions are released in the production of the machines (Tier 2), and so on and so forth; hence, the process continues similarly for all production tiers. Similarly, the CO2 emissions are generated from primary suppliers (digital sectors) and accumulated through intermediate supply chain tiers (all sectors) due to the final demand of HCM; therefore, the total emissions from digital sectors to HCM equal the following:
C a r b o n e m b o d i e d , j D i g i t a l   t o   H C M = f D A D G Y G + f D A D G 2 Y G + f D A D G 3 Y G + f D A D G 4 Y G + .
Further, the nodes (sectors) in successive production tiers constitute a complete supply chain or carbon transfer path [54,55]. For example, f k a k m a m n a n j Y ^ j is a third-tier path, which denotes the emission path k m n j . In general, there are n paths in the zeroth tier, n × n paths in the first tier, and ( n × n ) 2 paths in the second tier, and the number of paths increases exponentially with each tier. Therefore, crucial emission paths can be identified by calculating the carbon emissions associated with each supply chain. According to this, the carbon emissions of the supply chain tiers and transfer paths generated from the digital sectors to fill the demand of HCM can be calculated. The specific calculation process is as follows: first, we calculate the emissions of each supply chain (Tier 1 to Tier 5 ), based on Formula (12); second, in each supply chain, we calculate the emissions of each transfer path, e.g., for Tier 1, there only exists one carbon transfer path f D a D G Y G ; for Tier 2, there exist thirty-eight carbon transfer paths f D a D n a n G Y G due to n = 38 in this paper; third, after calculating the emissions of all paths, we choose the path with the top five emissions as the crucial path.
Table 8 shows the change in the embodied carbon emissions in supply chains from 2002 to 2020. The emissions in high supply chain tiers (Tier 3, 4, 5 ) increased in all HCM sectors, and the fastest growth was in Tier 5 , while the emissions in Tier 1 declined. For the emissions of Tier 2, except for the Manufacture of Nonmetallic Mineral Products (H3), other HCM sectors increased. Specific to HCM subsectors, the emissions generated in the digital process of Chemical-related Manufacturing (H2) were much higher than those of the other three sectors in 2002 and 2020. In addition, the emissions generated in the digital process of Processing of Petroleum, Coal, and Other Fuels (H1) in all tiers ranked last, but the change rates were the highest. For the emission changes in the tiers, the emissions generated in the digital sectors caused by the direct demand of HCM digitization gradually decreased, which was inseparable from the efforts made by the digital sectors (especially D2) to reduce their own carbon emissions. And the emissions generated through the high supply-chain tiers from the digital sectors to HCM digitization increased, a result consistent with Zhou et al. [35]. This reveals that, when only considering the direct connection between the HCM and digital sectors, the emissions generated in the digital process of HCM gradually decreased, but considering the high supply chain tiers, emissions increased. The emissions difference of the HCM subsectors showed that the digital demand and development scale of H2 was much larger than the other three subsectors, and the digital process of H1 has the potential for rapid emission growth.
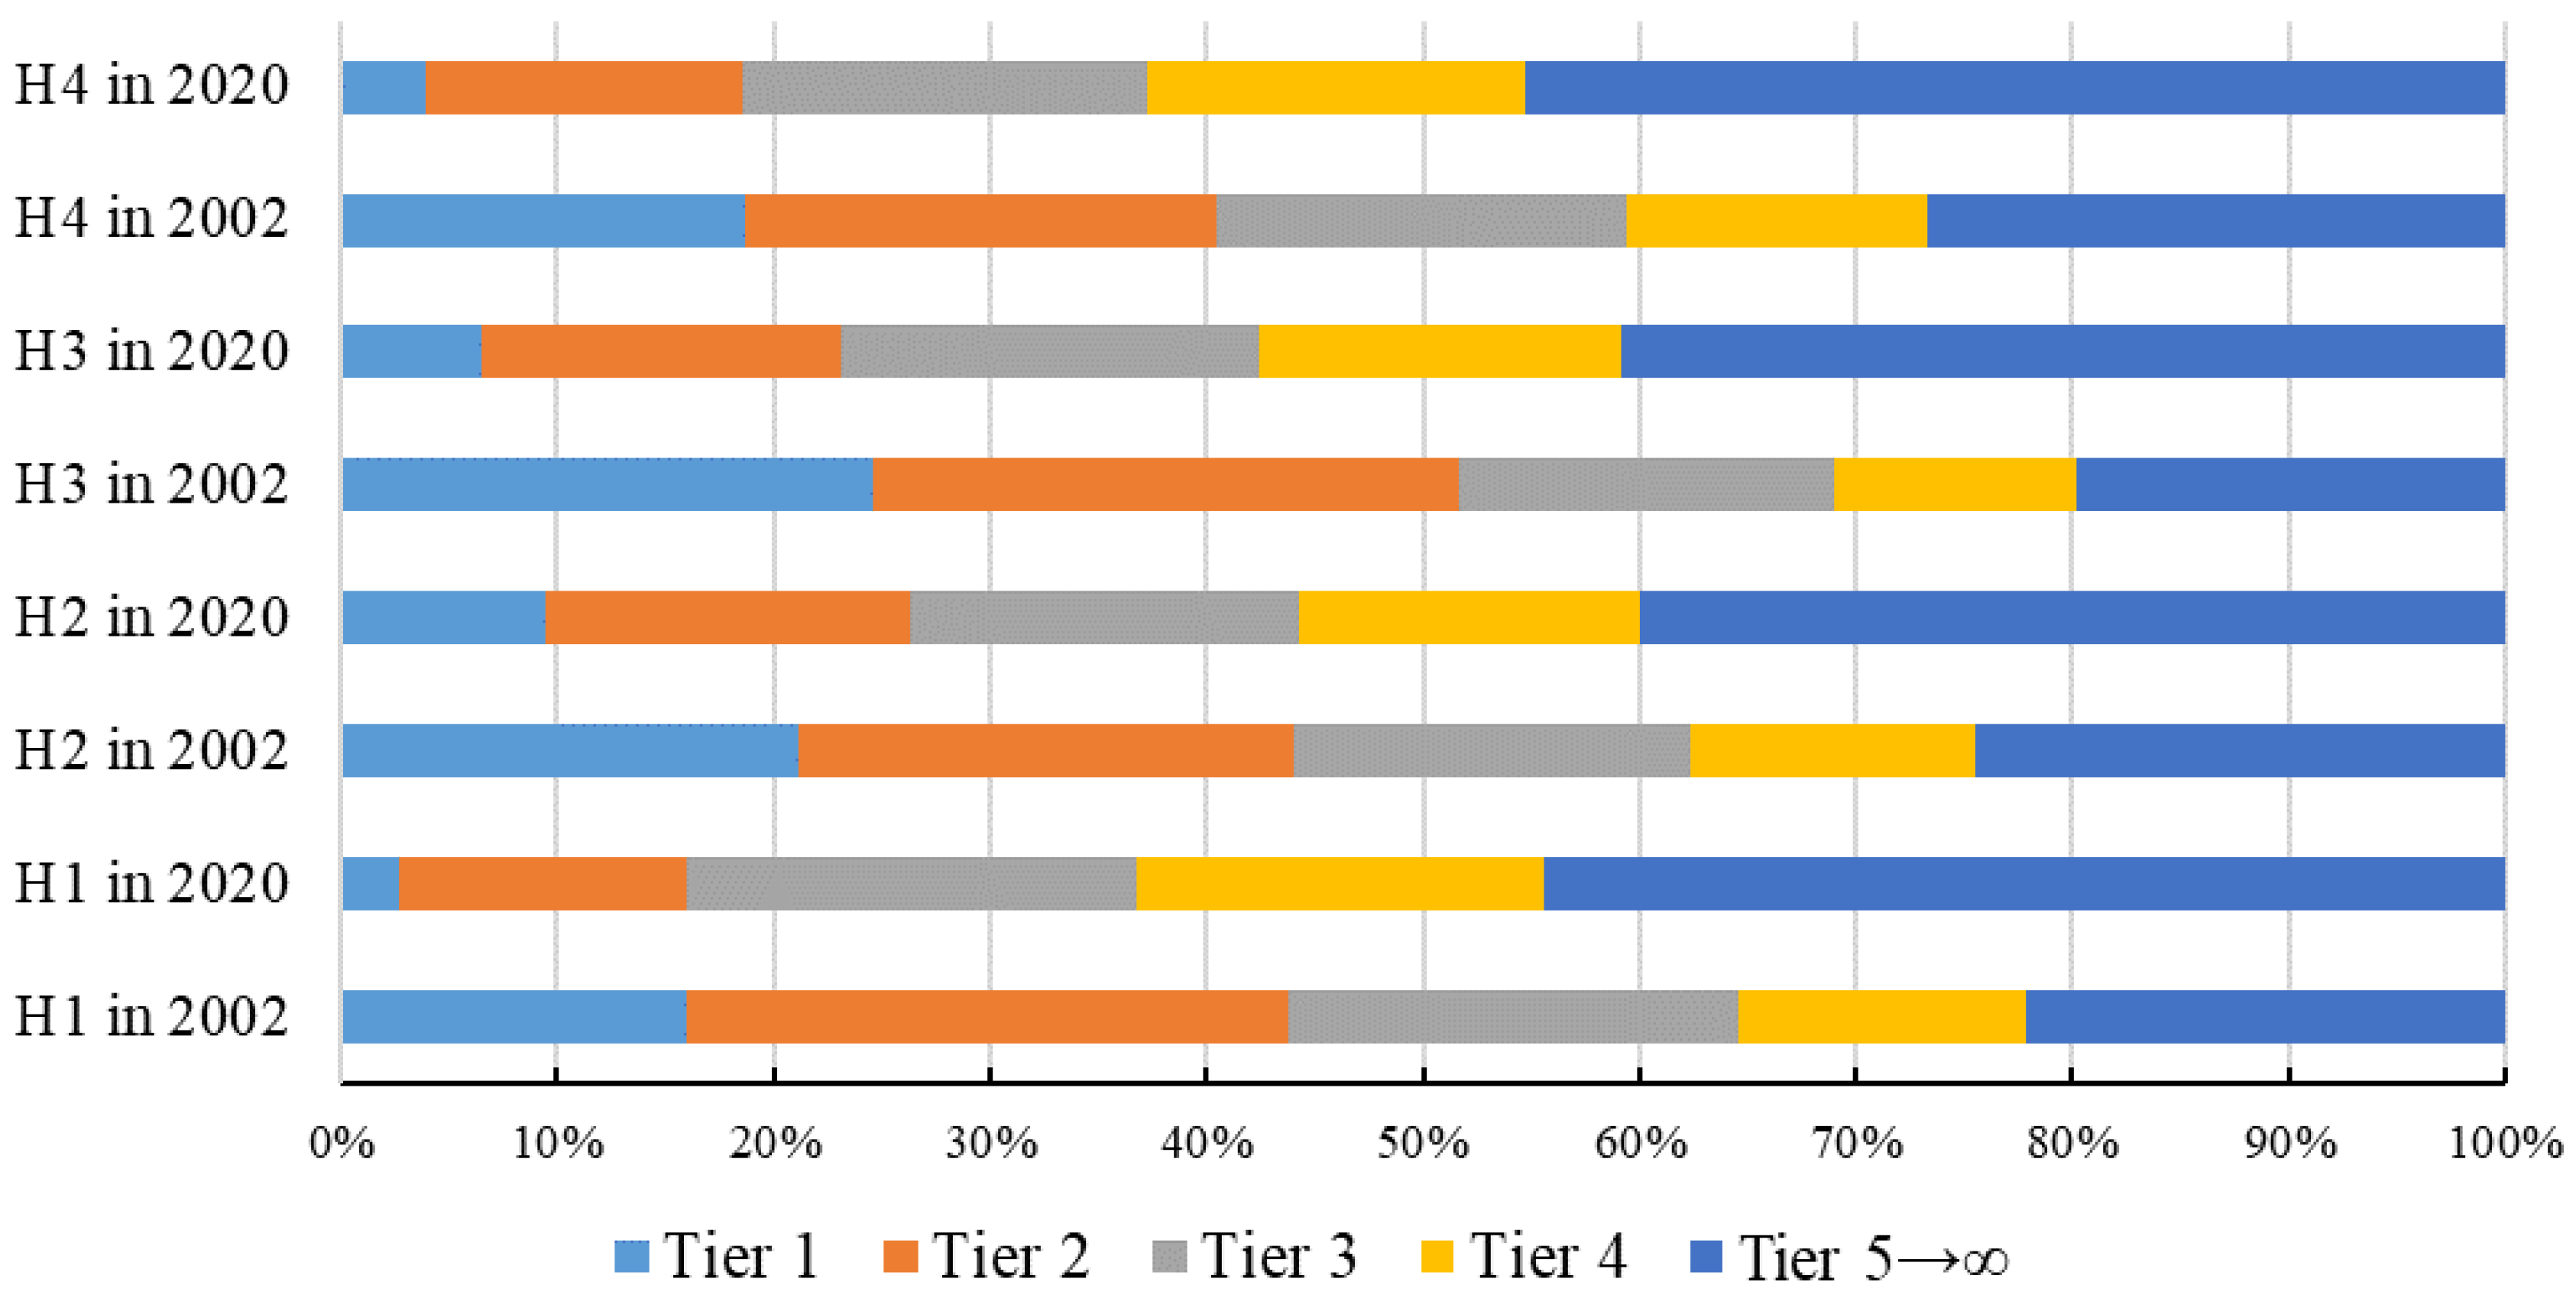
Figure 5 shows the distribution features of the carbon transfer paths by the digital supply chain tiers of HCM. As Figure 5 depicts, in the digital process of HCM sectors, the proportion of emissions generated by Tiers 1 and 2 decreased, and the decrease rate of Tier 1 was more than 10%. The proportion of emissions generated by Tiers 4 and 5 increased, the increase rate of Tier 5 was about 20%, and the proportion of Tier 3 did not change much. At the same time, for H2 and H4, the proportion of emissions generated by Tier 5 was the highest; while for H1 and H3, the highest proportion of the emissions changed from Tier 2 in 2002 to Tier 5 in 2020. The above findings indicate that with the development of HCM digitization, its emissions were gradually transferred from a direct connection between the HCM and digital sectors to the high supply-chain tiers. In addition, considering the influence of the Made in China 2025 strategy in promoting HCM digitalization in 2015, we also estimate the data for 2015 (see Appendix A), which further strengthens the conclusion of this trend. Further, we observe the crucial carbon emission transfer paths of China’s HCM digitization to identify the key related sectors.
The digital process of HCM involves two digital sectors, digital infrastructure (hardware equipment manufacturing, D1) and digital system (information technology software system construction, D2); therefore, the critical carbon emission transfer path runs from these two digital sectors to the four HCM sectors, and it can be divided into eight subpaths. These paths start from the digital production process, then proceed to the intermediate consumption of inputs, and eventually to cover the final demand of HCM. We focus primarily on the first four tier supply chains (from Tier 0 to Tier 4), and Table 8 lists the top five ranking transfer paths in 2002 and 2020.
As can be seen in Table 9, from 2002 to 2020, while the change in the total contribution of the top five crucial paths to the digital process of HCM showed a clear downward trend, the two digital sectors showed the opposite trend in terms of the quantitative change in emissions. The emissions of the top five crucial paths from the D1 to HCM subsectors showed an increasing trend, while the emissions from the D2 to HCM subsectors showed a decreasing trend. The explanation for this result is that for equipment digitization, enterprises’ improvement of digital construction and the updating of digital machinery increase the demand for D1, thus requiring the overall replacement of equipment or the installation of new devices, which leads to continuous production throughout the supply chain, thereby increasing emissions. For software system digitization, one needs to install electronic equipment to embed the software system during the initial installation, and then there is only the need for a software system-based update or maintenance, which generally does not generate extra production; therefore, emissions decrease to a certain range that only includes data transfer and storage, system operation, and updates.
Specifically, for the Processing of Petroleum, Coal, and Other Fuels (H1), the existing paths are Digital→Extraction of Petroleum and Natural Gas (O3)→H1, D1→Manufacture of Measuring Instruments and Machinery (O15)→O3→H1, D2→O23→O3→H1, and D2→Transport, Storage, and Post (O21)→H1. It is worth noting that in the field of equipment digitization, H1 strengthens the direct connection with O12 and O15 over time, which are also the key support sectors for intelligent manufacturing. In the field of system digitization, O21 and O23 are the key related sectors. For Chemical-related Manufacturing (H2), its crucial paths do not change significantly over time. The existing paths are Digital→H2→H2, D1→D1→H2, D1→Leasing and Commercial Services (O25)→H2, and D2→O23→H2. For the Manufacture of Nonmetallic Mineral Products (H3), the existing paths are D1→D1→H3, D1→O25→H3, D2→O23→H3, and D2→H3→H3. It is worth noting that in the field of equipment digitization, H3 also strengthens the direct connection with O12, and in the field of system digitization, the transfer path has changed from the Mining and Processing of Nonmetal and Other Ores (O5) and Wholesale and Retail Trades, Hotels, and Catering Services (O22) to O21. For the Smelting and Pressing of Metals (H4), the existing paths are D1→D1→H4, D1→O12→H4 and D2→O23→H4. It is worth noting that in the field of equipment digitization, the transfer path has changed from O22 to Other Manufacture (O16), and in the field of system digitization, the transfer path has changed from O22 to the Mining and Processing of Metal Ores (O4), the Production and Supply of Electric Power and Heat Power (O17), and O21. In summary, the crucial path that has always existed is Digital→HCM, and the emissions are mainly transferred within the digital sectors and HCM subsectors. From HCM equipment digitization, the existing path is D1→D1→HCM, and another crucial emission transfer path is through O12 due to the fact that the product of O12 is necessary in the digital process, and emissions in this path increase over time. From software system digitization, the existing path is D2→Finance and Insurance (O23)→HCM; the explanation for this path is that the initial development of digital sectors needs the support of O23, and the software system as the core of HCM digitization is an important property for HCM; therefore, it is necessary to ensure. In addition, another crucial emission transfer path is through O21 due to the data storage demand of HCM digitization, and emissions in this path are increasing over time. Also, considering that only observing the crucial transfer path changes of 2002 and 2020 may not fully reflect this trend, we supplemented the intermediate representative year (the government officially implemented Made in China 2025 in 2015) to verify the results (see Appendix A). The results showed that the crucial transfer path changes in the key sector began in 2015 (O12 in equipment digitization and O21 in software system digitization), and the emissions from both paths increased over time.
As relatively independent regions in China, the digital process of HCM in each province presents differences due to differences in geographical resource endowment, regional policies, industrial scale and structure, and digital technology development, which further leads to differences in the carbon emissions generated in the process (Table 4 and Table 7). Therefore, we intend to explore whether the emissions difference caused by these factors are represented in the supply chain tiers and transfer paths, so as to select the three provinces (Guizhou, Shandong, and Guangxi) that ranked first, fifteenth, and thirtieth among the carbon emissions of provincial HCM digitization in 2017 to explore the regional heterogeneity. Table 10 shows the provincial emissions in different production tier of HCM digitization. For the same tier, the ranking of emissions in three provinces is the same ( G u i z h o u > S h a n d o n g > G u a n g x i ). But the maximum and minimum emissions are in different tiers for three provinces: for Shandong, the maximum emissions are in Tier 5 and the minimum emissions are in Tier 1. For Guangxi, the maximum emissions are in Tier 1 and the minimum emissions are in Tier 4. For Guizhou, the minimum emissions are in Tier 4, the maximum emissions of H1 and H2 are in Tier 1, and H3 and H4 are in Tier 2. In H1, there is a 10-fold emissions difference in each tier between Guizhou and Guangxi, and Shandong and Guangxi; in H2, there is a 10-fold emissions difference in each tier between Guizhou and Shandong, and Shandong and Guangxi; in H3, the emission difference between Guizhou and Guangxi and Shandong and Guangxi are increasing gradually from Tier 1 to Tier 5 , and the minimum emission difference is between Shandong and Guangxi, while the increasing rate of emission difference is maximum; in H4, the proportion of Shandong emissions in Tier 5 is close to 50%, while the proportion of Guangxi and Guizhou emissions in Tiers 1 and 2 all exceed 50%, and the proportion of emissions in Tier 1 and Tier 2 are different between Guangxi and Guizhou. In summary, the emissions of Shandong are increasing gradually from the low supply tier to the high supply tier, but those in Guangxi and Guizhou are decreasing. The explanation for this is that the digital process of HCM cannot be separated from the development of the digital sectors. According to the White Paper on Development and Employment of China’s Digital Economy, in 2017, Shandong ranked third in the total digital economy of Chinese provinces. The development of digital sectors and industrial digitization in Shandong have a higher degree than the other two provinces (CAICT, 2018). When the degree of industrial digitization is low, the emissions generated by digitalization are concentrated in Tier 1; then, with the development of digitization, more emissions are transferred to Tier 5 , which is consistent with the result in Table 7. In addition, the subsectors with the maximum emissions from the HCM digitization of Guizhou are H2 and H4, Shandong is H2, and Guangxi is H4. The provincial differences in emissions in the subsectors are mainly caused by the differences in mineral resources within the regions.
After understanding that the emissions generated from HCM digitization in different provinces varied significantly in different supply chain tiers, we observed the crucial paths of HCM subsectors in different provinces. Table 11 shows the top five ranking carbon emission paths of H1 digitization in three provinces. From D1 to H1, the same path is D1→O21→H1; in this path, the emissions of Shandong were maximum, the contribution was minimum, and the emissions and contribution of Guizhou were the opposite of Shandong. The differences in the provincial emission transfer paths were that Guizhou transferred through the Mining and Washing of Coal (O2), Shandong transferred through the Manufacture of Measuring Instruments and Machinery (O15), and Guangxi the Extraction of Petroleum and Natural Gas (O3) and the Production and Supply of Gas (O18). From D2 to H1, the same paths were D2→H1 (ranked first) and D2→H1→H1; for D2→H1, the emissions of Guangxi were minimal, but the contribution was maximal. The differences in the provincial emission transfer paths were that Guizhou transferred through O2, Shandong through the Extraction of Petroleum and Natural Gas (O3), and Guangxi through the Mining and Processing of Nonmetal and Other Ores (O5). The possible reason for this result is that Guizhou, known as the “Jiangnan Coal Sea”, is the province with the most abundant coal resources in southern China. Relative to Guizhou and Shandong, Guangxi is a coastal province, near the South China Sea, which is rich in undersea oil and gas. Shandong is rich in oil resources, and the relevant sectors were established earlier; so, when H1 started the digital process, it needed to replace or improve old equipment.
Table 12 shows the top five ranking carbon emission paths of H2 digitization in three provinces; from D1 to H2, the same paths were D1→H2 (ranked first), D1→D1→H2, and D1→H2→H2 (ranked fifth). In addition, Guizhou and Guangxi had the same unique path (D1→O21→H2), and Guizhou and Shandong had the same unique path (D1→H2→H2→H2). The difference in the provincial emission transfer path was that Guangxi transferred through O18. For D1→H2, the emissions of Shandong were at a maximum, but the contribution was minimal. From D2 to H2, the paths of Shandong and Guangxi were exactly the same, while the first four paths of Guizhou were the same as those of the two provinces, and there was a unique path (D2→O5→H2). For D2→H2, the emissions of Guangxi were minimal, but the contribution was maximal. In H2, there was little difference in the crucial emission transfer paths in the digital process of the three provinces, mainly between the digital sectors and H2, but there were still provincial differences in emissions generated in the same path.
Table 13 shows the top five ranking carbon emission paths of H3 digitization in three provinces; from D1 to H3, the same path was D1→H3. In addition, Guizhou and Guangxi had the same unique path (D1→O21→H3, D1→O5→H3, D1→O18→H3). The differences of provincial emission transfer path were that Guizhou transferred through O2, and the other four paths in Shandong were all related to O12. From D2 to H3, the same paths were D2→H3, D2→D2→H3, and D2→H3→H3 and Guizhou and Guangxi had the same unique path (D2→O5→H3); the differences in the provincial emission transfer path were that Guizhou transferred through O2, and Guangxi through H2. For D2→H3, the emissions of Guangxi were minimal, but the contribution was at a maximum. In H3, the path difference between Guangxi and Guizhou was small, while the path difference in Shandong was mainly in the digital process of hardware equipment (From D1 to H3).
Table 14 shows the top five ranking carbon emission paths of H4 digitization in three provinces; from D1 to H4, the three provinces did not have the same path, while Guizhou and Guangxi had the same unique path (D1→H4, D1→O16→H4, and D1→O18→H4), and Shandong and Guangxi had the same unique path (D1→O4→H4). The differences in the provincial emission transfer path were that Guizhou transferred through O2 and O21, and the path in Shandong was all related to O4. From D2 to H4, the same paths were D2→H4 and D2→H4→H4, Guizhou and Guangxi had the same unique path (D2→O4→H4), and Shandong and Guangxi had the same unique path (D2→D2→H4). The difference in the provincial emission transfer path was that Guizhou transferred through O18. For D2→H4, the emissions of Guangxi were minimal, but the contribution was maximal. In H4, in terms of the top five ranking crucial paths, Guangxi (80%) and Guizhou (90%) were mainly in Tier 1 and 2, with Shandong in Tier 3 (60%).
To sum up, the differences between the three provinces in industrial structure, mineral endowment, level of digital development, and policies has led to differences in supply chain tiers and crucial paths of emissions generated by HCM digitization. Specifically, when the degree of industrial digitization is low (Guangxi and Guizhou), the emissions generated by digitalization are concentrated in Tier 1, and with strengthening industrial digitization (Shandong), more emissions are transferred to Tier 5 . Meanwhile, the provincial differences are also reflected in the different subsectors with the most emissions from digital process. Guizhou is H2 and H4, Shandong is H2, and Guangxi is H4. The main reason is the differences in mineral resources, sectoral development scale, and policy orientation in different provinces. For example, Guizhou is rich in coal, leading to the crucial transfer path of emissions mainly through O2; Shandong is rich in oil and developing industrial digitization well, leading to the crucial transfer path of emissions mainly through O3 and O12; and Guangxi is rich in submarine natural gas, leading to the crucial transfer path of emission mainly through O18. In addition, it is worth noting that at least one-third of the crucial paths are between the HCM and digital sectors, especially in H2; and, because H3 and H4 are extremely dependent on the upstream-related material mining industries, the three provinces in the crucial transfer path of these two sectors also have O5 and O4, respectively.

5. Conclusions

A comprehensive understanding of the impact of the digital process of HCM on carbon emissions is of great significance for the formulation of collaborative development strategies of the digitalization and greening of HCM. More scholars have empirically tested the impact of HCM digitization on its direct carbon emissions. However, few studies have analyzed the embodied carbon emission impacts and their potential mechanisms in the digital process of HCM. In this paper, we study embodied carbon emissions from the HCM digital process itself by integrating input–output analysis approaches. Through the approaches, we obtain a complete picture of embodied carbon emissions generated in the digital process of HCM, manifesting not only the embodied carbon impacts of HCM digitization but also the mechanisms of how upstream production sectors, supply chains, affect the HCM embodied emissions.
The empirical results from China’s HCM show the following: (1) The total carbon emissions of HCM have been increasing, and the growth of direct carbon emissions is much higher than the embodied carbon emissions. However, when considering the flow of the final demand for HCM products due to regional industrial development differences among provinces, the embodied carbon emissions are not as low as calculated at the national level but far higher than the direct carbon emissions. (2) The embodied carbon emissions generated by the digital process of HCM accounted for a small proportion of the total emissions. But from the perspective of quantity, the embodied carbon emissions of provinces show a rapid growth trend over time. (3) Considering the carbon emissions generated by HCM digitization itself, the application of digital technologies can still help reduce carbon emissions. (4) Compared with the data of 2002 and 2020, the supply chain tiers and critical paths of the carbon emissions embodied by the digital process of HCM show significant differences over time. In terms of supply chain tiers, the emissions generated in digital sectors caused by the direct demand of HCM are gradually decreasing, and the emissions generated in the intermediate supply chain tiers from digital sectors to meet the demand of HCM are increasing; that is, the emissions are gradually transferred from low supply-chain tiers to high supply-chain tiers. Additionally, the digital demand and development scale of H2 is much larger than other three subsectors, and the digital process of H1 has potential for rapid emission growth in China’s current stage. In terms of crucial paths, emissions are mainly transferred within the digital sectors and HCM subsectors, and the emissions of the top five crucial paths from equipment digitization (D1 to HCM) show an increasing trend, while the emissions from software digitization (D2 to HCM) show a decreasing trend. And for equipment digitization, HCM is strengthening the direct correlation with the Manufacture of General and Special Purpose Machinery (O12); for software digitization, HCM is strengthening the direct correlation with Transport, Storage, and Post (O21). (5) There are regional differences in the subsectors, supply chain tiers, and crucial paths of carbon emissions generated by HCM digitization. In terms of subsectors, the maximum emissions from the HCM digitization of Guizhou are H2 and H4, Shandong is H2, and Guangxi is H4. In terms of supply chain tiers, the maximum and minimum carbon emissions of the provinces (Guizhou, Shandong, and Guangxi) are in different tiers. For Shandong, the maximum emission is in Tier 5 , and the minimum emission is in Tier 1. For Guangxi, the maximum emission is in Tier 1, and the minimum emission is in Tier 4. For Guizhou, the minimum emission is in Tier 4, the maximum emissions of H1 and H2 are in Tier 1, and H3 and H4 are in Tier 2. Then, the emissions of the provinces in the same tier are also different ( G u i z h o u > S h a n d o n g > G u a n g x i ). In terms of crucial paths, there are obvious regional differences in the emissions and key sectors of paths due to the differences in mineral resources, sector development scale, and policy orientation. Specifically, Guizhou is rich in coal, which leads to the key sector of paths being the Mining and Washing of Coal (O2); Shandong is rich in oil and developing industrial digitization well, which leads to the key sectors of paths being the Extraction of Petroleum and Natural Gas (O3) and the Manufacture of General and Special Purpose Machinery (O12). Guangxi is rich in submarine natural gas, which leads to the key sector of paths being the Production and Supply of Gas (O18).
These results remind us that the digital process of China’s HCM at this stage is conducive to achieving carbon emission reduction in the industry; however, considering the flow of the final demand for HCM products due to regional industrial development differences among provinces, it is also necessary to be vigilant about the growth of embodied carbon emissions generated by HCM digitization, as well as the sectoral and regional emission differences in the supply chain tiers and paths. Specifically, the emissions in the digital process of H2 are much larger than the other three subsectors, and the digital process of H1 has potential for rapid emission growth. Then, with the development of HCM digitization, the emissions of equipment digitization are increasing, and the key sector for transfer paths is O12, while the emissions of software digitization are decreasing, and the key sectors for transfer paths are O21 and O23. For the emissions of Shandong HCM digitization, the maximum supply chain tier is Tier 5 , the maximum sector is H2, and the key sectors for the paths are O3 and O12. For the emissions of Guizhou HCM digitization, the maximum supply chain tiers are Tier 1 and 2, the maximum sectors are H2 and H4, and the key sector for the path is O2. For the emissions of Guangxi HCM digitization, the maximum supply chain tier is Tier 1, the maximum sector is H4, and the key sector for the path is O18.
In summary, we recommend that when developing digital carbon neutrality policies for HCM, the sectoral and provincial differences in the embodied carbon impact should be considered, so as to propose targeted content. The starting point of the recommendations are that when the policy starts to take effect, the emissions reduction effect can be maximized (mainly referring to the number of emissions), which is more conducive to China’s completion of the established emission reduction targets within a limited time. Therefore, specifically, (1) the Chinese government should formulate a digital carbon neutrality policy of H2 firstly due to the large number of emissions generated in digitization, more so than other HCM subsectors. For example, in order to better using digital technology to reduce carbon emissions, the government should promote H2 enterprises to achieve digital management and real-time monitoring of the entire production process, so as to find irrational energy use and reduce energy consumption by proposing specific digital transformation directions and corresponding targets in stages. The government’s attention and support and the improvement and application of digital carbon reduction standards in H2 are important influencing factors for the realization of this proposal. (2) The HCM digital carbon neutrality policy should focus on the emissions transfer within the digital sectors (mainly D1) and HCM, because except for the direct emission generated by digital sectors production due to HCM’s demand, there are more emissions (especially in equipment digital process) caused by the carbon-intensive intermediate inputs that the digital sectors require from the HCM sectors (basic materials, e.g., metal and nonmetal) due to the HCM digital demand. For example, the government can promote the HCM and digital sectors to use low-carbon energy and renewable energy to replace high-carbon energy in the production process; meanwhile, by strengthening the independent innovation capacity of the digital sector, it can guide them to design products that require less carbon-intensive inputs. Energy structure optimization, renewable energy technology development, and the number of core digital technical R&D personnel are important influencing factors for the realization of this proposal. (3) Optimizing the supply chains can reduce the emissions of HCM digitization, because each node (intermediate supply sector) in a supply chain from digital sectors to HCM generate emissions due to production. The more nodes, the more accumulated emissions, and some nodes generate larger emissions than other nodes. For example, HCM can promote the research of low-carbon products and processes through the integration of digital and low-carbon technologies, so as to optimize the raw materials required for production and reduce the supply chain nodes from the digital sectors to HCM. In addition, based on digital technology, the government can implement the carbon management of the whole supply chain including upstream nodes, promote the effective collaboration among supply chain nodes, so as to optimize resource allocation, and reduce the emissions generated by nodes. Low-carbon technology innovation, the number of nodes in the supply chains, financial support from the government, and information sharing are important influencing factors for the realization of this proposal. (4) The HCM digital carbon neutrality policy should consider provincial differences due to the difference in digital development. For provinces that are just beginning to develop HCM digitization (e.g., Gansu and Qinghai), the policies may focus on promoting HCM digitization progress and enhancing the digital degree of design and production, so as to realize the emission reduction effect of digital technology. For provinces with a high degree of HCM digitization (e.g., Shandong, Jiangsu, and Guangdong), the policies may focus on promoting HCM to explore and form a number of replicable digital carbon reduction solutions and innovative applications, so as to lead for the rest of the provinces. In addition, the government should strengthen regional coordination and complement each other’s strengths, giving full play to the advantages of provinces with developed digital technology and economy, cooperating with neighboring provinces, and arranging the integrated development of the HCM industry’s digital and low carbon methods as a whole, e.g., the Beijing–Tianjin–Hebei Region and the Yangtze River Delta. Local economic development, industrial structure, and mineral endowment are important influencing factors for the realization of this proposal. The regional government may focus on the regional advantages of the HCM subsector and mineral endowment and set different digital development and emission reduction targets and plans for different HCM subsectors. Only considering specific factors in provinces can realize the integrated development of digital and low-carbon outcomes in China successfully.

Supplementary Materials

The following supporting information can be downloaded at: https://www.mdpi.com/article/10.3390/su152014785/s1, Table S1: Carbon emissions from digitization of HCM in Chinese four district; Table S2: National emission of each sector; Table S3: provincial direct emission of each sector; Table S4: supply tiers emission.

Author Contributions

Methodology and writing—original draft preparation W.P.; writing—review and conclusion, X.Z.; conceptualization and editing and funding acquisition, Y.L. All authors have read and agreed to the published version of the manuscript.

Funding

This research was funded by the National Social Science Foundation of China, grant number 23BJY055; the Natural Science Foundation of Guangdong Province, grant number 2022A1515010672; and the 2023 Guangzhou Philosophy and Social Science Foundation, grant number 2023GZYB10.

Institutional Review Board Statement

Not applicable.

Informed Consent Statement

Not applicable.

Data Availability Statement

All data that support the findings of this study are included in this manuscript and its Supplementary Files.

Acknowledgments

We are grateful for the useful suggestions and comments received from experts to improve this manuscript.

Conflicts of Interest

The authors declare no conflict of interest.

Appendix A

Table A1. Detail of sector classification.
Subsectors (165)Sectors (65)Sectors in This Study
Processing of Refined Petroleum and Nuclear Fuel ProductsProcessing of Petroleum, Coal, and Other FuelsProcessing of Petroleum, Coal, and Other Fuels
Coking
Processing of Coal Products
Manufacture of Raw Chemical MaterialsManufacture of Raw Chemical Materials and Chemical ProductsManufacture of Chemical-related Products
Manufacture of Fertilizer
Manufacture of Pesticide
Manufacture of Paints, Inks, Pigments, and Similar Products
Manufacture of Synthetic Material
Manufacture of Special Chemical Products, Explosives, Pyrotechnics, and Fireworks Products
Manufacture of Daily Chemical Product
Manufacture of MedicinesManufacture of Medicines
Manufacture of Chemical FibersManufacture of Chemical Fibers
Manufacture of RubberManufacture of Rubber and Plastics Products
Manufacture of Plastics Products
Cement, Lime and PlasterManufacture of Non-metallic Mineral ProductsManufacture of Non-metallic Mineral Products
Gypsum, Cement Products, and Similar Products
Brick, Stone, and Other Building Materials
Glass and Glass Products
Ceramic Products
Refractory Products
Graphite and Other Non-Metallic Mineral Products
Smelting of SteelSmelting and Pressing of Ferrous MetalsSmelting and Pressing of Metals
Pressing of Steel
Smelting of Iron and Ferroalloy
Smelting of Non-ferrous MetalsSmelting and Pressing of Non-ferrous Metals
Pressing of Non-ferrous Metals
Manufacture of ComputersManufacture of Computers, Communication, and Other Electronic EquipmentManufacture of Computers, Communication, and Other Electronic Equipment
Manufacture of Communication
Manufacture of Broadcasting, Television Equipment, Radar, and Supporting Equipment
Manufacture of Audio-Visual Equipment
Manufacture of Electron Component
Manufacture of Other Electronic Equipment
TelecommunicationInformation Transmission, Software, and Information Technology ServicesInformation Transmission, Software, and Information Technology Services
Information Transmission Services
Internet and Related Services
Software Services
Information Technology Services
AgricultureAgriculture, Forestry, Animal Husbandry, and FisheryAgriculture, Forestry, Animal Husbandry, and Fishery
Forestry
Animal Husbandry
Fishery
Agriculture, Forestry, Animal Husbandry, and Fishery Services
Logging and Transport of Wood and Bamboo
Mining and Washing of CoalMining and Washing of CoalMining and Washing of Coal
Extraction of Petroleum and Natural GasExtraction of Petroleum and Natural GasExtraction of Petroleum and Natural Gas
Mining and Processing of Ferrous Metal OresMining and Processing of Ferrous Metal OresMining and Processing of Metal Ores
Mining and Processing of Non-Ferrous Metal OresMining and Processing of Non-Ferrous Metal Ores
Mining and Processing of Nonmetal OresMining and Processing of Nonmetal and Other OresMining and Processing of Nonmetal and Other Ores
Mining of Salt
Professional and Support Activities for Mining
Mining of Other Ores
Processing of Grain Milling ProductsProcessing of Food from Agricultural ProductsManufacture of Food, Beverages, and Tobacco
Processing of Feed Products
Processing of Vegetable Oil Products
Processing of Sugar
Slaughtering and Meat Processing
Processing of Aquatic Products
Processing of Vegetables, Fruits, Nuts, Other Agricultural, and Sideline Food Products
Manufacture of Instant FoodsManufacture of Foods
Manufacture of Dairy Products
Manufacture of Condiments, Fermented Products
Manufacture of Other Foods
Manufacture of Alcohol and LiquorManufacture of Liquor, Beverages, and Refined Tea
Manufacture of Beverages
Manufacture of Refined Tea
Manufacture of Other Beverage
Manufacture of TobaccoManufacture of Tobacco
Manufacture of Cotton, Chemical Fiber Textiles, and Printing Precision ProductsManufacture of TextileManufacture of Textile
Manufacture of Wool Textile and Dyeing and Finishing Products
Manufacture of Hemp, Silk Textiles, and Processed Products
Manufacture of Knitwear, Woven Goods, and Products
Manufacture of Textile
Manufacture of Textile, Wearing Apparel, and AccessoriesManufacture of Textile, Wearing Apparel, and AccessoriesManufacture of Textile, Wearing Apparel, Footwear, Leather, Fur, Feather, and Related Products
Manufacture of Leather, Fur, Feather, and Related ProductsManufacture of Leather, Fur, Feather, and Related Products and Footwear
Manufacture of Footwear
Processing of Timber, Manufacture of Wood, Bamboo, Rattan, Palm and Straw ProductsProcessing of Timber, Manufacture of Wood, Bamboo, Rattan, Palm, and Straw ProductsManufacture of Wood, Bamboo, Rattan, Palm, Straw, and Furniture
Manufacture of FurnitureManufacture of Furniture
Manufacture of Paper and Paper ProductsManufacture of Paper and Paper ProductsManufacture of Paper, Articles for Culture, Education, Entertainment Activities, Printing and Reproduction of Recording Media
Printing and Reproduction of Recording MediaPrinting and Reproduction of Recording Media
Manufacture of ArtworkManufacture of Articles for Culture, Education, Arts and Crafts, Sport, and Entertainment Activities
Manufacturing Of Cultural, Educational, Sports, and Entertainment Products
Manufacture of Metal ProductsManufacture of Metal ProductsManufacture of Metal Products
Boiler and Motor MachineryManufacture of General Purpose MachineryManufacture of General and Special Purpose Machinery
Metalworking Machinery
Materials Handing Machinery
Pumps, Valves, Compressors, and Similar Machinery
Ovens, Fans, Packaging, and Other Machinery
Cultural, Office Machinery
Other Purpose Machinery
Mining, Metallurgy, Construction Special MachineryManufacture of Special Purpose Machinery
Chemical, Wood, Non-Metal Processing Machinery
Special Machinery for Agriculture, Forestry, Animal Husbandry, and Fishing
Medical Machinery and Instruments
Other special Machinery
Manufacture of AutomobilesManufacture of AutomobilesManufacture of Transportation Equipment
Auto Parts and Accessories
Railway Transport and Urban Rail Transit EquipmentManufacture of Railway, Ship, Aerospace, and Other Transport Equipment
Ship and Related Equipment
Other Transport Equipment
Electrical MachineryManufacture of Electrical Machinery and ApparatusManufacture of Electrical Machinery and Apparatus
Transmission, Distribution, and Control Equipment
Wire, Cable, Optical Cable, and Electrical Equipment
Battery
Household Apparatus
Other Electrical Machinery and Apparatus
Manufacture of Measuring Instruments and MachineryManufacture of Measuring Instruments and MachineryManufacture of Measuring Instruments and Machinery
Other ManufacturingOther ManufacturingOther Manufacture
Utilization of Waste ResourcesUtilization of Waste Resources
Repair Service of Metal Products, Machinery, and EquipmentRepair Service of Metal Products, Machinery, and Equipment
Production and Supply of Electric Power and Heat PowerProduction and Supply of Electric Power and Heat PowerProduction and Supply of Electric Power and Heat Power
Production and Supply of GasProduction and Supply of GasProduction and Supply of Gas
Production and Supply of WaterProduction and Supply of WaterProduction and Supply of Water
Residential Building ConstructionConstructionConstruction
Sports Building Construction
Railway, Road, Tunnel, and Bridge Engineering Construction
Other Civil Engineering Building Construction
Construction and Installation
Building Decoration and Other Building Services
Rail Passenger TransportTransport, Storage, and PostTransport, Storage, and Post
Rail Freight Transport and Transport Support Services
Urban Public Transport and Road Passenger Transport
Road Freight Transport and Transport Support Services
Maritime Passenger Transport
Maritime Cargo Transport and Transport Support Services
Air Passenger Transport
Air Cargo Transport and Transport Support Services
Pipeline Transport
Intermodality
Warehousing
Post
Material Handling and Other Transport Services
WholesaleWholesale and Retail Trades, Hotels and Catering ServicesWholesale and Retail Trades, Hotels and Catering Services
Retail Trades
Hotels
Catering Services
Monetary Finance and Other Financial ServicesFinanceFinance and Insurance
Capital Market Services
InsuranceInsurance
Real EstateReal EstateReal Estate
Leasing ServicesLeasing ServicesLeasing and Commercial Services
Commercial ServicesCommercial Services
Tourism
Research and Experimental DevelopmentResearch and Experimental DevelopmentScientific Research and Technology Services
Special Technical ServicesPolytechnical Services
Geologic Perambulation
Science and Technology Extension and Application Services
Water ConservancyWater ConservancyWater Conservancy, Environment, and Public Facility Management
Ecological Protection and Environmental GovernanceEnvironmental Management
Public Facility and Land ManagePublic Facility Management
Resident ServicesResident ServicesResident and Other Services
Other ServicesOther Services
EducationEducationEducation
Press and PublicationPress and PublicationCulture, Sports, and Entertainment
Radio, Television, Film, and AudioRadio, Television, Film, and Audio
Culture and ArtCulture and Art
SportsSports
EntertainmentEntertainment
SanitationSanitationHealth, Social Security, and Social Welfare Services
Social WorkSocial Security and Social Welfare Services
Social Security
Social Welfare
Public Management and Social OrganizationPublic Management and Social OrganizationPublic Management and Social Organization
Table A2. Contributions and distribution of each production tier to carbon emissions embodied in the digitization of China’s HCM sector in 2015.
VariableEmissions (Ten Thousand Tons CO2)Distribution (%)
SectorH1H2H3H4H1H2H3H4
Tier 10.229 2.776 0.737 0.132 7.2511.1614.625.02
Tier 20.533 4.250 0.988 0.448 16.9217.0919.6017.02
Tier 30.613 4.308 0.882 0.492 19.4317.3217.4818.69
Tier 40.508 3.789 0.684 0.420 16.1315.2413.5715.95
Tier 5 1.269 9.742 1.751 1.140 40.2739.1834.7243.32
Total3.152 24.864 5.043 2.632 100.00100.00100.00100.00
Table A3. The top 5 ranking carbon emission paths, starting with digital sectors and ending with HCM final demand in 2015 (unit: Ten thousand tons CO2).
RankEmissionsContributionPathEmissionsContributionPath
From D1 to H1From D2 to H1
10.0474.075D1→H10.1527.571D2→H1
20.0383.341D1→D1→H10.0934.642D2→O23→H1
30.0191.669D1→D1→D1→H10.0613.050D2→O5→O3→H1
40.0191.613D1→O12→H10.0602.991D2→O3→H1
50.0181.546D1→O15→O3→H10.0502.495D2→O21→H1
From D1 to H2From D2 to H2
10.5735.981D1→H22.80318.957D2→H2
20.3323.470D1→O25→H20.9696.551D2→H2→H2
30.2332.432D1→O26→H20.4623.123D2→O23→H2
40.1061.111D1→D1→H20.2962.003D2→O21→H2
50.0920.962D1→H2→H20.2791.886D2→H2→H2→H2
From D1 to H3From D2 to H3
10.1288.138D1→O12→H30.71619.537D2→H3
20.0744.705D1→D1→O12→H30.1474.010D2→H3→H3
30.0613.877D1→O25→H30.1343.664D2→O23→H3
40.0322.030D1→H30.1022.786D2→D21→H3
50.0221.431D1→O26→H30.0952.597D2→D2→H3
From D1 to H4From D2 to H4
10.0503.905D1→O12→H40.20611.117D2→H4
20.0241.874D1→D1→O12→H40.1266.787D2→O23→H4
30.0181.375D1→O12→O4→H40.0924.949D2→O4→H4
40.0161.278D1→O12→H4→H40.0542.937D2→H4→H4
50.0120.961D1→H40.0442.368D2→O17→H4

References

  1. Elahi, E.; Khalid, Z.; Zhang, Z. Understanding farmers’ intention and willingness to install renewable energy technology: A solution to reduce the environmental emissions of agriculture. Appl. Energy 2022, 309, 118459. [Google Scholar] [CrossRef]
  2. Abbas, A.; Waseem, M.; Ahmad, R.; Khan, K.A.; Zhao, C.; Zhu, J. Sensitivity analysis of greenhouse gas emissions at farm level: Case study of grain and cash crops. Environ. Sci. Pollut. Res. 2022, 29, 82559–82573. [Google Scholar] [CrossRef] [PubMed]
  3. Elahi, E.; Khalid, Z.; Tauni, M.Z.; Zhang, H.; Lirong, X. Extreme weather events risk to crop-production and the adaptation of innovative management strategies to mitigate the risk: A retrospective survey of rural Punjab, Pakistan. Technovation 2022, 117, 102255. [Google Scholar] [CrossRef]
  4. Abbas, A.; Zhao, C.; Waseem, M.; Khan, K.A.; Ahmad, R. Analysis of energy input–output of farms and assessment of greenhouse gas emissions: A case study of cotton growers. Front. Environ. Sci. 2022, 9, 826838. [Google Scholar] [CrossRef]
  5. Liu, Z.; Feng, K.; Hubacek, K.; Liang, S.; Anadon, L.D.; Zhang, C.; Guan, D. Four system boundaries for carbon accounts. Ecol. Model. 2015, 318, 118–125. [Google Scholar] [CrossRef]
  6. Lange, S.; Pohl, J.; Santarius, T. Digitalization and energy consumption. Does ICT reduce energy demand? Ecol. Econ. 2020, 176, 106760. [Google Scholar] [CrossRef]
  7. Wang, E.Z.; Lee, C.C. The impact of information communication technology on energy demand: Some international evidence. Int. Rev. Econ. Financ. 2022, 81, 128–146. [Google Scholar] [CrossRef]
  8. Wang, P.; Zhong, P.; Yu, M.; Pu, Y.; Zhang, S.; Yu, P. Trends in energy consumption under the multi-stage development of ICT: Evidence in China from 2001 to 2030. Energy Rep. 2022, 8, 8981–8995. [Google Scholar] [CrossRef]
  9. Salahuddin, M.; Alam, K. Internet usage, electricity consumption and economic growth in Australia: A time series evidence. Telemat. Inform. 2015, 32, 862–878. [Google Scholar] [CrossRef]
  10. Hao, Y.; Li, Y.; Guo, Y.; Chai, J.; Yang, C.; Wu, H. Digitalization and electricity consumption: Does internet development contribute to the reduction in electricity intensity in China? Energy Policy 2022, 164, 112912. [Google Scholar] [CrossRef]
  11. Zhou, X.; Zhou, D.; Wang, Q. How does information and communication technology affect China’s energy intensity? A three-tier structural decomposition analysis. Energy 2018, 151, 748–759. [Google Scholar] [CrossRef]
  12. Zhong, M.R.; Cao, M.Y.; Zou, H. The carbon reduction effect of ICT: A perspective of factor substitution. Technol. Forecast. Soc. Chang. 2022, 181, 121754. [Google Scholar] [CrossRef]
  13. Zhao, S.; Hafeez, M.; Faisal, C.M.N. Does ICT diffusion lead to energy efficiency and environmental sustainability in emerging Asian economies? Environ. Sci. Pollut. Res. 2022, 2022, 12198–12207. [Google Scholar] [CrossRef]
  14. Cui, H.; Cao, Y.; Feng, C.; Zhang, C. Multiple effects of ICT investment on carbon emissions: Evidence from China. Environ. Sci. Pollut. Res. 2023, 30, 4399–4422. [Google Scholar] [CrossRef]
  15. Horváth, D.; Szabó, R.Z. Driving forces and barriers of Industry 4.0: Do multinational and small and medium-sized companies have equal opportunities? Technol. Forecast. Soc. Chang. 2019, 146, 119–132. [Google Scholar] [CrossRef]
  16. Remes, J.; Mischke, J.; Krishnan, M. Solving the productivity puzzle: The role of demand and the promise of digitization. Int. Product. Monit. 2018, 34, 28–51. [Google Scholar]
  17. You, Y.; Yi, L. Energy industry Carbon neutrality transition path: Corpus-based AHP-DEMATEL system modelling. Energy Rep. 2022, 8, 25–39. [Google Scholar] [CrossRef]
  18. Coreynen, W.; Matthyssens, P.; Van Bockhaven, W. Boosting servitization through digitization: Pathways and dynamic resource configurations for manufacturers. Ind. Mark. Manag. 2017, 60, 42–53. [Google Scholar] [CrossRef]
  19. Bohnsack, R.; Pinkse, J.; Kolk, A. Business models for sustainable technologies: Exploring business model evolution in the case of electric vehicles. Res. Policy 2014, 43, 284–300. [Google Scholar] [CrossRef]
  20. Sadowski, J.; Bendor, R. Selling smartness: Corporate narratives and the smart city as a sociotechnical imaginary. Sci. Technol. Hum. Values 2019, 44, 540–563. [Google Scholar] [CrossRef]
  21. Sadowski, J.; Levenda, A.M. The anti-politics of smart energy regimes. Political Geogr. 2020, 81, 102202. [Google Scholar] [CrossRef]
  22. Van Oers, L.; de Hoop, E.; Jolivet, E.; Marvin, S.; Späth, P.; Raven, R. The politics of smart expectations: Interrogating the knowledge claims of smart mobility. Futures 2020, 122, 102604. [Google Scholar] [CrossRef]
  23. Qi, Y.; Peng, W.; Yan, R.; Rao, G. Use of BP Neural Networks to Determine China’s Regional CO2 Emission Quota. Complexity 2021, 2021, 6659302. [Google Scholar] [CrossRef]
  24. Yokoi, R.; Watari, T.; Motoshita, M. Future greenhouse gas emissions from metal production: Gaps and opportunities towards climate goals. Energy Environ. Sci. 2022, 15, 146–157. [Google Scholar] [CrossRef]
  25. Zhang, Y.; Zhang, Y.; Zhu, H.; Zhou, P.; Liu, S.; Lei, X.; Li, Y.; Li, B.; Ning, P. Life cycle assessment of pollutants and emission reduction strategies based on the energy structure of the nonferrous metal industry in China. Energy 2022, 261, 125148. [Google Scholar] [CrossRef]
  26. Wu, R.; Tan, Z.; Lin, B. Does carbon emission trading scheme really improve the CO2 emission efficiency? Evidence from China’s iron and steel industry. Energy 2023, 277, 127743. [Google Scholar] [CrossRef]
  27. Gao, P.; Yue, S.; Chen, H. Carbon emission efficiency of China’s industry sectors: From the perspective of embodied carbon emissions. J. Clean. Prod. 2020, 283, 124655. [Google Scholar] [CrossRef]
  28. Li, G.; Lai, S.; Lu, M.; Li, Y. Digitalization, Carbon Productivity and Technological Innovation in Manufacturing—Evidence from China. Sustainability 2023, 15, 11014. [Google Scholar] [CrossRef]
  29. Gao, J.; Xu, N.; Zhou, J. Does Digital Transformation Contribute to Corporate Carbon Emissions Reduction? Empirical Evidence from China. Sustainability 2023, 15, 13414. [Google Scholar] [CrossRef]
  30. Shabani, Z.D.; Shahnazi, R. Energy consumption, carbon dioxide emissions, information and communications technology, and gross domestic product in Iranian economic sectors: A panel causality analysis. Energy 2019, 169, 1064–1078. [Google Scholar] [CrossRef]
  31. Liang, S.; Yang, J.; Ding, T. Performance evaluation of AI driven low carbon manufacturing industry in China: An interactive network DEA approach. Comput. Ind. Eng. 2022, 170, 108248. [Google Scholar] [CrossRef]
  32. Jin, X.; Yu, W. Information and communication technology and carbon emissions in China: The rebound effect of energy intensive industry. Sustain. Prod. Consum. 2022, 32, 731–742. [Google Scholar] [CrossRef]
  33. Egilmez, G.; Kucukvar, M.; Tatari, O. Sustainability assessment of US manufacturing sectors: An economic input output-based frontier approach. J. Clean. Prod. 2013, 53, 91–102. [Google Scholar] [CrossRef]
  34. Zhou, D.; Zhou, X.; Xu, Q.; Wu, F.; Wang, Q.; Zha, D. Regional embodied carbon emissions and their transfer characteristics in China. Struct. Chang. Econ. Dyn. 2018, 46, 180–193. [Google Scholar] [CrossRef]
  35. Zhou, X.; Zhou, D.; Wang, Q.; Su, B. How information and communication technology drives carbon emissions: A sector-level analysis for China. Energy Econ. 2019, 81, 380–392. [Google Scholar] [CrossRef]
  36. Shan, Y.; Liu, Z.; Guan, D. CO2 emissions from China’s lime industry. Appl. Energy 2016, 166, 245–252. [Google Scholar] [CrossRef]
  37. Shan, Y.; Huang, Q.; Guan, D.; Hubacek, K. China CO2 emission accounts 2016–2017. Sci. Data 2020, 7, 54. [Google Scholar] [CrossRef]
  38. 2006 IPCC Guidelines for National Greenhouse Gas Inventories; Institute for Global Environmental Strategies: Hayama, Japan, 2006.
  39. Guan, Y.; Shan, Y.; Huang, Q.; Chen, H.; Wang, D.; Hubacek, K. Assessment to China’s recent emission pattern shifts. Earth’s Future 2021, 9, e2021EF002241. [Google Scholar] [CrossRef]
  40. Shan, Y.; Zhou, Y.; Meng, J.; Mi, Z.; Liu, J.; Guan, D. Peak cement-related CO2 emissions and the changes in drivers in China. J. Ind. Ecol. 2019, 23, 959–971. [Google Scholar] [CrossRef]
  41. Liu, Z.; Guan, D.; Wei, W.; Davis, S.J.; Ciais, P.; Bai, J.; Peng, S.; Zhang, Q.; Hubacek, K.; Marland, G.; et al. Reduced carbon emission estimates from fossil fuel combustion and cement production in China. Nature 2015, 524, 335–338. [Google Scholar] [CrossRef]
  42. Miller Ronald, E.; Peter, D.B. Input-Output Analysis: Foundations and Extensions; Cambridge University Press: Cambridge, UK, 2009. [Google Scholar]
  43. NBSC. China Energy Statistical Yearbook; China Statistics Press: Beijing, China, 2022; Available online: https://data.cnki.net/yearBook?type=type&code=A (accessed on 1 September 2023). (In Chinese)
  44. Shan, Y.; Guan, D.; Zheng, H.; Ou, J.; Li, Y.; Meng, J.; Mi, Z.; Liu, Z.; Zhang, Q. China CO2 emission accounts 1997–2015. Sci. Data 2018, 5, 170201. [Google Scholar] [CrossRef]
  45. NBSC. Industrial Classification for National Economic Activities (GB/T 4754-2017). 2017. Available online: http://www.stats.gov.cn/xxgk/tjbz/gjtjbz/201710/t20171017_1758922.html (accessed on 1 September 2023). (In Chinese)
  46. Su, B.; Huang, H.; Ang, B.; Zhou, P. Input–output analysis of CO2 emissions embodied in trade: The effects of sector aggregation. Energy Econ. 2010, 32, 166–175. [Google Scholar] [CrossRef]
  47. Alcántara, V.; Padilla, E. Input–output subsystems and pollution: An application to the service sector and CO2 emissions in Spain. Ecol. Econ. 2009, 68, 905–914. [Google Scholar] [CrossRef]
  48. Butnar, I.; Llop, M. Structural decomposition analysis and input–output subsystems: Changes in CO2 emissions of Spanish service sectors (2000–2005). Ecol. Econ. 2011, 70, 2012–2019. [Google Scholar] [CrossRef]
  49. CAICT. White Paper on Digital Carbon Neutrality. 2021. Available online: http://www.caict.ac.cn/kxyj/qwfb/bps/202112/t20211220_394303.htm (accessed on 1 September 2023). (In Chinese).
  50. CAICT. 2020 White Paper on China’s Digital Economy Development. 2020. Available online: http://www.caict.ac.cn/kxyj/qwfb/bps/202007/t20200702_285535.htm (accessed on 1 September 2023). (In Chinese).
  51. CAICT. 2015 White Paper on China’s Digital Economy Development. 2015. Available online: http://www.caict.ac.cn/kxyj/qwfb/bps/201804/t20180426_158204.htm (accessed on 1 September 2023). (In Chinese).
  52. CAICT. 2016 White Paper on China’s Digital Economy Development. 2016. Available online: http://www.caict.ac.cn/kxyj/qwfb/bps/201804/t20180426_158344.htm (accessed on 1 September 2023). (In Chinese).
  53. Lenzen, M. Environmentally important paths, linkages and key sectors in the Australian economy. Struct. Chang. Econ. Dyn. 2003, 14, 1–34. [Google Scholar] [CrossRef]
  54. Owen, A.; Wood, R.; Barrett, J.; Evans, A. Explaining value chain differences in MRIO databases through structural path decomposition. Econ. Syst. Res. 2016, 28, 243–272. [Google Scholar] [CrossRef]
  55. Liu, S.; Tian, X.; Cai, W.; Chen, W.; Wang, Y. How the transitions in iron and steel and construction material industries impact China’s CO2 emissions: Comprehensive analysis from an inter-sector linked perspective. Appl. Energy 2018, 211, 64–75. [Google Scholar] [CrossRef]
Figure 1. The proportion of industrial emissions in China 1997–2020.
Sustainability 15 14785 g001
Figure 2. Direct and embodied carbon emissions of the HCM sector in 2002–2020.
Sustainability 15 14785 g002
Figure 3. Direct carbon emissions of HCM in Chinese provinces (Mt).
Sustainability 15 14785 g003
Figure 4. Carbon emissions from digitization of China’s HCM industry.
Sustainability 15 14785 g004
Figure 5. Distribution of each production tier to carbon emissions embodied in the digitization of China’s HCM sector in 2002, 2020.
Sustainability 15 14785 g005
Table 1. The data source of the variables.
VariableSource
FEijNational scale from China Energy Statistical Yearbook (NBSC, 2001–2021) [43]
Provincial scale from China Emission Accounts and Datasets (CEADs, www.ceads.net accessed on 1 September 2023)
NCViShan et al. [44]
CCi
Oij
CPjNational Bureau of Statistics of China (NBSC, https://data.stats.gov.cn/index.htm accessed on 1 September 2023)
CFjLiu et al. [41]
XInput–Output Table of China (NBSC, https://data.stats.gov.cn/index.htm accessed on 1 September 2023)
A
L
Y
Note: Seventeen fossil fuels including Raw coal, Cleaned coal, Other washed coal, Briquettes, Coke, Coke over gas, Other gas, Other coking products, Crude oil, Gasoline, Kerosene, Diesel oil, Fuel oil, LPG, Refinery gas, Other petroleum products, Nature gas.
Table 2. Classification of China’s sectors.
Sectors in This StudyCodeCategory
Processing of Petroleum, Coal, and Other FuelsH1HCM Sector
Chemical-related Manufacture H2
Manufacture of Nonmetallic Mineral ProductsH3
Smelting and Pressing of MetalsH4
Manufacture of Computers, Communication, and Other Electronic EquipmentD1Digital Sector
Information Transmission, Software, and Information Technology ServicesD2
Agriculture, Forestry, Animal Husbandry, and FisheryO1Other Sector
Mining and Washing of CoalO2
Extraction of Petroleum and Natural GasO3
Mining and Processing of Metal OresO4
Mining and Processing of Nonmetal and Other OresO5
Manufacture of Food, Beverages, and TobaccoO6
Manufacture of TextilesO7
Manufacture of Textiles, Wearing Apparel, Footwear, Leather, Fur, Feather, and Related ProductsO8
Manufacture of Wood, Bamboo, Rattan, Palm, Straw, and FurnitureO9
Manufacture of Paper, Articles for Culture, Education, Entertainment Activities, and Printing and Reproduction of Recording MediaO10
Manufacture of Metal ProductsO11
Manufacture of General and Special Purpose MachineryO12
Manufacture of Transportation EquipmentO13
Manufacture of Electrical Machinery and ApparatusO14
Manufacture of Measuring Instruments and MachineryO15
Other ManufactureO16
Production and Supply of Electric Power and Heat PowerO17
Production and Supply of GasO18
Production and Supply of WaterO19
ConstructionO20
Transport, Storage, and PostO21
Wholesale and Retail Trades, Hotels, and Catering ServicesO22
Finance and InsuranceO23
Real EstateO24
Leasing and Commercial ServicesO25
Scientific Research and Technology ServicesO26
Water Conservancy, Environment, and Public Facility ManagementO27
Resident and Other ServicesO28
EducationO29
Culture, Sports, and EntertainmentO30
Health, Social Security, and Social Welfare ServicesO31
Public Management and Social OrganizationO32
Note: with regard to some services sectors (D2, O23–O32), whose energy consumption data were not available, we estimated their direct CO2 emissions by using a treatment approach of input weight shares [46].
Table 3. Embodied carbon emissions of HCM in Chinese provinces (unit: Mt CO2).
Province2002200720122017
Shanghai4.56483.5782442.282840.184
Yunnan19.83897.222153.583106.875
Inner Mongolia4.722150.6774837.90627,791.885
Beijing10.96847.559662.970231.801
Jilin15.715164.19673.33632,729.936
Sichuan9.23339.29862.78732.102
Tianjin6.73273.95450.982671.111
Ningxia0.10535.4277452.067403.843
Anhui7.35091.658463.906211.618
Shandong13.401217.168375.272126.459
Shanxi19.514127.862144.951396.444
Guangdong17.251180.291493.313172.018
Guangxi7.99644.821105.979135.315
Xinjiang3.57946.766869.0392810.928
Jiangsu12.118234.525180.91321,573.977
Jiangxi2.52743.27399.2056661.286
Hebei33.698647.470435.571740.320
Henan19.673226.224404.9273229.652
Zhejiang8.151143.085471.606919.984
Hainan0.5745.49587.608632.983
Hubei7.96036.93683.539103.753
Hunan5.82494.025269.51589.499
Gansu3.51255.570385.57288.130
Fujian9.90652.38663.08260.994
Guizhou5.45474.3373398.7334648.884
Liaoning9.151238.324416.636229.849
Chongqing8.70220.211324.898827.745
Shaanxi5.36582.393609.484159.528
Qinghai0.8949.640720.47899.357
Heilongjiang5.80741.026122.2572173.220
Average9.343113.513875.4133629.989
Table 4. Carbon emissions from digitization of HCM in Chinese provinces (unit: Ten thousand tons CO2).
Province2002200720122017
ExCInCExCInCExCInCExCInC
Shanghai0.440.7126.169.5218.6125.5349.9795.98
Yunnan0.110.992.4523.674.9881.274.4055.36
Inner Mongolia0.090.171.340.107.3515.11102.91151.54
Beijing1.080.891.866.6788.2716.6341.9989.98
Jilin1.580.122.261.475.558.88126.4467.68
Sichuan0.290.431.252.264.7230.635.3842.74
Tianjin0.240.341.802.956.9810.2119.0451.47
Ningxia0.000.000.390.071.134.3012.4134.64
Anhui0.070.890.654.6510.2924.1114.2841.99
Shandong1.031.106.2515.2217.94158.4020.1390.64
Shanxi0.891.6415.555.1614.9724.2715.5050.97
Guangdong2.481.8416.0826.7411.5756.8113.6654.04
Guangxi1.362.110.421.382.1717.751.7637.34
Xinjiang1.600.0314.391.9317.7922.8528.5696.07
Jiangsu0.942.891.8319.082.4553.983.02124.54
Jiangxi0.030.100.500.737.6628.0215.6690.61
Hebei1.660.5511.3429.5211.85219.9722.83104.76
Henan0.690.279.4414.4712.7441.9524.65215.25
Zhejiang0.522.092.223.708.9729.2922.3057.01
Hainan0.000.020.260.033.350.5521.6422.69
Hubei1.620.650.641.034.8227.209.187.88
Hunan0.301.222.425.7116.6524.1426.2050.22
Gansu0.130.080.872.205.1316.7118.6124.31
Fujian1.020.992.388.584.179.262.8920.93
Guizhou0.810.194.433.8422.4721.36292.85289.18
Liaoning0.970.783.8311.0524.15115.2346.92180.00
Chongqing0.040.320.050.731.9811.0336.83202.61
Shaanxi0.170.961.929.5113.0543.4416.8634.93
Qinghai0.070.011.350.021.180.809.227.77
Heilongjiang1.410.231.011.0112.6427.1748.5675.05
Average0.720.754.517.1012.1938.9035.8282.27
Table 5. Carbon emissions increase/decrease in the digitization of China’s HCM.
YearIncreased Emissions (Mt)Reduced Emissions (Mt)
13%22%
20021.063171.201289.724
20052.176301.206509.732
20071.830372.785630.866
20101.696478.687810.086
20121.394545.255922.739
20151.573585.287990.486
20171.392589.068996.884
20181.606616.2411042.870
20201.595695.9711177.797
Table 6. The change in carbon emissions in the digitization of HCM in Chinese provinces.
ProvinceReduced Emissions–Increased Emissions (Mt)
13%22%
20022007201220172002200720122017
Shanghai5.2785.8786.0163.1268.94010.19410.4876.300
Yunnan3.5796.84110.02412.0736.06511.75717.56120.845
Inner Mongolia3.2607.67311.77810.2005.51812.99620.08719.023
Beijing3.4322.860−0.061−0.9385.8224.8990.624−0.674
Jilin1.7244.2208.1294.2512.9297.16713.8578.538
Sichuan4.8498.60319.66019.7748.21114.58333.51633.797
Tianjin2.1274.8917.0175.0293.6048.31011.9948.999
Ningxia0.1411.3862.7743.1990.2392.3494.7335.739
Anhui5.2927.7069.83912.3678.96213.07816.88921.318
Shandong8.66722.55426.63123.98514.68238.31746.28941.356
Shanxi12.27116.69219.94418.43720.78428.39134.02331.661
Guangdong5.8679.59311.70713.2979.95816.53120.28622.972
Guangxi2.7816.46411.27814.2544.73010.95119.22324.393
Xinjiang1.5803.7548.7159.6122.6856.46515.02917.129
Jiangsu6.32316.20322.80628.46910.72727.56538.98649.062
Jiangxi2.8996.5678.16111.1324.90711.12214.05819.575
Hebei12.64829.26643.57047.60121.42049.81075.33881.439
Henan5.06113.20018.93115.9008.57122.50532.41528.568
Zhejiang4.1737.9559.3417.5847.08113.50416.07313.384
Hainan0.1310.8180.8120.7270.2221.3861.4011.537
Hubei6.09310.30317.38314.10010.32717.44829.63923.980
Hunan3.83910.13912.22313.2286.50717.21420.96722.915
Gansu1.7673.9485.9415.2952.9916.70210.2059.257
Fujian1.6765.6768.4359.2002.8499.68114.36715.734
Guizhou1.7743.3035.7290.4583.0095.6479.9984.805
Liaoning8.37116.06820.16220.30514.17827.29435.08635.933
Chongqing3.6623.9288.3763.7216.2006.65214.2657.954
Shaanxi2.6514.4349.2587.2324.4957.58316.05812.597
Qinghai0.3630.9252.3072.2320.6151.5753.9183.895
Heilongjiang2.3315.1078.3943.8483.9558.65714.4817.368
Table 7. Carbon emissions from digitization of HCM in Chinese four district (unit: Ten thousand tons CO2).
District2002200720122017
East2.08219.21775.48092.953
Central1.39410.15939.47293.733
West0.9056.78131.565136.932
Northeast1.6966.87664.540181.554
Note: emissions are calculated as an average of all provinces within each district; the district classification criteria see in NBSC website: http://www.stats.gov.cn/zt_18555/zthd/sjtjr/dejtjkfr/tjkp/202302/t20230216_1909741.htm accessed on 1 September 2023.
Table 8. Contributions of each production tier to carbon emissions embodied in the digitization of China’s HCM sector in 2002, 2020 (unit: Ten thousand tons CO2).
SectorH1H2H3H4
Year20022020200220202002202020022020
Tier 10.2390.1114.4192.8031.2040.3470.4500.225
Tier 20.4160.5594.8055.0301.3250.8870.5260.843
Tier 30.3110.8693.8605.3840.8471.0290.4551.080
Tier 40.1970.7892.7394.6830.5470.8960.3341.005
Tier 5 0.3321.8625.14211.9280.9702.1800.6442.606
Total1.4944.19020.96529.8284.8935.3382.4095.759
Table 9. The top 5 ranking transfer paths, starting with digital sectors and ending with HCM final demand in 2002, 2020 (unit: Ten thousand tons CO2).
RankEmissionsContributionPathEmissionsContributionPath
20022020
From D1 to H1
10.0377.126D1→H10.0501.884D1→O15→H1
20.0315.875D1→O3→H10.0431.622D1→O12→H1
30.0173.229D1→D1→H10.0391.457D1→D1→O15→O3→H1
40.0163.041D1→O15→O3→H10.0341.278D1→O25→H1
50.0142.662D1→D1→O3→H10.0331.247D1→H1
From D1 to H2
10.4817.211D1→H20.7604.487D1→H2
20.2764.147D1→O25→H20.3942.324D1→D1→H2
30.2183.268D1→D1→H20.3201.891D1→O25→H2
40.1802.707D1→H2→H20.2841.674D1→H2→H2
50.1251.879D1→D1→O25→H20.2041.204D1→D1→D1→H2
From D1 to H3
10.1349.112D1→H30.1033.163D1→O12→H3
20.0614.129D1→D1→H30.0852.615D1→H3
30.0523.568D1→O25→H30.0531.638D1→D1→O12→H3
40.0332.257D1→D2→H30.0441.355D1→D1→H3
50.0271.871D1→D1→D1→H30.0421.296D1→O25→H3
From D1 to H4
10.0253.607D1→H40.0872.438D1→O12→H4
20.0131.909D1→D2→H40.0762.120D1→O16→H4
30.0111.635D1→D1→H40.0752.104D1→H4
40.0101.470D1→O22→H40.0621.733D1→D1→O12→H4
50.0101.468D1→O12→H40.0391.090D1→D1→H4
From D2 to H1
10.20220.805D2→H10.0895.860D2→O21→H1
20.17718.199D2→O3→H10.0785.133D2→H1
30.0282.847D2→O22→H10.0603.941D2→O3→H1
40.0232.344D2→O23→O3→H10.0543.583D2→O23→O3→H1
50.0212.144D2→O21→H10.0483.157D2→O23→H1
From D2 to H2
13.93827.541D2→H22.04315.856D2→H2
21.47810.337D2→H2→H20.7625.914D2→H2→H2
30.5553.880D2→H2→H2→H20.5994.648D2→O21→H2
40.4102.871D2→O22→H20.4113.189D2→D2→H2
50.2721.903D2→O23→H20.2842.208D2→O23→H2
From D2 to H3
11.07031.249D2→H30.26312.525D2→H3
20.1785.192D2→O5→H30.1075.121D2→O21→H3
30.1584.625D2→O23→H30.0673.216D2→O23→H3
40.1163.380D2→O22→H30.0532.519D2→D2→H3
50.0872.527D2→H3→H30.0502.378D2→H3→H3
From D2 to H4
10.42524.696D2→H40.1506.864D2→H4
20.1287.463D2→H4→H40.1115.063D2→O23→H4
30.0492.871D2→O22→H40.0994.534D2→O21→H4
40.0392.256D2→H4→H4→H40.0733.343D2→O4→H4
50.0281.601D2→O23→H40.0421.934D2→O17→H4
Table 10. Contributions of each production tier to carbon emissions embodied in the digitization of Guizhou, Shandong, and Guangxi HCM sectors in 2017 (unit: Ten thousand tons CO2).
SectorH1H2
ProvinceGuizhouShandong Guangxi GuizhouShandong Guangxi
Tier 11.0410.0900.03348.8431.5470.132
Tier 20.8780.2280.01737.2991.9120.104
Tier 30.5380.2870.01124.5311.7790.068
Tier 40.3320.2870.00616.7231.4940.042
Tier 5 0.5871.2720.01031.0945.3160.069
Total3.3772.1630.076158.49112.0470.414
SectorH3H4
ProvinceGuizhouShandong Guangxi GuizhouShandong Guangxi
Tier 16.6620.3900.17223.2500.2690.243
Tier 27.2120.4380.11936.2340.5070.205
Tier 34.2920.3740.06918.1900.5430.134
Tier 42.6210.2930.04110.1540.4760.084
Tier 5 4.6450.9320.06617.7251.6960.138
Total25.4322.4260.467105.5533.4900.803
Table 11. The top 5 ranking transfer paths, starting with digital sectors and ending with H1 final demand in Guizhou, Shandong, and Guangxi (unit: Ten thousand tons CO2).
RankEmissionsContributionPathEmissionsContributionPath
Guizhou
10.0001819.1D1→O2→H11.0409130.8D2→H1
20.0001112.0D1→O21→H10.3673510.9D2→O2→H1
30.000055.5D1→O2→O2→H10.236417.0D2→H1→H1
40.000044.3D1→O2→H1→H10.105493.1D2→O2→O2→H1
50.000032.7D1→O21→H1→H10.103663.1D2→D2→H1
Shandong
10.010203.3D1→O21→H10.087934.7D2→H1
20.005611.8D1→O21→H1→H10.057613.1D2→O3→H1
30.003571.2D1→O15→H10.048382.6D2→H1→H1
40.003501.1D1→D1→O21→H10.040032.2D2→D2→H1
50.003091.0D1→O21→H1→H1→H10.031701.7D2→O3→H1→H1
Guangxi
10.000156.6D1→O21→H10.0328444.6D2→H1
20.000135.7D1→O3→H10.005807.9D2→O3→H1
30.000111.3D1→O18→O3→H10.004676.3D2→D2→H1
40.000104.5D1→O18→H10.002243.0D2→O5→O3→H1
50.000093.8D1→H10.002032.8D2→H1→H1
Table 12. The top 5 ranking transfer paths, starting with digital sectors and ending with H2 final demand in Guizhou, Shandong, and Guangxi (unit: Ten thousand tons CO2).
RankEmissionsContributionPathEmissionsContributionPath
Guizhou
10.0151726.5D1→H248.82830.8D2→H2
20.004327.6D1→H2→H213.9098.8D2→H2→H2
30.003496.1D1→O21→H24.8633.1D2→D2→H2
40.001232.2D1→H2→H2→H23.9622.5D2→H2→H2→H2
50.001202.1D1→D1→H23.5522.2D2→O5→H2
Shandong
10.2078111.9D1→H21.3393913.0D2→H2
20.107826.2D1→H2→H20.694936.7D2→H2→H2
30.071244.1D1→D1→H20.609805.9D2→D2→H2
40.055943.2D1→H2→H2→H20.360563.5D2→H2→H2→H2
50.036962.1D1→D1→H2→H20.316393.1D2→D2→H2→H2
Guangxi
10.0021714.4D1→H20.1293532.4D2→H2
20.000805.3D1→H2→H20.0476411.9D2→H2→H2
30.000724.8D1→O18→H20.018394.6D2→D2→H2
40.000593.9D1→O21→H20.004811.2D2→H2→H2→H2
50.000292.0D1→D1→H20.003390.9D2→D2→H2→H2
Table 13. The top 5 ranking transfer paths, starting with digital sectors and ending with H3 final demand in Guizhou, Shandong and Guangxi (unit: Ten thousand tons CO2).
RankEmissionsContributionPathEmissionsContributionPath
Guizhou
10.000355.8D1→O21→H36.6618326.2D2→H3
20.000315.2D1→O2→H32.6826810.6D2→O5→H3
30.000294.8D1→O5→H31.066984.2D2→H3→H3
40.000213.5D1→H30.663442.6D2→D2→H3
50.000193.2D1→O18→H30.631942.5D2→O2→H3
Shandong
10.013284.7D1→O12→H30.3817217.8D2→H3
20.007952.8D1→H30.173798.1D2→D2→H3
30.004791.7D1→O12→H3→H30.137776.4D2→H3→H3
40.004551.6D1→D1→O12→H30.079123.7D2→D2→D2→H3
50.004441.6D1→O12→O12→H30.062722.9D2→D2→H3→H3
Guangxi
10.001539.3D1→O18→H30.1708737.9D2→H3
20.001157.0D1→H30.029156.5D2→H3→H3
30.000412.5D1→O21→H30.024305.4D2→D2→H3
40.000684.1D1→O18→O18→H30.015363.4D2→O5→H3
50.000352.1D1→O5→H30.009092.0D2→H2→H3
Table 14. The top 5 ranking transfer paths, starting with digital sectors and ending with H4 final demand in Guizhou, Shandong, and Guangxi (unit: Ten thousand tons CO2).
RankEmissionsContributionPathEmissionsContributionPath
Guizhou
10.002188.6D1→O21→H423.2492022.0D2→H4
20.002017.9D1→O16→H419.4373618.4D2→O4→H4
30.001556.1D1→O18→H44.233324.0D2→H4→H4
40.001064.2D1→O2→H43.539253.4D2→O4→H4→H4
50.000923.6D1→H42.529802.4D2→O18→H4
Shandong
10.1102313.2D1→O4→H40.262949.9D2→H4
20.048105.8D1→O4→H4→H40.119714.5D2→D2→H4
30.037794.5D1→D1→O4→H40.114744.3D2→H4→H4
40.029843.6D1→O4→O4→H40.054502.1D2→D2→D2→H4
50.020992.5D1→O4→H4→H4→H40.052242.0D2→D2→H4→H4
Guangxi
10.003399.1D1→O18→H40.2395531.3D2→H4
20.001494.0D1→H40.061848.1D2→H4→H4
30.003158.4D1→O16→H40.035094.6D2→O4→H4
40.000922.5D1→O4→H40.034074.4D2→D2→H4
50.001002.7D1→O18→O18→H40.012421.6D2→H4→H4→H4
Disclaimer/Publisher’s Note: The statements, opinions and data contained in all publications are solely those of the individual author(s) and contributor(s) and not of MDPI and/or the editor(s). MDPI and/or the editor(s) disclaim responsibility for any injury to people or property resulting from any ideas, methods, instructions or products referred to in the content.

