Article

Experimental Study on the Dilatancy Characteristics and Permeability Evolution of Sandstone under Different Confining Pressures

1
School of Mechanics and Civil Engineering, China University of Mining and Technology, Xuzhou 221116, China
2
State Key Laboratory of Mining Disaster Prevention and Control, Ministry of Education, Qingdao 266590, China
3
College of Safety and Environmental Engineering, Shandong University of Science and Technology, Qingdao 266590, China
4
China Construction First Group Construction & Development Co., Ltd., Beijing 100102, China
*
Author to whom correspondence should be addressed.
Sustainability 2023, 15(20), 14795; https://doi.org/10.3390/su152014795
Submission received: 10 September 2023 / Revised: 10 October 2023 / Accepted: 11 October 2023 / Published: 12 October 2023
(This article belongs to the Section Hazards and Sustainability)

Abstract

:
It is of practical significance to investigate the dilatancy and seepage characteristics of tight sandstone gas under different confining pressures for its efficient development. Therefore, fluid–solid coupling triaxial loading experiments with gas-bearing sandstone were conducted. The results showed that the gas-bearing sandstone exhibited brittle characteristics with tensile–shear composite failure. The dual logarithmic model can better characterize the sandstone strength (R2 = 0.9952), whereas the fitting effect of the linear Mohr–Coulomb criterion is poor (R2 = 0.9294). The dilatancy capacity of sandstone was negatively correlated with confining pressure, and the dilatancy index decreased by 38.4% in the form of its convex power function with the increasing confining pressure. The sandstone underwent significant damage dilatancy during the yielding stage, resulting in a significant permeability recovery, with an increase of 67.0%~70.4%, which was greater than the decrease of 9.6%~12.6% in the elastic stage. In view of the different dominant factors of permeability reduction induced by pore compaction and recovery induced by crack development, the permeability model was established with volumetric strain and radial strain as independent variables, which could better reflect the whole process of permeability evolution.

1. Introduction

The development of tight sandstone reservoirs has been paid more and more attention by the oil and gas industry, with its permeability generally less than 2 × 10⁻¹⁵ m2 and porosity generally less than 10% [1,2,3]. Sustainable development requires a balance between supply and demand for coal, oil, and gas, ultimately leading to a low- or zero-carbon life. As an important supplement to unconventional natural gas resources, tight sandstone gas plays an important role in reshaping sustainable energy development.
Rock permeability measures the ability of pore fluid to migrate in rock mass and is an important indicator of oil and gas capacity [4,5,6]. The permeability of rocks is closely related to their deformation behavior. In terms of sandstone deformation and strength, Gehne and Benson [1] believed that the inelastic effect of sandstone is probably induced by the cementation of rock structure. Yan et al. believed that tight sandstone reservoirs have a large number of flaky pores, which have a significant impact on permeability evolution [7]. Zhang et al. [8] concluded that the permeability of sandstone with small aperture fractures is more sensitive to effective stress than that of sandstone with large aperture fractures. Nguyen and Gland [9] found that the permeability evolution of Otter Sherwood weakly consolidated sandstone was closely related to the volumetric strain in both elastic and plastic states. Wang et al. [10] believed that permeability of tight sandstone is largely determined by pore size and pore size distribution, rather than porosity. Lu et al. [11] obtained that the permeability of sandstone is directly related to volumetric strain and deviatoric strain and established a fitting expression between the two. Yu et al. [12] found that the volume expands continuously with the accumulation of plastic deformation, and the increase rate of permeability gradually increases, which shows that the permeability increasing segment becomes steeper. However, Hu et al. [13] believed that sandstone permeability increases significantly only when the microcracks merge, and the effect of dilatancy is not evident.
In terms of the dependence of sandstone permeability on the applied stress or porosity, Al-Dughaimi et al. [14] obtained that the permeability–porosity trend in tight sandstone follows the familiar Kozeny–Carman equation. Sulem and Ouffrouk [15] found that the decrease in permeability within the sandstone shear zone is induced by an increase in tortuosity and specific surface area. Zisser and Nover [16] believed that the permeability of tight sandstone decreases as a power function with the increase in effective stress, and the pressure dependence of permeability is more controlled by the closure of cracks and pores with large aspect ratio than by the slight reduction in porosity. Dong et al. [17] concluded that power function is more suitable to describe the relationship between permeability and porosity (or pressure dependence) than exponential relationship by conducting seepage experiments of sandstone. The permeability of sandstone is comprehensively influenced by factors such as confining pressure, pore compressibility, mineral composition, initial permeability, and porosity. Hu et al. [18] believed that the increase in axial stress mainly changes the number and volume of pores, which is bound to affect the rock permeability. Li et al. obtained that the main direction of seepage coincides with the stress main direction and produces a priority flow channel perpendicular to the minimum principal stress [19]. This provides an idea for using lateral expansion parameters, i.e., radial strain, as the main parameters affecting permeability under the stress path of increasing axial stress.
The deformation behavior of sandstone in a fluid–solid coupling environment, especially the dilatancy characteristics, has always been the focus of research. As the depth of a sandstone reservoir increases, its dilatancy behavior, failure mode, and strength characteristics all show specific confining pressure dependencies. How to measure the depth effect of the mechanical behavior of sandstone becomes important. The tight sandstone reservoirs may enter the plastic stage under engineering disturbances. However, the investigation of sandstone seepage mainly focuses on the exponential or power–law decrease in permeability induced by elastic volume compaction with effective stress [2,3,20,21]. The seepage characteristics during permeability rebound, and the construction of the model is less discussed. In this paper, the triaxial seepage experiment of sandstone under different confining pressures is performed. Combined with the basic definition of porosity and the idealized pore structure hypothesis, the simple permeability model characterizing the entire process was derived and verified by experimental data. Finally, the main factors affecting sandstone permeability were analyzed based on the permeability model. It has important implications for predicting and regulating tight sandstone gas production.

2. Seepage Experiment

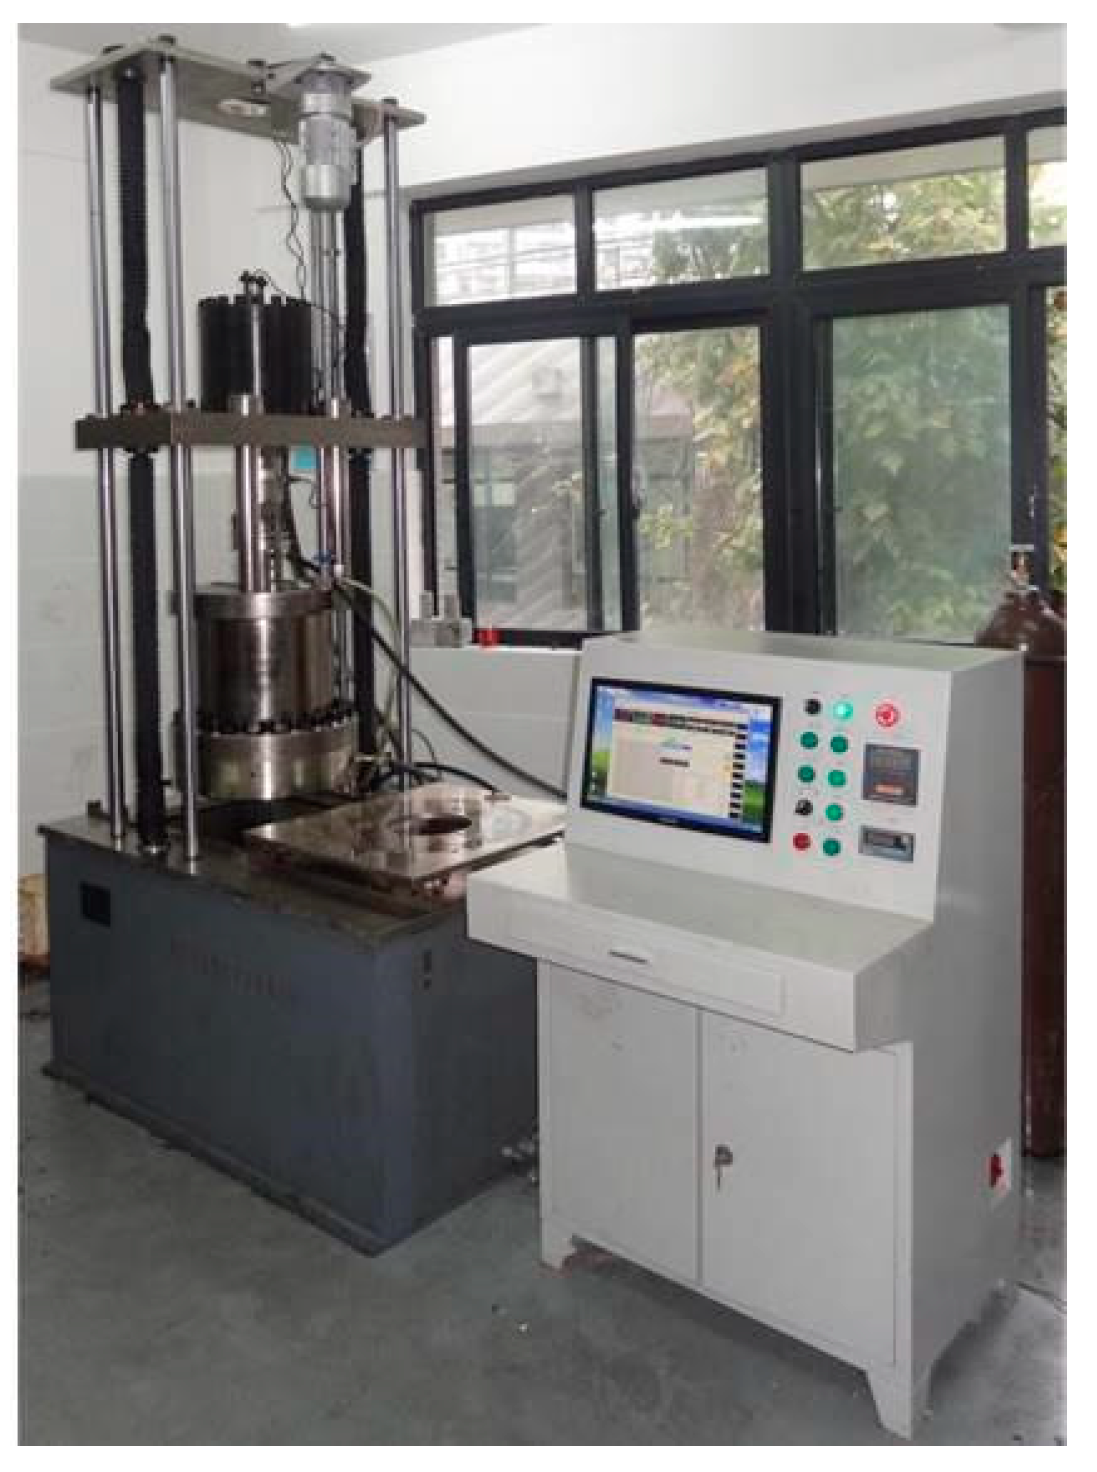
2.1. Experimental Device

The experimental device was servo-controlled seepage equipment for thermal–hydrological–mechanical couplings of rocks. The device was mainly composed of an axial loading system, a confining pressure loading system, temperature control system, fluid pressure control system, data acquisition system, etc. According to the test requirements, the loading mode of force control or displacement control can be independently selected, and the seepage experiment under the complex stress path can also be realized through program control. The maximum axial force of the experimental system can reach 1000 kN, and the maximum confining pressure is 60 MPa. The experimental temperature range is from room temperature to 100 °C. The device is shown in Figure 1.

2.2. Experimental Specimen

The experimental sandstone was taken from an outcrop in Chayuan New Area, east of the south bank of the Yangtze River in Chongqing. The original sandstone blocks were drilled, cut, and polished to form cylindrical specimens with diameters, d, and heights, h, of 50 mm and 100 mm, respectively, ensuring that the non-parallelism error of the two ends of the specimen was less than 0.02 mm. The average uniaxial compressive strength (UCS) of sandstone is 47 MPa. The pore structure of sandstone was measured by the specific surface area analyzer, and it was found that its micropores were relatively developed. The porosity of sandstone, measured by the mercury intrusion method, was 4.15%. In order to eliminate the influence of moisture on the deformation and permeability, the sandstone was dried in a dryer at a constant temperature of 110 °C for 24 h.

2.3. Experimental Scheme

The experiment was based on conventional stress path to investigate the effects of the confining pressure on the deformation and permeability of sandstone. CO2 with a purity of 99.99% was selected as the injection fluid. The loading paths were as follows.
(1)
The axial force and confining pressure were loaded at a rate of 0.05 MPa/s to the hydrostatic pressure of σ1 = σ3 = 5 MPa, and the next step was performed after the pressure and displacement sensor readings were stabilized.
(2)
A CO2 of 2 MPa was injected into the sandstone specimen, and the next step was performed after the flowmeter indicator at the outlet was stable.
(3)
The confining pressure of σ3 = 5 MPa was kept unchanged, and the axial loading was switched to displacement-controlled mode. The specimens were loaded to failure at a rate of 0.1 mm/min.
(4)
The test was ceased when the axial load became stable after the peak stress.
(5)
According to confining pressure conditions set in Table 1, the seepage tests of sandstone under σ3 = 10, 15, and 20 MPa were performed. Note: The simulated depth was calculated according to σh = 0.0245 H. σh was the minimum horizontal major stress, equivalent to the confining pressure σ3.

3. Mechanical Properties of Sandstone

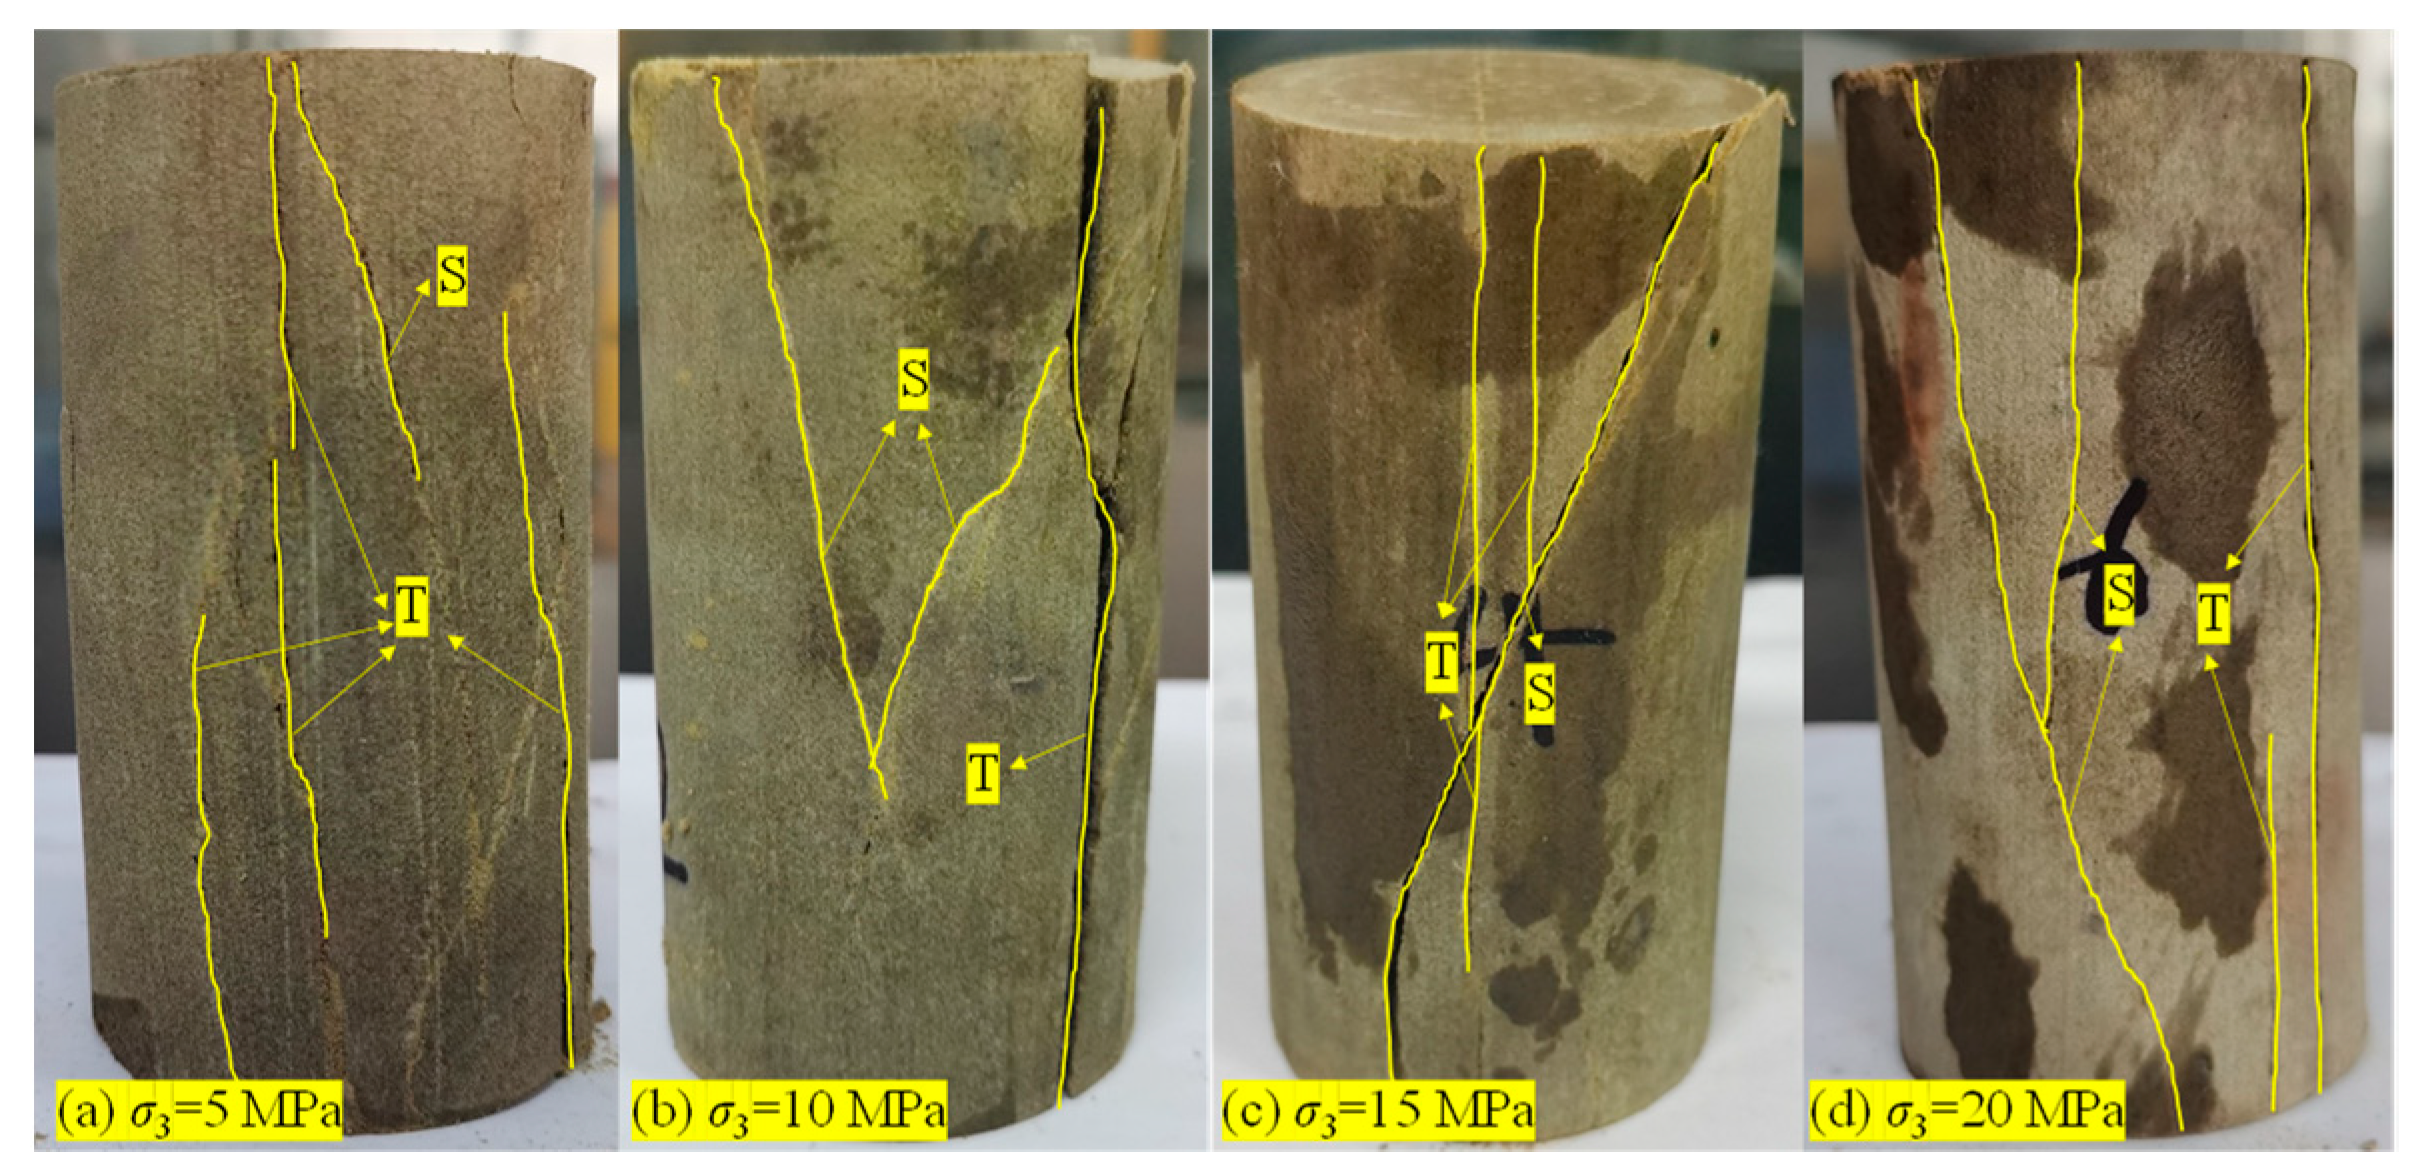
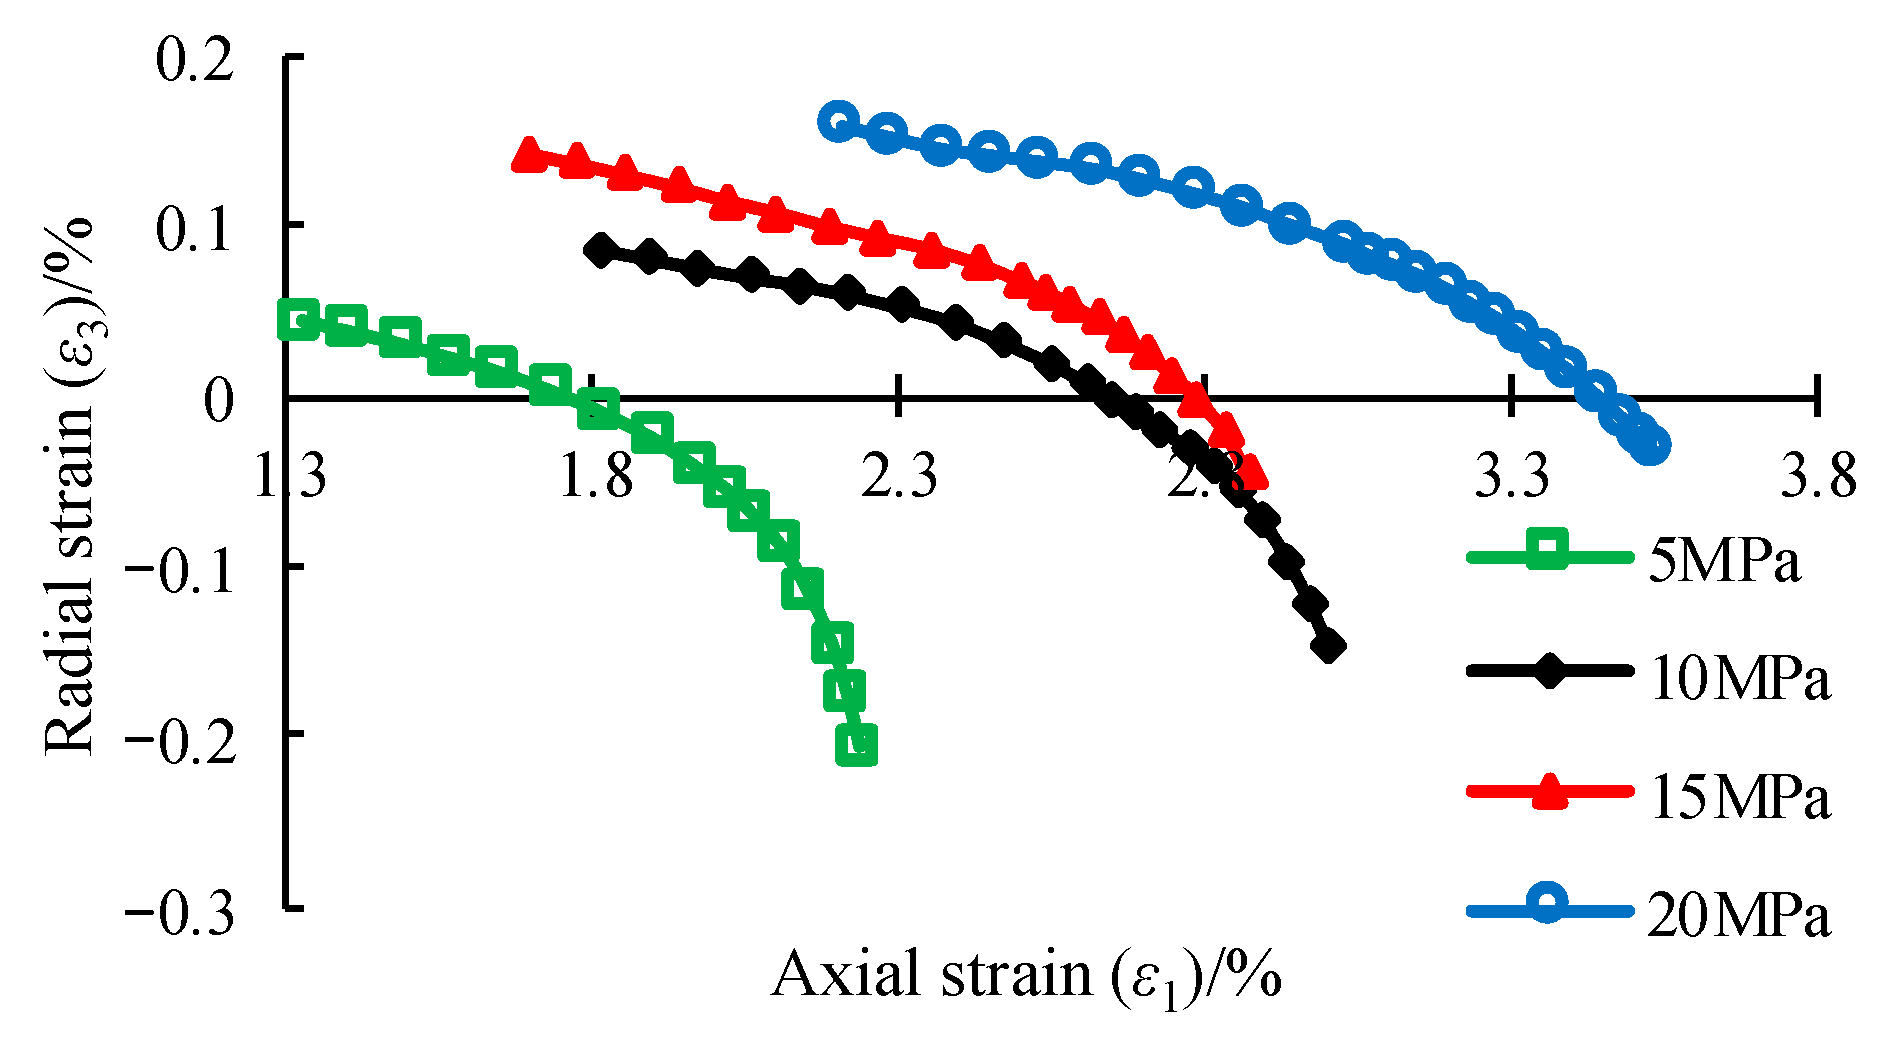
3.1. Deformation and Failure of Sandstone

The combined effect of axial stress, confining pressure, and pore pressure on the sandstone reservoir was expressed in the form of effective stress.
σ 1 = σ 1 e + P 1
σ 3 = σ 3 e + P 1 + P 2 / 2
where σ1 and σ3 are the axial stress and confining pressure, respectively, MPa; σ1e and σ3e are the effective axial stress and effective confining pressure, respectively, MPa; P1 and P2 are the inlet and outlet pressure, respectively, MPa.
Confining pressure has a significant impact on the strength and inelastic deformation behaviors of rocks [22]. In our experiment, the compressive stress (or strain) was positive, and tensile stress (or strain) was negative. Figure 2a shows the complete stress–strain curves of sandstone. Under different confining pressures, the sandstone exhibits typical brittleness, and the failure process was accompanied by significant nonlinear volume growth, i.e., dilatancy. Figure 2b shows the variation in sandstone dilatancy capacity with confining pressure at the moment of failure (the capacity is the difference between the volumetric strain (εv)p at the peak stress and the strain (εv)ap at the moment of stress drop). The increased confining pressure inhibits microcrack propagation and natural defect opening, i.e., the dilatancy of sandstone is weakened. The two are also experimentally exponential [23,24]. From the fracture morphology (Figure 3), the sandstone exhibits tension–shear composite failure. In general, the sandstone is mainly changed from tensile fracture to shear fracture with the increase in confining pressure.
The confining pressure dependence of sandstone dilatancy behavior is closely related to the deformation resistance and yield criterion of rock. Yuan and Harrison [23] summarized the stress–strain curve characteristics of sandstone based on a large amount of triaxial compression deformation data of rock and idealized it as a bilinear stress-sensitive dilatancy model, as shown in Figure 4. Mahmutoglu and Vardar [25] also suggested that the post-peak stress–volume relationship can be replaced by a straight line. It can be seen that there is a negative correlation between rock dilatancy and confining pressure in Figure 4, which is consistent with the experimental results in Figure 2b. The dilatancy index Id was established by the dilatancy angle θp under different confining pressures.
I d = θ P θ 0 = arctan Δ ε VP / Δ ε 1 P P arctan Δ ε VP / Δ ε 1 P 0
where ΔεVP and Δε1P are incremental plastic volumetric strain and incremental plastic axial strain, respectively, dimensionless; θ0 is dilatancy angle of rock under uniaxial compression or lower confining pressure, degree; θP is dilatancy angle of the rock under confining pressure constraint, degree; Id is dilatancy index, Id ∈ [0, 1]; Id = 1 indicates the maximum dilatancy under uniaxial compression; and Id = 0 indicates zero volume expansion, i.e., no dilatancy occurs.
Based on the loading curve of sandstone at σ3 = 10 MPa (Figure 5), it can be seen that the stress–strain curve of sandstone in a fluid–solid coupling environment is also applicable to the simplified treatment in Figure 4. Therefore, it is feasible to use the dilatancy index proposed by Yuan and Harrison [23] to investigate its dependence on effective confining pressure.
The deviation degree between volumetric strain and axial strain increases as εV approaches (εV)max, which is no longer suitable for linear fitting, as shown in Figure 6a. The deviation from the linear elastic contraction in the εV-ε1 coordinate indicates the development of cracks, so the initial point of deviating from the linear elastic relationship indicates the beginning of dilation. Therefore, the volumetric strain at the maximum, R2, obtained by fitting the linear expression, εV = 1 + b, in the εV-ε1 coordinate was taken as the limiting value of linear elastic compression, i.e., the initiation of dilatancy, as shown in Figure 6b and Table 2. In addition, the volumetric strain (εv)ap of sandstone at the moment of stress drop is used as the termination of dilatancy to obtain ΔεVP = (εVe)max − (εv)ap. Similarly, Δε1P = (ε1max)e − (ε1)ap. Table 3 shows the calculation of dilatancy index, and the power function is used to describe the correlation between dilatancy index and effective confining pressure.
I d = 1 σ 3 e σ 3 e - nd α
where α is the fitting parameter, dimensionless; and σ3-nd is the minimum confining pressure when dilatancy disappears, MPa.
The fitting results show that σ3e-nd = 20.45 MPa, α = 0.1838, and R2 = 0.9771. Figure 7 shows the evolution of the dilatancy index Id. α < 1 means that the two satisfy the power function in the convex upwards form. The dilatancy capacity of sandstone decreases rapidly with the increase in confining pressure. In the brittle state, the higher confining pressure is conducive to the compaction of internal cracks, and the closure amount of natural or pre-existing cracks is increased. However, the closed cracks are a necessary condition for shear sliding [26], which also reduces sheared dilatancy capacity. The fitting results predict that the dilatancy of sandstone disappears when the effective confining pressure is loaded to σ3e-nd = 20.45 MPa (or σ3-nd = 21.5 MPa). This is worth discussing because σ3-nd is only slightly greater than the experimentally designed confining pressure of 20 MPa, and it is uncertain whether the dilatation effect of sandstone will disappear at an increment of 1.5 MPa. In addition, the porosity of the experimental sandstone is relatively small, and there is no large-scale pore collapse. The mechanism leading to the rapid reduction in sandstone dilatancy index still needs to be further explored.

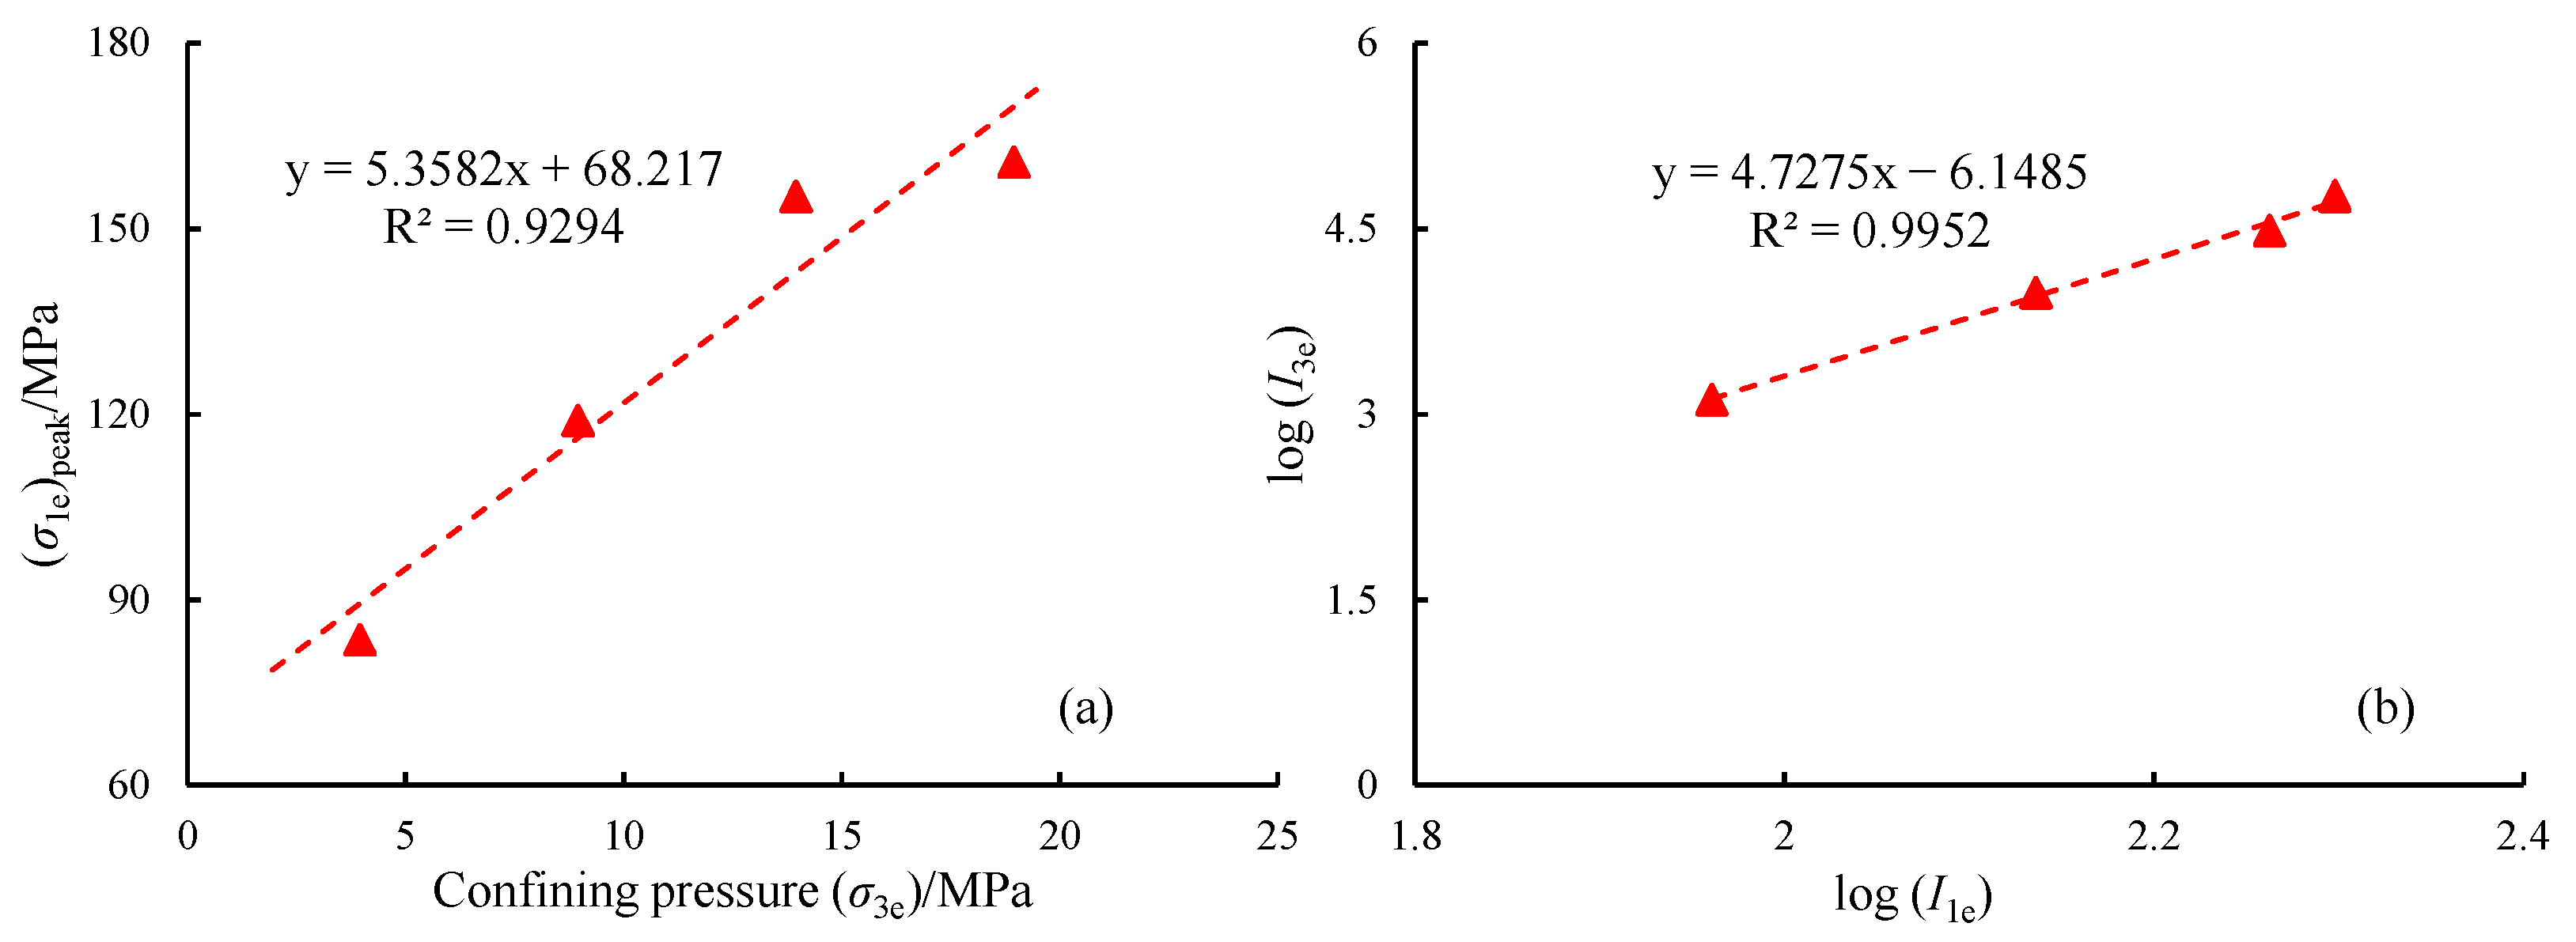
3.2. Sandstone Strength

Figure 8 shows the sandstone strength. It is shown that the linear Mohr–Columb strength criterion is poor in predicting the strength of sandstone (Figure 8a), which can be proved by the tension–shear composite failure mode of the sandstone in Figure 3. Lu et al. [27] obtained that the strength criterion in logarithmic form can well describe the rock strength under complex stress conditions. To improve the fitting effect, the double logarithmic strength model (DLS) is also used.
log I 3 e = m log I 1 e + n
I 1 e = σ 1 e + σ 2 e + σ 3 e
I 3 e = σ 1 e σ 2 e σ 3 e
where I1e and I3e are the first and third effective principal stress invariants, respectively; and m and n are the coefficients related to the rock’s physical parameters c and φ, respectively. c and φ are the cohesive force and internal friction angle, respectively.
Evidently, the DLS has a good fitting effect in Figure 8b. The intrinsic failure mechanism reflected by failure morphology must be considered in predicting rock strength (Figure 3). The shear and tensile effects on the sandstone exist simultaneously, which finally manifested as tensile–shear composite failure. The I3e term in Equation (5) is related to the strain type of rock [28], so the fitting effect is better than that of the pure shear criterion.

4. Sandstone Permeability Evolution

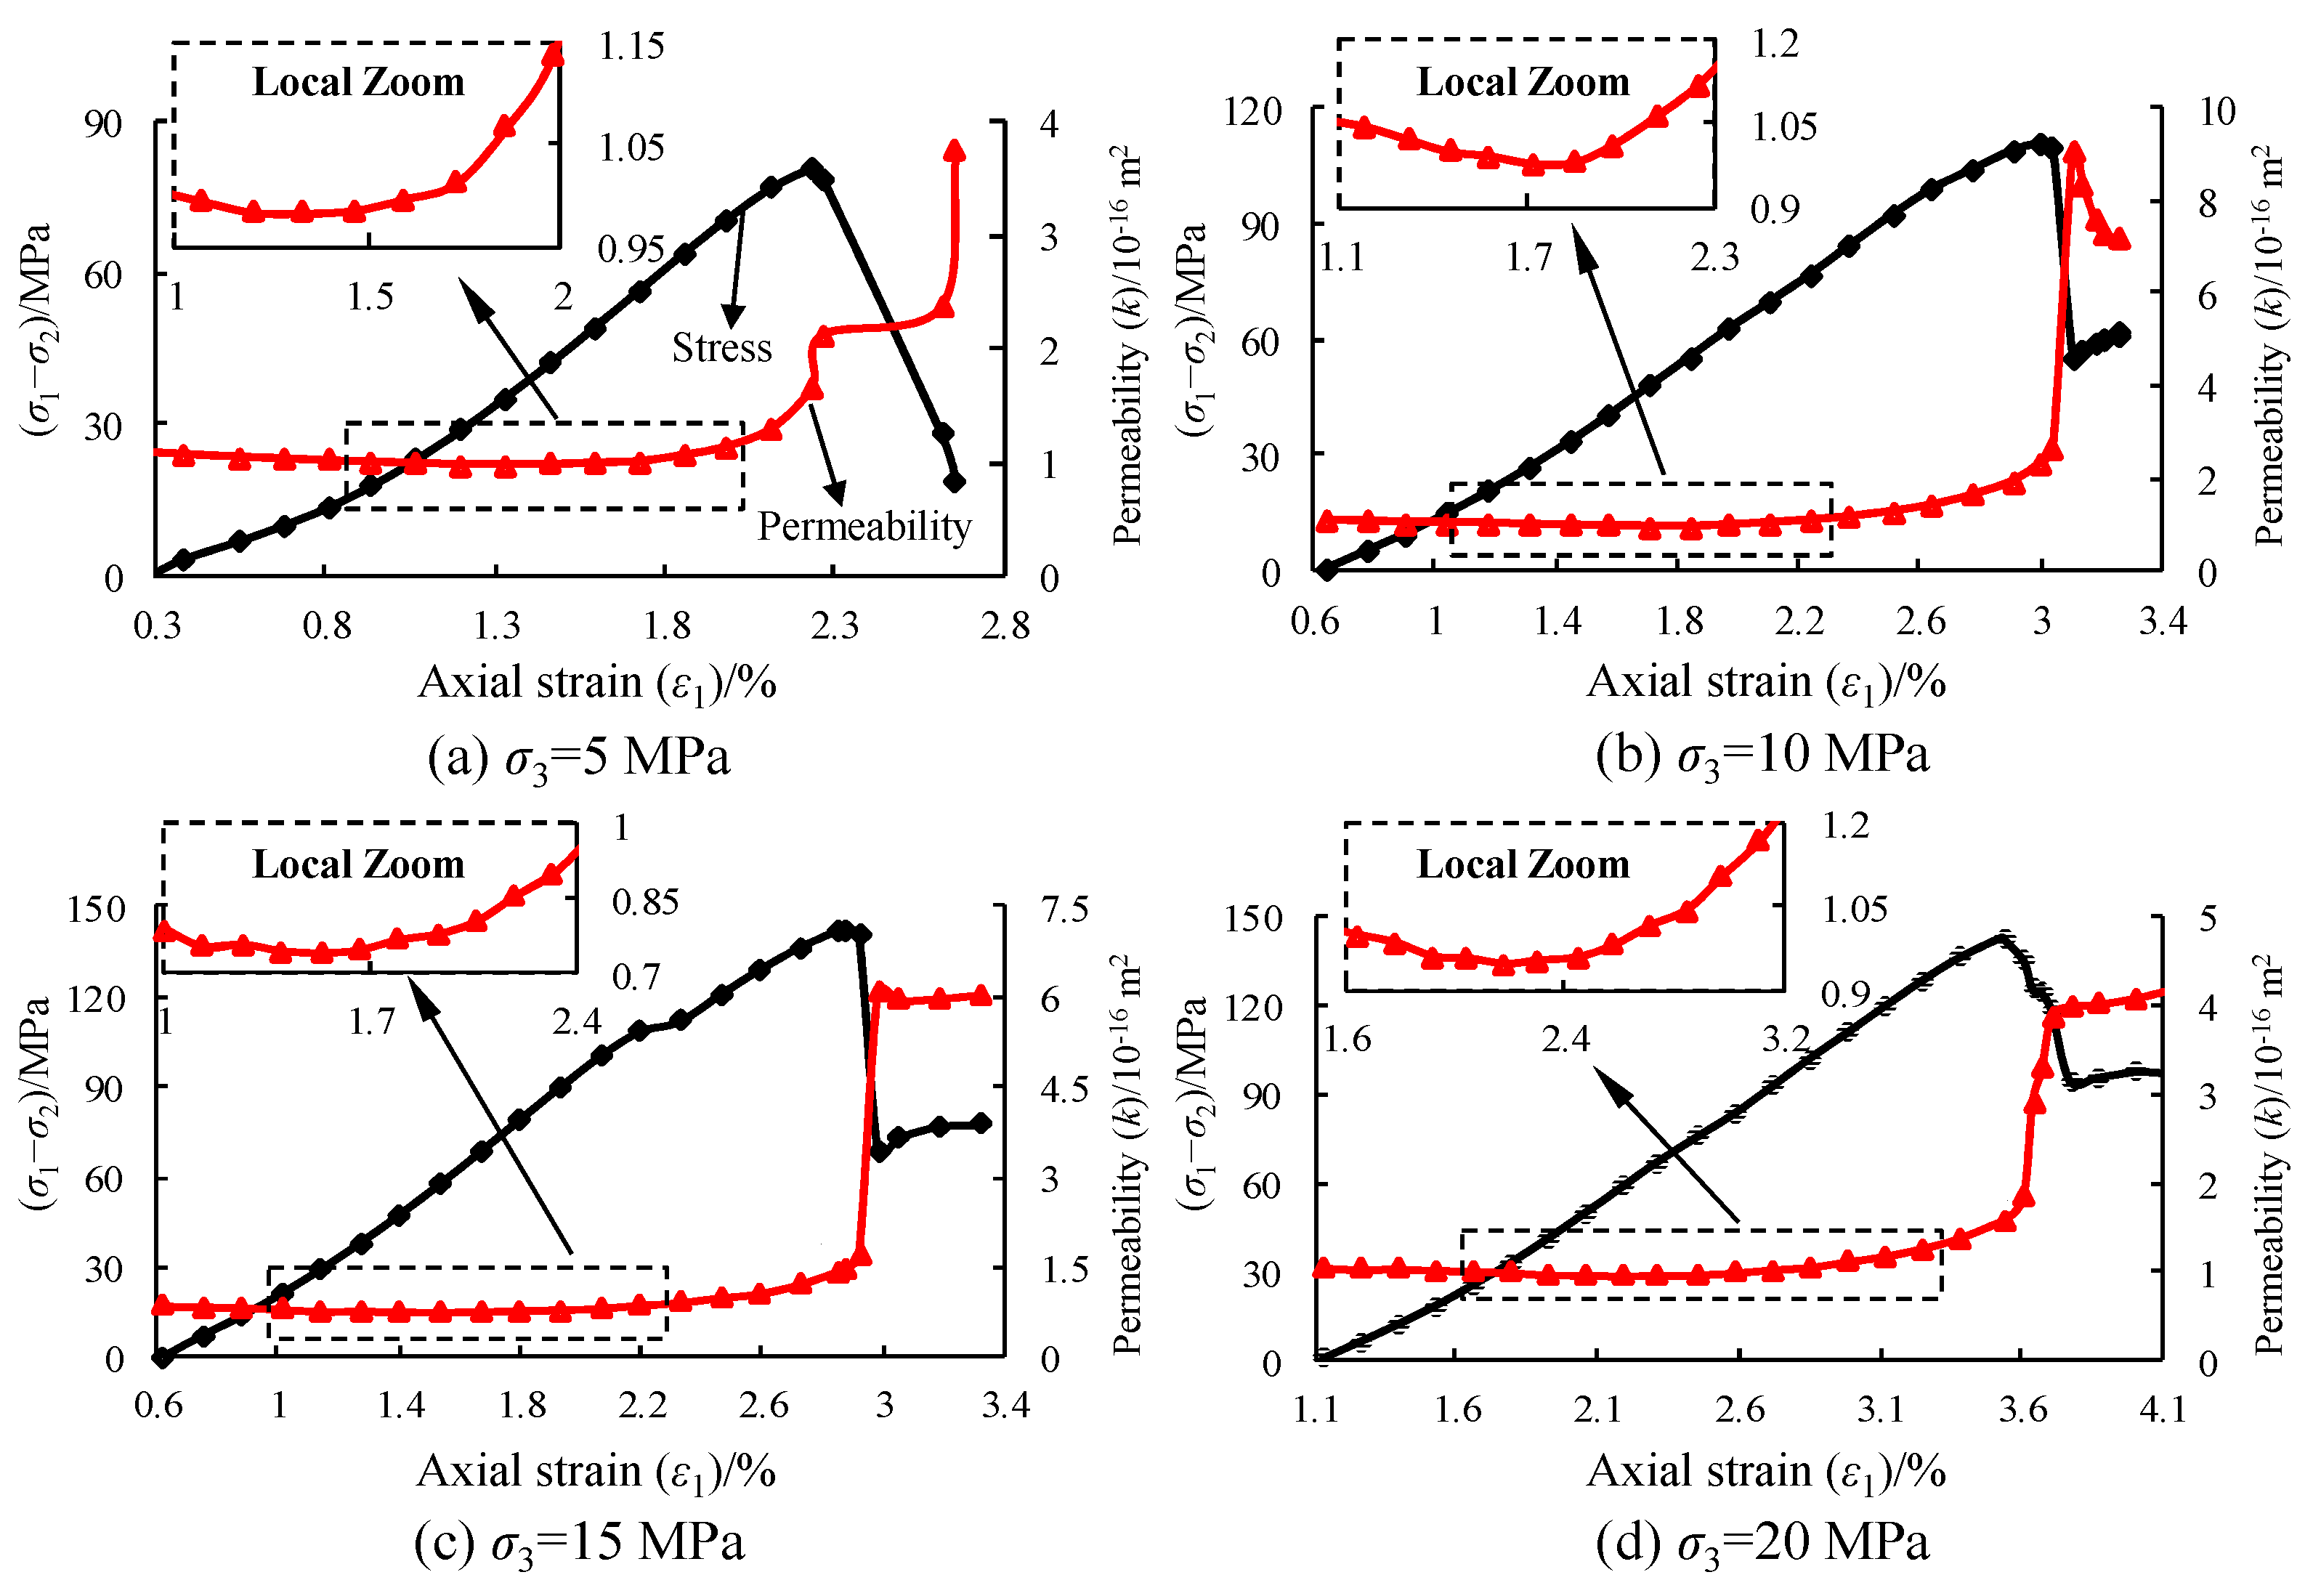
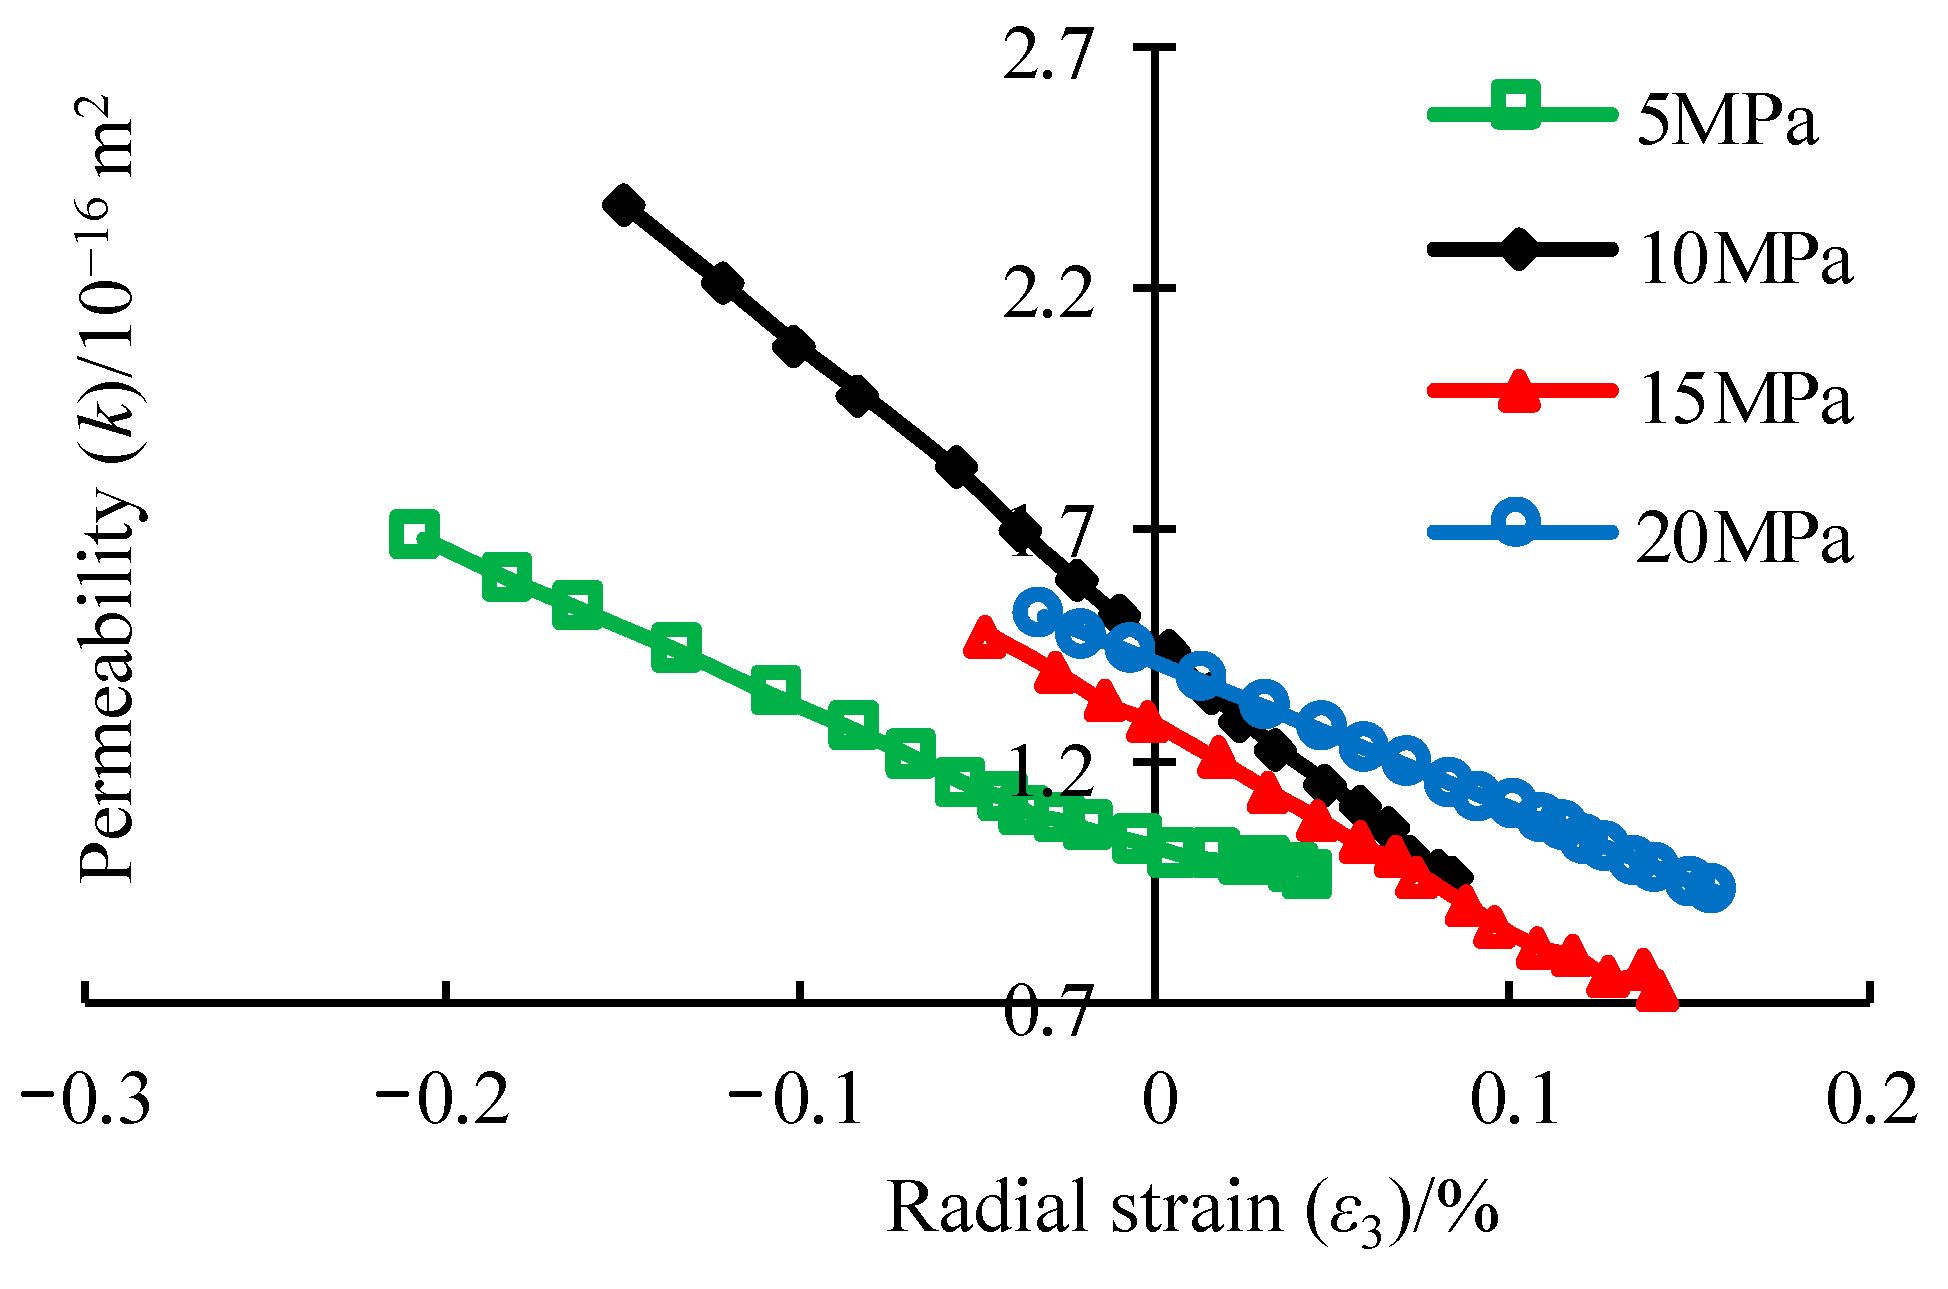
4.1. Measured Sandstone Permeability

The permeability of fracture is usually calculated by Darcy’s law [11]. Zhang and Wang [29] also believe that Darcy’s law is dominant in macro-pores (aperture > 50 nm) and fractures. Wu et al. [30] concluded that the flow rate of 8.33 × 10⁻⁷ m3/s was sufficient to achieve steady-state flow. The magnitude of the gas flow rate measured in our experiment is between 10−4 and 10−5, indicating that the gas flow rate is in a steady state. Therefore, the seepage of CO2 is regarded as an isothermal process and conforms to Darcy’s law. The permeability can be calculated by the following equation.
k = 2 q μ L P 1 / A ( P 1 2 P 2 2 )
where k is the permeability, m2; q is the flow rate of CO2, m3/s; μ is the dynamic viscosity coefficient of CO2, MPa·s; L is the length of specimen, m; P1 is the CO2 pressure at the inlet, MPa; P2 is the CO2 pressure at the outlet, taken as 0.1 MPa; and A is the cross-sectional area of specimen, m2.
The initial, minimum and maximum permeability calculated by Equation (8) are shown in Table 4.

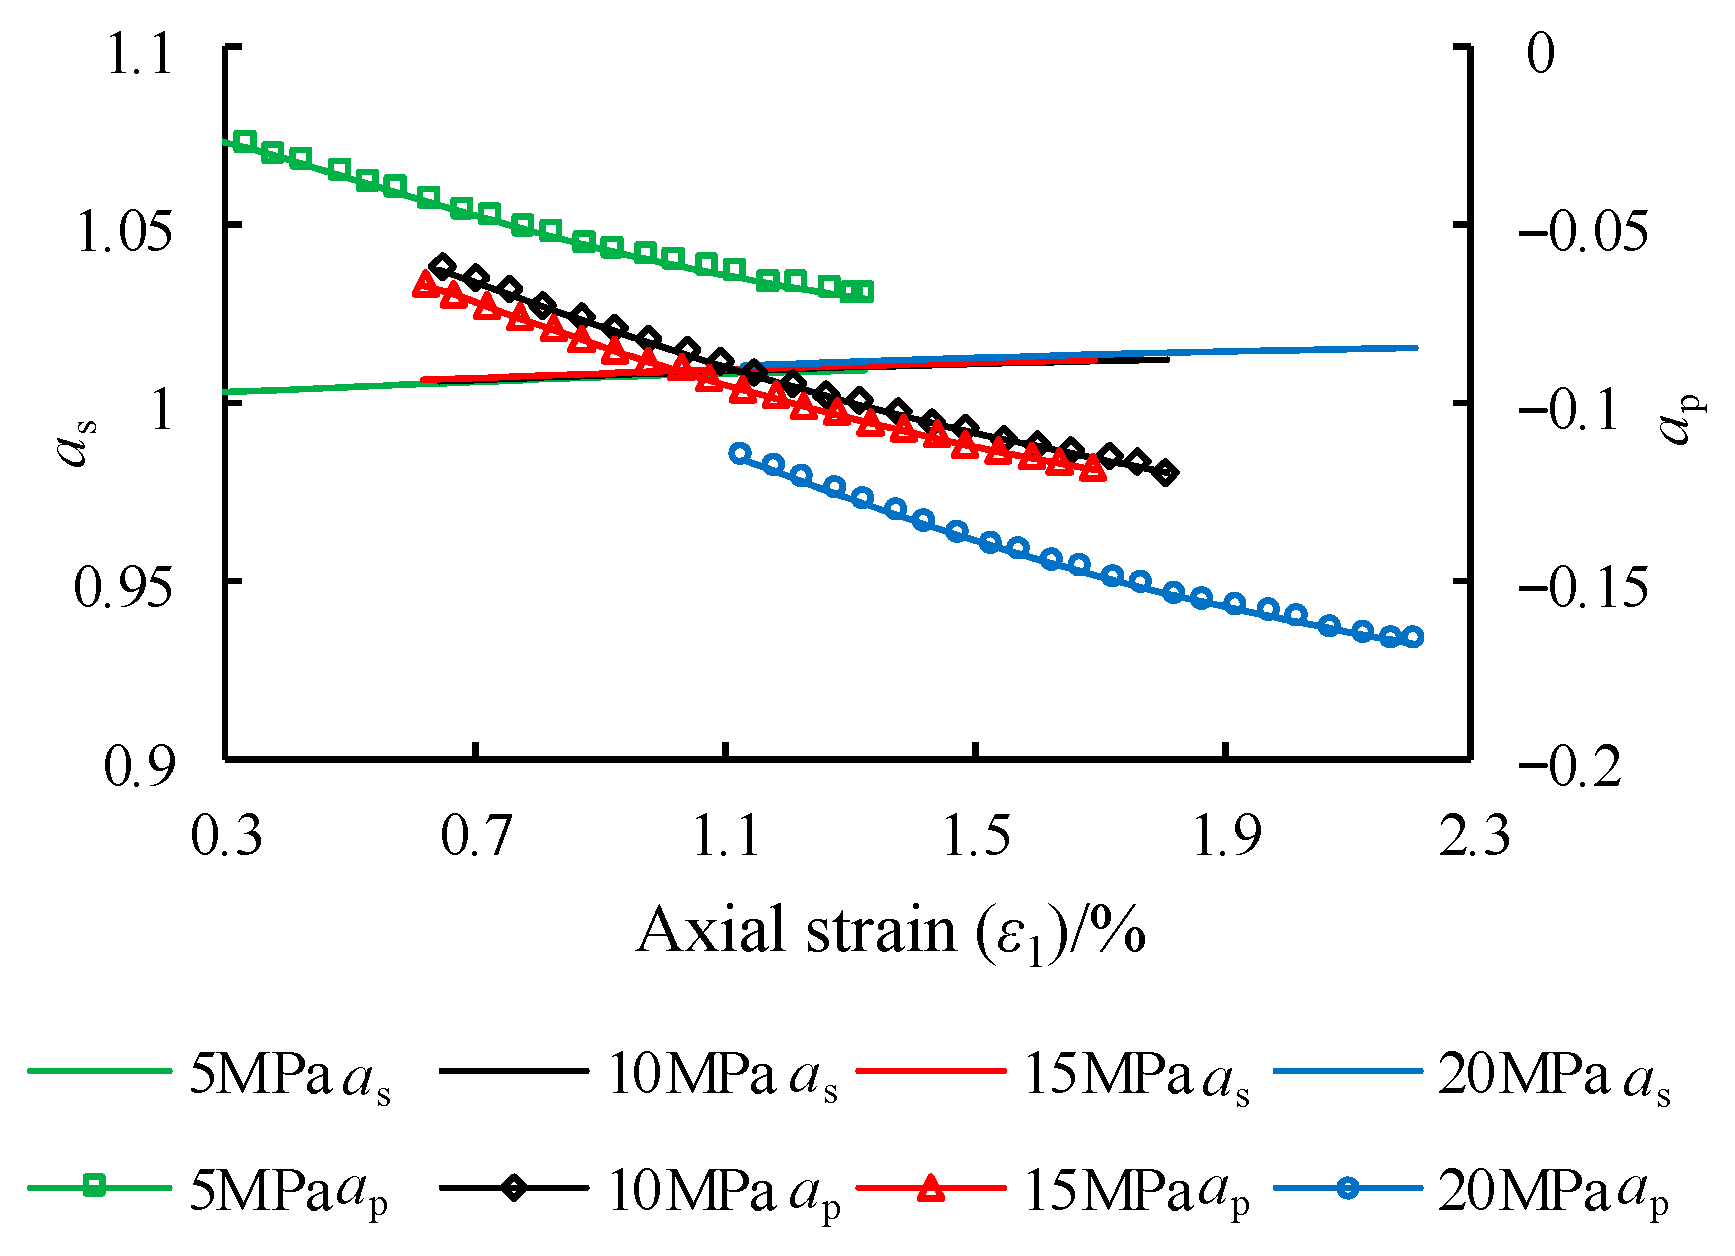
4.2. Permeability Model

Figure 9 shows the relationship between deviatoric stress, permeability, and axial strain of sandstone. From Table 2 and Figure 9, the sandstone permeability first slowly decreases and then increases with the increase in deviatoric stress. The sandstone permeability increases rapidly at the moment of failure and tends to stabilize after reaching the residual strength, which has been verified [12].
The permeability before sandstone failure mainly shows a trend in first decreasing and then increasing under triaxial stress. This is mainly induced by the mechanical competition of solid mineral particle deformation, pore closure, and crack propagation in sandstone. Hu et al. [31] and Cao et al. [32] believed that the mechanical properties of less-stressed or small, deformed rocks are actually in an elastic state due to the existence of a certain threshold for rock damage, and the damage generated inside the rock can be ignored. With the further loading of deviatoric stress, sandstone enters the plastic deformation stage, and its internal cracks continuously form, develop, and connect with each other, which leads to rapid accumulation of damage. Menezes [33] believed that the permeability is more of a strain-sensitive parameter. Yu et al. [12] believed that the seepage of sandstone was mainly induced by the flow of fluid in the pores when the applied stress was lower than the critical permeability strength. When the stress was higher than the strength, the seepage was mainly induced by the flow of fluid in the fracture. Therefore, we derived the strain-induced permeability model by considering the main factors affecting the permeability evolution.

4.2.1. Permeability Decline

At this stage, the stress–strain of sandstone is roughly linear, and the permeability decreases slowly with the increase in axial strain. With the increase in confining pressure, the permeability decreases by 10.1%, 12.6%, 10.7%, and 9.6% at the lowest point, respectively. The number of micropores in sandstone is abundant under low confining pressure or small deformation. Zhong et al. [2] believed that the permeability of micropores in sandstone has the highest sensitivity to ambient stress compared with intergranular pores and dissolved pores. Gehne and Benson [1] believed that the closure of fissure-like pores with low aspect ratio dominates the permeability reduction. Wang et al. [34] believed that the stress sensitivity of microcracks and macropores in sandstone is intense under lower confining pressures (<20 MPa), which significantly affects the permeability evolution. Al-Dughaimi et al. [14] also found that the opening and closing of thin cracks have a great impact on sandstone permeability. The pore structure of tight gas-bearing sandstones usually consists of large pores connected by thin pores, which can be sensitively closed under confining pressure [8,35]. Therefore, it is assumed that the elastic deformation of solid mineral particles and the compressed closure of pores mainly occur inside the sandstone in this stage [36]. Furthermore, the fracture inside the sandstone does not propagate, and its volume relative to that of pore is ignored. This is equivalent to the elliptic cracks represented by aspect ratio inside the rock only having compacted deformations under stress stimulation, thus controlling the seepage behavior, whereas the sliding cracks almost make no contribution to the permeability [22]. Therefore, the rock structure can be simplified, as shown in Figure 10a. The porosity of the experimental sandstone is 4%~6%. The simplified structure shown in Figure 10a is similar to the microscopic profile of the pore structure of the Fontainebleau sandstone, with a porosity of 5.2% [37]. The simplification of this structure is feasible.
The simplified structural model is only composed of solid mineral particles and thin pores. The following expression can be obtained according to the definition of porosity.
φ = V P V B = V P 0 + Δ V P V B 0 + Δ V B = 1 ( 1 φ 0 ) 1 + Δ V S / V S 0 1 + Δ V B / V B 0
where φ is porosity, dimensionless; φ0 is initial porosity, dimensionless; VB is total volume, m3; VP is pore volume, m3; vs. is volume of solid mineral particles, m3; VB0 is initial total volume, m3; VP0 is initial volume of pores, m3; VS0 is initial volume of solid mineral particles, m3; ΔVP is change in pore volume, m3; ΔVB is change in total volume, m3; and ΔVS is change in volume of solid mineral particles, m3.
According to the basic definition of volumetric strain and the customary symbol of strain in rock mechanics, the following equation can be obtained.
ε V = Δ V B V B 0 ε V = Δ V S V S 0
where εV is the apparent volumetric strain, dimensionless; and ε V is the volumetric strain of solid mineral particles, dimensionless.
Equation (10) is substituted into Equation (9) to obtain the expression of porosity with respect to volumetric strain.
φ = 1 ( 1 φ 0 ) 1 ε V 1 ε V
Due to the respective mechanical responses of solid mineral particles and pores to the applied stress, the volume changes in these two parts are different, thus jointly causing the change in rock porosity. David et al. [38] proposed a power law to describe the relationship between rock permeability and porosity induced by mechanical compaction.
k k 0 = ϕ p ϕ p 0 s
where s represents the sensitivity index of pores to changes in ground stress, which is referred to as pore sensitivity index or power law index. For tight and fractured porous rocks, s ≥ 3 [39]. Dong et al. [17] also obtained that s, characterizing the sensitive relationship between permeability and porosity, was between 3 and 5 through sandstone permeability experiment.
Equation (11) is substituted into Equation (12) to obtain the permeability model.
k k 0 = 1 φ 0 3 [ 1 ( 1 φ 0 ) 1 ε V 1 ε V ] 3 = [ 1 ε V 1 ε V + ε V ε V φ 0 ( 1 ε V ) ] 3

4.2.2. Permeability Recovery

The permeability of sandstone in this stage is positively correlated with axial strain in Figure 9, and the permeability at the moment of failure increased by 70.4%, 144.3%, 96.0%, and 67.0%, compared to the minimum. It has the following characteristics: (1) the permeability span of the ascending phase is greater than that of the descending phase; and (2) the permeability span at σ3 = 20 MPa is minimal, which may be related to the increase in porosity within the shear zone subjected to lower confining pressure and the decrease in porosity within the shear zone under high confining pressure [15]. The simplified rock structure model is shown in Figure 10b, which is composed of solid mineral particles and cracks. It is considered that the pores have been compacted, and its impact on permeability is ignored. Due to the continuous initiation, propagation and interpenetration of microcracks, rock damage begins to manifest. This process is accompanied by the volume expansion of sandstone, and ultimately affects the permeability evolution [40].
Permeability evolution can be considered as a function of stress- or strain-type damage [41]. Figure 11 shows the relationship between radial strain and axial strain of sandstone in permeability rising stage. The evolution of slope in the radial strain–axial strain coordinate is in good agreement with the experimental law of gradually accelerating rock damage [42]. Hu et al. [13] believe that the impact of sandstone volume expansion on permeability improvement is not very significant, and only the damage induced by the merger of microcracks would play a decisive role in rock permeability. Therefore, the radial strain was selected as the dependent variable to define the damage variable, D. It is assumed that the sandstone is undamaged at the initiation of the permeability rising stage, satisfying D = 0, and the sandstone is completely damaged at the moment of failure, satisfying D = 1. The expression for D is as follows.
D = 1 ε 3 ε 3 n ε 3 m ε 3 n
where D is the damage variable, dimensionless; ε3 is the instantaneous radial strain, dimensionless; ε3m is the initial radial strain, dimensionless; and ε3n is the radial strain at the peak stress, dimensionless.
From the variation in permeability with radial strain in Figure 12, it can be observed that the permeability of the rising stage is roughly linearly related to radial strain. Given that the damage variable defined in Equation (14) is also linearly related to radial strain, the relationship between permeability and damage variable should also be linear in this stage.
k = k m + D ( k n k m )
where km is the initial permeability of this stage, m2; and kn is the permeability at the peak stress, m2.
Equation (14) is substituted into Equation (15) to obtain the permeability model in rising stage.
k = k m + ( ε 3 m ε 3 ) ( k n k m ) ε 3 m ε 3 n

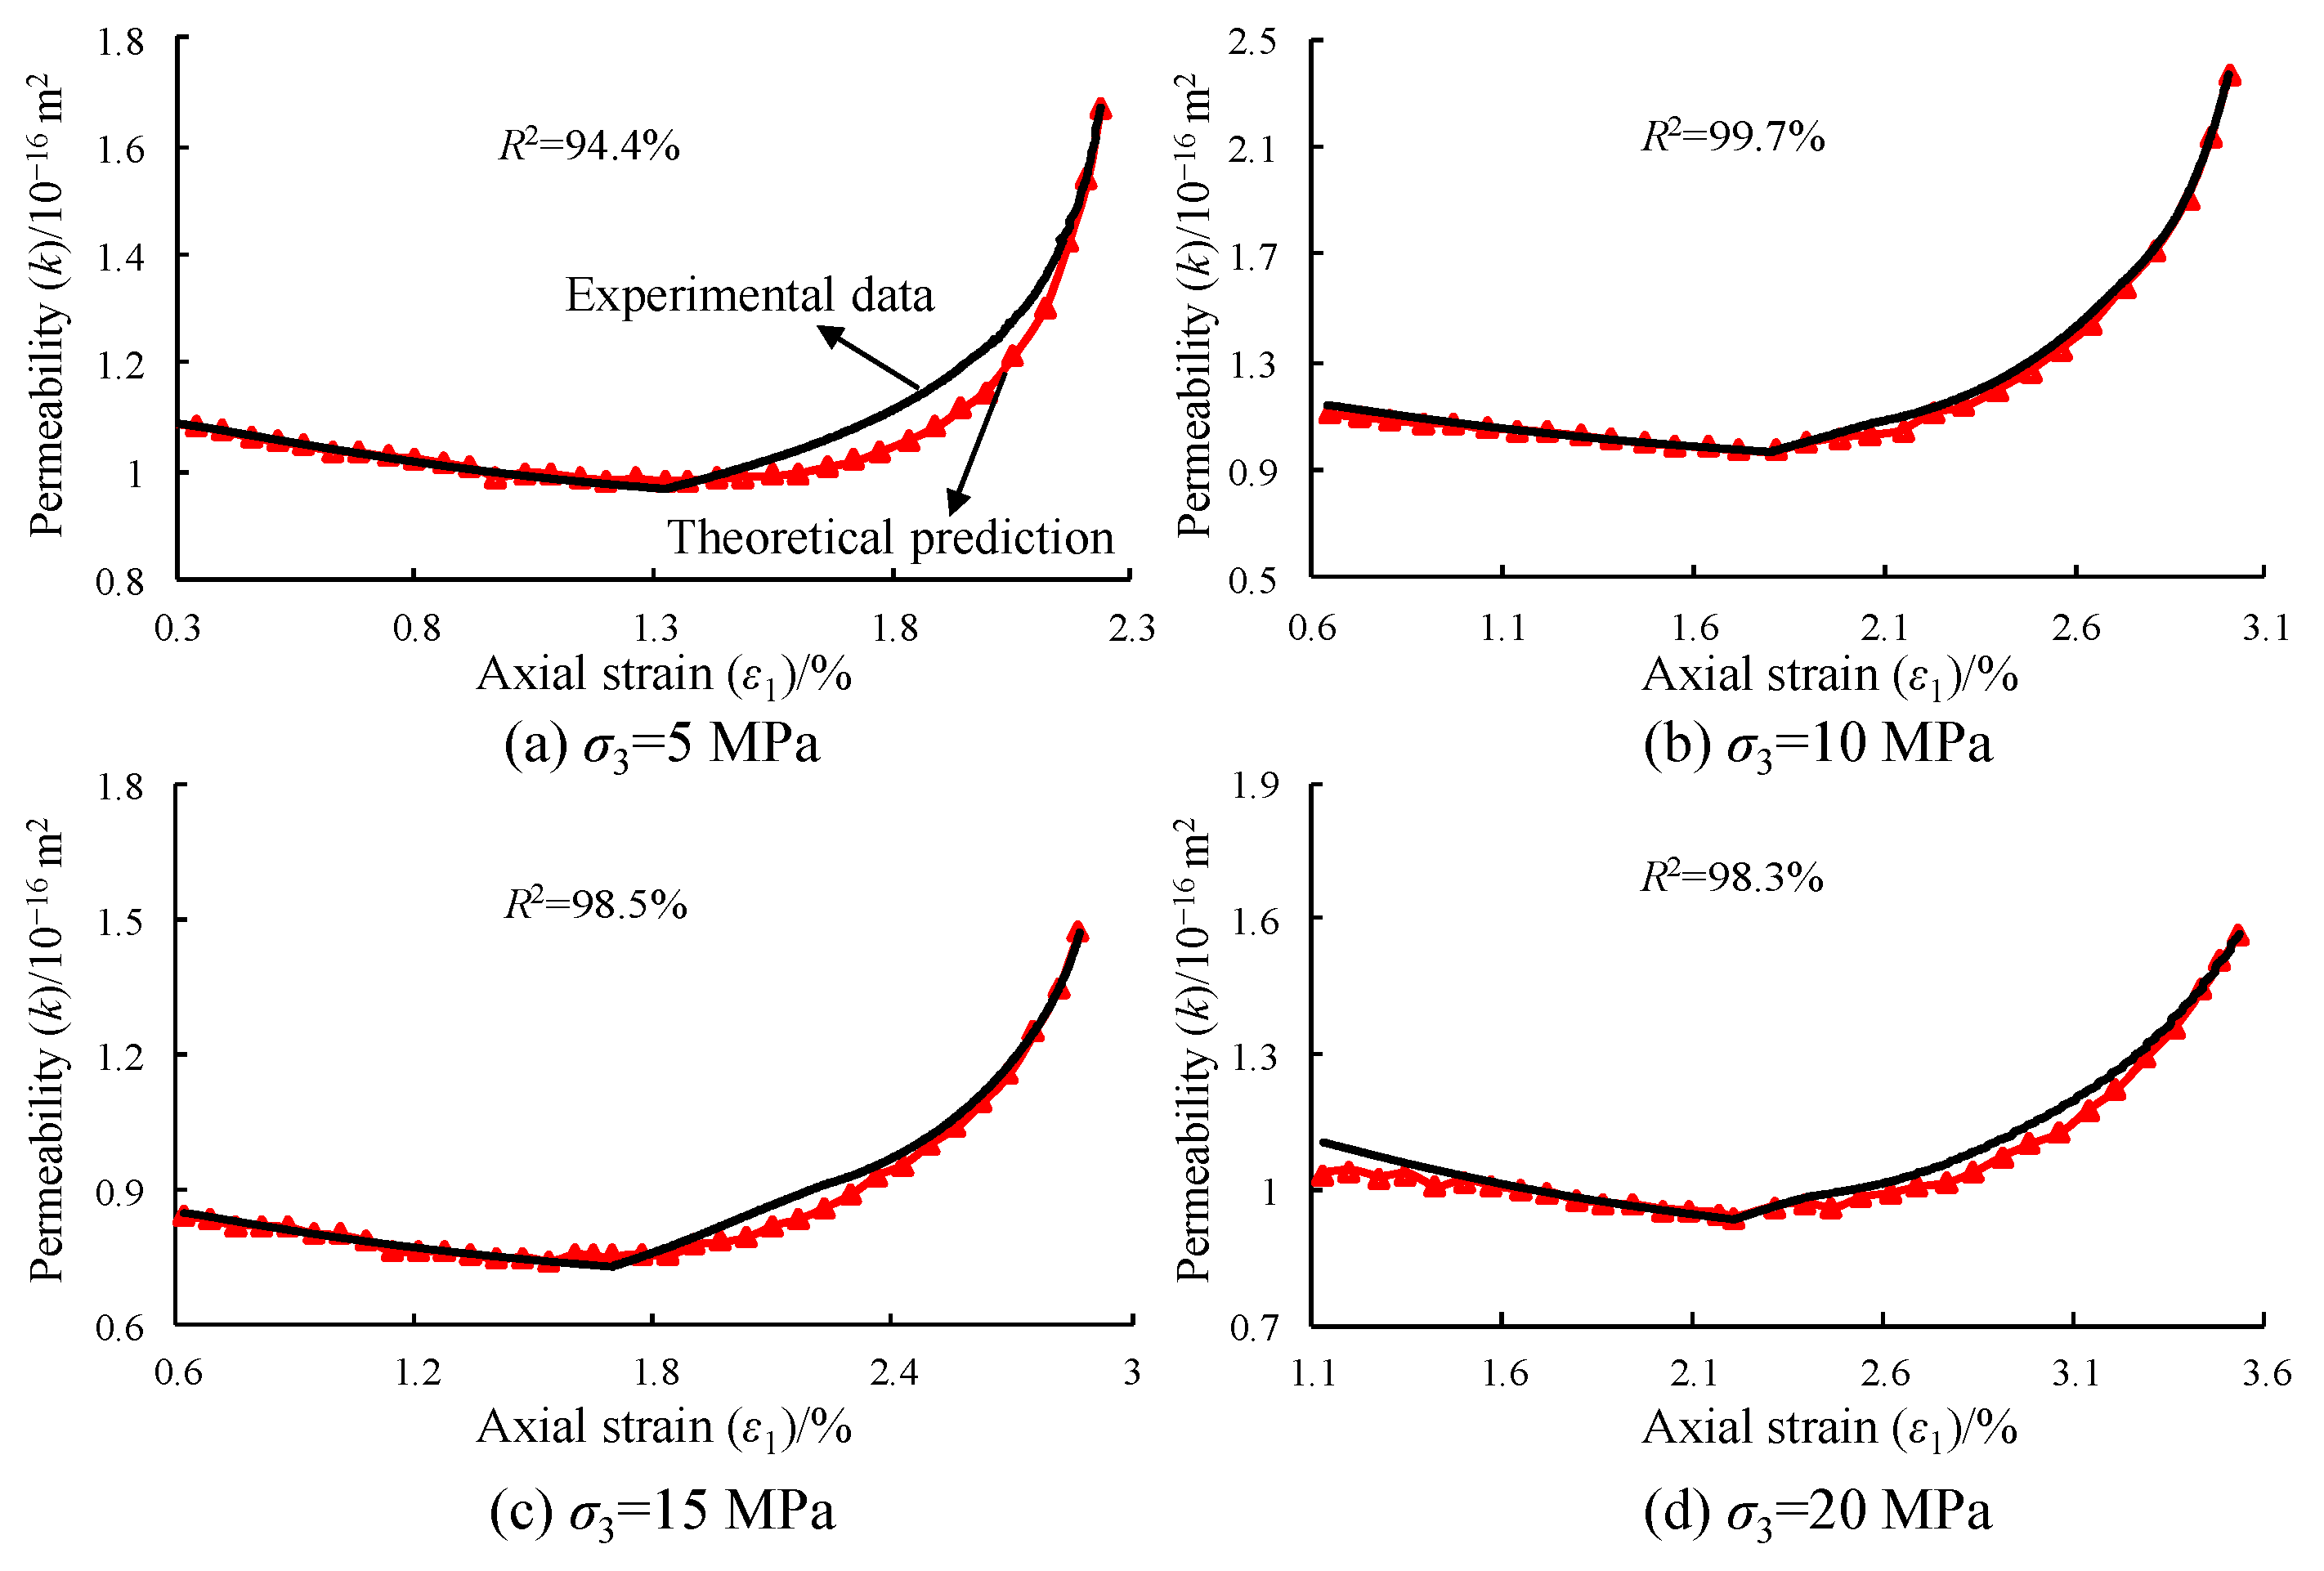
4.3. Permeability Model Verification

The comparison between the calculated permeability and measured permeability is shown in Figure 13. The theoretical calculation is in good agreement with the measured data, with R2 > 90%, indicating that the simplified treatment of rock structure shown in Figure 10 is reasonable. The established permeability model is of high accuracy. Due to the limited number of parameters in the model, it has significance in engineering practice and can provide a certain reference for predicting permeability of sandstone. Although the model is based on sandstone experiments, the theoretical derivation does not involve the unique evolution characteristics of sandstone that differ from other rock properties, except for individual parameters, considering the properties of sandstone itself. Therefore, this model is also suitable for permeability prediction of other rocks.

4.4. Factors Affecting Permeability

It can be inferred from Equations (13) and (16) that the sandstone permeability is not only related to the initial porosity and permeability but also related to the strain response of stressed sandstone. Specifically, the elastic deformation of solid mineral particles and the closure of pores occur mainly in sandstone with decreasing permeability. We defined these two impact factors that control the decrease in permeability and obtained the following equation.
a s = 1 ε V 1 ε V a p = ε V ε V φ 0 ( 1 ε V )
Equation (13) can be rewritten as
k = k 0 ( a s + a p ) 3
The development of as and ap with axial strain was shown in Figure 14. Comparing Equation (17), it is found that as is only related to the appearance volumetric strain of sandstone and the solid mineral particle, which is considered to be the permeability evolution factor induced by the deformation of solid mineral particles. as is slightly greater than 1, indicating that the deformation of solid mineral particles leads to a trivial increase in permeability, and the overall effect is relatively small. ap is considered to be a permeability evolution factor induced by pore compression. The calculation shows that ap < 1, and it continuously decreases with the increase in axial strain, indicating that the closure of pore leads to a decrease in permeability. Pore compaction is the main factor in dominating permeability evolution at this stage.
Irreversible damage accumulation occurs in sandstone during the permeability recovery period, which is mainly manifested as the elastic–plastic deformation of solid mineral particles and the initiation, propagation, and interpenetration of cracks. At this stage, it is assumed that the pores in sandstone have been compacted, and the permeability evolution induced by the elastic–plastic deformation of solid mineral particles can be characterized by the absolute value of the percentage in changing volumetric strain. In addition, according to the definition of damage variables (Equation (14)), permeability evolution induced by sandstone damage can be reflected by the absolute value of the percentage in changing radial strain. The absolute values of the percentage in changing radial strain and volumetric strain with axial strain under different confining pressures are shown in Figure 15. It can be found that the span of radial strain is larger than that of the volumetric strain in this stage, indicating that the fracture development caused by accumulated damage of sandstone is the main factor triggering changes in permeability.

5. Conclusions

Under different confining pressures, the permeability recovery and dilatancy characteristics of sandstone in the plastic stage have not been agreed. Based on this, the deformation behavior and permeability evolution of sandstone subjected to different confining pressures were investigated by conducting conventional triaxial seepage tests. The following conclusions were drawn:
(1)
The gas-bearing sandstones showed evident brittle properties, and the failure mode was characterized by tensile–shear compounding. The bi-logarithmic model can better characterize the confining pressure dependence of sandstone strength.
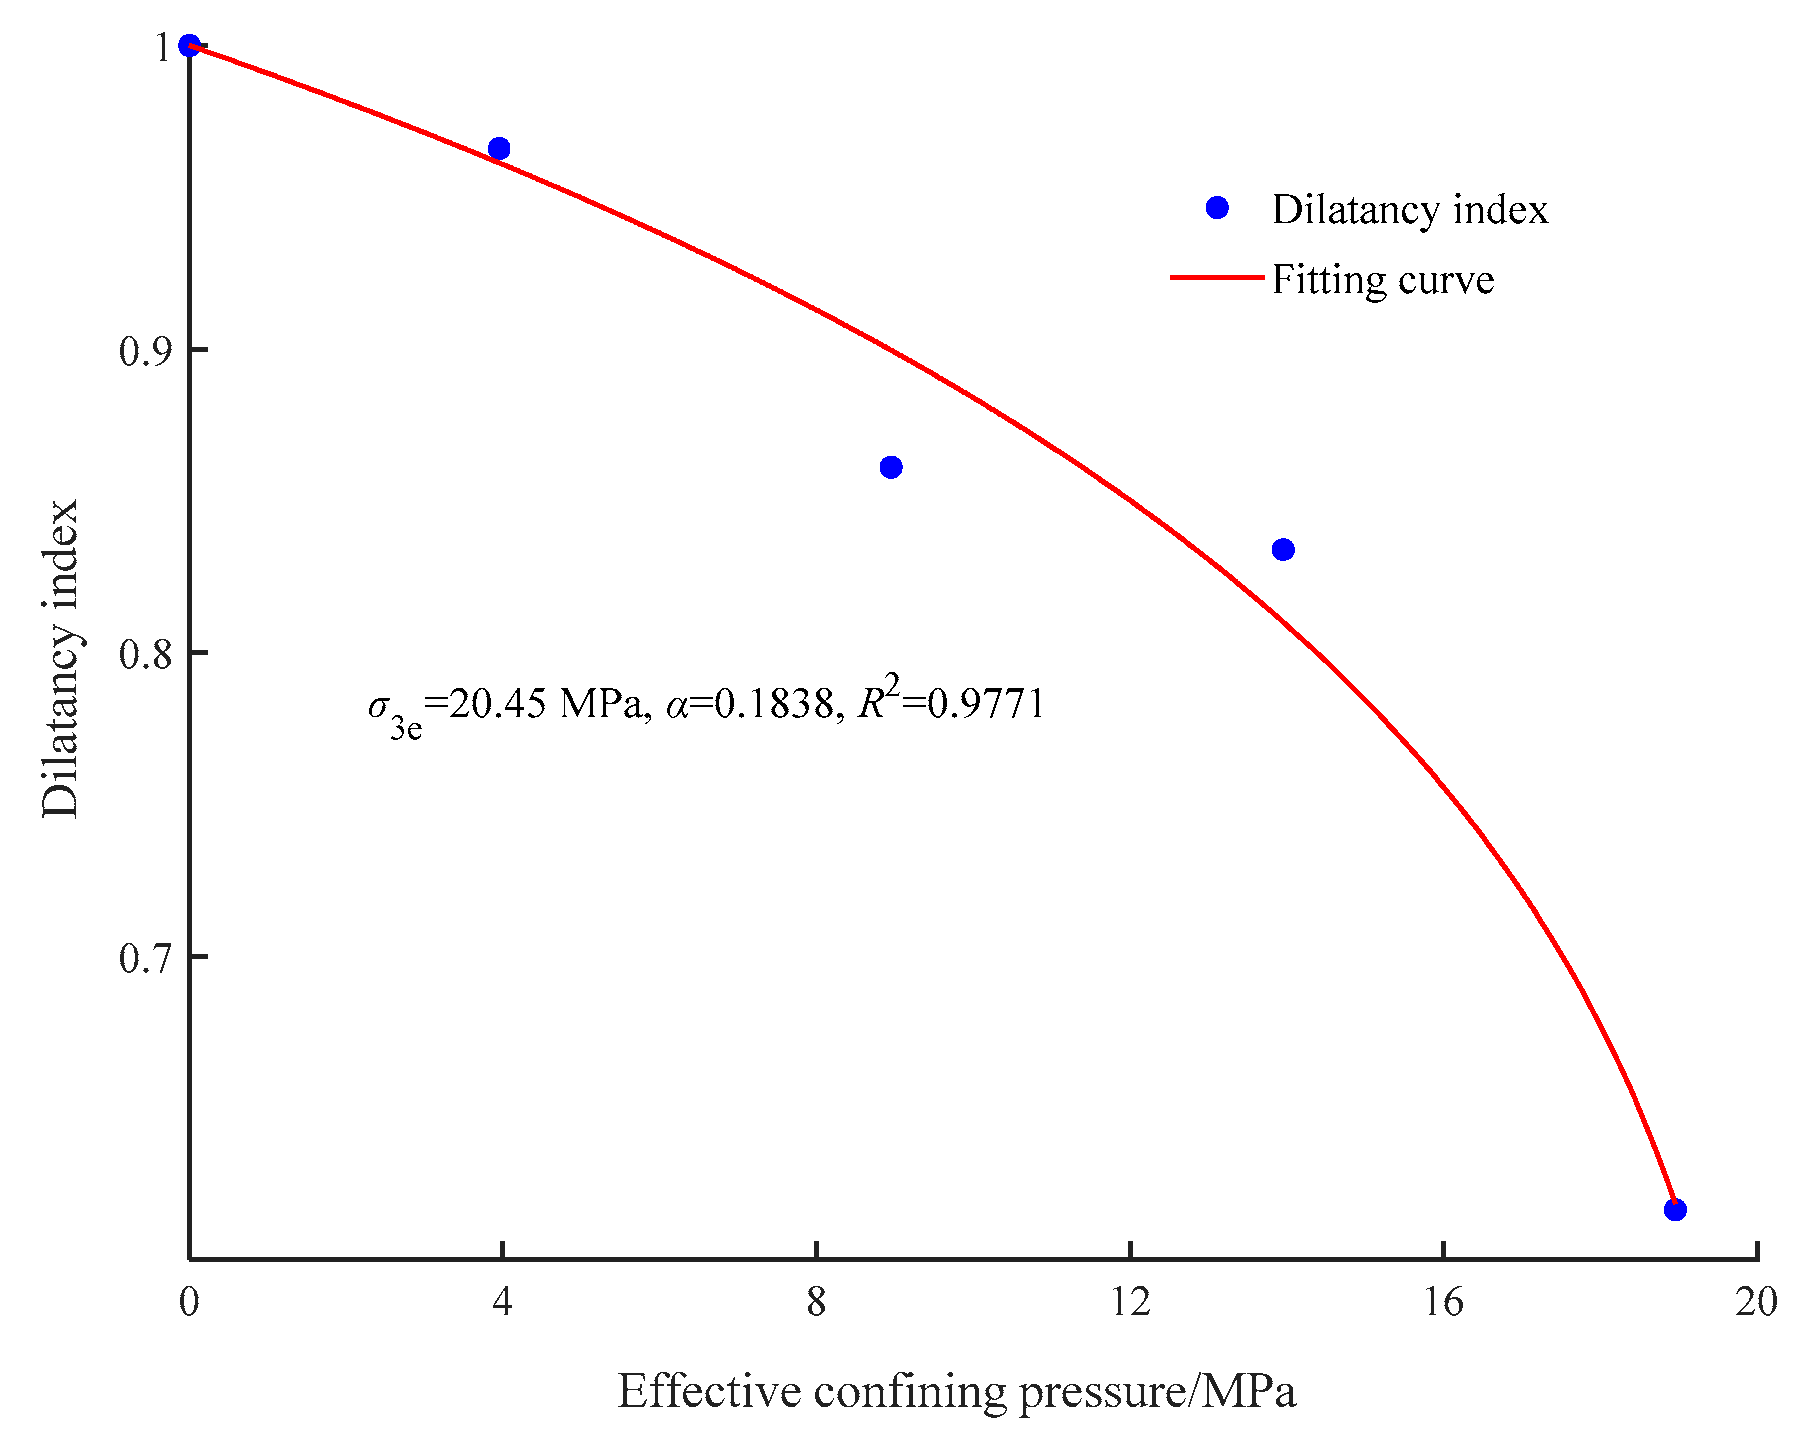
(2)
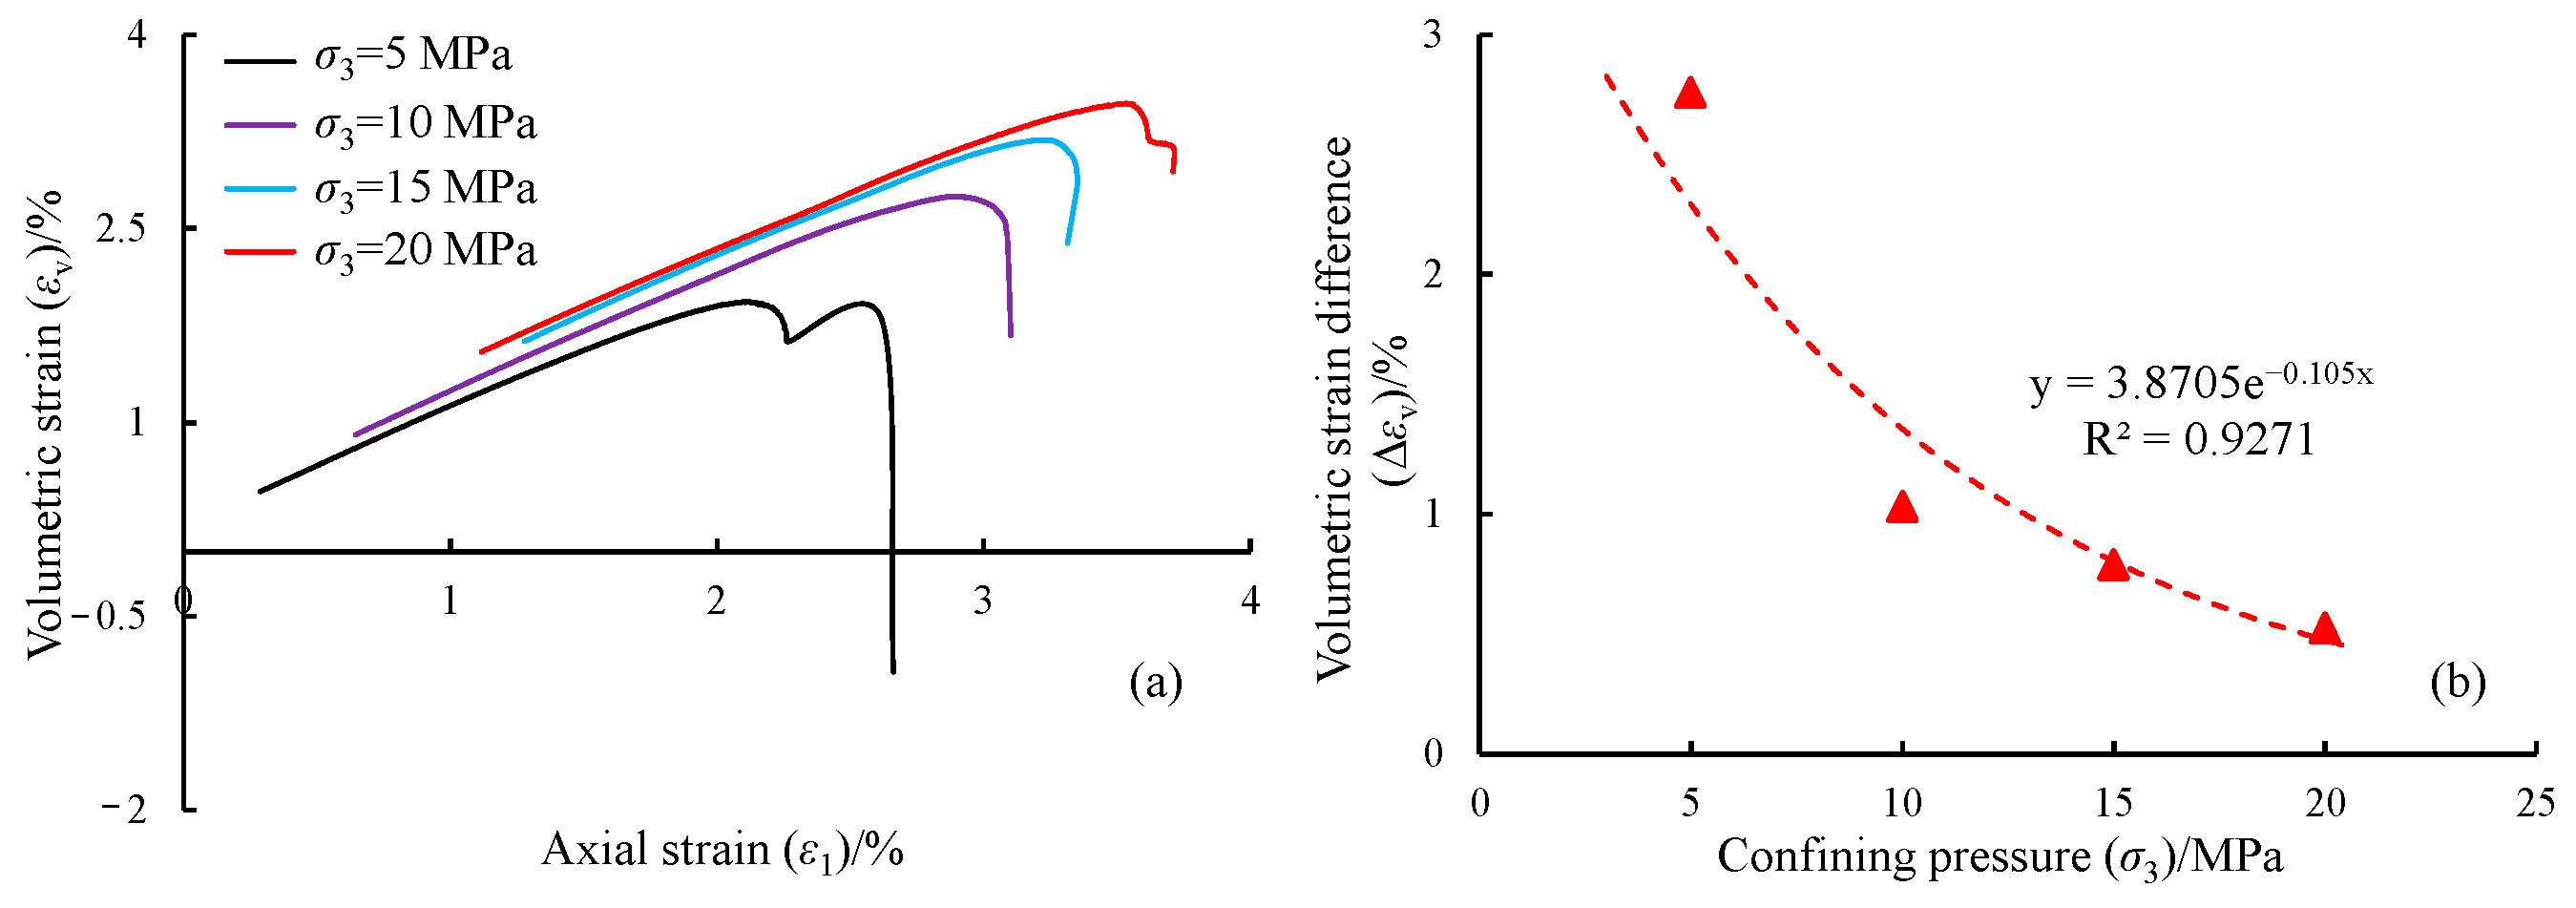
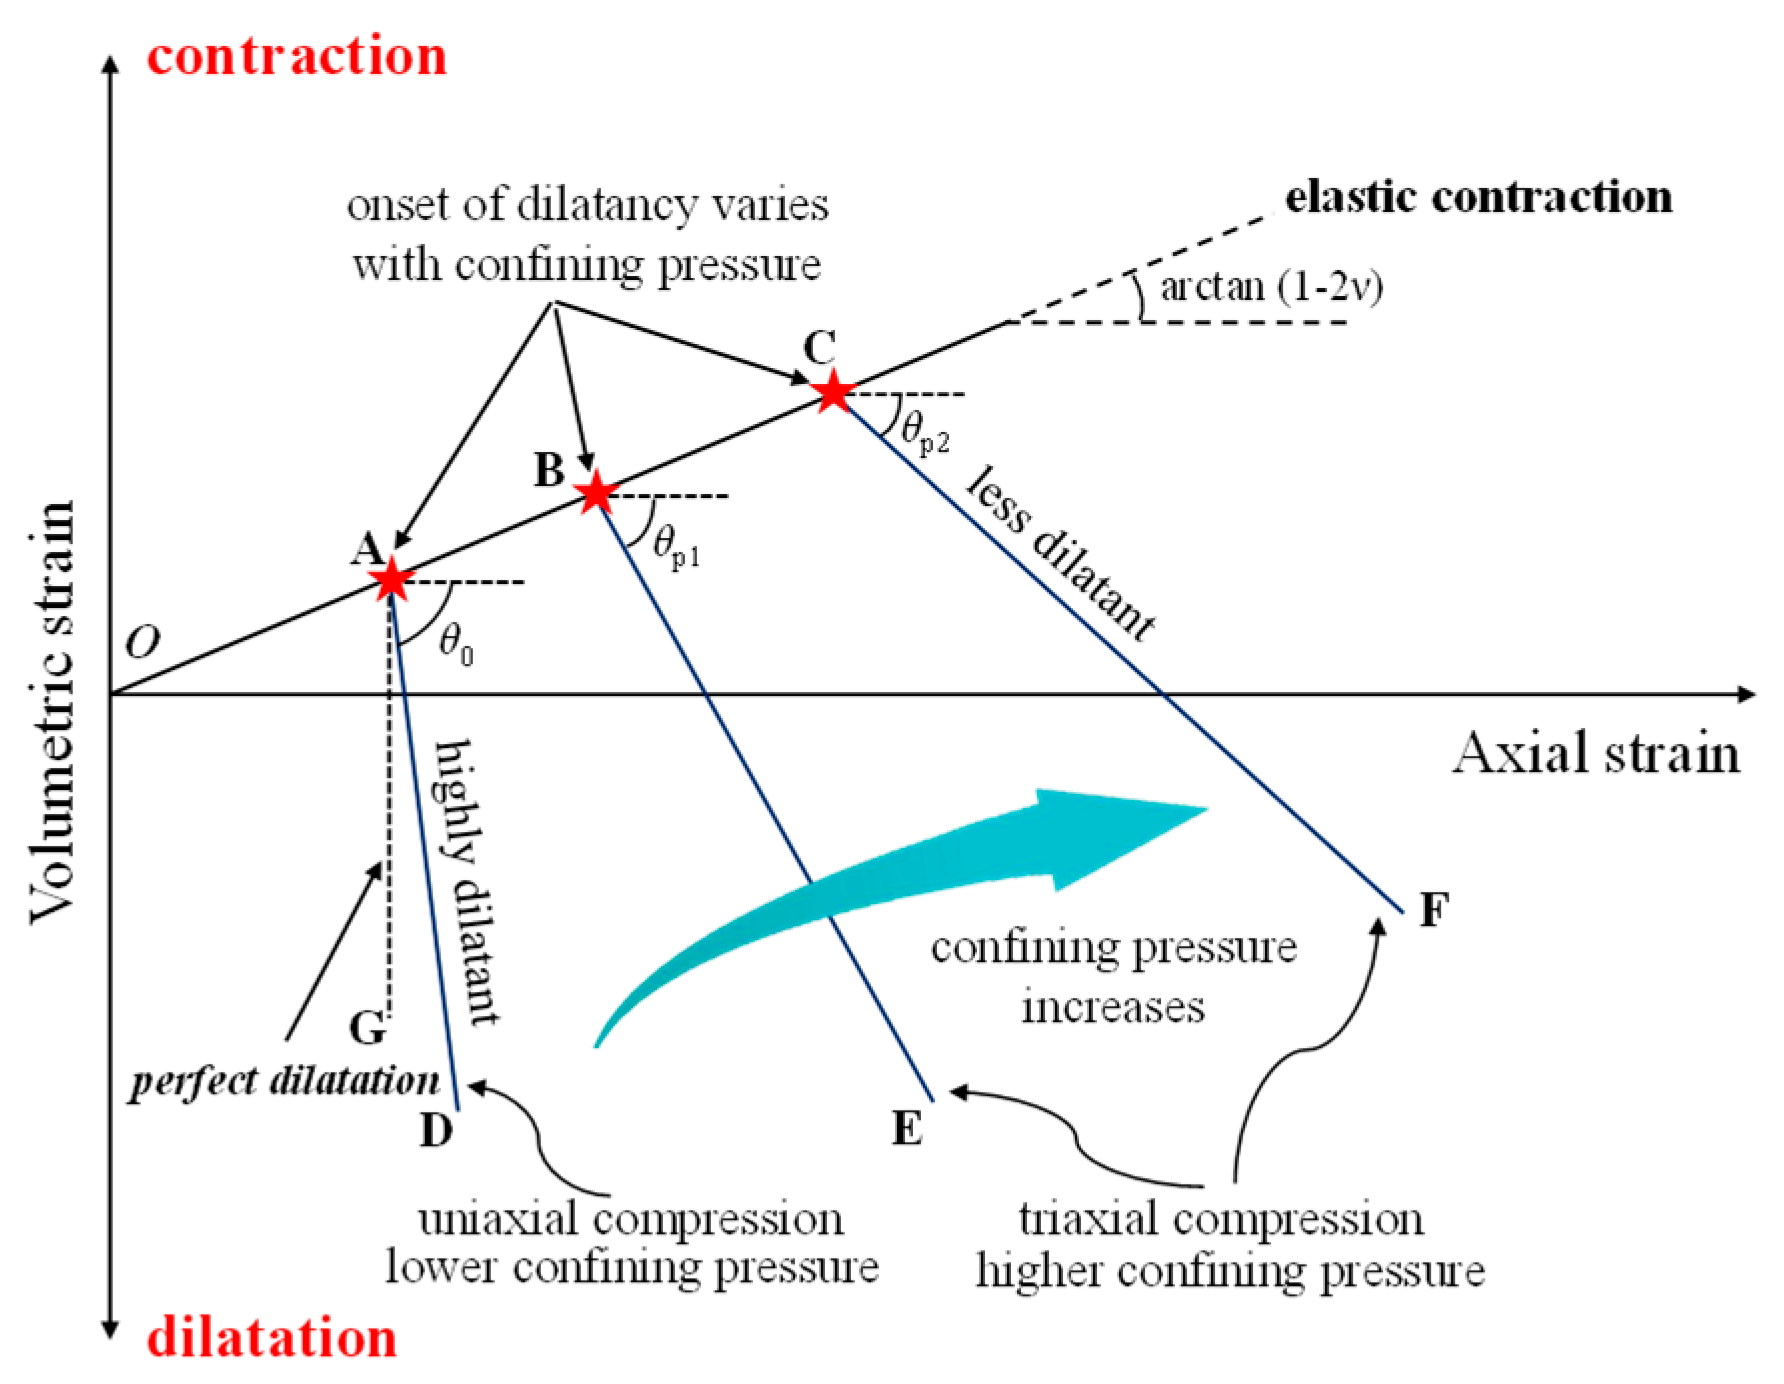
In the fluid–solid coupling environment, the dilatancy capacity of sandstone at the moment of stress drop decreases exponentially with the increasing confining pressure, and the dilatancy index Id decreases as a power function.
(3)
Under different confining pressures, the sandstone permeability decreases, induced by the elastic deformation of solid mineral particles, and the closure of pores is less than that of the dilatancy-induced permeability recovery.
(4)
A simple permeability model with volumetric strain and radial strain as independent variables was established in the decreasing and rising stages of permeability, respectively. This model showed the important role of pore compaction and crack propagation on permeability and could better reflect the whole-process evolution of permeability.

Author Contributions

Data curation, C.L.; Formal analysis, Y.L.; Funding acquisition, C.L. and Y.L.; Investigation, B.Y.; Methodology, C.L. and Y.L.; Resources, B.Y.; Validation, Z.X.; Visualization, C.L.; Writing—Original draft, C.L.; Writing—Review and editing, C.L., Y.L. and Z.X. All authors have read and agreed to the published version of the manuscript.

Funding

This research was funded by National Natural Science Foundation of China [52304265], Natural Science Foundation of Jiangsu Province [BK20221121], State Key Laboratory of Mining Disaster Prevention and Control (Shandong University of Science and Technology) and Ministry of Education [JMDPC202301].

Institutional Review Board Statement

Not applicable.

Informed Consent Statement

Not applicable.

Data Availability Statement

Data are available at [email protected].

Conflicts of Interest

The authors declare that they have no known competing financial interest or personal relationships that could have appeared to influence the work reported in this paper.

References

  1. Gehne, S.; Benson, P.M. Permeability and permeability anisotropy in crab orchard sandstone: Experimental insights into spatio-temporal effects. Tectonophysics 2017, 712–713, 589–599. [Google Scholar] [CrossRef]
  2. Zhong, X.; Zhu, Y.; Liu, L.; Yang, H.; Li, Y.; Xie, Y.; Liu, L. The characteristics and influencing factors of permeability stress sensitivity of tight sandstone reservoirs. J. Pet. Sci. Eng. 2020, 191, 107221. [Google Scholar] [CrossRef]
  3. Wang, Y.; Jeannin, L.; Agostini, F.; Dormieux, L.; Skoczylas, F.; Portier, E. Experimental study and micromechanical interpretation of the poroelastic behaviour and permeability of a tight sandstone. Int. J. Rock Mech. Min. Sci. 2018, 103, 89–95. [Google Scholar] [CrossRef]
  4. Li, Q.; Han, Y.; Liu, X.; Ansari, U.; Cheng, Y.; Yan, C. Hydrate as a by-product in CO2 leakage during the long-term sub-seabed sequestration and its role in preventing further leakage. Environ. Sci. Pollut. Res. 2022, 29, 77737–77754. [Google Scholar] [CrossRef]
  5. Li, Q.; Wang, F.; Wang, Y.; Forson, K.; Cao, L.; Zhang, C.; Zhou, C.; Zhao, B.; Chen, J. Experimental investigation on the high-pressure sand suspension and adsorption capacity of guar gum fracturing fluid in low-permeability shale reservoirs: Factor analysis and mechanism disclosure. Environ. Sci. Pollut. Res. 2022, 29, 53050–53062. [Google Scholar] [CrossRef]
  6. Wang, F.; Xiao, Z.; Liu, X.; Ren, J.; Xing, T.; Li, Z.; Li, X.; Chen, Y. Strategic design of cellulose nanofibers@zeolitic imidazolate frameworks derived mesoporous carbon-supported nanoscale CoFe2O4/CoFe hybrid composition as trifunctional electrocatalyst for Zn-air battery and self-powered overall water-splitting. J. Power Source 2022, 521, 230925. [Google Scholar] [CrossRef]
  7. Yan, W.; Sun, J.; Dong, H.; Cui, L. Investigating NMR-based absolute and relative permeability models of sandstone using digital rock techniques. J. Pet. Sci. Eng. 2021, 207, 109105. [Google Scholar] [CrossRef]
  8. Zhang, R.; Ning, Z.; Yang, F.; Zhao, H.; Wang, Q. A laboratory study of the porosity-permeability relationships of shale and sandstone under effective stress. Int. J. Rock Mech. Min. Sci. 2016, 81, 19–27. [Google Scholar] [CrossRef]
  9. Nguyen, V.H.; Gland, N.; Dautriat, J.; David, C.; Wassermann, J.; Guélard, J. Compaction, permeability evolution and stress path effects in unconsolidated sand and weakly consolidated sandstone. Int. J. Rock Mech. Min. Sci. 2014, 67, 226–239. [Google Scholar] [CrossRef]
  10. Wang, F.; Yang, K.; You, J.; Lei, X. Analysis of pore size distribution and fractal dimension in tight sandstone with mercury intrusion porosimetry. Results Phys. 2019, 13, 102283. [Google Scholar] [CrossRef]
  11. Lu, J.; Yin, G.; Li, X.; Li, M.; Zhang, D.; Zhang, W.; Kang, Q. Deformation and CO2 gas permeability response of sandstone to mean and deviatoric stress variations under true triaxial stress conditions. Tunn. Undergr. Space Technol. 2019, 84, 259–272. [Google Scholar] [CrossRef]
  12. Yu, J.; Yao, W.; Duan, K.; Liu, X.; Zhu, Y. Experimental study and discrete element method modeling of compression and permeability behaviors of weakly anisotropic sandstones. Int. J. Rock Mech. Min. Sci. 2020, 134, 104437. [Google Scholar] [CrossRef]
  13. Hu, D.W.; Zhou, H.; Zhang, F.; Shao, J.F. Evolution of poroelastic properties and permeability in damaged sandstone. Int. J. Rock Mech. Min. Sci. 2010, 47, 962–973. [Google Scholar] [CrossRef]
  14. Al-Dughaimi, S.; Muqtadir, A.; Alzaki, T.; Dvorkin, J. Stress dependence of elastic and transport properties in tight gas sandstones. J. Pet. Sci. Eng. 2021, 196, 108001. [Google Scholar] [CrossRef]
  15. Sulem, J.; Ouffroukh, H. Shear-banding in drained and undrained triaxial tests on a saturated sandstone: Porosity and permeability evolution. Int. J. Rock Mech. Min. Sci. 2006, 43, 292–310. [Google Scholar] [CrossRef]
  16. Zisser, N.; Nover, G. Anisotropy of permeability and complex resistivity of tight sandstones subjected to hydrostatic pressure. J. Appl. Geophys. 2009, 68, 356–370. [Google Scholar] [CrossRef]
  17. Dong, J.; Hsu, J.; Wu, W.; Shimamoto, T.; Hung, J.; Yeh, E.; Wu, Y.; Sone, H. Stress-dependence of the permeability and porosity of sandstone and shale from TCDP Hole-A. Int. J. Rock Mech. Min. Sci. 2010, 47, 1141–1157. [Google Scholar] [CrossRef]
  18. Hu, C.; Jia, Y.; Duan, Z. Pore and permeability properties of reservoir sandstone under a uniaxial compression CT test. J. Nat. Gas Sci. Eng. 2022, 104, 104666. [Google Scholar] [CrossRef]
  19. Li, X.; Duan, K.; Zhang, Q.; Li, J.; Zhang, R.; Wang, L. Investigation of the permeability anisotropy of porous sandstone induced by complex stress conditions. Comput. Geotech. 2023, 157, 105309. [Google Scholar] [CrossRef]
  20. Wang, F.; Cheng, H. Effect of tortuosity on the stress-dependent permeability of tight sandstones: Analytical modelling and experimentation. Mar. Pet. Geol. 2020, 120, 104524. [Google Scholar] [CrossRef]
  21. Chen, D.; Pan, Z.; Ye, Z.; Hou, B.; Wang, D.; Yuan, L. A unified permeability and effective stress relationship for porous and fractured reservoir rocks. J. Nat. Gas Sci. Eng. 2016, 29, 401–412. [Google Scholar] [CrossRef]
  22. Moss, W.C.; Gupta, Y.M. A constitutive model describing dilatancy and cracking in brittle rocks. J. Geophys. Res. 1982, 87, 2985–2998. [Google Scholar] [CrossRef]
  23. Yuan, S.C.; Harrison, J.P. An empirical dilatancy index for the dilatant deformation of rock. Int. J. Rock Mech. Min. Sci. 2004, 41, 679–686. [Google Scholar] [CrossRef]
  24. Bésuelle, P.; Desrues, J.; Raynaud, S. Experimental characterisation of the localisation phenomenon inside a Vosges sandstone in a triaxial cell. Int. J. Rock Mech. Min. Sci. 2000, 37, 1223–1237. [Google Scholar] [CrossRef]
  25. Mahmutoglu, Y.; Vardar, M. Effects of inelastic volume increase on fractured rock behaviour. Bull. Eng. Geol. Environ. 2003, 62, 117–121. [Google Scholar] [CrossRef]
  26. David, E.C.; Brantut, N.; Schubnel, A.; Zimmerman, R.W. Sliding crack model for nonlinearity and hysteresis in the uniaxial stress–strain curve of rock. Int. J. Rock Mech. Min. Sci. 2012, 52, 9–17. [Google Scholar] [CrossRef]
  27. Lu, J.; Xie, H.; Li, M.; Li, C.; Gao, M.; Shang, D.; Li, J. Effect of microwave radiation on mechanical behaviors of tight fine sandstone subjected to true triaxial stress. Int. J. Rock Mech. Min. Sci. 2022, 152, 105063. [Google Scholar] [CrossRef]
  28. Wang, Z.; Zhang, Z. On the physical significance of the third invariant of stress deviator J3 and the third invariant of stress tensor I3 and their geometric significance in the space of principal stresses. J. Harbin Inst. Technol. 1982, 2, 110–115. [Google Scholar]
  29. Zhang, W.; Wang, Q. Permeability anisotropy and gas slippage of shales from the Sichuan Basin in South China. Int. J. Coal Geol. 2018, 194, 22–32. [Google Scholar] [CrossRef]
  30. Wu, W.; Reece, J.S.; Gensterblum, Y.; Zoback, M.D. Permeability evolution of slowly slipping faults in shale reservoirs. Geophys. Res. Lett. 2017, 44, 11368–11375. [Google Scholar] [CrossRef]
  31. Hu, D.; Zhou, H.; Pan, P.; Zhang, K.; Shao, J.; Feng, X. Study of permeability of sandstone in triaxial cyclic stress tests. Rock Soil Mech. 2010, 31, 2749–2754. [Google Scholar]
  32. Cao, W.; Zhao, H.; Zhang, L.; Zhang, Y. Damage statistical softening constitutive model for rock considering effect of damage threshold and its parameters determination method. Chin. J. Rock Mech. Eng. 2008, 27, 1148–1154. [Google Scholar]
  33. Menezes, F.F. Anisotropy of volume change and permeability evolution of hard sandstones under triaxial stress conditions. J. Pet. Sci. Eng. 2019, 174, 921–939. [Google Scholar] [CrossRef]
  34. Wang, Y.; Agostini, F.; Skoczylas, F.; Jeannin, L.; Portier, É. Experimental study of the gas permeability and bulk modulus of tight sandstone and changes in its pore structure. Int. J. Rock Mech. Min. Sci. 2017, 91, 203–209. [Google Scholar] [CrossRef]
  35. Shanley, K.W.; Cluff, R.M.; Robinson, J.W. Factors controlling prolific gas production from low-permeability sandstone reservoirs: Implications for resource assessment, prospect development, and risk analysis. AAPG Bull. 2004, 88, 1083–1121. [Google Scholar] [CrossRef]
  36. Patrick, B.; Wong, T.F.; Zhu, W. Effects of porosity and crack density on the compressive strength of rocks. Int. J. Rock Mech. Min. Sci. 2014, 67, 202–211. [Google Scholar]
  37. Doyen, P.M. Permeability, conductivity, and pore geometry of sandstone. J. Geophys. Res. Solid Earth 1988, 93, 7729–7740. [Google Scholar] [CrossRef]
  38. David, C.; Wong, T.F.; Zhu, W.; Zhang, J. Laboratory measurement of compaction-induced permeability change in porous rocks: Implications for the generation and maintenance of pore pressure excess in the crust. Pure Appl. Geophys. 1994, 143, 425–456. [Google Scholar] [CrossRef]
  39. Bernabé, Y.; Mok, U.; Evans, B. Permeability-porosity relationships in rocks subjected to various evolution processes. Pure Appl. Geophys. 2003, 160, 937–960. [Google Scholar] [CrossRef]
  40. Shao, J.F.; Chiarelli, A.S.; Hoteit, N. Modeling of coupled elastoplastic damage in rock materials. Int. J. Rock Mech. Min. Sci. 1998, 35, 444. [Google Scholar] [CrossRef]
  41. Gao, C.; Xie, L.Z.; Xie, H.P.; He, B.; Li, C.B.; Wang, J.; Luo, Y. Coupling between the statistical damage model and permeability variation in reservoir sandstone: Theoretical analysis and verification. J. Nat. Gas Sci. Eng. 2017, 37, 375–385. [Google Scholar] [CrossRef]
  42. Yang, Y.; Wang, D.; Guo, M.; Li, B. Study of rock damage characteristics based on acoustic emission tests under triaxial compression. Chin. J. Rock Mech. Eng. 2014, 33, 98–104. [Google Scholar]
Figure 1. Servo-controlled seepage equipment for thermal–hydrological–mechanical coupling of rock.
Sustainability 15 14795 g001
Figure 2. Stress–strain relationship and dilatancy characteristics of sandstone. (a) Volumetric strain–axial strain relationship. (b) Volumetric strain difference–confining pressure.
Sustainability 15 14795 g002
Figure 3. Fracture morphology of sandstone. T and S represent tensile and shear cracks, respectively. (a) σ3 = 5 MPa. (b) σ3 = 10 MPa. (c) σ3 = 15 MPa. (d) σ3 = 20 MPa.
Sustainability 15 14795 g003
Figure 4. Idealized bilinear stress-sensitive dilatancy model.
Sustainability 15 14795 g004
Figure 5. Schematic diagram of sandstone deformation at σ3 = 10 MPa.
Sustainability 15 14795 g005
Figure 6. Variation in volumetric strain in respect to axial strain under maximum volume compression and elastic compression. (a) Maximum volume compression. (b) Maximum elastic compression.
Sustainability 15 14795 g006
Figure 7. Evolution of dilatancy index, Id.
Sustainability 15 14795 g007
Figure 8. Strength characteristics of sandstone. (a) Linear Mohr–Columb strength criterion. (b) double logarithmic strength model.
Sustainability 15 14795 g008
Figure 9. Deviatoric stress–axial strain curves and permeability–axial strain curves.
Sustainability 15 14795 g009
Figure 10. Simplified rock structure model at pre-peak. (a) Permeability descending stage. (b) Permeability ascending stage.
Sustainability 15 14795 g010
Figure 11. Radial–axial strain curves in permeability recovery stage.
Sustainability 15 14795 g011
Figure 12. Permeability–radial strain curves in permeability recovery stage.
Sustainability 15 14795 g012
Figure 13. Comparisons of the experimental results and predictions on permeability.
Sustainability 15 14795 g013
Figure 14. as, ap-axial strain curves in descending phrase.
Sustainability 15 14795 g014
Figure 15. Absolute values of percent changes in radial strain and volumetric strain-axial strain curves.
Sustainability 15 14795 g015
Table 1. Sample parameters and experimental conditions.
Specimen NumberDiameter
(mm)
Height
(mm)
CO2 Pressure
(MPa)
Confining Pressure
(MPa)
Simulated Depth
(m)
1#48.80101.4425−200 m
2#48.74100.40210−400 m
3#48.70101.16215−600 m
4#48.76100.82220−800 m
Table 2. Fitting coefficient of volumetric strain and axial strain in linear elastic volume compression stage.
σ3/MPaabR2
50.88530.23040.999
100.88540.36330.999
150.86380.55090.999
200.8560.62190.999
Article
Table 3. Dilatancy index calculation.
Effective Confining Pressure, σ3e/MPa03.958.9513.9518.95
Δεvpε1p3.5473.032.0451.8751.027
Apparent dilation angle, degree74.25671.73663.94261.92545.771
Dilatancy index, Id10.9660.8610.8340.616
Table 4. Permeability of sandstone at each characteristic point.
Confining Pressure
(MPa)
Initial Permeability
(10−16 m2)
Minimum Permeability
(10−16 m2)
Maximum Permeability
(10−16 m2)
5 1.090.981.67
101.110.972.37
150.840.751.47
201.040.941.57
Disclaimer/Publisher’s Note: The statements, opinions and data contained in all publications are solely those of the individual author(s) and contributor(s) and not of MDPI and/or the editor(s). MDPI and/or the editor(s) disclaim responsibility for any injury to people or property resulting from any ideas, methods, instructions or products referred to in the content.

