Article

Research on a Multi-Species Combined Habitat Suitability Assessment Method for Various Fish Species

1
Hydraulic Engineering Department, Nanjing Hydraulic Research Institute, Nanjing 210029, China
2
College of Water Conservancy and Hydropower Engineering, Hohai University, Nanjing 210098, China
*
Author to whom correspondence should be addressed.
Sustainability 2023, 15(20), 14801; https://doi.org/10.3390/su152014801
Submission received: 8 September 2023 / Revised: 4 October 2023 / Accepted: 10 October 2023 / Published: 12 October 2023

Abstract

:
To reveal the evolution of habitat distribution for multiple fish species in the lower reaches of the Gongzui Hydropower Station, this study conducted a catch survey to determine the target species of the reach. Based on their suitability curves, a combined suitability assessment model for multiple fish species was constructed. The reliability of the model was verified by combining acoustic observations of flow fields and fish distribution in specific flow conditions. A two-dimensional hydrodynamic model was coupled to quantitatively analyze the distribution characteristics of fish habitat patches under different flow conditions. The results indicate that the correlation coefficient between the multi-species comprehensive suitability index and the number of fish is 0.676, which indicates that the model can better evaluate the distribution of multiple fish habitats in the study river reach; the weighted usable area (WUA) decreased as the discharge increased; from low flow condition (<800 m3/s) to high flow condition (>2000 m3/s), the patch area of suitable habitat decreased from 11,424 m2 to 1268 m2, and the connectivity between patches also showed a downward trend; and the habitat shifted to the near-shore area of the downstream wider and shallower section, which was highly correlated with the migration process of low-depth and low-velocity areas. The model proposed in this study can establish a rapid response between the suitable habitat distribution of multiple fish species and discharge conditions, which can provide a research method for quantitative evaluation of multi-species habitats in river, and make a significant contribution to the sustainable development of riverine fisheries resources and river water ecology.

1. Introduction

While providing many services to society, such as clean energy, flood control, drainage and irrigation, hydraulic engineering also have a significant impact on river fish habitats, such as fragmentation of river habitats caused by high dams [1,2,3], which is considered to be a major threat to global fish populations [4]. Moreover, with the development of the society economy, the degree of hydropower development in rivers is increasing [5,6]. Therefore, it is urgent to develop quantitative analysis tools to evaluate the suitability and distribution of fish habitats with strong engineering backgrounds, in order to reveal the impact of water conservancy engineering construction on fish habitats and provide a scientific basis for subsequent habitat restoration and enhancement measures.
The Physical Habitat Simulation model, known as PHABSIM, is currently the most widely used quantitative evaluation model for fish habitat suitability worldwide [7,8,9,10,11]. The model considers the preferences of target fish species for different physical factors (such as water depth, current speed and substrate, etc.), converts flow into a weighted usable area (WUA), and quantitatively assesses the impact of different hydrological conditions on habitat suitability [12].
According to the current research, most studies only focus on a single species in a particular river, most of which are endangered or protected species [13,14,15,16,17]. However, implementing habitat enhancement measures for a single target can often affect the habitat suitability and distribution of all species in the study area. Moreover, if there are multiple high-value objectives in the same research area, the research results of a single objective may not be sufficient to achieve the established goals of improving the overall ecological health of the study area.
The habitat suitability of river fish is significantly influenced by hydrological rhythms, especially in areas with higher sensitivity. WUA and its distribution also changed significantly with hydrological rhythms, mainly reflected in the evolution of suitable habitat patches with discharge conditions. Therefore, areas with higher sensitivity are usually the key focus of habitat evaluation and enhancement measures [18,19].
The primary objectives of this study are as follows:
  • To propose a Multi-Species Combined Habitat Suitability Index (MCHSI) evaluation model, applicable to the downstream of Gongzui Dam, and conduct cross-validation based on the actual distribution of fish to validate the model’s applicability and reliability.
  • Assess the MCHSI of study section under different flow conditions and analyze its sensitivity.
  • Based on the sensitivity analysis result, to quantify the evolution process of high-sensitive regions with hydrological rhythms, forming a set of quantitative analysis methods for the evaluation of suitable habitat.
The results of this study can provide quantitative assessment tools and application cases for the combined habitat suitability of multiple fish species within river segments. Furthermore, they can visually depict the evolution process of suitable habitat patches under different conditions. Consequently, these findings offer a scientific basis for the modification of fish habitat suitability or the ecological regulation of water conservancy projects, and providing corresponding guidance for subsequent engineering or non-engineering measures for fish habitat restoration. The outcomes hold significant implications for the restoration and sustainable development of riverine fisheries resources and aquatic ecosystems.

2. Materials and Methods

2.1. Study Area

The Dadu River, the largest tributary of the Minjiang River system in the upper reaches of the Yangtze River, is located in the central and western regions of Sichuan Province, with a total length of approximately 1062 km and a drainage area of 77,400 km2 [20]. The river has a tremendous amount of water, narrow river valleys, and huge potential for hydropower development due to its large drop. By 2020, 14 cascade hydropower stations have been built and put into operation, and 2 cascade hydropower stations are under construction along the main stream of the Dadu River [21]. The Gongzui Hydropower Station is located at the junction of Shawan District, Leshan City, and Ebian County, in the middle reaches of the Dadu River (Figure 1, left). The research section is located below the Gongzui hydropower station.
Ship-based Acoustic Doppler Current Profiler (ADCP) and Simrad EK80 were used for a cruising survey of water depth, flow velocity, and fish distribution in the study section. The ship’s speed was controlled at 1–3 m/s, and an “S”-shaped cruise route was designed within the research section to ensure the trajectory covered the entire river plane as much as possible. Due to the high flow velocity within 500 m downstream of the hydropower station, the detection accuracy of acoustic instruments and the safety of the ship-based observations cannot be guaranteed. Therefore, this study selects the river reach that is significantly affected by the operation of the power station, that is, the river reach within the range of 500~2700 m below the dam of Gongzui Hydropower Station (Figure 1) to investigate the hydraulic characteristics and fish distribution characteristics of the river reach.
This study collaborated with fishery professionals to conduct targeted research, small-scale fishing operations using casting nets in areas of the river potentially harboring fish aggregations. Following capture, the identified fish species were promptly cataloged and quantified, and subsequently released back into the river. Due to the study area located within the province of Sichuan, fish species identification primarily relied upon the ‘Ichthyology of Sichuan’ reference.
Based on the water depth and the topographic data of the river channel area, the topography of the study reach was interpolated (Figure 1, right). The elevation range of the study reach is from 478 to 493 m, with a length of about 2.2 km, and an average slope of approximately 7.73‰. The water depth along the median line of the river is about 5–12 m. The channel width is generally narrow upstream and wide downstream, with an average channel width of approximately 118 m.
Hydraulics observation (Table 1) was conducted for the typical flow conditions during the fish migration season. The corresponding flow condition for the observation of catches on site was G4 (water level of 522.22 m and flow rate of 1310 m3/s). During the observation period, the water level downstream of the Gongzui Hydropower Station varied from 522.09 to 522.74 m, and the outflow between 811 and 1310 m3/s, resulting in a large variation in hydraulic elements such as water depth and flow velocity in the downstream reach, which subsequently caused a significant fluctuation in the suitability of fish habitats in the study area.

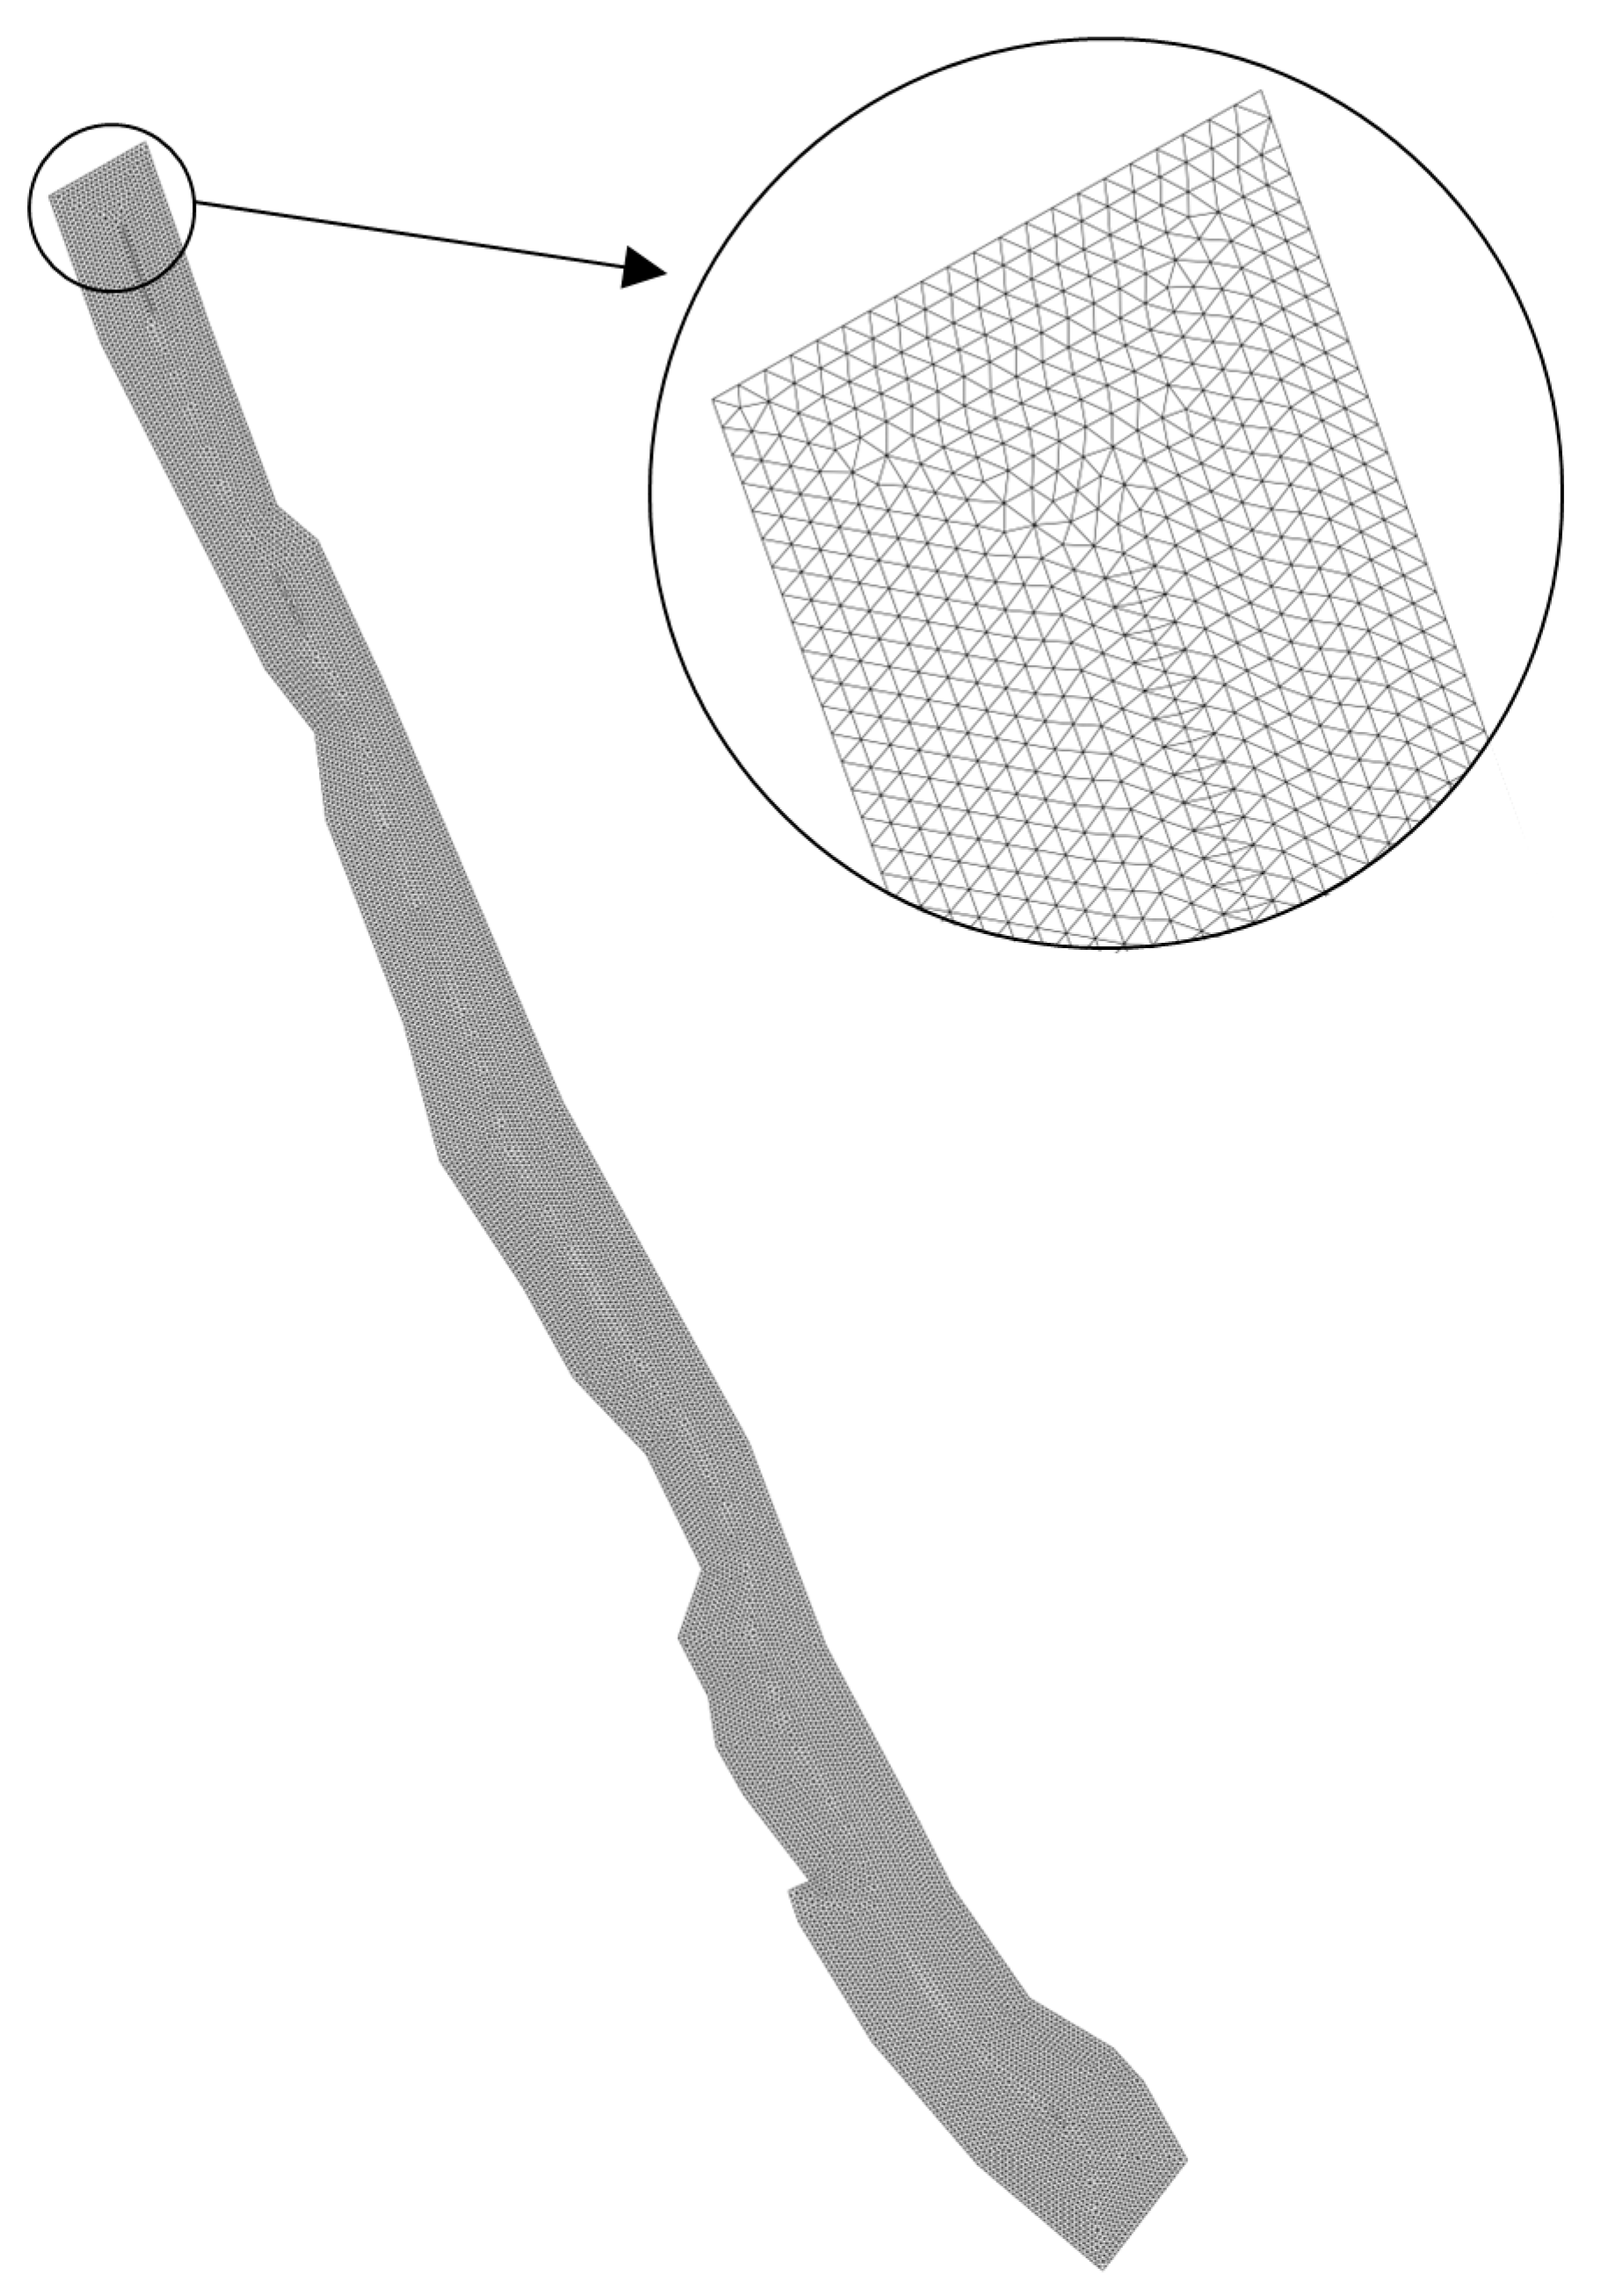
2.2. 2-D Hydrodynamic Model

2.2.1. Hydraulic Module

The plane two-dimensional unsteady flow equations are used to simulate the depth, velocity and other hydraulics factors of the study reach [22]:
z t + x ( h U ) + y ( h V ) = 0 U t + U U x + V U y + g z x + g u u 2 + v 2 c 2 h = ν t ( 2 u x 2 + 2 u y 2 ) V t + U V x + V V y + g z y + g v u 2 + v 2 c 2 h = ν t ( 2 v x 2 + 2 v y 2 )
where x, y are the spatial coordinates, t is the temporal coordinates, U, V represents the flow velocity in the x and y directions, respectively, z is the water level, g is the acceleration of gravity, u, v are the component of the vertical average flow velocity in the x and y directions, c is the Chezy coefficient, ν t is the turbulent viscosity coefficient, n is the Manning roughness coefficient.
The grid generated by the model calculation domain is shown in Figure 2.

2.2.2. Definite Conditions

Initial conditions:
{ Z ( x , y , 0 ) = Z 0 ( x , y ) u ( x , y , 0 ) = u 0 ( x , y ) v ( x , y , 0 ) = v 0 ( x , y )
The upstream flow and downstream water level are taken as its hydraulics boundary conditions, and the fixed boundary hydrodynamic calculation adopts the boundary conditions with the normal flux of 0.

2.2.3. Verification of Simulation Result

A two-dimensional hydrodynamic model was employed to simulate the water depth and flow velocity of the study reach. The simulation results of depth and flow velocity that match the observed values at the same time and location (excluding invalid observation values, a total of 36 points) were compared to the observed values to calculate the relative errors of the two variables. The results (Figure 3) indicated that the water depth errors of 80% of the points were less than 10%, while the flow velocity relative errors of 72% of the points were less than 10%. The relative errors of both water depth and flow velocity were mostly concentrated between 0% and 10%. Therefore, it is believed that the simulation results generally meet the needs of the assessment of habitat suitability.

2.3. Target Fish

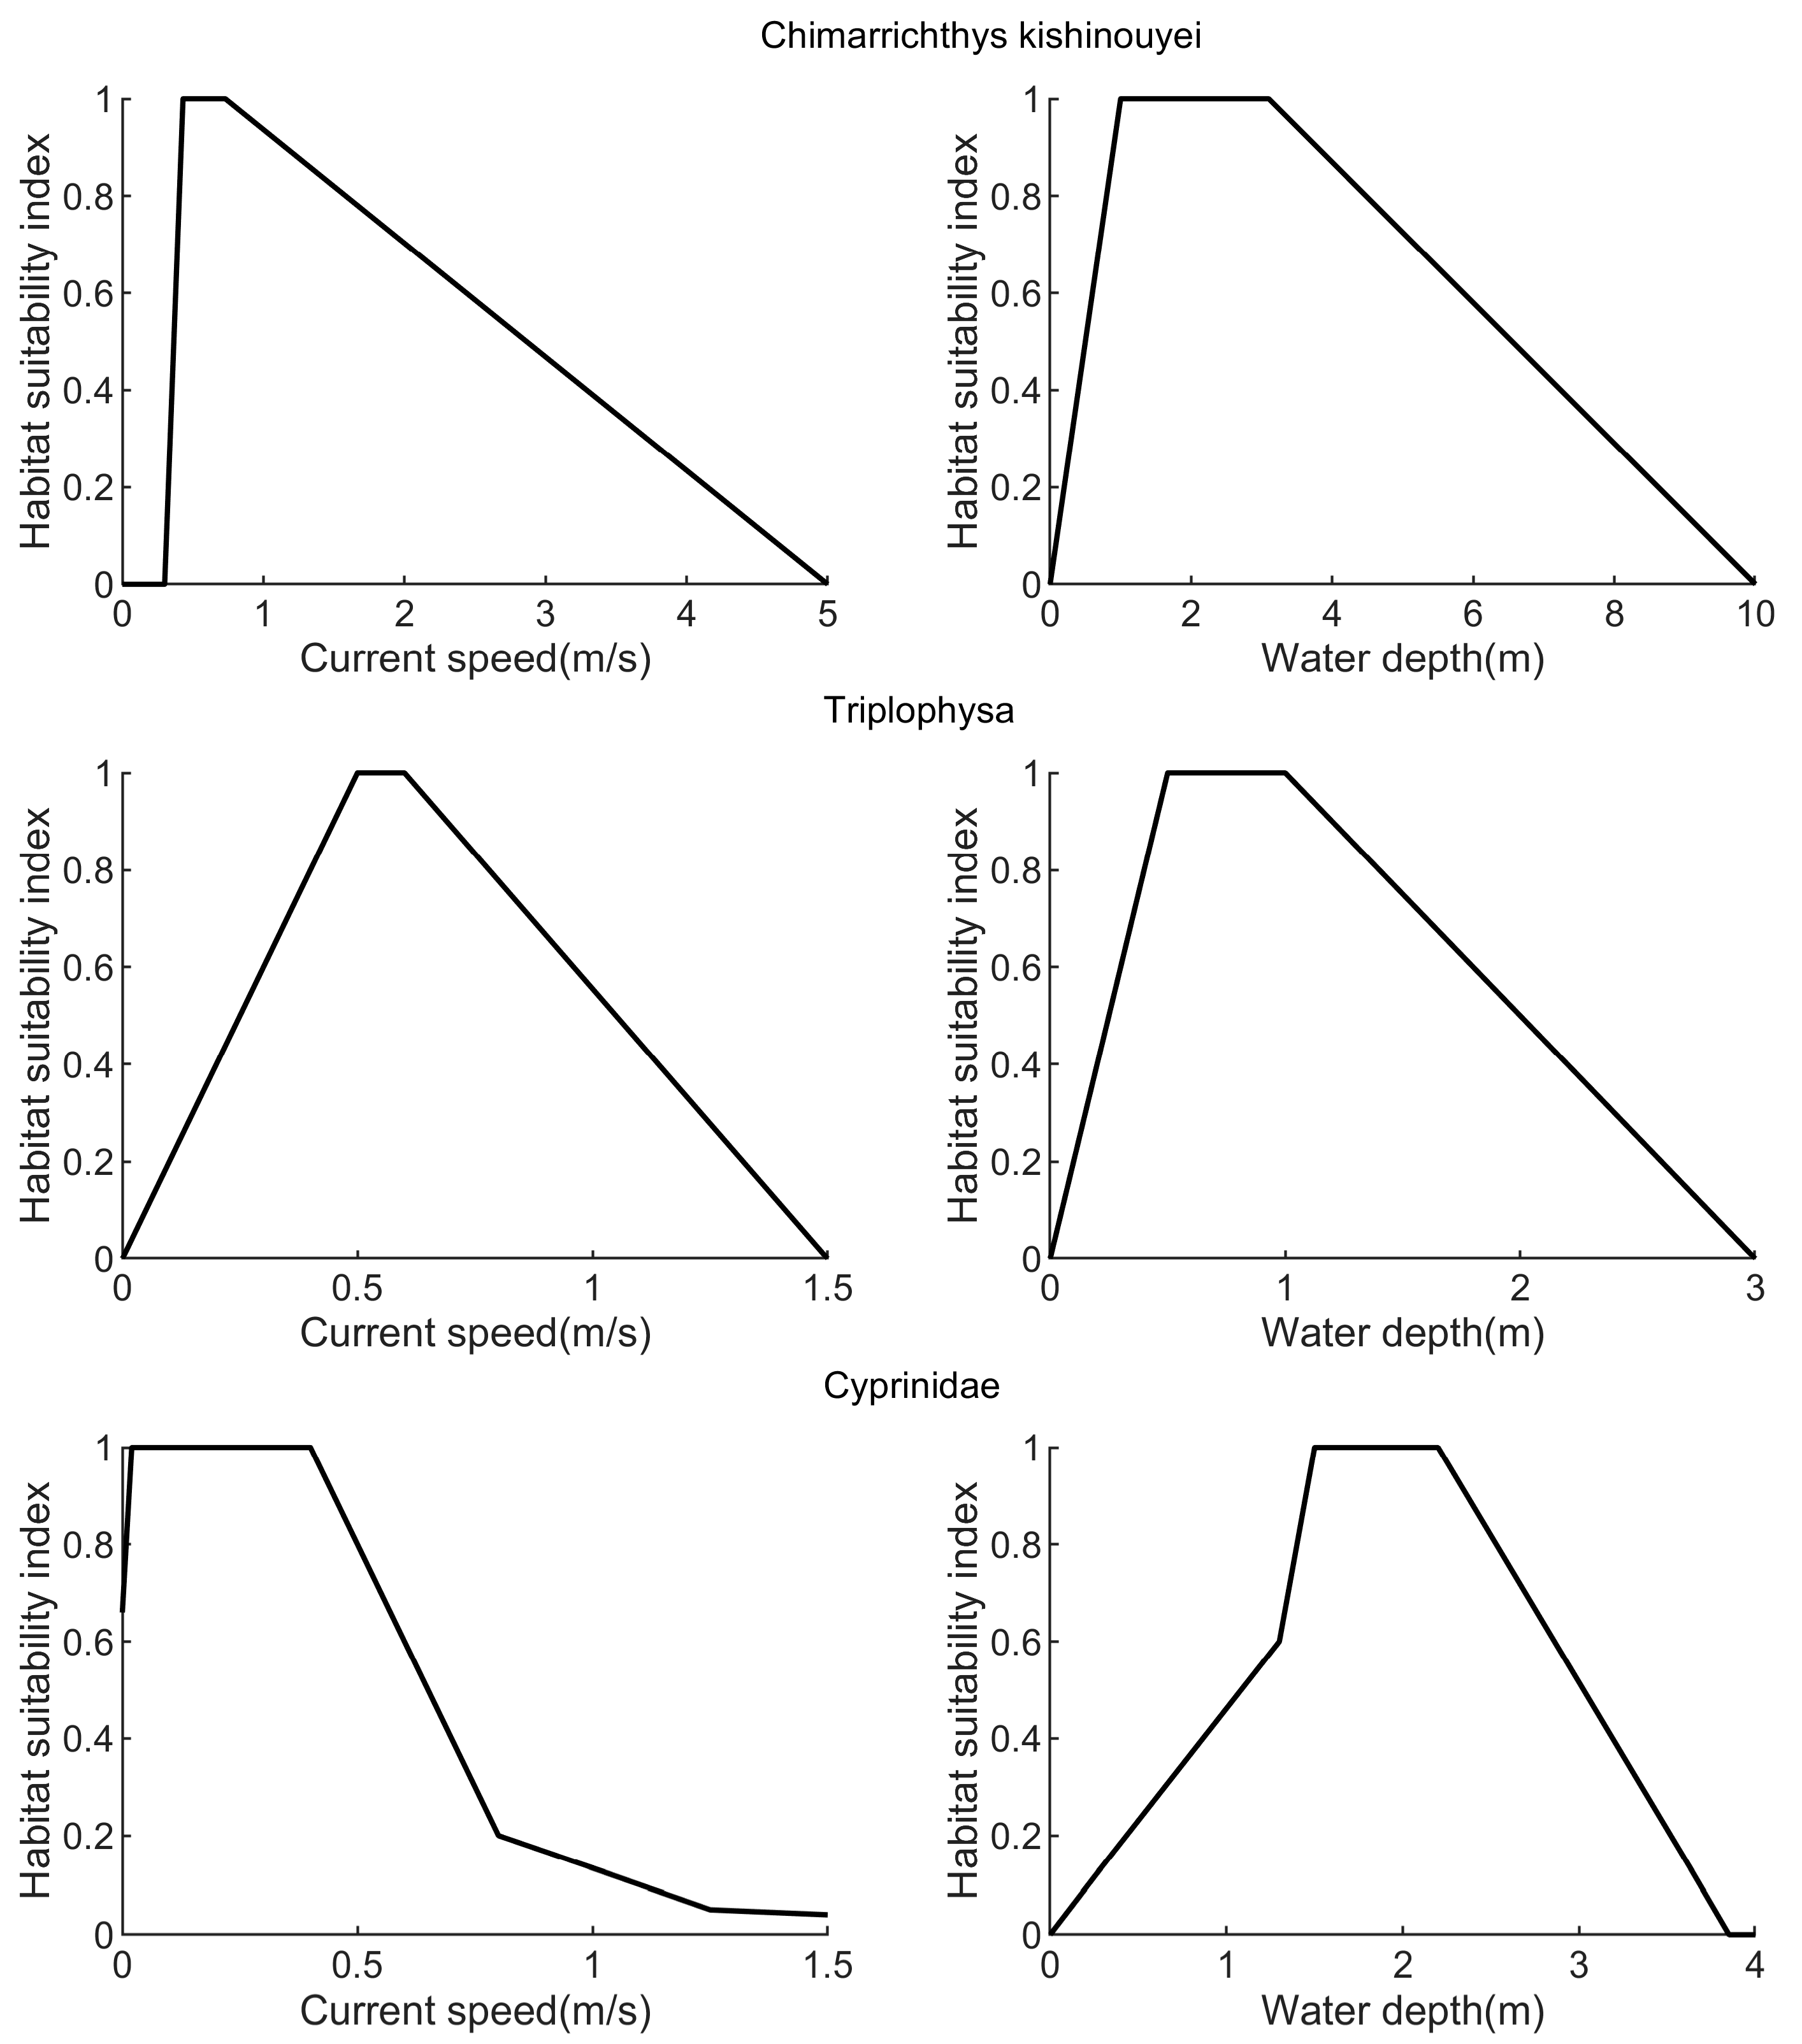
2.3.1. Composition of Catch and Suitability Curve of Target Fish

According to the investigation of catches in the Gongzui reduced water reach and relevant data, among the 21 identified fish species, 15 belong to the order Cypriniformes, and 6 belong to the order Siluriformes (Table 2). The total number of fish caught during this survey was 146, with 120 individuals (82.2%) belonging to the Cypriniformes and 26 individuals (17.8%) belonging to the Siluriformes.
There are many endangered and rare species in the catch, and research on their living habits and habitat suitability is very rare. Except for some species in the Cyprinidae family (such as Schizothorax prenanti, Schizothorax davidi, Chimarrichthys kishinouyei, Abbottina rivularis, etc.), which have short distance migratory habits [23,24], other species have no migratory habits or their habits are unknown. Therefore, this study only considers the impact of power station reservoir scheduling on their habitat suitability, without considering the barrier effect of power station dams on their migration.
In the Leshan section of the Dadu River, the main fish species at the family level are Cyprinidae, Cobitidae and Sisoridae, although other species are occasionally seen [25,26]. According to the survey results of catches in the studied river reach (Table 2), there are 4 species and 27 individuals in the Cobitidae family, 10 species and 90 individuals in the Cyprinidae family, and 2 species and 16 individuals in the Sisoridae family. Due to the lack of reports on the suitability curve of some species in the river section, it is difficult to quantitatively evaluate their suitability index. Therefore, this study exclusively evaluated fish species for which habitat suitability curves had been previously established, namely Triplophysa [27], Cyprinidae [28] and Chimarrichthys kishinouyei [29], which accounted for 61.9% of the fish species and 84.3% of the fish population in the river section.
The breeding season of Chimarrichthys kishinouyei is from June to July, the nurturing period is from August to October, and the growth period from November to May of the following year. The observation period was in April, during which the fish were in the growth period. The suitability curve of studying fish targets is shown in Figure 4.

2.3.2. Cluster Analysis

The hypothesis is that the fish abundance is independent of the habitat factors (water depth and flow velocity), considering the target fish species (Cyprinidae, Triplophysa, and Chimarrichthys kishinouyei) can be categorized into two groups: one adapted to low water depth (<4 m) and low flow velocity (<1.5 m/s), namely Cyprinidae and Triplophysa; the other adapted to higher flow velocity (<5 m/s) and water depth (<10 m) is Chimarrichthys kishinouyei. A matrix in the form of (water depth, flow velocity, fish abundance) is constructed, and cluster analysis is applied to categorize the results of fish distribution obtained through underwater acoustic detection into two categories.

2.4. Calculation of Weight Matrix

This paper proposes a comprehensive suitability quantification assessment model, namely the MCHSI model, for multi-species habitats in river segments. The model, based on suitability curves of the study subjects, integrates the types and proportions of various evaluation objects within the study area to construct a weighted matrix for each habitat factor. This matrix is then used to calculate and assess the overall suitability of multiple species in the research river segment.
The construction process of the model is as follows:
(1)
Construct a weight matrix based on the proportion of target species (Table 3).
(2)
Calculate the suitability (SIT,D, SIT,V, SIC,D, SIC,V, SIE,D, SIE,V) of different fish species based on the observed water depth and current speed, and construct matrix S combined with the proportion of fish population:
S = [ P T S I T , D P T S I T , V P C S I C , D P C S I C , V P E S I E , D P E S I E , V ]
(3)
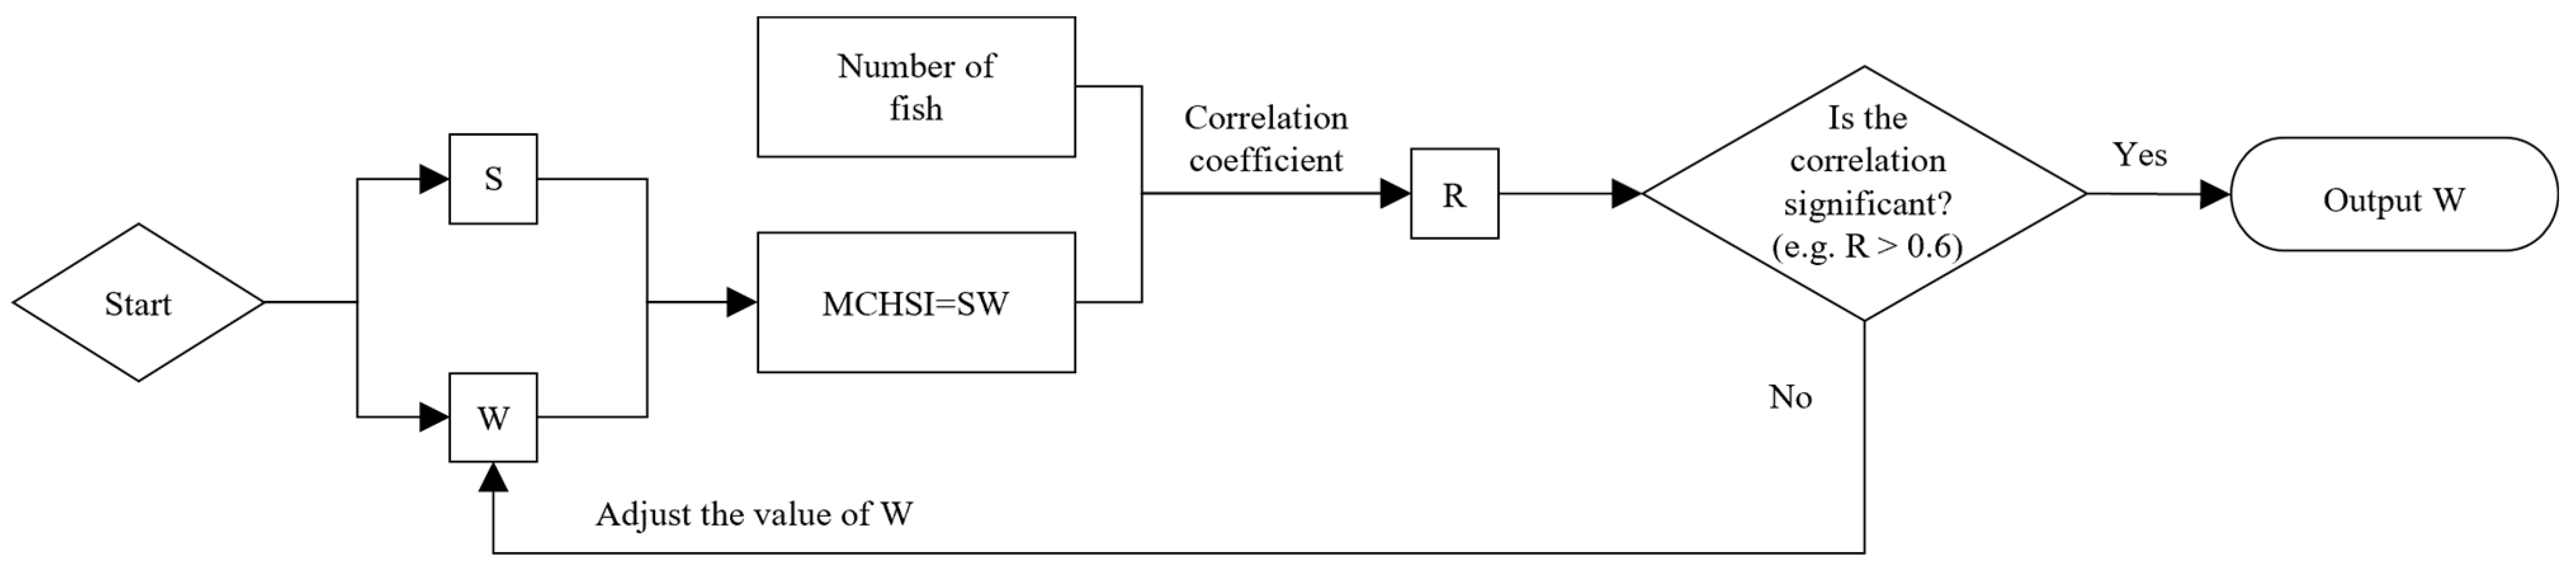
Construct a weight matrix W, whose initial values can be randomly assigned:
W = [ w 1 1 w 1 w 2 1 w 2 w 3 1 w 3 ] T
(4)
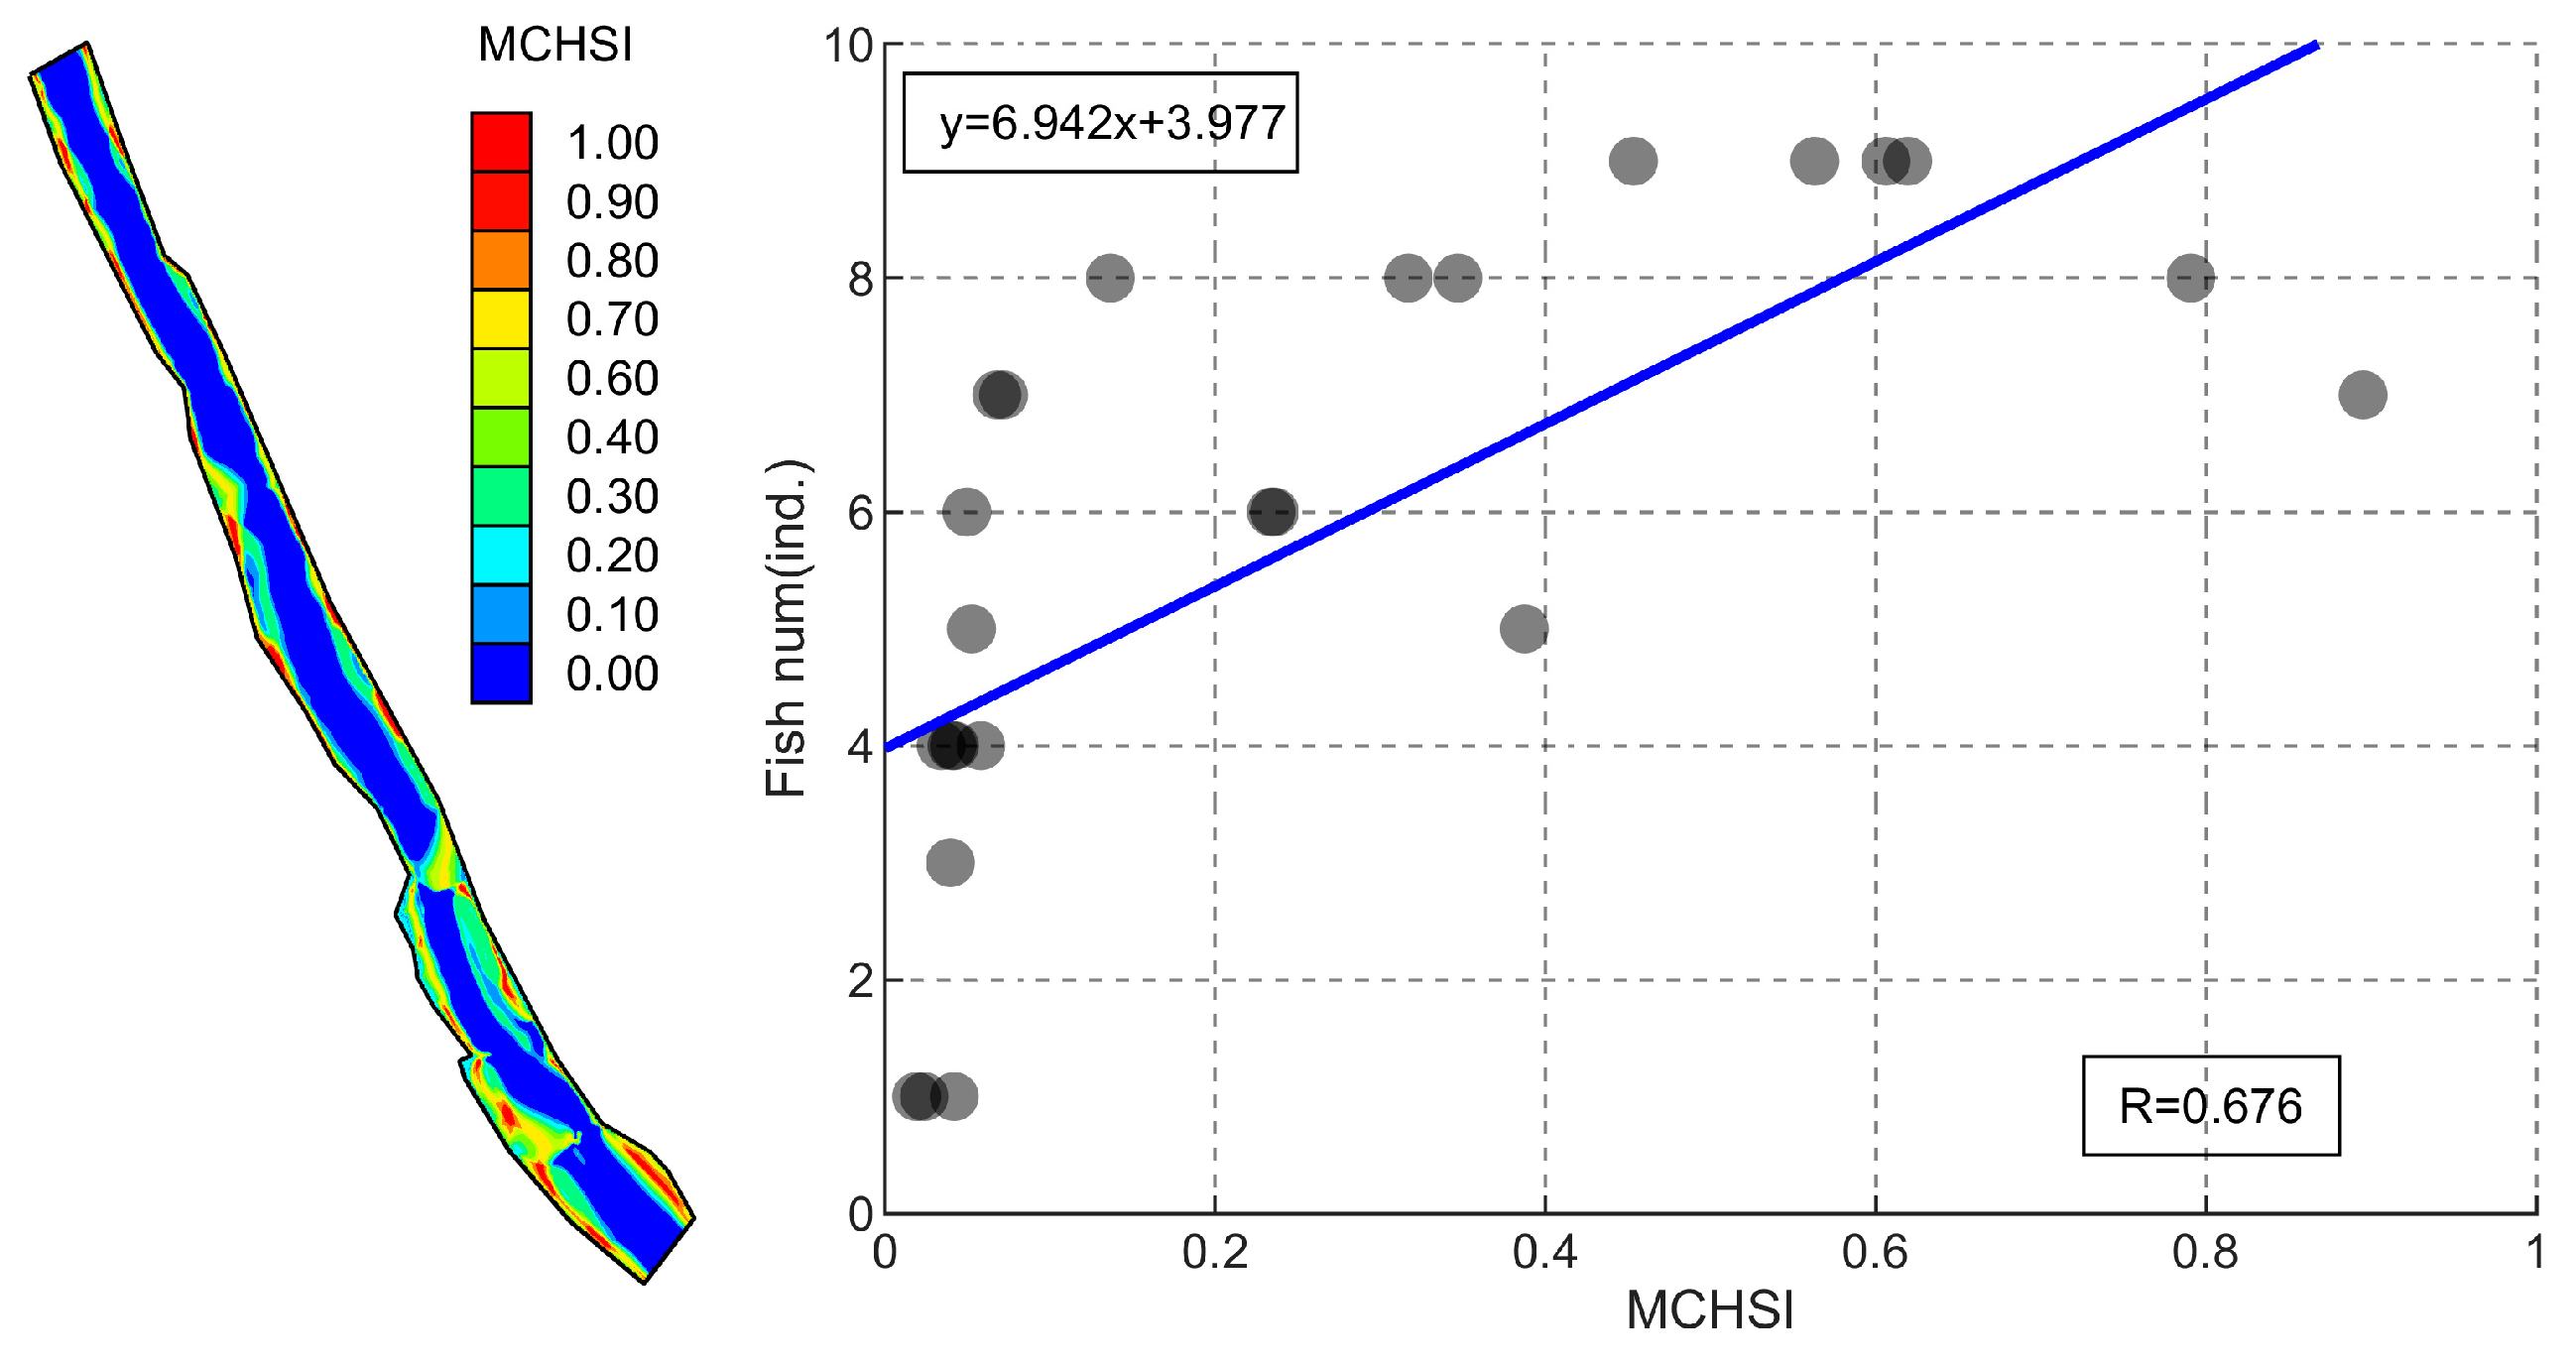
The model assumes a linear relationship between the number of fish in the grid and its MCHSI value, that is, a grid with a large number of fish also has a larger MCHSI value; the grid with a MCHSI value of 0 also has a fish population of 0.
The weight matrix W is calculated iteratively so that the MCHSI values in the grids where fish signals are present show a significant positive correlation with their fish counts, thus obtaining the final W value. The computational flow is shown as Figure 5.

2.5. WUA Construction Procedure

The classic habitat model is established based on the following assumptions [30]: (1) Water depth, flow velocity, substrate, and cover are the primary factors influencing species abundance and distribution in response to flow variations; (2) these factors interact with each other, collectively determining the microhabitat conditions of the river; (3) riverbed morphology remains unchanged with flow variations; and (4) there exists a proportional relationship between WUA (Water Use Availability) and species abundance.
The weighted usable area (WUA) is the sum of the product of the area of each grid and its suitability index [31]. In this study, the multi-species combined habitat suitability index (MCHSI) was used to replace the habitat suitability index. The calculation method of MCHSI is as follows:
M C H S I = P T × ( W T , D S I T , D + W T , V S I T , V ) + P C × ( W C , D S I C , D + W C , V S I C , V ) + P E × ( W E , D S I E , D + W E , V S I E , V )
W U A = i = 1 n A i M C H S I i
where, Ai is the area of the i-th grid, MCHSIi is the multi-species combined habitat suitability index in the i-th grid, and n is the total number of grids in the study reach.

2.6. Sensitivity Analysis

Calculate the coefficient of variation for the combined suitability index of river sections under different operating conditions. The coefficient of variation can measure the degree of data fluctuation, and the larger the coefficient of variation, the stronger the sensitivity [32]. The calculation method is as follows:
V a r i = 1 n c 1 j = 1 n c ( M C H S I i , j M C H S I i ¯ ) 2 1 n j = 1 n c M C H S I i , j
where, Vari represents the coefficient of variation of the MCHSIi, nc represents the number of flow conditions, MCHSIi,j represents the MCHSI of i-th grid under the j-th flow conditions, and M C H S I i ¯ represents the mean of the MCHSI of the i-th grid under all flow conditions.

3. Results

3.1. Fish Distribution

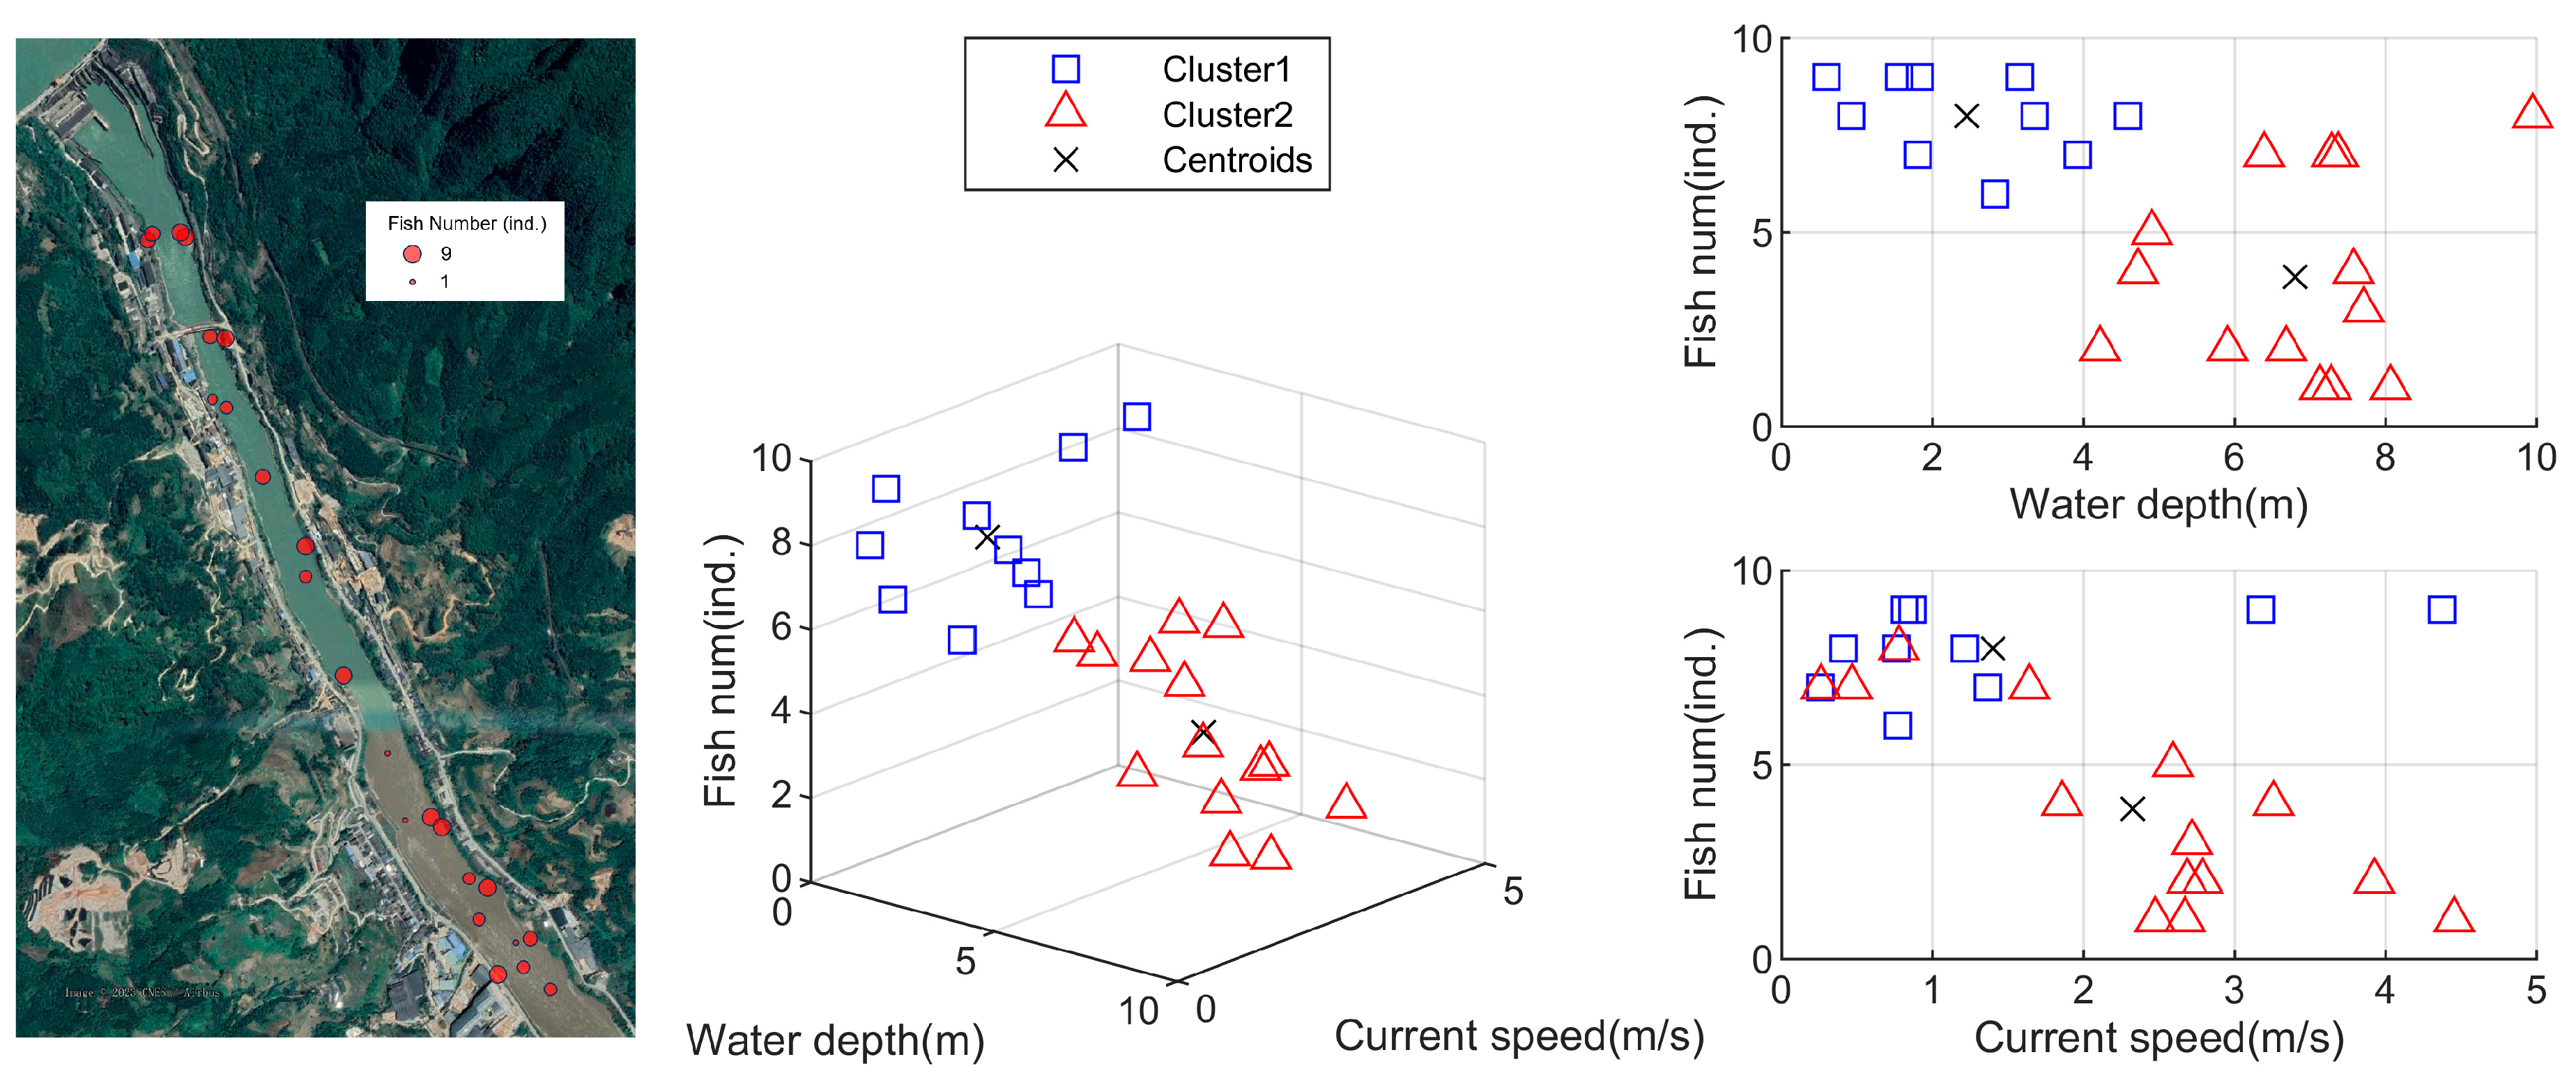
3.1.1. Characteristics of Fish Distribution

According to the results of hydroacoustic observation (Figure 6 left), fish signals are mostly distributed in the area close to the two sides of the river. There are at most nine fish signals in the same grid, and the area of dense fish signals (the number of individuals in the same grid ≥5) is basically located in the near-shore area; fish signals near the middle line of the river area fewer, and the distribution of fish signals is relatively sparse (the number of individuals in the same grid <5).
According to the results of cluster analysis (Figure 6, middle and right), the fish in the study reach can be divided into two groups: first, fish distributed in the shallow area (species represented by the blue squares in the figure), where the average water depth of the distribution area of this group of fish is about 2.4 m, and the average flow velocity is about 1.4 m/s, which is relatively similar to the that of the Cyprinidae and the Triplophysa; and second, fish distributed in the deeper area (species represented by the red triangles in the figure), where the average water depth in the distribution area of this type of fish is about 6.8 m, and the average flow velocity is about 2.3 m/s, which is relatively similar to the Chimarrichthys kishinouyei.

3.1.2. Verification of MCHSI Model

The weight matrix is calculated as follows:
[ W C , D W C , V W T , D W T , V W E , D W E , V ] = [ 0.62 0.38 0.79 0.21 0.35 0.65 ]
The results of the weighting matrix indicate that water depth weights were greater than current speed weights for Cyprinidae and Triplophysa, while current speed weights were greater than the water depth for Chimarrichthys kishinouyei, Suggesting that changes in water depth had a greater effect on habitat suitability for Cyprinidae and Triplophysa, while changes in current speed had a greater effect on habitat suitability for Chimarrichthys kishinouyei in the study reach.
The results of suitability distribution calculation (Figure 7 left) showed that the high suitability area was mainly located in the near-shore area, and most of the areas near the mid-horizon of the river were unsuitable areas (suitability < 0.1). The relationship between the MCHSI and fish number in the grid is shown on the right of Figure 7, and the correlation between the two reaches a moderate correlation (R = 0.676), which indicates that the MCHSI and fish number have a relatively good positive correlation with this weighting matrix, which is considered to be suitable for the calculation of the MCHSI in this reach.

3.2. Simulation Results of Combined Suitability Index

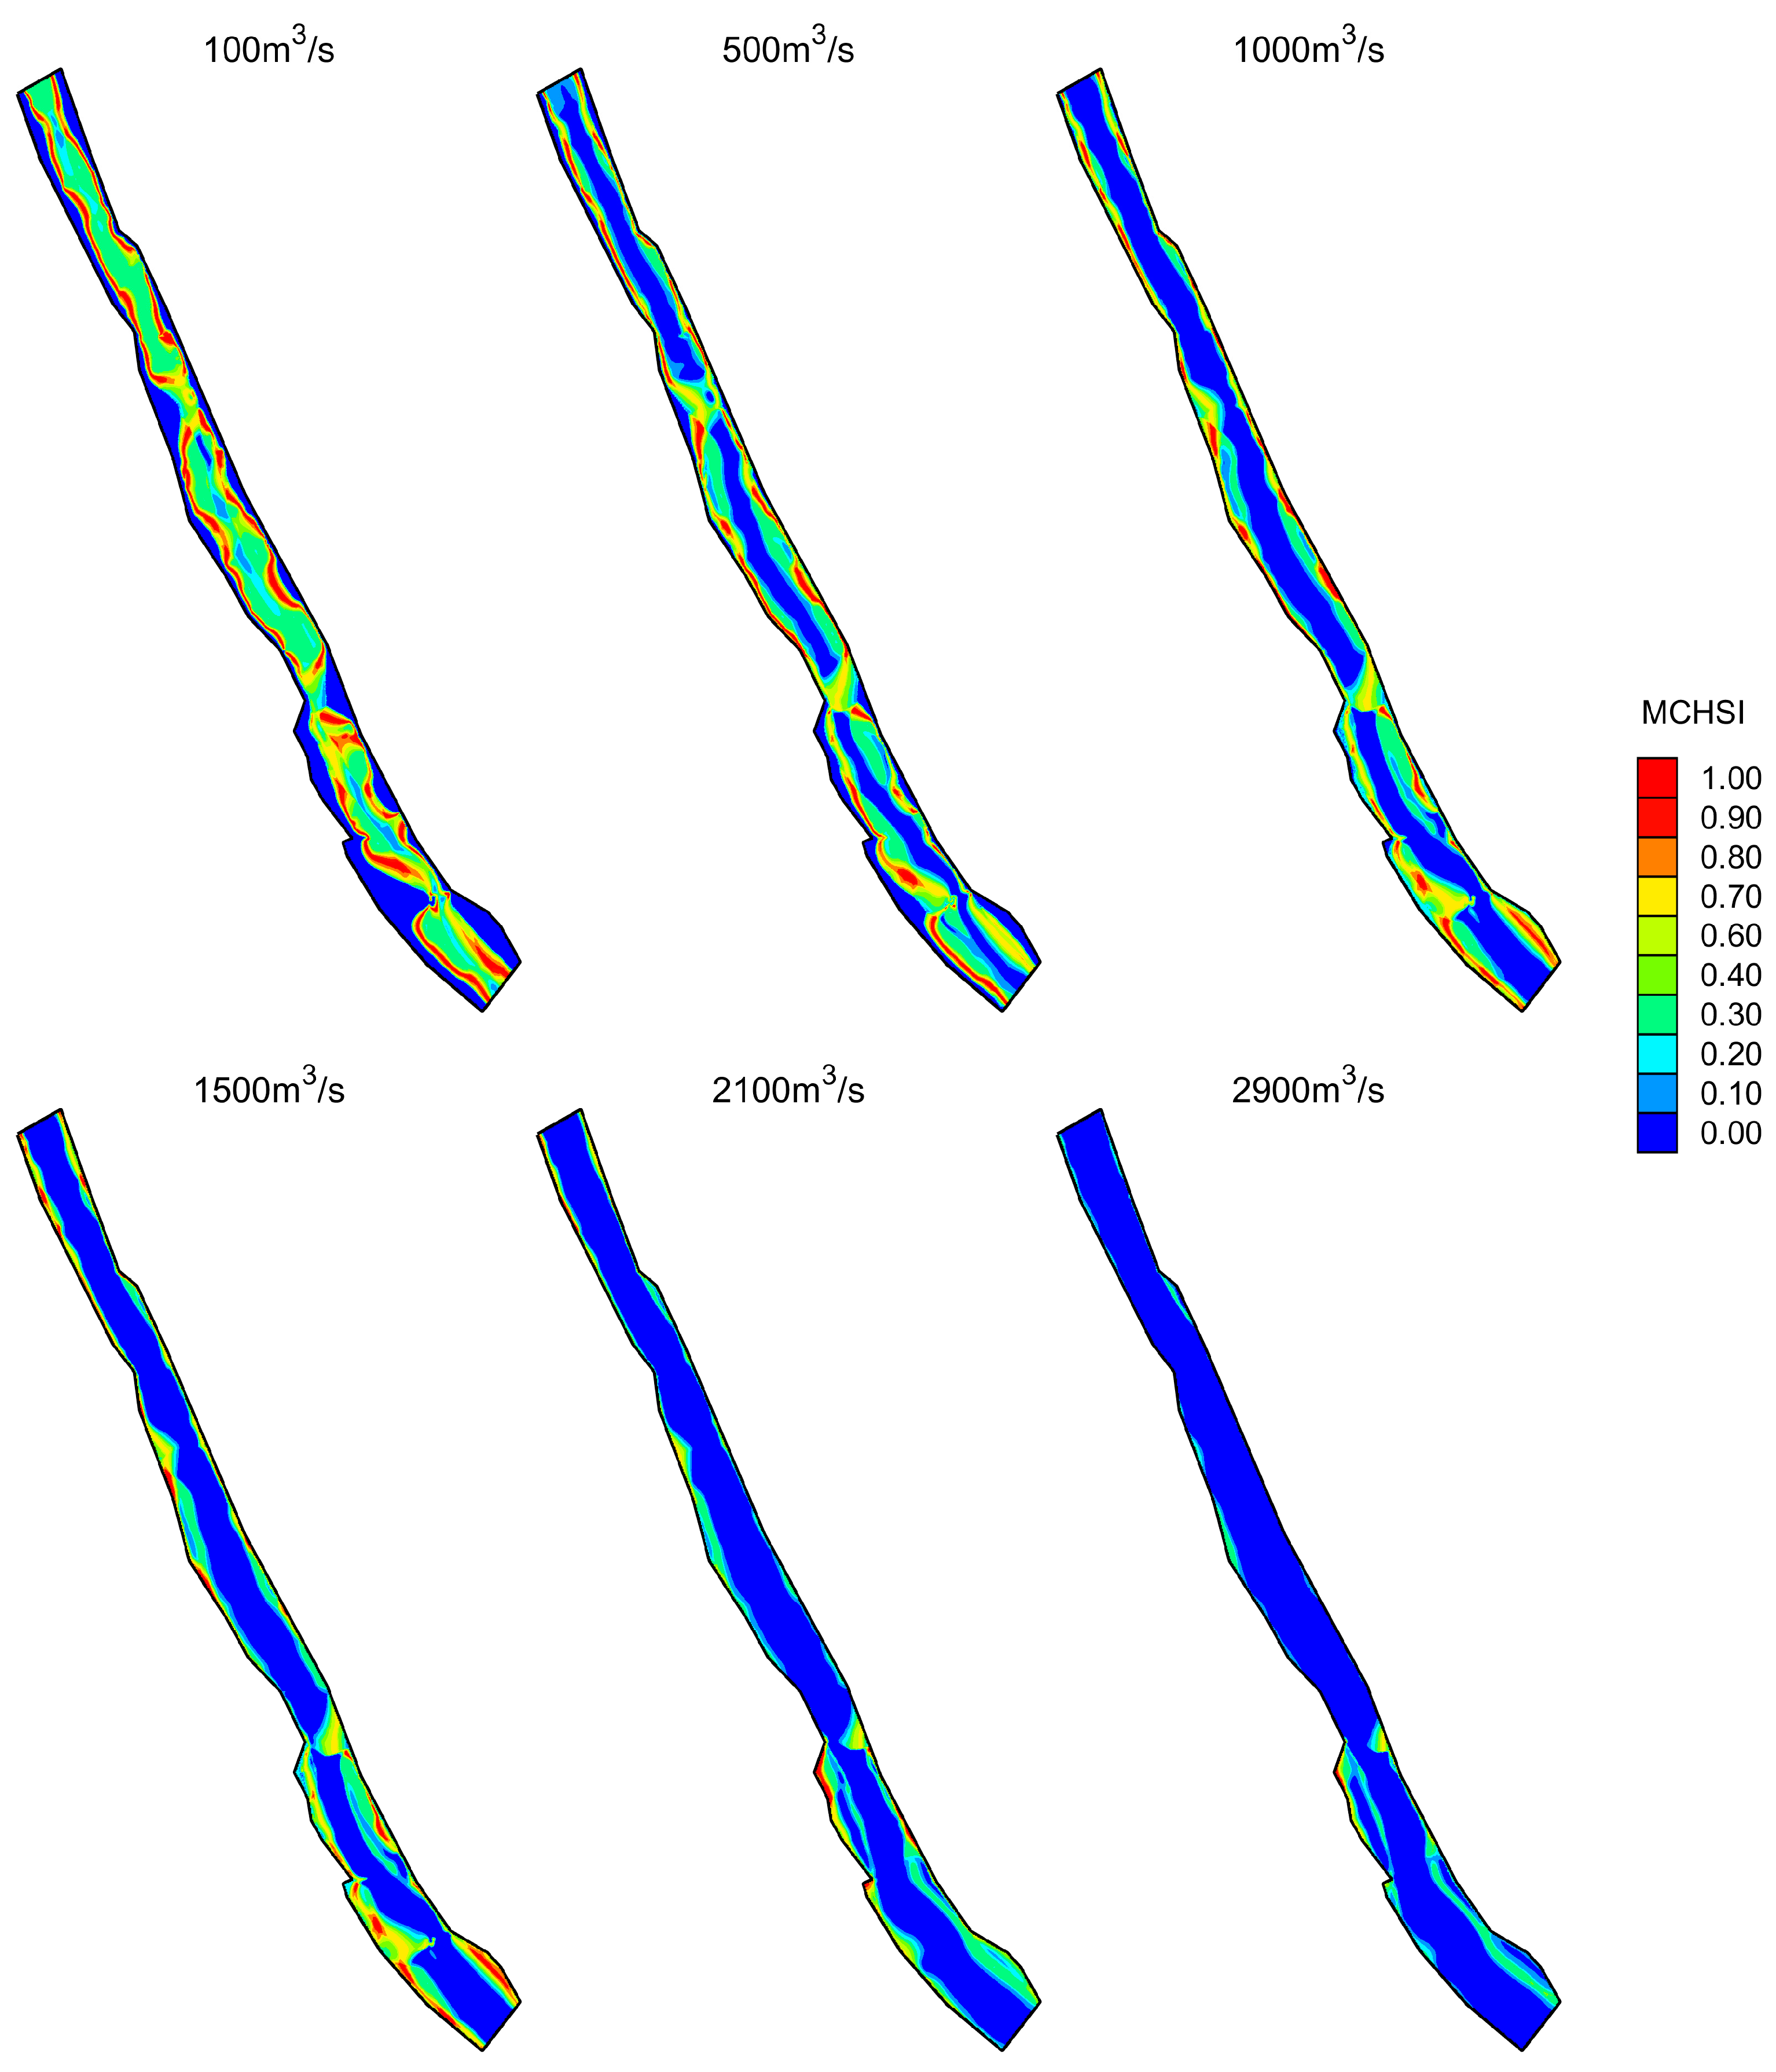
3.2.1. Distribution of MCHSI

The flow conditions of fish spawning season (March to July) in the study river reach are about 500~3000 m3/s [33], the flow fields of 18 flow conditions (100~2900 m3/s) are numerically simulated, and the MCHSI distribution under 100 m3/s, 500 m3/s, 1000 m3/s, 1500 m3/s, 2100 m3/s, and 2900 m3/s conditions were calculated (Figure 8). As shown in the figure, in the low flow condition (100 m3/s), most of the high suitability area (MCHSI > 0.5) is concentrated on both sides of the river, presenting a belt-shaped distribution, with a larger area and better connectivity, and the MCHSI in the center of the river is mostly 0.3~0.4; with the increase in the flow rate (500~1500 m3/s), the area of the high suitability area decreases gradually, the belt-shaped area becomes more and more narrow, the suitable area is only concentrated in the near-shore area, and the center of the river is unsuitable area (MCHSI = 0). The suitable areas are only concentrated in the near-shore area of the river, and the center of the river channel is unsuitable (MCHSI = 0); when the flow reaches more than 2000 m3/s, the unsuitable areas continue to expand, the area of the suitable areas continues to decline, and the connectivity between the suitable areas is separated, showing a fragmented distribution.

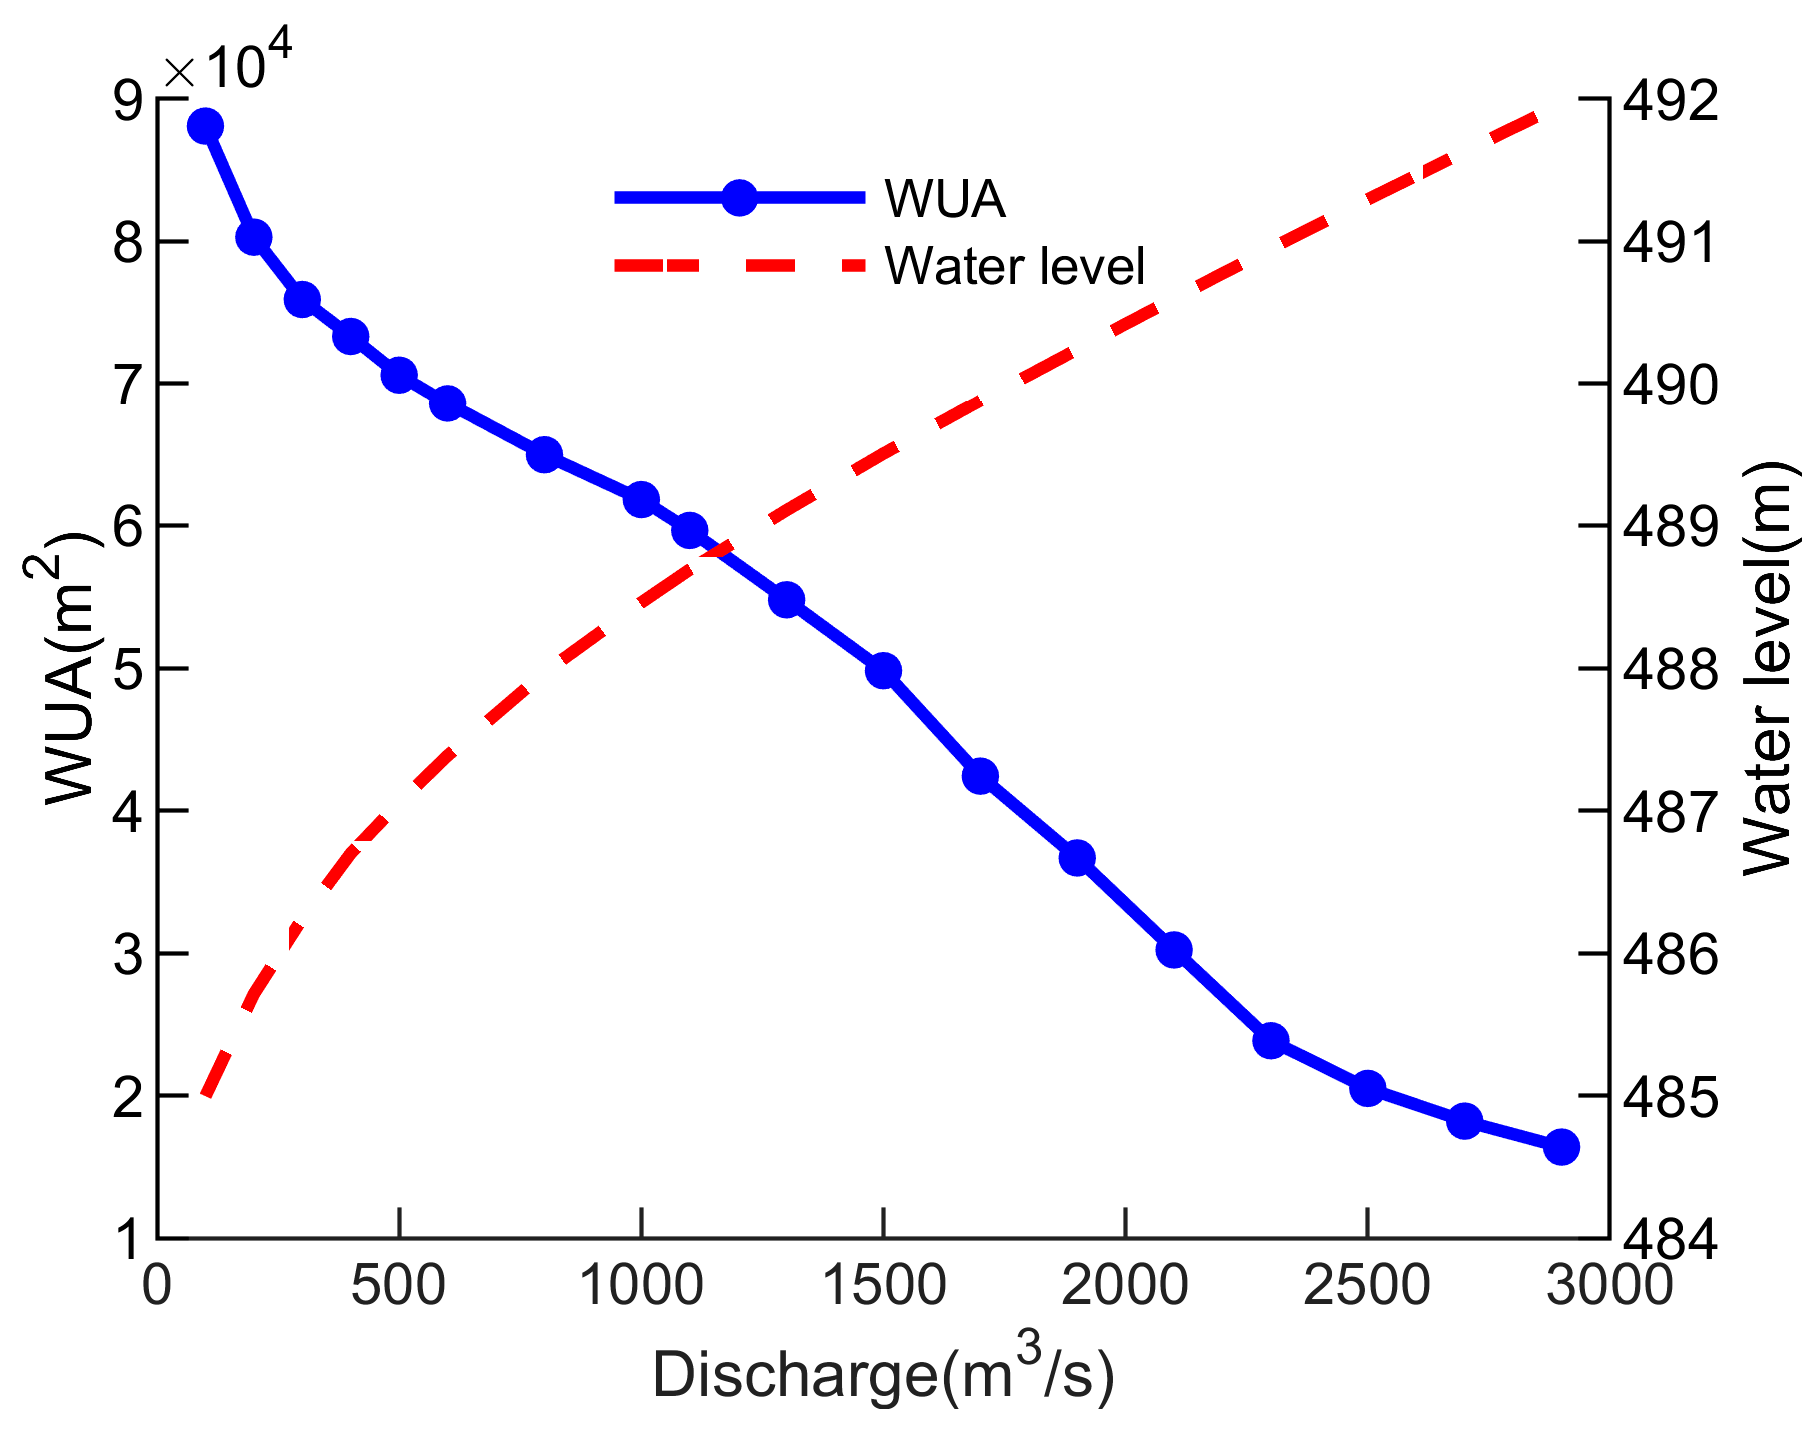
3.2.2. Results of WUA

The WUA at 18 flow conditions ranging from 100 m3/s to 2900 m3/s was calculated and the corresponding water levels were determined (Figure 9). The results indicate that the WUA generally decreases as the flow increases. The WUA ranges from 1.6 × 10⁴ m2 to 8.8 × 10⁴ m2. The correlation coefficient between the WUA and water level was −0.98, showing an extremely high negative correlation.

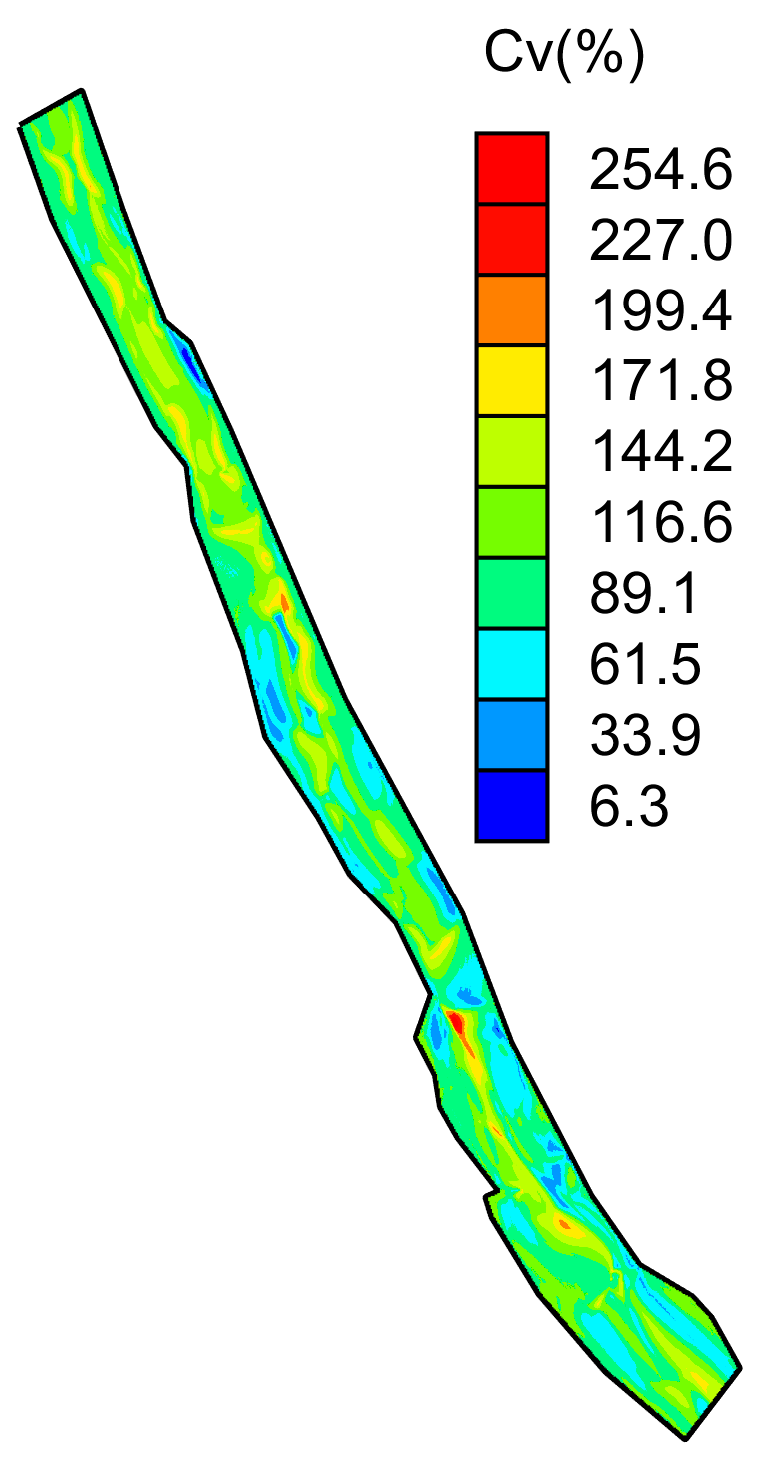
3.2.3. Results of Sensitivity Analysis

The coefficient of variation (CV) of the MCHSI for all flow conditions was calculated (Figure 10), and it is found that the overall variability in the study reaches was strong, with coefficients of variation ranging from 6.3% to 254.6%, and with stronger variability in the center of the river than in the near-shore areas.

3.2.4. Migration of Suitable Habitat Patches

We take the suitable habitat patches with high suitability (MCHSI > 0.5) and high sensitivity (CV > 50%) under more than 50% of flow conditions as the research object. According to the analysis results, the habitat patches can be classified into three categories (Figure 11):
(1)
Category I habitat patches (Figure 11a): MCHSI is greater at low flow conditions and decreases rapidly as flow increases, so category I patches are suitable fish habitats at low flows (<800 m3/s). It is mainly distributed near the river bank. The category I habitat patches in the study river section have a total area of about 11,424 m2.
(2)
Category II habitat patches (Figure 11b): MCHSI is larger under moderate flow conditions (1000 to 2000 m3/s) and smaller under other conditions, and is mostly located in areas close to the riverbanks, which are areas of suitable habitat for fish under moderate flow conditions. The category II habitat patches in the study reach have a total area of about 9956 m2.
(3)
Category III patches (Figure 11c): MCHSI increases with flow and is larger under high flow conditions (>2000 m3/s), and this category of patches is small and occurs only in portions of the right bank of the upstream and downstream banks of the reach, totaling approximately 1268 m2.

4. Discussion

4.1. Reasons for Errors in the MCHSI Model

According to the test results of the MCHSI and the number of fish (Figure 7), the Pearson correlation coefficient value is 0.676, which suggests that the fish quantities are moderately correlated with the MCHSI. However, the fitted curve does not pass through the origin (the intercept is 3.977), that is, in areas where suitability is 0, there may still exist approximately four individual fish. The main reasons are as follows:
  • The fish species selected for this study accounted for 61.9% of all species surveyed in the catch, and the number of fish accounted for 84.3% of the total catch; some fish species were not included in the study due to a lack of information on the suitability curves, and thus would have contributed to a certain degree of error in the calculation of the MCHSI.
  • There are errors in the fish hydroacoustic detection results, so the number of fish signals in the grid may have some bias, leading to errors in the derivation of the weighting matrix.
  • The simulation error of the flow field in the study river section can also cause the deviation of the MCHSI in some areas of the river, resulting in a lower MCHSI in some areas with fish distribution.
But in general, the MCHSI can reflect the distribution of fish habitats in the study river section quite well.

4.2. Changing Characteristics of WUA

According to Figure 9, the WUA decreases rapidly as the flow increases, which is mainly due to the low suitable flow velocity and water depth for target fishes, while in most areas of the study reach, the water depth and flow velocity are greater than their suitable conditions. Therefore, when only these target fishes are considered, the smaller the flow, the larger the WUA, and the WUA decreases rapidly with the increase in flow.

4.3. Migration Patterns of Habitat Patches

According to Figure 11, when the flow is small (<1000 m3/s), suitable areas are mostly distributed in the near-shore areas of the river; as the flow gradually increases (1000–2000 m3/s), the size of patches of suitable habitat for fish begin to decrease and connectivity between patches diminishes; when the flow is large (>2000 m3/s), suitable patches of fish habitat exist in only a few areas on the reach, are small and have poor connectivity.
Due to the small depth and velocity of water suitable for the target fish, the trend of suitable habitat patches for fish with increasing flow generally shows a trend of decreasing area and connectivity, and the suitable habitat patches are distributed in the nearshore area of the river.

4.4. Advantages and Disadvantages of the Model

Currently, much of the habitat assessment research has been predominantly focused on studying a single [34,35,36,37], representative fish species (endangered or indigenous) within the study area. There is comparatively limited literature available on the quantitative assessment of comprehensive habitat suitability for multiple species within the study area. The multi-species habitat suitability model proposed in this study offers a comprehensive evaluation considering various fish species within the study area, enabling a more holistic depiction of the distribution of suitable habitat patches under different flow conditions. Furthermore, this model offers an intuitive representation of the size and connectivity changes in habitat patches within the study area.
However, as the proportion of fish population is the key to the weight matrix of the model, the suitability characteristics of abundant fish species receive greater emphasis in the results. Consequently, the final comprehensive suitability actually reflects the suitable habitat distribution of dominant species in the study area, while the habitat distribution characteristics of rare and less common species are less effectively highlighted.

5. Conclusions

This study is based on the suitability curves of water depth and current speed of Cyprinida, Triplophysa and Chimarrichthys kishinouyei in the downstream of the dam of Gongzui Hydropower Station. Through a survey of catches, the individual proportion of the target fishes was obtained, we constructed the weight matrix, and proposed the MCHSI Model. Combined with the two-dimensional hydrodynamic simulation results under different conditions, the suitability and habitat patches evolution process under different flow conditions were quantitatively analyzed. The results indicate that:
(1)
The evaluation results of the MCHSI model proposed in this study are consistent with the actual distribution of fish, and can better quantitatively evaluate the habitat distribution and suitability of multiple fish species in the reach.
(2)
Since the research objects all belong to aquatic species that adapt to low water depth and flow velocity, the WUA of the study reach decreases as the flow increases, and the decreasing rate is positively correlated with the increase rate of water depth and flow velocity.
(3)
Sensitivity analysis extracts the areas where the suitability of the reach is significantly affected by changes in flow conditions, and reveals the migration and evolution process of habitat patches with the flow: with the increase in flow, the distribution of habitat patches are highly correlated with the evolution trend of low water depth and low flow velocity areas in the reach. The habitat patches are distributed in the nearshore area, and with the increase in flow, they tend to concentrate in the low flow velocity areas downstream with a larger river width. The evolution process of habitat patches is in line with the suitability curve of the research fish objects, and the sensitivity analysis method proposed in this study can better quantify and evaluate the migration and evolution process of suitable habitat patches for multiple species.
(4)
This model requires accurate species suitability curve data, and currently, many species, especially endangered and rare species, have difficulty in studying their suitability curves, which limits the application of this model. Future research directions can consider the relationship between predation, competition, or cooperation among multiple species, and combine the quantity and distribution characteristics of species to analyze the evolution process of the quantity and distribution of various groups, revealing the selection mechanism of water conservancy operation on the evolution direction of population structure in river sections. The research results can also be used to predict the quantity and distribution of fishery resources.

Author Contributions

Conceptualization, X.W.; methodology, Y.H.; software, Y.H.; formal analysis, Y.H.; investigation, H.L. and F.C.; resources, H.L.; data curation, K.C., Z.W. and B.W.; writing—original draft preparation, Y.H.; writing—review and editing, X.W. and Y.H.; visualization, Y.H.; supervision, X.W.; funding acquisition, X.W. All authors have read and agreed to the published version of the manuscript.

Funding

This research was funded by the Ministry of Science and Technology of the People’s Republic of China, and the name of the fund was “National key research and development program ‘Research on the technical system for monitoring and evaluating the effects of fish passing facilities’”, with the grant number was 2022YFC3204204.

Institutional Review Board Statement

Not applicable.

Informed Consent Statement

Not applicable.

Data Availability Statement

Not applicable.

Conflicts of Interest

The authors declare no conflict of interest.

Abbreviations

AbbreviationsExpansions
WUAWeighted Usable Area
PHABSIMPhysical Habitat Simulation System
MCHSIMulti-Species Combined Habitat Suitability Index
ADCPAcoustic Doppler Current Profiler

References

  1. Jager, H.I.; Chandler, J.A.; Lepla, K.B.; van Winkle, W. A theoretical study of river fragmentation by dams and its effects on white sturgeon populations. Environ. Biol. Fishes 2001, 60, 347–361. [Google Scholar] [CrossRef]
  2. Esguícero, A.L.; Arcifa, M.S. Fragmentation of a Neotropical migratory fish population by a century-old dam. Hydrobiologia 2010, 638, 41–53. [Google Scholar] [CrossRef]
  3. Lange, K.; Meier, P.; Trautwein, C.; Schmid, M.; Robinson, C.T.; Weber, C.; Brodersen, J. Basin-scale effects of small hydropower on biodiversity dynamics. Front. Ecol. Environ. 2018, 16, 397–404. [Google Scholar] [CrossRef]
  4. Vörösmarty, C.J.; McIntyre, P.B.; Gessner, M.O.; Dudgeon, D.; Prusevich, A.; Green, P.; Glidden, S.; Bunn, S.E.; Sullivan, C.A.; Liermann, C.R.; et al. Global threats to human water security and river biodiversity. Nature 2010, 467, 555–561. [Google Scholar] [CrossRef]
  5. Fronk, B.M.; Neal, R.; Garimella, S. Evolution of the transition to a world driven by renewable energy. J. Energy Resour. Technol. 2010, 132, 021009. [Google Scholar] [CrossRef]
  6. Mischke, P.; Karlsson, K.B. Modelling tools to evaluate China’s future energy system–a review of the Chinese perspective. Energy 2014, 69, 132–143. [Google Scholar] [CrossRef]
  7. Spence, R.; Hickley, P. The use of PHABSIM in the management of water resources and fisheries in England and Wales. Ecol. Eng. 2000, 16, 153–158. [Google Scholar] [CrossRef]
  8. Nagaya, T.; Shiraishi, Y.; Onitsuka, K.; Higashino, M.; Takami, T.; Otsuka, N.; Akiyama, J.; Ozeki, H. Evaluation of suitable hydraulic conditions for spawning of ayu with horizontal 2D numerical simulation and PHABSIM. Ecol. Model. 2008, 215, 133–143. [Google Scholar] [CrossRef]
  9. Miao, Y.; Li, J.; Feng, P.; Dong, L.; Zhang, T.; Wu, J.; Katwal, R. Effects of land use changes on the ecological operation of the Panjiakou-Daheiting Reservoir system, China. Ecol. Eng. 2020, 152, 105851. [Google Scholar] [CrossRef]
  10. Wen, X.; Lv, Y.; Liu, Z.; Ding, Z.; Lei, X.; Tan, Q.; Sun, Y. Operation chart optimization of multi-hydropower system incorporating the long-and short-term fish habitat requirements. J. Clean. Prod. 2021, 281, 125292. [Google Scholar] [CrossRef]
  11. Dai, L.; Wang, Y.; Dai, H.; Li, W.; Zheng, T.; Zhang, Q. Assessment of Environmental Flow Requirements for Four Major Chinese Carps in the Lower Reaches of the Jinsha River, Southwest China. Front. Ecol. Evol. 2022, 10, 318. [Google Scholar] [CrossRef]
  12. Ban, X.; Guo, Z.; Xiong, X.; Liu, X.Q.; Ma, Y.X.; Wang, H.Z. Applying physical habitat model of zoobenthos in typical reaches of the Yangtze River. J. Hydraul. Eng. 2020, 51, 936–946. [Google Scholar]
  13. O’Keefe, D.M.; O’Keefe, J.C.; Jackson, D.C. Factors influencing paddlefish spawning in the Tombigbee Watershed. Southeast. Nat. 2007, 6, 321–332. [Google Scholar] [CrossRef]
  14. Zhou, J.; Zhao, Y.; Song, L.; Bi, S.; Zhang, H. Assessing the effect of the Three Gorges reservoir impoundment on spawning habitat suitability of Chinese sturgeon (Acipenser sinensis) in Yangtze River, China. Ecol. Inform. 2014, 20, 33–46. [Google Scholar] [CrossRef]
  15. Wang, P.; Shen, Y.; Wang, C.; Hou, J.; Qian, J.; Yu, Y.; Kong, N. An improved habitat model to evaluate the impact of water conservancy projects on Chinese sturgeon (Acipenser sinensis) spawning sites in the Yangtze River, China. Ecol. Eng. 2017, 104, 165–176. [Google Scholar] [CrossRef]
  16. Deng, Q.; Zhang, X.; Zhao, Z.; Tang, W. Conservation and restoration of riverine spawning habitats require fine-scale functional connectivity and functional heterogeneity. Sci. Total Environ. 2023, 857, 159571. [Google Scholar] [CrossRef]
  17. Khwairakpam, E.; Dhawan, B.; Sivakumar, K.; Johnson, J.A. Habitat suitability modeling of a conservation-significant fish species of the Kosi River, Uttarakhand, India. River Res. Appl. 2023, 39, 189–199. [Google Scholar] [CrossRef]
  18. Booker, D.; Dunbar, M. Application of physical habitat simulation (PHABSIM) modelling to modified urban river channels. River Res. Appl. 2004, 20, 167–183. [Google Scholar] [CrossRef]
  19. Yao, W.; Rutschmann, P. Three high flow experiment releases from Glen Canyon Dam on rainbow trout and flannelmouth sucker habitat in Colorado River. Ecol. Eng. 2015, 75, 278–290. [Google Scholar] [CrossRef]
  20. Liu, J. Preliminary Study on the United Dispatching for the Cascade Hydropower Stations in Dadu River Basin. Water Power 2007, 33, 5–8. [Google Scholar]
  21. Chen, B.; Wang, D.; Zhang, D.; Peng, Q. Conservation of aquatic ecosystems and fish species during hydropower development in the river basin: Case study for the Dadu River Basin. Water Resour. Hydropower Eng. 2022, 53 (Suppl. 1), 347–357. [Google Scholar]
  22. Huai, W.; Zhao, Z.; Tong, H.; Zhang, C. Numerical simulation on flood in downstream of Weihe River and flooded area (I)—Mathematic model and its calculation method. Eng. J. Wuhan Univ. 2003, 36, 10–14. [Google Scholar]
  23. Liu, Y.; Jin, Z.; Lin, C.; Tan, J.; Wei, L. Application of Multi-dimensional Quantization System for Target Fish Species Based on Comprehensive Weighting-TOPSIS Model in Nandu River Basin. J. Hydroecol. 2022, 1–20. [Google Scholar] [CrossRef]
  24. Li, D.; Ke, S.; Xu, J.; Jiao, Y.; Bai, T.; Cheng, B.; Tao, Y.; Wang, Y.; Shi, X.; Sun, Q. Downstream migration of Juvenile fish at Songxin Hydropower Station on the HeishuiRiver, a tributary of the Jinsha River. J. Lake Sci. 2023, 35, 958–997. [Google Scholar]
  25. Deng, X.; Wang, W.; Fang, Y.; Huang, D. Fish Community Structure in the Leshan Section of Dadu River. J. Hydroecol. 2020, 41, 53–61. [Google Scholar]
  26. Wang, W.; Fang, Y.; Yang, Z.; Huang, J.; He, C.; Du, X. Fish community structure and diversity in the leshan section of Dadu River. J. Hydroecol. 2023, 44, 62–69. [Google Scholar]
  27. Chen, M.; Wu, D.; Ji, X.; Lang, J. The Engineering Design of Artificial Fish Spawning Field in Lianghekou Hydropower Station of Yalong River. Sichuan Environ. 2018, 37, 83–89. [Google Scholar]
  28. Edwards, E.A.; Twomey, K. Habitat Suitability Index Models: Common Carp; Western Energy and Land Use Team, Office of Biological Services, Fish and Wildlife Service, US Department of the Interior: Fort Collins, CO, USA, 1982. [Google Scholar]
  29. Hou, J.; Wang, X.; Miao, L.; Ding, W.; Wu, M. Technical Guide to the Instream Flow Incremental Methodology, 1st ed.; China Water and Power Press: Beijing, China, 2021. [Google Scholar]
  30. Yang, Z.; Zhang, Y. Comparison of methods for ecological and environmental flow in river channels. Chin. J. Hydrodyn. 2003, 18, 294–301. [Google Scholar]
  31. Wang, X.; Yan, Z. Effect of Hydraulic Characteristics of Confluent Channel on Physical Habitat for Fish Communities. J. Tianjin Univ. (Sci. Technol. ) 2008, 41, 204–208. [Google Scholar]
  32. Zhang, Y.; Zhou, J.; Zhang, B.; Gao, F.; Ma, B. Pollution Evaluation of Toxic Heavy Metals in the Sediments of Songhua River. J. Hunan Univ. (Nat. Sci. ) 2015, 42, 113–118. [Google Scholar]
  33. Zhu, Y.; Du, H.; Qiu, B.; Wang, C.; He, S.; Jiang, Z. Study on Characteristic Curve Correction of Cascade Hydropower Stations in the Middle and Lower Reaches of Dadu River. Water Resour. Power 2023, 41, 61–64. [Google Scholar]
  34. Garcia-Rodriguez, E.; Martinez-Austria, P.F.; de Jalon-Lastra, D.M.G.; Ochoa-Franco, L.A. Determination of the weighted usable area for Salmo trutta species in a stretch of the Lozoya River, Spain. Ing. Hidraul. Mex. 2009, 24, 19–32. [Google Scholar]
  35. Chang, Y.L.; Hsieh, T.Y.; Chen, C.H.; Yang, J.C. Two-Dimensional Numerical Investigation for Short- and Long-Term Effects of Spur Dikes on Weighted Usable Area of Rhinogobius candidianus (Goby). J. Hydraul. Eng. 2013, 139, 1297–1303. [Google Scholar] [CrossRef]
  36. Zhao, Y.; Zhou, J.; Zhang, H.; Bi, S.; Zhang, Y. lmpact of Three Gorges reservoir operation with ahead impounding water on Acipenser sinensis spawning. J. Hydroelectr. Eng. 2013, 32, 83–89. [Google Scholar]
  37. Li, P.; Liang, C. Simulation for the impact of floodplain woodland development to fish habitat area. Resour. Environ. Yangtze Basin 2016, 25, 1286–1291. [Google Scholar]
Figure 1. Location and terrain elevation of the research area.
Sustainability 15 14801 g001
Figure 2. Computational domain and mesh for 2D flow fields.
Sustainability 15 14801 g002
Figure 3. Relative error distribution of simulation results.
Sustainability 15 14801 g003
Figure 4. Suitability curves for Chimarrichthys kishinouyei, Triplophysa and Cyprinidae.
Sustainability 15 14801 g004
Figure 5. The process of weight matrix calculation.
Sustainability 15 14801 g005
Figure 6. Fish quantity distribution and cluster analysis results under G4 condition.
Sustainability 15 14801 g006
Figure 7. The distribution of MCHSI and the results of linear regression between the number of fish and the MCHSI.
Sustainability 15 14801 g007
Figure 8. MCHSI distribution under specific conditions.
Sustainability 15 14801 g008
Figure 9. WUA and water level under different flow conditions.
Sustainability 15 14801 g009
Figure 10. Variability of MCHSI under all flow conditions.
Sustainability 15 14801 g010
Figure 11. Distribution of different categories of suitable habitat patches and changes in their MCHSI. (a) The distribution and MCHSI changes of patches in category I habitat patches. (b) The distribution and MCHSI changes of patches in category II habitat patches. (c) The distribution and MCHSI changes of patches in category III habitat patches.
Sustainability 15 14801 g011
Table 1. Operating conditions of the hydropower station during the observation period.
Condition No.Water Level Below Reservoir (m)Reservoir Inflow (m3/s)Reservoir Outflow (m3/s)
G1522.74921811
G2522.74599944
G3522.488311150
G4522.226061310
Table 2. Species and quantities of the investigation of catches.
Fish CatalogFish Quantity
CypriniformesCobitidaeNoemacheilinaeParacobitisHomatula berezowskii1
TriplophysaTriplophysa hexiensis20
Triplophysa bleekeri4
CobitinaeMisgurnusMisgurnus anguillicaudatus2
Cyprinidae PseudorasboraPseudorasbora parva2
SqualidusSqualidus argentatus1
SaurogobioSaurogobio dabryi40
Abbottina rivularis7
ZaccoZacco platypus24
LeuciscinaeOpsariichthysOpsariichthys bidens6
SchizothoracinaeSchizothoraxSchizothorax prenanti3
Schizothorax davidi2
GoblobotinaeGobiobotiaGobiobotia filifer4
SpinibarbusSpinibarbus sinensis1
BalitoridaeHomalopterinaeHemimyzonJinshaia abbreviata3
SiluriformesBagridae PelteobagrusTachysurus vachellii3
Sisoridae GlyptothoraxGlyptothorax sinensis6
EuchiloglanisChimarrichthys kishinouyei10
Amblycipitidae LeiobagrusLeiobagrus marginatus4
Siluridae SilurusSilurus meridionalis1
Ictaluridae IctalurusIctalurus punctatus2
Table 3. Weight matrix of suitability factors for different fish habitats.
Catalog of FishesFish Quantity ProportionHabitat FactorWeight
TriplophysaPT(0.19)Water depth (m)WT,D
Current speed (m/s)WT,V
CyprinidaePC(0.73)Water depth (m)WC,D
Current speed (m/s)WC,V
Chimarrichthys kishinouyeiPE(0.08)Water depth (m)WE,D
Current speed (m/s)WE,V
Notice: 1. PT + PC + PE = 1, the parameter value is the proportion of the population of this fish species. 2. Wherein WT,D + WT,V =1, WC,D + WC,V =1, WE,D + WE,V =1; 3. The subscript T represents Triplophysa, C represents Cyprinidae, and E represents Chimarrichthys kishinouyei, D represents depth, V represents current speed.
Disclaimer/Publisher’s Note: The statements, opinions and data contained in all publications are solely those of the individual author(s) and contributor(s) and not of MDPI and/or the editor(s). MDPI and/or the editor(s) disclaim responsibility for any injury to people or property resulting from any ideas, methods, instructions or products referred to in the content.

