1. Introduction
The COVID-19 epidemic is a major international public emergency. Although the epidemic has passed away in China, its harm to the economy and society far exceeded people’s expectations. The emergency information response system (EIRS) is a system that can quickly and efficiently collect and analyze information by using various intelligence technologies, helping organizations make quick and effective responses to emergencies, which played a vital role in the control of emergencies in China. For example, it can accurately monitor the track of affected people in China through big data technology. From the content contained in EIRS, it can be seen that in urban construction and sustainable development, EIRS also played an important role in quickly restoring the original functions of the city when the city faced various disasters.
Many scholars have conducted research on EIRS, and their views are as follows: Excellent EIRS can achieve a series of goals in emergency management by exploring the essence of emergency management [
1]. Therefore, when facing emergency problems, the government needs to have a highly unified information system and a high degree of organizational flexibility. Therefore, in order to better promote the development of EIRS, many countries have conducted in-depth research on key technologies such as information integration mechanisms and information security of emergency platforms [
2,
3,
4,
5], improving their financial support capabilities, including personnel costs, equipment costs, management costs, equipment consumption, and maintenance costs, thereby greatly improving their security capabilities when facing emergency problems [
6]. The widespread use of devices such as mobile phones and robots has made it easier to collect more and more accurate emergency information [
7,
8]. The full application of IT applications has also improved the ability to mine information [
9], further unleashed organizational flexibility [
10,
11], and optimized the government’s emergency management decision-making ability.
Prior research laid the foundation for improving the capability of EIRS. However, EIRS sometimes cannot produce a desirable efficiency, as decision-makers may not be able to effectively utilize EIRS in certain situations, such as excessive information mining or misuse of information security [
4,
12,
13]. Thus, a scientific way is needed to identify critical success factors (CSFs) and to clarify the relationships among factors. Decision-makers should pay more attention to the CSFs. Less attention should be paid to those non-CSFs to avoid negative effects on emergency management.
Previous studies used methods such as unstructured interviews [
7] and questionnaires [
14] to explore the potential and important factors, which did not adequately identify the CSFs of EIRS because of decision-makers’ (DMs) incomplete knowledge structure and different educational backgrounds. Therefore, it is critical to apply an appropriate decision-making method to identify the CSFs of EIRS. The Decision Experiment and Decision-Making Trial and Evaluation Laboratory (DEMATEL) method has been used to identify CSFs in many studies [
15]. Like several methods to enhance the efficiency of emergency management [
16,
17,
18,
19,
20], the DEMATEL method needs experts to evaluate the interrelation among factors. However, DMs may provide hybrid evaluation values, and the evaluation values may contain some missing values. Unfortunately, scholars have not conducted in-depth research on this kind of DEMATEL method in these situations.
To address these limitations, a novel Similar-DEMATEL method with hybrid assessment scales of crisp value and interval value was proposed to identify CSFs of EIRS in the decision environments containing missing values.
The main contributions of this study are as follows:
- (1)
A total of 10 factors of EIRS, which are utilized to explore the causal relationships between factors, are summarized from existing literature.
- (2)
A matrix with missing values for DEMATEL was constructed and compensates for missing values through similarity degree.
- (3)
CSFs of EIRS were identified by the novel method. Four factors were identified as CSFs, and six factors were identified as non-CSFs. Based on the results, suggestions were proposed in the discussion that would enhance the efficiency of governmental emergency management.
The remainder of this paper is organized as follows:
Section 2 reviews the previous related work.
Section 3 introduces the preliminaries, including factors of EIRS and symbol descriptions.
Section 4 presents the proposed Similar-DEMATEL method.
Section 5 illustrates the result of decision-making.
Section 6 provides decision-making suggestions. The conclusions are provided in the concluding section (
Section 7).
4. The Proposed Method
Abdullah (2022) argued that the accuracy and stability of data predictions can be effectively improved by using historical scenarios in similar situations [
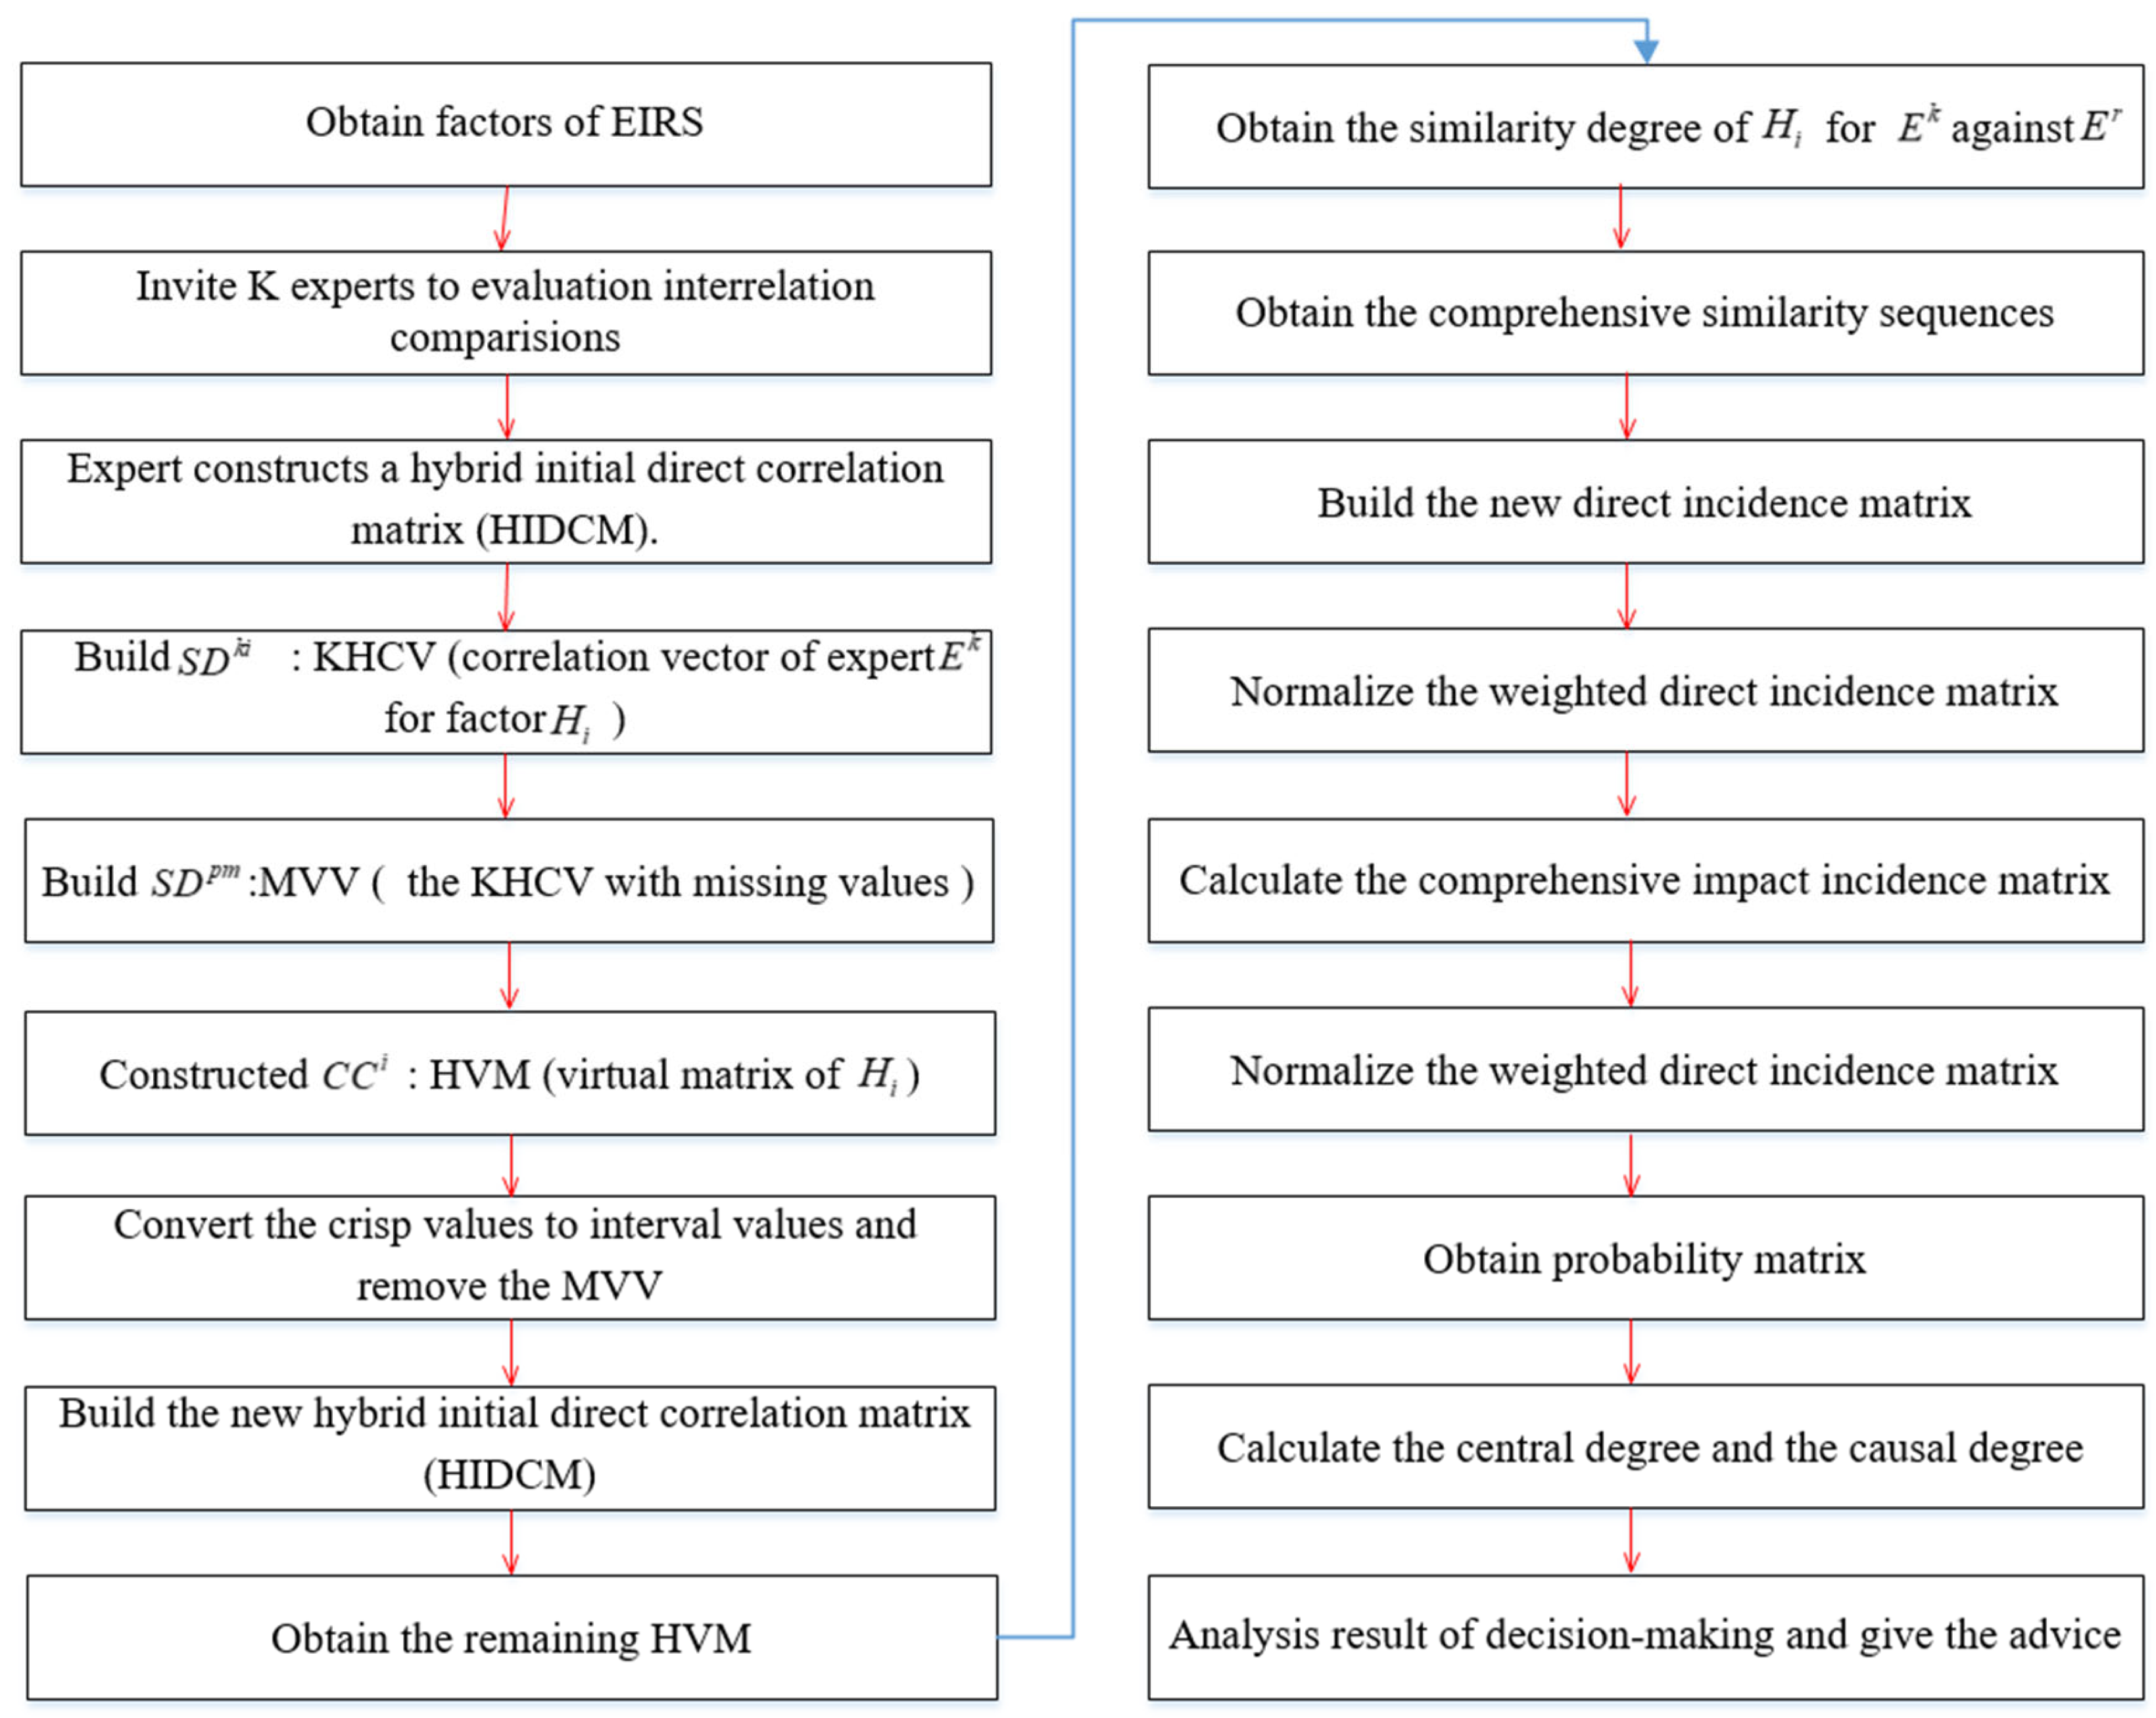
60]. In this paper, we suppose that under similar situations, the experts who hold the same idea have an identical pairwise comparison of two factors. Based on this point, the following decision-making process is presented:
Step 1: experts from different fields were invited to evaluate interrelationship comparisons among factors. Each expert () constructs a HIDCM.
Let be a vector of assessments of comparison for against for expert in HIDCM. That is to say, , is an evaluation value of HIDCM by . We called a KHCV (correlation vector of expert for factor ). For instance, the correlation vector of for is . Thus, vectors about KHCV were formed for by all experts. Let be KHCV with missing values for by . We called a MVV. Assume that a HIDCM for has MVV.
For , we constructed a matrix , where is transposition of the matrix. We called a HVM (virtual matrix of ). For example, the HVM of a factor is . Therefore, there are n HVMs in our decision-making situation. Assume that HVM of contains MVV. Obviously, the sum of the MVV of HIDCM by all experts equals the sum of the MVV of all HVMs, that is to say, .
Step 2: Convert the crisp values to interval values and remove the MVV. The crisp values in HIDCM (
) are converted into interval values according to the literature [
61].
Thus, the hybrid initial direct correlation matrix (HIDCM) becomes a new matrix . Therefore, of is composed of interval numbers in addition to MVV.
Then, we delete the from of . The remaining HVM of is .
Step 3: Introduce the similarity degree of literature [
60,
62], the similarity degree of
for expert
against expert
is,
Since the interrelation comparison of chosen factors on themselves is 0, namely, .
Step 4: The comprehensive similarity degree of
for expert
is,
Similarly, the comprehensive similarity degree of
for expert
is,
Therefore, comprehensive similarity sequences of factors are constructed.
Step 5: Similarly, comprehensive similarity sequences of other factors are constructed. Because the remaining HVM of is constructed by the KHCV of the remaining experts, of . Thus, the corresponding position of the comprehensive similarity sequence of is supplemented with 0. In this way, the synthesis matrix () is constructed, where, indicates the factors, , indicate the experts, .
Step 6: Calculate the average preference value of each expert.
Step 7: To calculate the expert proximity value, the formula is . If the expert proximity value between and has the smallest deviation in all values, we thought the two experts had the same idea in this situation. Then, the missing values of are imputed by an assessment of in the same position. The formula is .
Step 8: Therefore, a new direct incidence matrix
is constructed.
Step 9: Weight the new direct incidence matrix according to the number of experts.
Normalize the weighted direct incidence matrix, that is,
Step 10: Calculate the comprehensive impact incidence matrix
, where “
“ is the unit matrix.
Obtain a degree of influential impact
and a degree of influenced impact
.
Step 11: Obtain a probability matrix of
. we use the ranking method of interval numbers proposed by [
63]. The formula is,
where
The formula for the probability matrix of
is,
where
Calculate the crisp values of the degree of influence. The formula is,
Calculate the crisp values of the degree of influence. The formula is,
Step 12: Calculate the central degree. The formula is,
Calculate the causal degree. The formula is,
Factors can be divided into two categories by causal degree. A factor greater than or equal to zero is considered the cause factor. A factor less than zero is regarded as the effect factor. The cause factor can influence other factors and is usually considered a CSF when its central degree does not rank too low, while the effect factor is passive; therefore, it is not easily considered a CSF.
The decision flowchart is as follows (
Figure 1).
5. The Result of Decision-Making
Firstly, 11 experts in related fields (i.e., information, emergency management) were invited to conduct a questionnaire survey on the influential factors of EIRS. Secondly, in order to meet the expectations of experts to a greater extent, experts were allowed to give crisp values or interval values to evaluate the interrelationship among factors. Dytczak&Ginda (2013) considered that the assessment scale can be N scales (N is a natural number) [
36]. The assessment from 0 to 9 (“None”, “Very weak”, “Relatively weak”, “Somewhat weak”, “Slightly weak”, “Moderate”, “Slightly strong”, “Somewhat strong”, “Relatively strong” and “Very strong”) in this evaluation is applied to describe the interrelationship. In addition, the interrelationship comparisons among factors by interval values are in [0, 9]. Thirdly, if an expert cannot give an assessment of the interrelationship comparisons among certain factors, he/she may not give the evaluation value. We asked each expert not to exceed two missing values during the evaluation process.
5.1. Step of Decision-Making
Step 1: Consider the limited space; the hybrid initial direct correlation matrix of Expert 1 is shown in
Table 2.
For convenience, we only listed the virtual matrix of factor
, as shown in
Table 3.
Step 2: It can be seen that the HVM of factor F1 by experts 2, 5, 8, and 11 has missing values from
Table 3. We deleted these MVVs. Then, we converted the crisp values into interval values and obtained the interval virtual matrix of factor F1. They are shown in
Table 4.
Step 3: Calculate the comprehensive similarity degree of F1, as shown in
Table 5.
Step 4: Obtain the comprehensive similarity sequences of each expert for F1, as shown in
Table 6.
Step 5: Similarity: we obtain the comprehensive similarity sequences of every expert for F2, F3, F4, F5, F6, F7, F8, F9, and F10. We supplemented with 0 in the corresponding vacant position. The synthesis matrix is shown in
Table 7.
Step 6: Calculate the mean preference value of each expert, as shown in
Table 8.
Step 7: Obtain the expert proximity value, as shown in
Table 9.
The difference between the proximity values of Expert 1 and Expert 6 is 0.0027. It shows that Expert 1 and Expert 6 have the most consistent ideas among all experts. Therefore, we apply the assessment of Expert 6 to fill in the missing values of Expert 1 in the corresponding position of HIDCM. That means that Expert 1 obtained the assessment of the interrelation of F2 against F5 and F6 of 2 and 5, respectively.
The hybrid initial direct correlation matrix built by Expert 4, Expert 7, and Expert 9 has no missing values. The missing values of HIDCM by other experts are imputed in a similar way, as shown in
Table 10.
Step 8: Convert the assessments into interval numbers. Therefore, the new direct incidence matrix for Expert 1 is shown in
Table 11 as an example.
Step 9: The weighted new direct incidence matrix is obtained, as shown in
Table 12.
Step 10: Calculate the interval values of the degree of influential impact and the degree of influenced impact. The interval values of degree of influential impact are: F1 = [2.58, 3.23], F2 = [2.69, 3.3], F3 = [2.81, 3.24], F4 = [2.56, 3.02], F5 = [2.95, 3.41], F6 = [3.04, 3.55], F7 = [3.34, 3.87], F8 = [3.73, 4.39], F9 = [3.14, 3.68], and F10 = [4.02, 4.57]. The interval values of degree of influenced impact are: F1 = [3, 3.6], F2 = [3.13, 3.64], F3 = [3.06, 3.65], F4 = [2.89, 3.35], F5 = [3.32, 3.87], F6 = [3, 3.45], F7 = [3.17, 3.7], F8 = [3.09, 3.68], F9 = [2.87, 3.37], and F10 = [3.33, 3.96].
Step 11: Calculate the crisp values of the degree of influential impact and the degree of influenced impact. The crisp values of degree of influential impact are: F1 = 2.408; F2 = 2.9345; F3 = 3.0622; F4 = 1.5197; F5 = 4.2246; F6 = 5.1215; F7 = 7.0233; F8 = 8.6855; F9 = 5.8247; and F10 = 9.196. The crisp values of degree of influenced impact are: F1 = 4.5506, F2 = 5.3188, F3 = 5.0379, F4 = 2.7107, F5 = 7.2401, F6 = 3.7541, F7 = 5.7815, F8 = 5.3045, F9 = 2.7652, and F10 = 7.5365.
Step 12: Obtain the central degree and the causal degree. The central degrees are: F1 = 6.9586, F2 = 8.2533, F3 = 8.1001, F4 = 4.2304, F5 = 11.4647, F6 = 8.8756, F7 = 12.8048, F8 = 13.99, F9 = 58.5899, and F10 = 16.7325. The causal degrees are: F1 = −2.1426, F2 = −2.3844, F3 = −1.9757, F4 = −1.191, F5 = −3.0155, F6 = 1.3674, F7 = 1.2417, F8 = 3.3811, F9 = 3.0595, and F10 = 1.6594.
The type of central degree is
. The sort of causal degree is
. Cause factors are
. Effect factors are
. They are shown in
Figure 2.
5.2. Comparison with the Results of the Mean Input Method
In this paper, the mean imputation method is used to make a comparison with the proposed method. The missing values of one expert are filled by the weighted average value of the initial direct correlation matrix given by other experts, as shown in
Table 13.
Then, we calculated the degree of influential impact, the degree of influenced impact, the central degree, and the causal degree. The degrees of influential impact are: F1 = 2.4931, F2 = 2.9429, F3 = 3.0609, F4 = 1.5132, F5 = 4.2934, F6 = 5.0366, F7 = 7.0086, F8 = 8.679, F9 = 5.7785, and F10 = 9.1937. The degrees of influenced impact are: F1 = 4.5392, F2 = 5.2179, F3 = 4.9998, F4 = 2.8411, F5 = 7.2063, F6 = 3.7821, F7 = 5.8592, F8 = 5.2864, F9 = 2.8004, and F10 = 7.4675.
The central degrees are: F1 = 7.0323, F2 = 8.1609, F3 = 8.0607, F4 = 4.3544, F5 = 11.4997, F6 = 8.8187, F7 = 12.8679, F8 = 13.9655, F9 = 58.5789, and F10 = 16.6612. The causal degrees are: F1 = −2.0462, F2 = −2.275, F3 = −1.9389, F4 = −1.3279, F5 = −2.9129, F6 = 1.2545, F7 = 1.1494, F8 = 3.3926, F9 = 2.9781, and F10 = 1.7262.
It can be seen that the type of central degree and causal degree have not changed as per our proposed method. The sort of central degree is , and the sort of causal degree is . Cause factors are and effect factors are .
We carefully observe the difference between our proposed method and the mean imputation method. The maximum value of the central degree using the proposed method is 16.7325, the minimum value is 4.2304, and the difference is 12.5021. The maximum value of the central degree using the mean imputation method is 16.6612, the minimum value is 4.3544, and the difference is 12.3068. The maximum value of causal degree using the proposed method is 3.3811, the minimum value is −3.0155, and the difference is 6.3966. The maximum value of causal degree using the mean imputation method is 3.3926, the minimum value is −2.9129, and the difference is 6.3055. It can be easily observed that the difference between the central degree and the causal degree in our proposed method is larger than the mean imputation method.
In addition, we take the HIDCM of Expert 1 as an example to observe the characteristics of the imputation, as shown in
Table 14 and
Table 15.
Table 14 lists the new hybrid initial direct incidence matrix by the proposed method, and
Table 15 lists the new hybrid initial direct incidence matrix by the mean imputation method.
It can be seen that the assessment of F2 against F5 is [2.2, 2.3]. The imputation values of this method are integers or interval integers, while the values of the mean imputation method are decimals. It is different from the traditional DEMATEL assessment scale, in which the boundaries of crisp values or interval values are all integers.
6. Discussion
First of all, the causal degree of Information mining capability (F6), Equipment support capability (F7), Monitoring and early warning capability (F8), Information security capability (F9), and Organization participation capability (F10) are positive, which indicates that these factors will affect other factors. Secondly, the ranking of the central degree of Information security capability (F9) is low in all factors, which indicates that this factor is of low importance. Therefore, the CSFs of EIRS are F6, F7, F8, and F10. Therefore we propose the following suggestions:
6.1. Monitoring and Early Warning Capability
DMs should focus on information monitoring and early warning. ① Establish an early warning mechanism. DMs should establish the early-warning situation of where and what kind of emergency and report to who and which organizations. In this way, the high-level organization reasonably establishes the early-warning trigger threshold, which is, what kind of early-warning trigger threshold can be issued by which organizations. ② Improving the assessment, reward, and punishment systems It stimulates the enthusiasm and initiative of personnel in early warning work, effectively improves the response to all kinds of emergencies, and provides more accurate and intuitive information for scientific decision-making and scheduling.
6.2. Organization Participation Capability
The timely response of EIRS needs the cooperation of relevant organizations in different fields. Therefore, it is necessary to build a strong organizational structure to gather various organizations. In the process of strengthening organizational participation, DMs should pay attention to the following three points. ① Promote the profession of the organization. By fully integrating the knowledge of various fields into the EIRS, we can better respond to emergencies. Therefore, the organization should be jointly constructed by health, meteorological, public security, and other organizations, etc. ② Enhance the cooperation of the organizations. Different emergency scenarios, such as snow disasters, rainstorms, and epidemic situations, require the active participation of different organizations. It would improve the cooperation abilities of various organizations by collecting and actively combining information. ③ Foster the relevance of the daily work of various organizations. In their daily work, the high-level organization should pay attention to the correlation of organizations in various organizations, such as establishing relatively safe online communication channels, including QQ groups. This is helpful to maintain the relevance of cooperative organizations and to ensure more cooperation when emergencies arise.
6.3. Information Mining Capability
The accuracy of information mining affects the timely response to information. Therefore, we should conduct in-depth mining of information capability, which can effectively prevent risks and ensure the timeliness and accuracy of information responses. Therefore, a new generation of information technology analysis approaches (i.e., big data, artificial intelligence, and blockchain) are used to conduct in-depth mining of intelligence information and predict the changing trend of emergencies. In this way, DMs can better improve the effectiveness of EIRS and control the whole process of emergencies.
6.4. Equipment Support Capability
DMs should attach importance to the support capability of information equipment. ① Increase hardware investment. The storage and sharing of intelligence and the integration and mining of heterogeneous data depend on the input of hardware. If the input of hardware equipment is reasonable, DMs could better monitor and early-warn emergencies. ② Promote the fine management of equipment. DMs should standardize and improve the operation, maintenance, repair, and maintenance workflow of information equipment and establish a reasonable account system. Only in this way can the management and operation of information equipment be effectively improved. ③ Strengthen this study and assessment of information equipment users. DMs should fully improve the learning efficiency of equipment users, enable them to flexibly master new products and technologies of relevant information equipment, and improve the management and assessment mechanisms of equipment users.


