Abstract
In arid regions, the behavior of solar panels changes significantly compared to the datasheets provided by the manufacturer. Therefore, the objective of this study is to determine the performance of both polycrystalline and monocrystalline solar modules in an arid region characterized by a large potential for solar irradiation and high temperatures. The influence of environmental parameters, such as temperature and dust, on the output power of solar modules with different technologies (monocrystalline and polycrystalline) has been investigated. The Artificial Hummingbirds Algorithm (AHA) has been used to extract parameters for PV modules. As a result, it has been demonstrated that for high solar irradiation, the polycrystalline PV module experiences a smaller decrease in output power than the monocrystalline PV module as the module temperature increases. The percentage drop in output power is approximately 14% for the polycrystalline PV module and nearly 16% for the monocrystalline PV module. However, for low solar irradiation, it is advisable to use monocrystalline modules, as a 21% decrease in power was observed for polycrystalline modules compared to a 9% decrease for monocrystalline modules. Additionally, the monocrystalline PV module was more affected by dust than the polycrystalline PV module under high solar irradiation conditions, while under low incident solar radiation, the polycrystalline PV module was more affected by dust than the monocrystalline PV module. The power drop of the monocrystalline PV module was greater than that of the polycrystalline PV module for high solar radiation (>500 W/m2). Therefore, the advantage of this proposed work is to recommend the use of polycrystalline solar panels in regions characterized by high solar irradiation and high temperatures instead of monocrystalline solar panels, which are more efficient in regions worldwide characterized by low solar irradiation and low temperatures.
1. Introduction
The most common renewable energy source used to generate electricity is solar energy based on solar modules that use the photovoltaic (PV) effect [1]. PV systems are environmentally friendly and continuously convert sunlight into electricity by using solar irradiation available all over the world, especially in countries near the equator, which have great potential for solar energy [2].
The output power of a PV module can be affected by many environmental parameters, such as temperature and dust, which affect the efficiency of the PV module. The current produced by the PV module is due to the incident solar irradiation received on the surface of the PV module. Thus, the output power of the PV module also depends on its surface. Solar module manufacturers always provide the specifications of each module under standard test conditions (STC), which correspond to an incident irradiation value of 1000 W/m2 at 25 °C. The different parameters of a solar module are short circuit current (ISC), open circuit voltage (VOC), maximum output current (Imax), maximum output voltage (Vmax), maximum output power (Pmax), module efficiency (%) and the temperature coefficient (%/°C). The latter affects the output power of the PV module if the temperature of the PV module increases more than 25 °C. This is because when the temperature increases, the current generated by the PV module decreases, and the output power decreases [3,4]. The first generation of solar modules is made of monocrystalline silicon or polycrystalline silicon [5]. The second generation of solar modules consists of thin film solar cells, and the third generation of solar cells is represented by organic, perovskite and dye-sensitized solar cells.
Many studies have investigated the performance of PV systems using different system configurations and different weather conditions. The performance of a standalone PV system of almost 171 kWp, with polycrystalline solar modules, was investigated for one year in Greece [6]. The results showed a performance ratio of 0.68% and a capacity factor of 15.27%. Another investigation used polycrystalline solar modules with a capacity of 500 kWp and was monitored in Thailand for 8 months [7]. The results showed a maximum capacity factor of 72%, while the maximum efficiency recorded was 12%. In addition, a 3 MWp monocrystalline solar module was tested in India [8]. The results revealed that the best energy production is 1372 kWh for a performance ratio of 0.69, with an efficiency of 14% and an average capacity factor of 11%. Another standalone PV system using 281 kW polycrystalline solar modules was tested in South Africa [9]. The results showed a performance ratio and efficiency of 0.7 and 17.2%, respectively. An experiment with 12.5 kWp of an on-grid PV system using polycrystalline solar panels yielded a performance ratio of 0.873 in Sardinia, Italy [10]. A study investigated the performance of a concentrated PV (CPV) system using polycrystalline solar modules with two-axis tracking systems [11]. The results indicated that the CPV produced 4.6% more energy than the conventional PV system.
An investigation of three types of PV systems was evaluated in Turkey [12] using a monocrystalline PV system of 1170 Wp, a polycrystalline PV system of 1250 Wp and a Cd/Te PV system of 1200 Wp. The results showed that the Cd/Te PV system produced 10.43% more power than the polycrystalline system and 8.32% more power than the monocrystalline system.
The performance of six different large-scale systems was investigated in Spain [13]. The systems were 2.7 MWp and 1.4 MWp using a polycrystalline PV system with dual-axis tracking, 370 kWp using a polycrystalline with a fixed system, 1.3 MWp using a monocrystalline single-axis system, 1.3 MWp monocrystalline two-axis system and 4.6 MWp a polycrystalline standalone PV system. The results showed that the system 1.4 MWp polycrystalline PV system gave the best performance ratio of 0.85 compared to the other systems installed. The lowest performance was found by the 1.3 MWp monocrystalline two-axis system, with a performance ratio of 0.65. Recently, two bifacial PV modules using monocrystalline and polycrystalline standalone PV systems were compared [14]. The results revealed that the polycrystalline PV system produced more energy than the monocrystalline PV system.
Many other studies deal with the extraction of parameters from solar modules, including analytical, numerical and hybrid numerical with analytical approaches. In [15], a tree seed algorithm (TSA) was elaborated for parameter extraction of the STM6-40/36 PV module. It was found that TSA had the lowest RMSE value at all run times compared to other methods. An improved algorithm was proposed in [16], known as the firefly algorithm (IFA) technique, for extracting both the PV cell parameters operating under different environmental conditions and finding the global maximum power point (GMPP) that provides optimal performance in PV systems with minimal loss in power and within the shortest time. An improved queuing search optimization (QSO) algorithm based on the differential evolution (DE) technique and bound constraint amendment procedure was proposed [17] to extract PV parameter values for various PV models. This method has outperformed other state-of-the-art algorithms in terms of convergence speed, reliability and accuracy. An atomic orbital search algorithm was proposed [18] to extract the parameters of a single diode, double diode and three diode models for RTC France and PVM752 GaAs thin film solar cell, including an accurate calculation of RMSE using 30 different methods published in several literature. An improved moth flame algorithm with local escape operators (IMFOL) was introduced [19], where the LEO technique was used to improve the MFO algorithm’s efficiency and the results’ precision. PV parameters have been estimated on a hybrid analytical/numerical approach [20], in which the photocurrent, the reverse saturation current and the ideality factor are found using an analytical approach based on the datasheet provided by the manufacturer under STC conditions and the series and shunt resistances are calculated by a numerical approach. Numerical derivative (dI/dV) information has been used to extract PV parameters [21], such that a high-quality solution can be achieved by the linear least squares technique. Furthermore, the solution can be improved by a two-step nonlinear optimization procedure using the Levenberg–Marquardt algorithm or trust-region reflective algorithm. An optimization algorithm named AHA (Artificial Hummingbird Algorithm) is presented to determine the internal physical PV parameters of a polycrystalline solar module type 320W-72P and a PV array of three polycrystalline PV modules connected in series under real operating conditions [22].
Recently, many research works have investigated the degradation of silicon photovoltaic modules due to the dust effect. In fact, an experimental investigation was carried out at the University of Malaga (Spain) and revealed that the incident solar irradiation on solar cells is reduced due to the accumulation of dust on the surface of the PV module, and then the output power of the cell is also reduced. The obtained results indicated that the average daily energy loss over a year is around 4.4%. Also, the daily energy losses can reach 20% if no rain occurs during a long period [23]. Around 156 PV modules were tested and characterized and then compared with three other PV modules in Florida, USA [24]. It was found that the power degradation rates vary between −0.14% and −3.22% per year. By using electroluminescence imaging, it was found that the losses are primarily resistive, which are caused by corrosion of the back contact Ag/solder interface and, to a lower degree, gridline Ag oxidation. A modeling-based machine learning using an optical model was developed to determine the solar cell efficiency’s degradation due to the accumulation of dust [25,26]. Glass substrates were used to collect dust for 4 months using a scattering model procedure. The dusty glasses were tested using a UV-Vis spectrometer. The collected data were used as input to the proposed model to estimate the degradation in the glass substrate. The validation was performed by matching almost 89% of the predicted data with the actual degraded monocrystalline cell.
In this work, we first investigated the performance of polycrystalline and monocrystalline PV modules under different weather conditions, especially in arid regions that are characterized by hot temperatures and large amounts of solar irradiation [27]. In addition, the AHA was used to extract the parameters of monocrystalline and polycrystalline solar modules. The numerical results showed a greater power drop for low solar radiation for both polycrystalline and monocrystalline solar modules.
The main objectives of this work are as follows:
- Determine the performance of polycrystalline and monocrystalline solar modules in an arid region characterized by a large potential of solar irradiation and high temperatures.
- Study the influence of environmental parameters on the output power of solar modules with different technologies (monocrystalline and polycrystalline).
- Investigate the effects of temperature and dust on the performance of PV modules of type monocrystalline and polycrystalline.
- Apply a meta-heuristic optimization algorithm for the extraction of parameters from monocrystalline and polycrystalline solar modules.
This paper introduces some innovative aspects. It combines experimental data with algorithmic analysis, establishing a strong synchronization between the two and enhancing the credibility of the findings. The exploration of thermoelectric modules as cooling strategies for solar panels contributes to system optimization, addressing power drop challenges. The paper also recognizes the importance of generalizing findings to other hot regions, promoting further research and potential solutions. Practical recommendations and future scope discussions provide insights for communities interested in solar energy adoption and foster ongoing innovation. Overall, the integration of approaches, cooling strategy exploration, consideration of generalizability and practical guidance make this paper a valuable contribution to the field of solar energy.
Section 2 describes the experimental part of data collection from monocrystalline and polycrystalline solar modules. Section 3 presents different results regarding the effect of dust on monocrystalline and polycrystalline solar modules, as well as the effect of temperature on monocrystalline and polycrystalline solar modules. Section 4 describes the numerical results using the AHA and provides a comparative analysis between monocrystalline and polycrystalline PV modules. The conclusion is given in the last section.
2. Experimental Data Collection
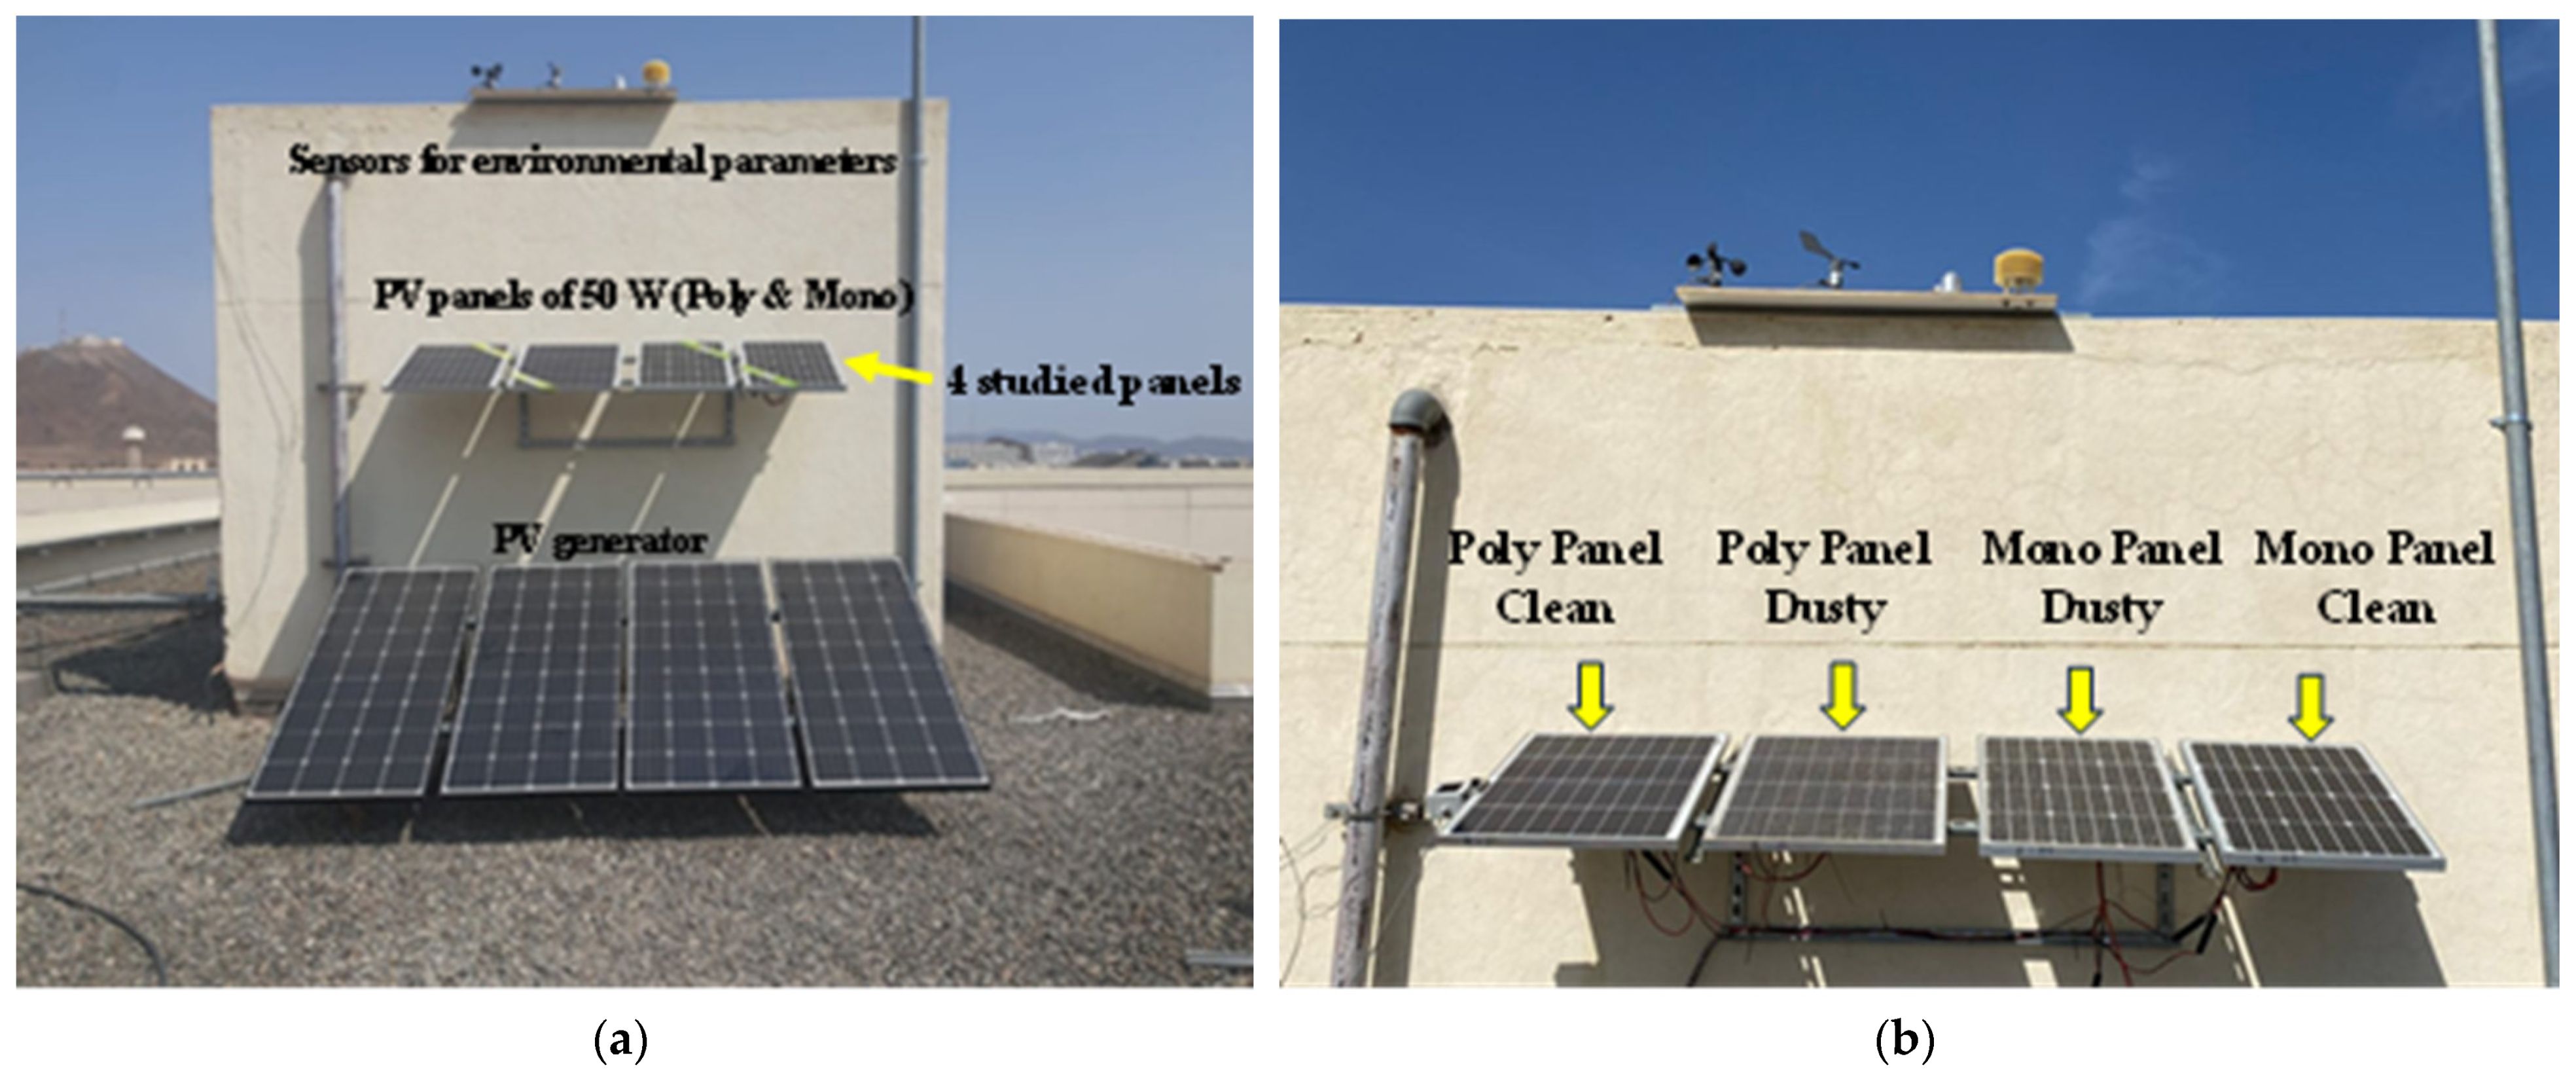
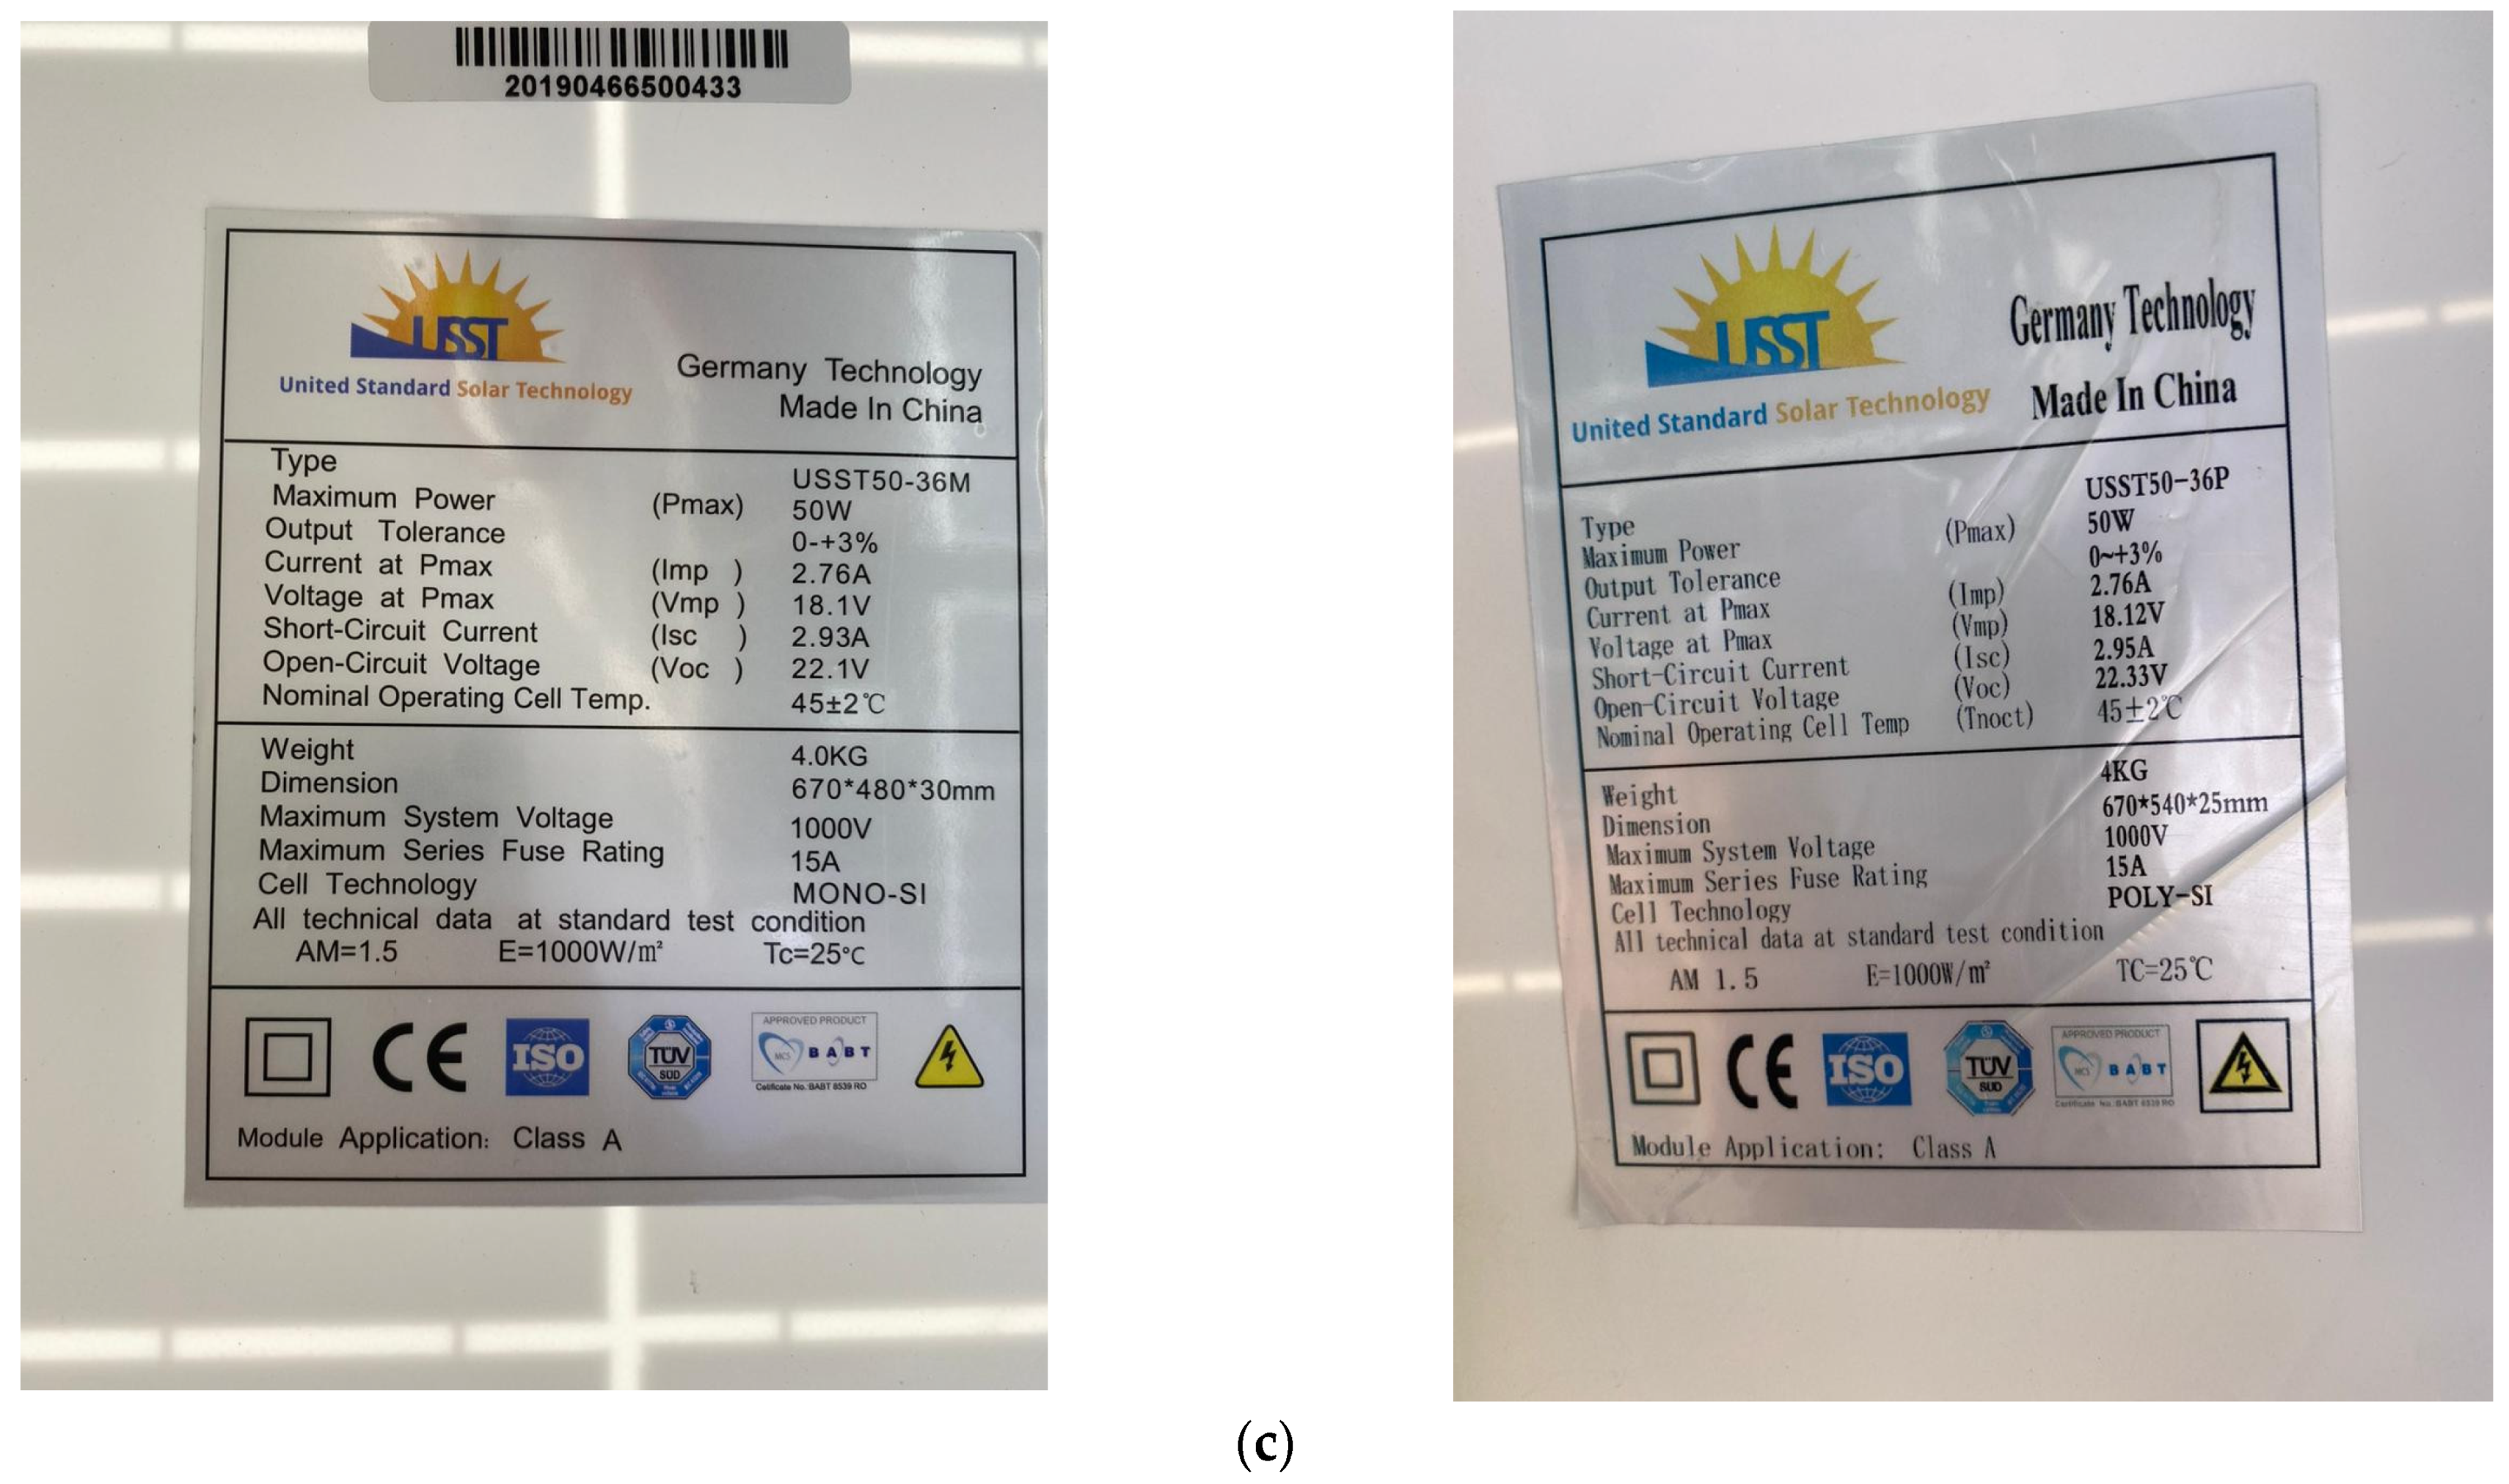
In this study, four PV modules of 50 W each were installed on the roof of the Faculty of Science at the Islamic University of Madinah (KSA) in order to study their characteristics under outdoor conditions, as shown in Figure 1. The collected data from October 2022 to March 2023, under different weather conditions, allow us to draw the I-V characteristics and power curves for different incident solar irradiations and different temperatures. To proceed with these outdoor experiments, a PVPM 2540C instrument (PV-Engineering GmbH, Iserlohn, Germany) was used to collect data on various parameters of each solar module installed, as shown in Figure 2.

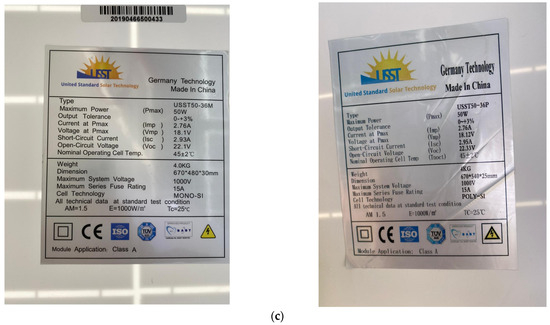
Figure 1.
Outdoor experiments: (a) Different sensors for environmental parameters with four solar modules of different technologies. (b) Two polycrystalline PV modules of 50 W (clean and dust) and two monocrystalline PV modules of 50 W (clean and dust). (c) Specifications of monocrystalline and polycrystalline solar panels.
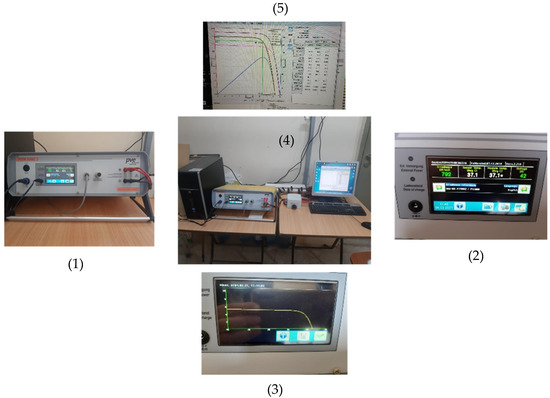
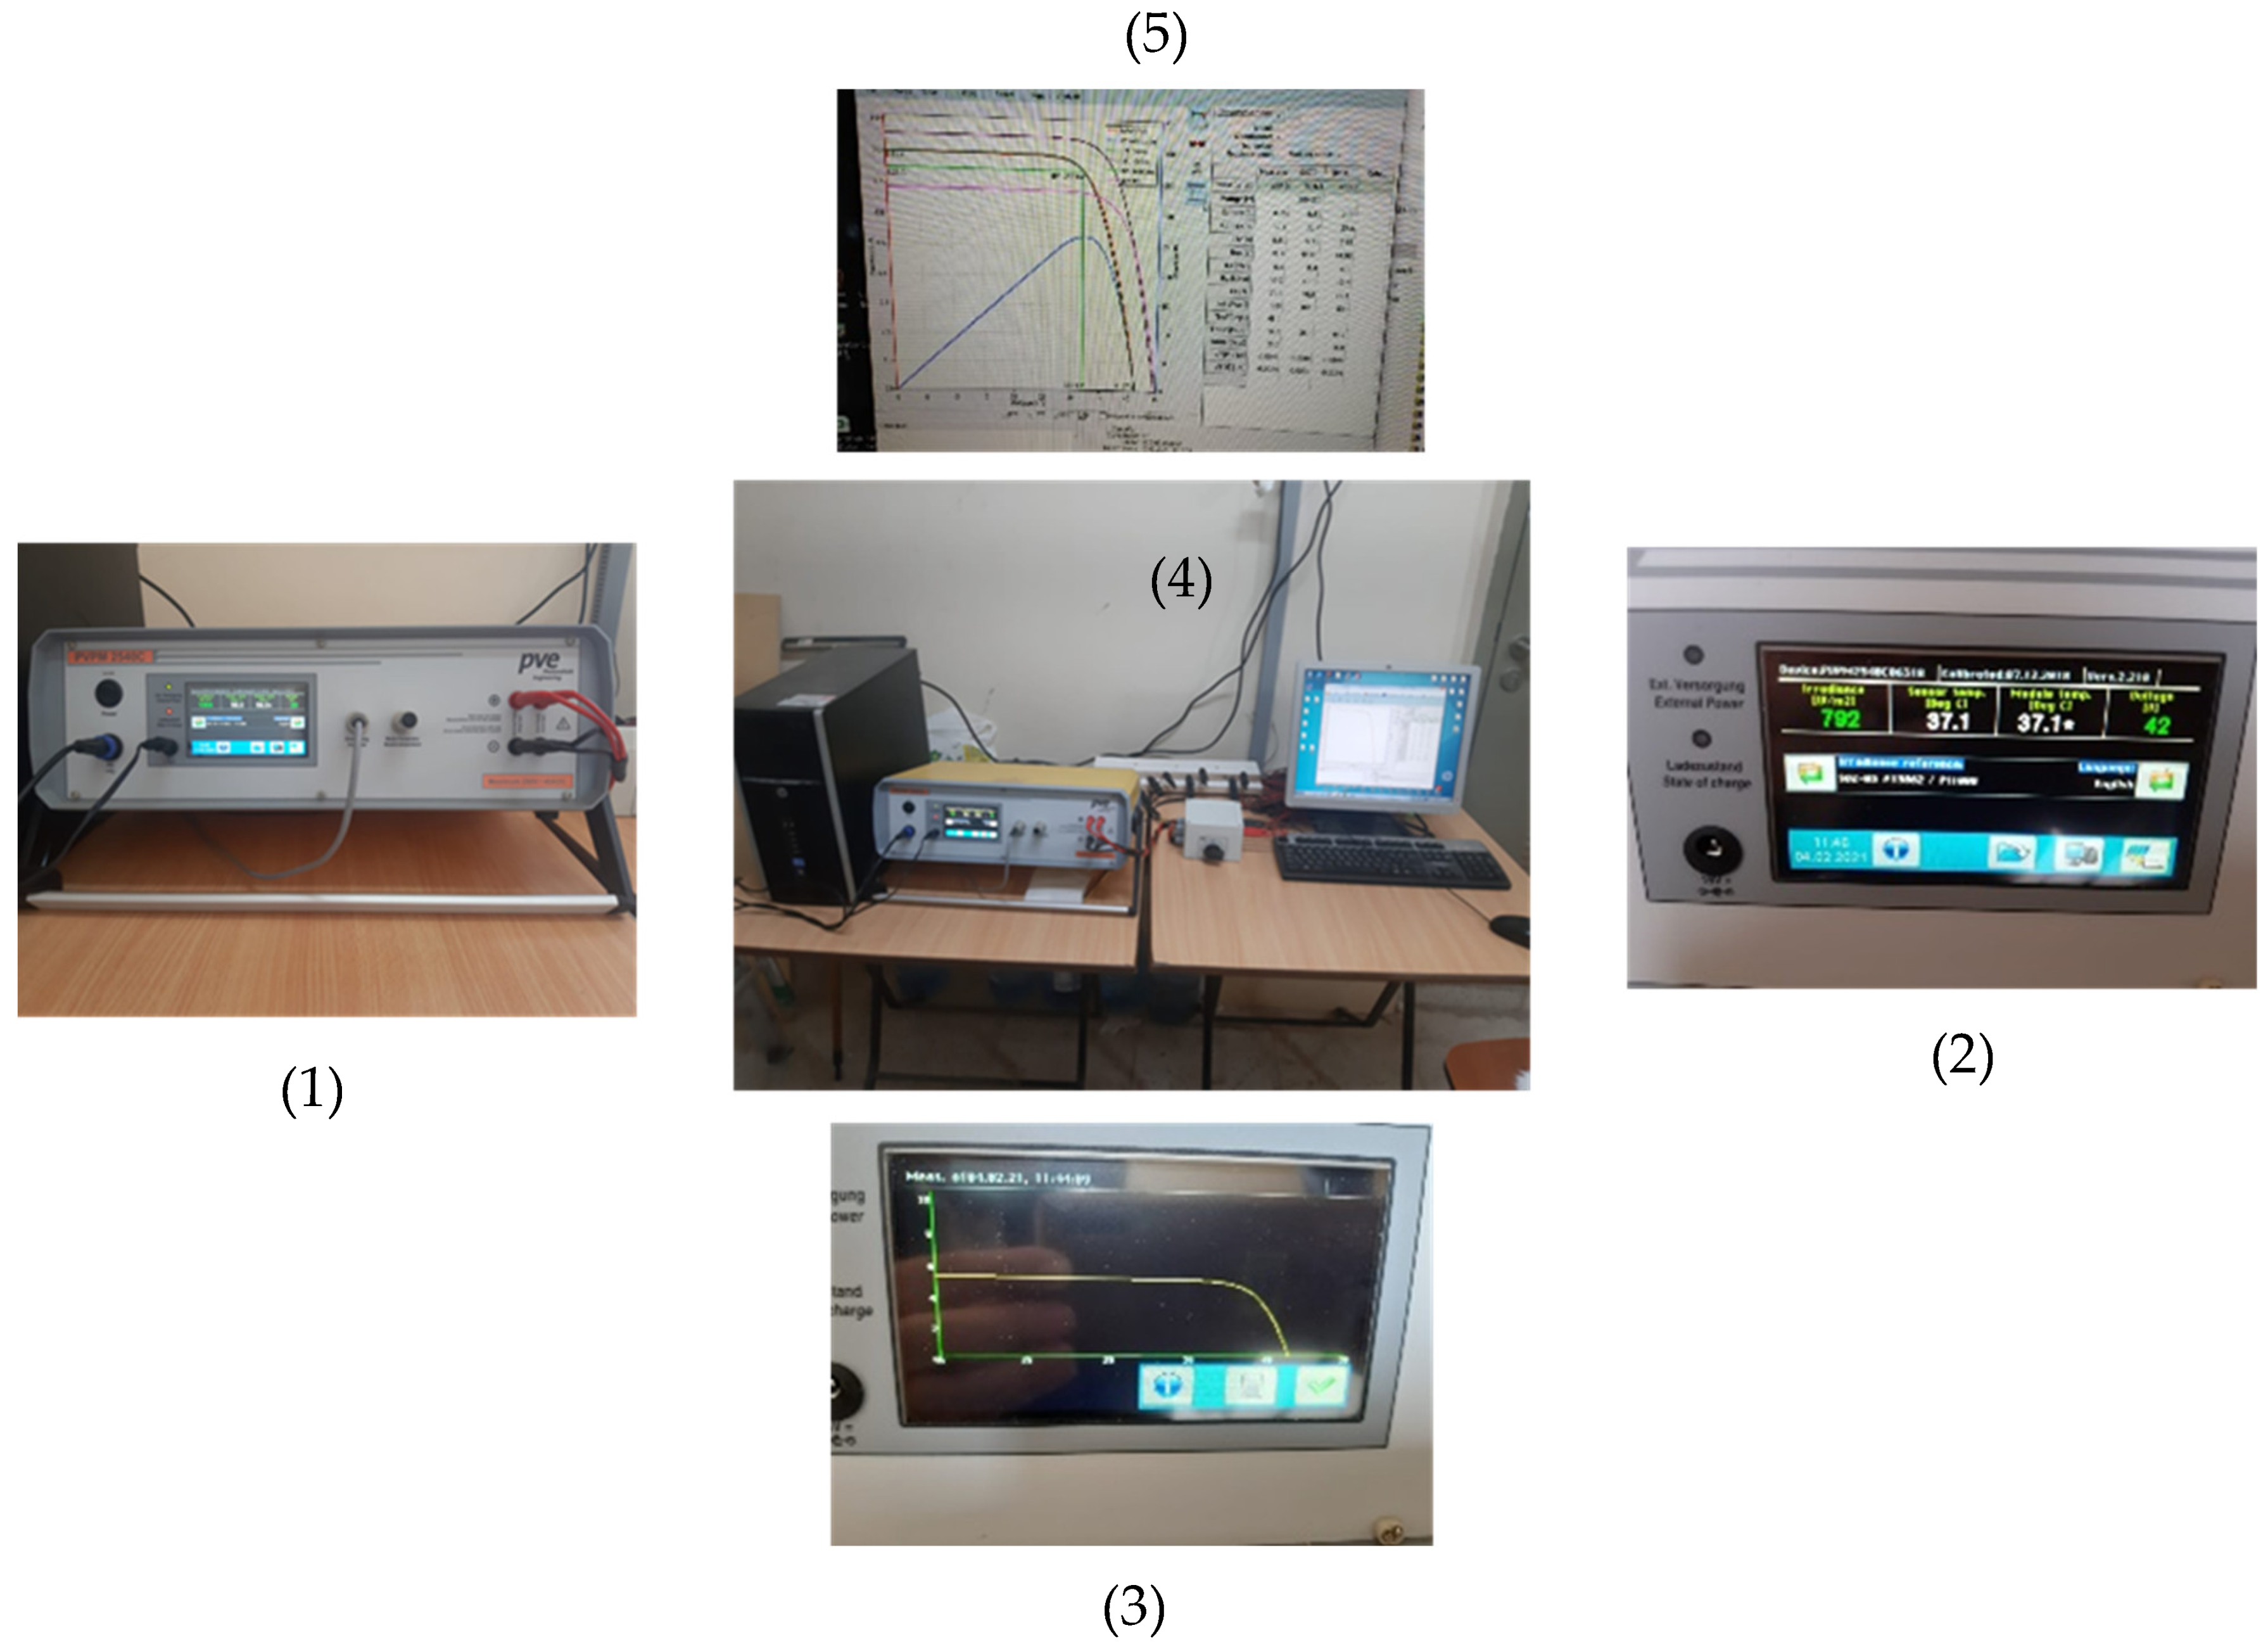
Figure 2.
PVPM 2540 C used with transfer of data to the computer: (1) Instrument PVPM2540C. (2) LCD display of data in PVPM2540C. (3) Display of the I-V curve in PVPM2540C. (4) Experiment setup with the PVPM2540C connected to the PC. (5) Obtained results displayed on the computer screen.
The instrument used is of type PVPM, which allows the measurement of the I-V characteristic and power curves of photovoltaic (PV) modules. The PVPM 2540C device can directly measure and calculate parameters such as peak power (Pmax), series resistance (Rs) and shunt resistance (Rsh) at the installation site of the PV system. The calculation results and diagram can be displayed on the internal LCD display and can be transferred directly to the computer, as shown in Figure 2.
All measurements were performed using the PVPM 2540C instrument with the following specifications:
- -
- Measuring accuracy for the I-V characteristic is less than 1%, and for the peak power measurements, the accuracy is ±5%.
- -
- It utilizes an irradiation reference sensor (Phox) with an integrated Pt100/Pt1000 temperature sensor.
- -
- The measuring ranges supported by the PVPM 2540C are as follows:
- Voltage DC: 25/50/100/250 V;
- Current DC: 2/5/10/40 A;
- Temperature: −40 °C to +120 °C with Pt1000;
- Irradiance: 0–1300 W/m2 (Standard sensor).
3. Experimental Results
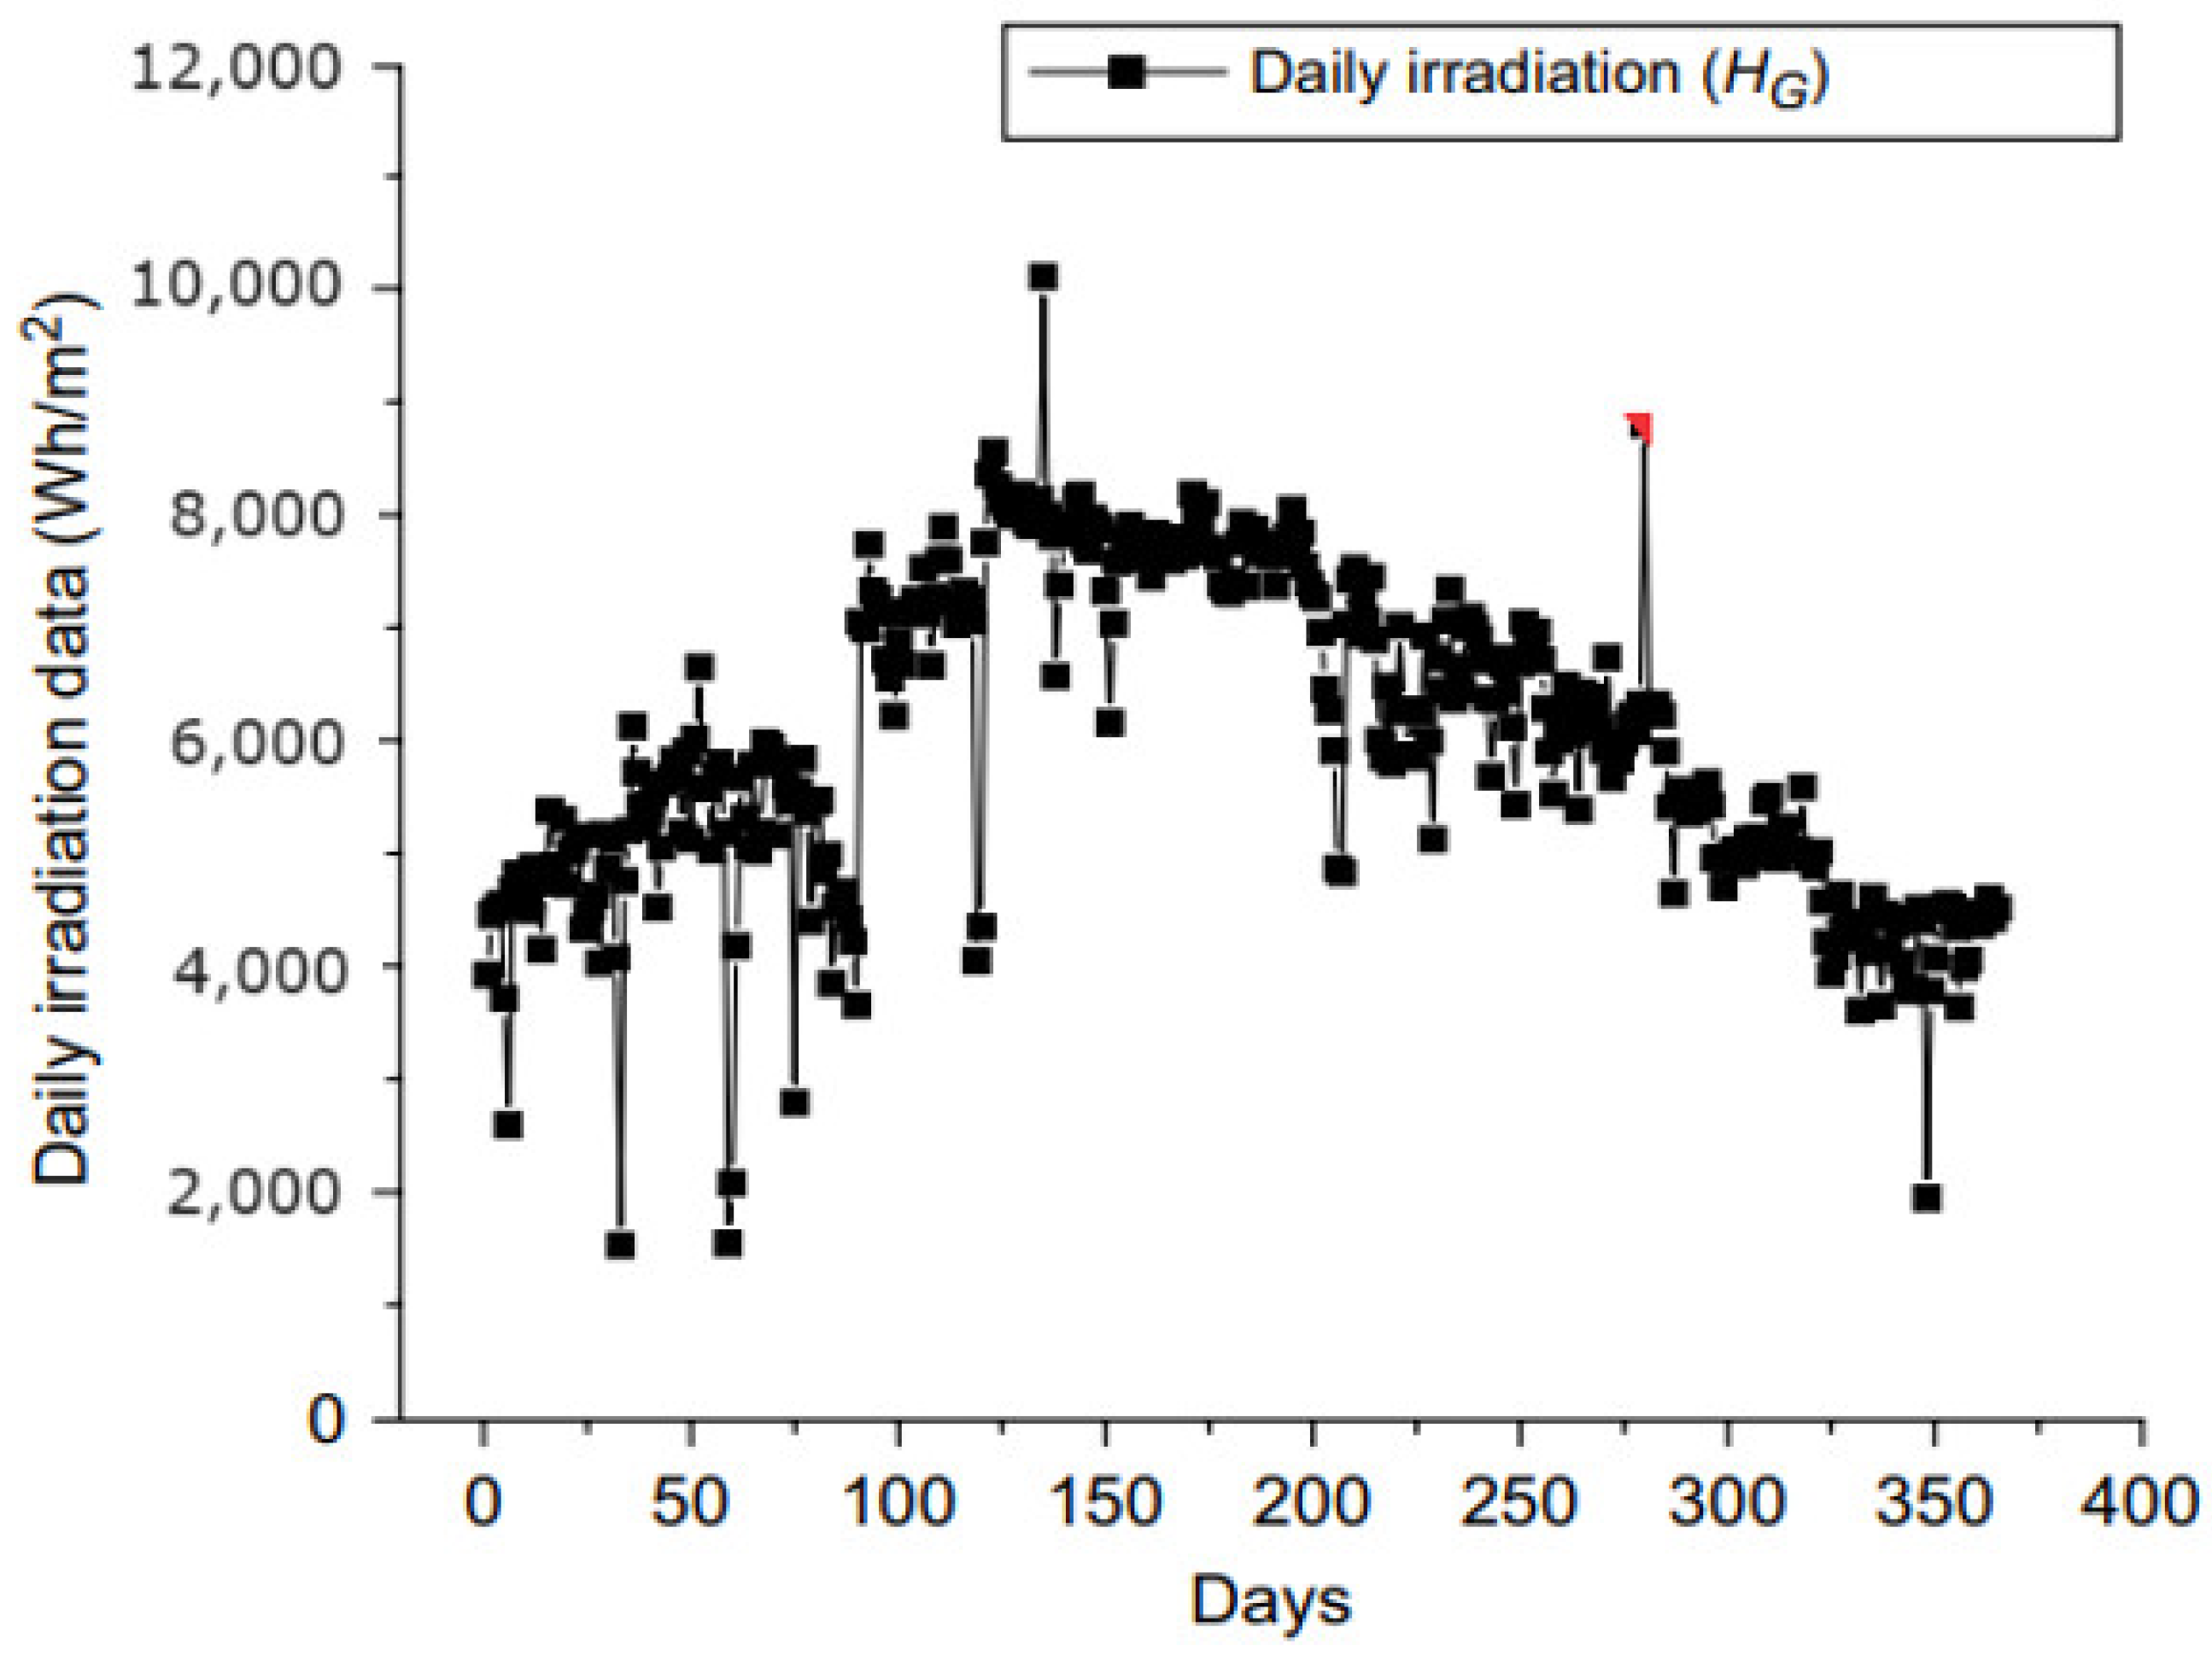
Daily solar irradiation (HG) and ambient temperature (T) were measured during the period of the experiment. Figure 3 and Figure 4 illustrate the evolution of the global daily solar irradiation and ambient temperature collected on 24 March 2023 in the Madinah site.
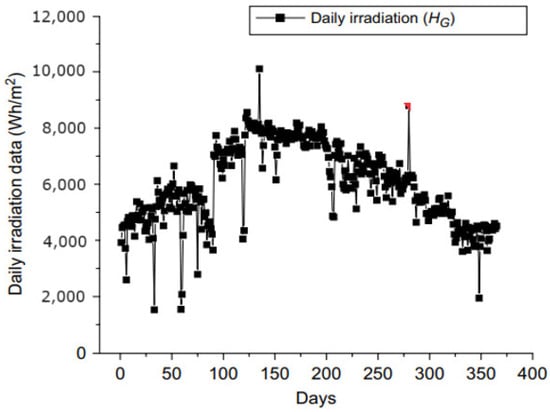
Figure 3.
Evolution of global daily solar irradiation (HG) collected on 24 March 2023.
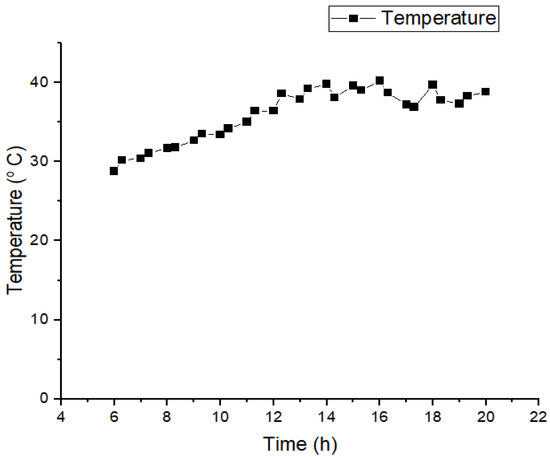
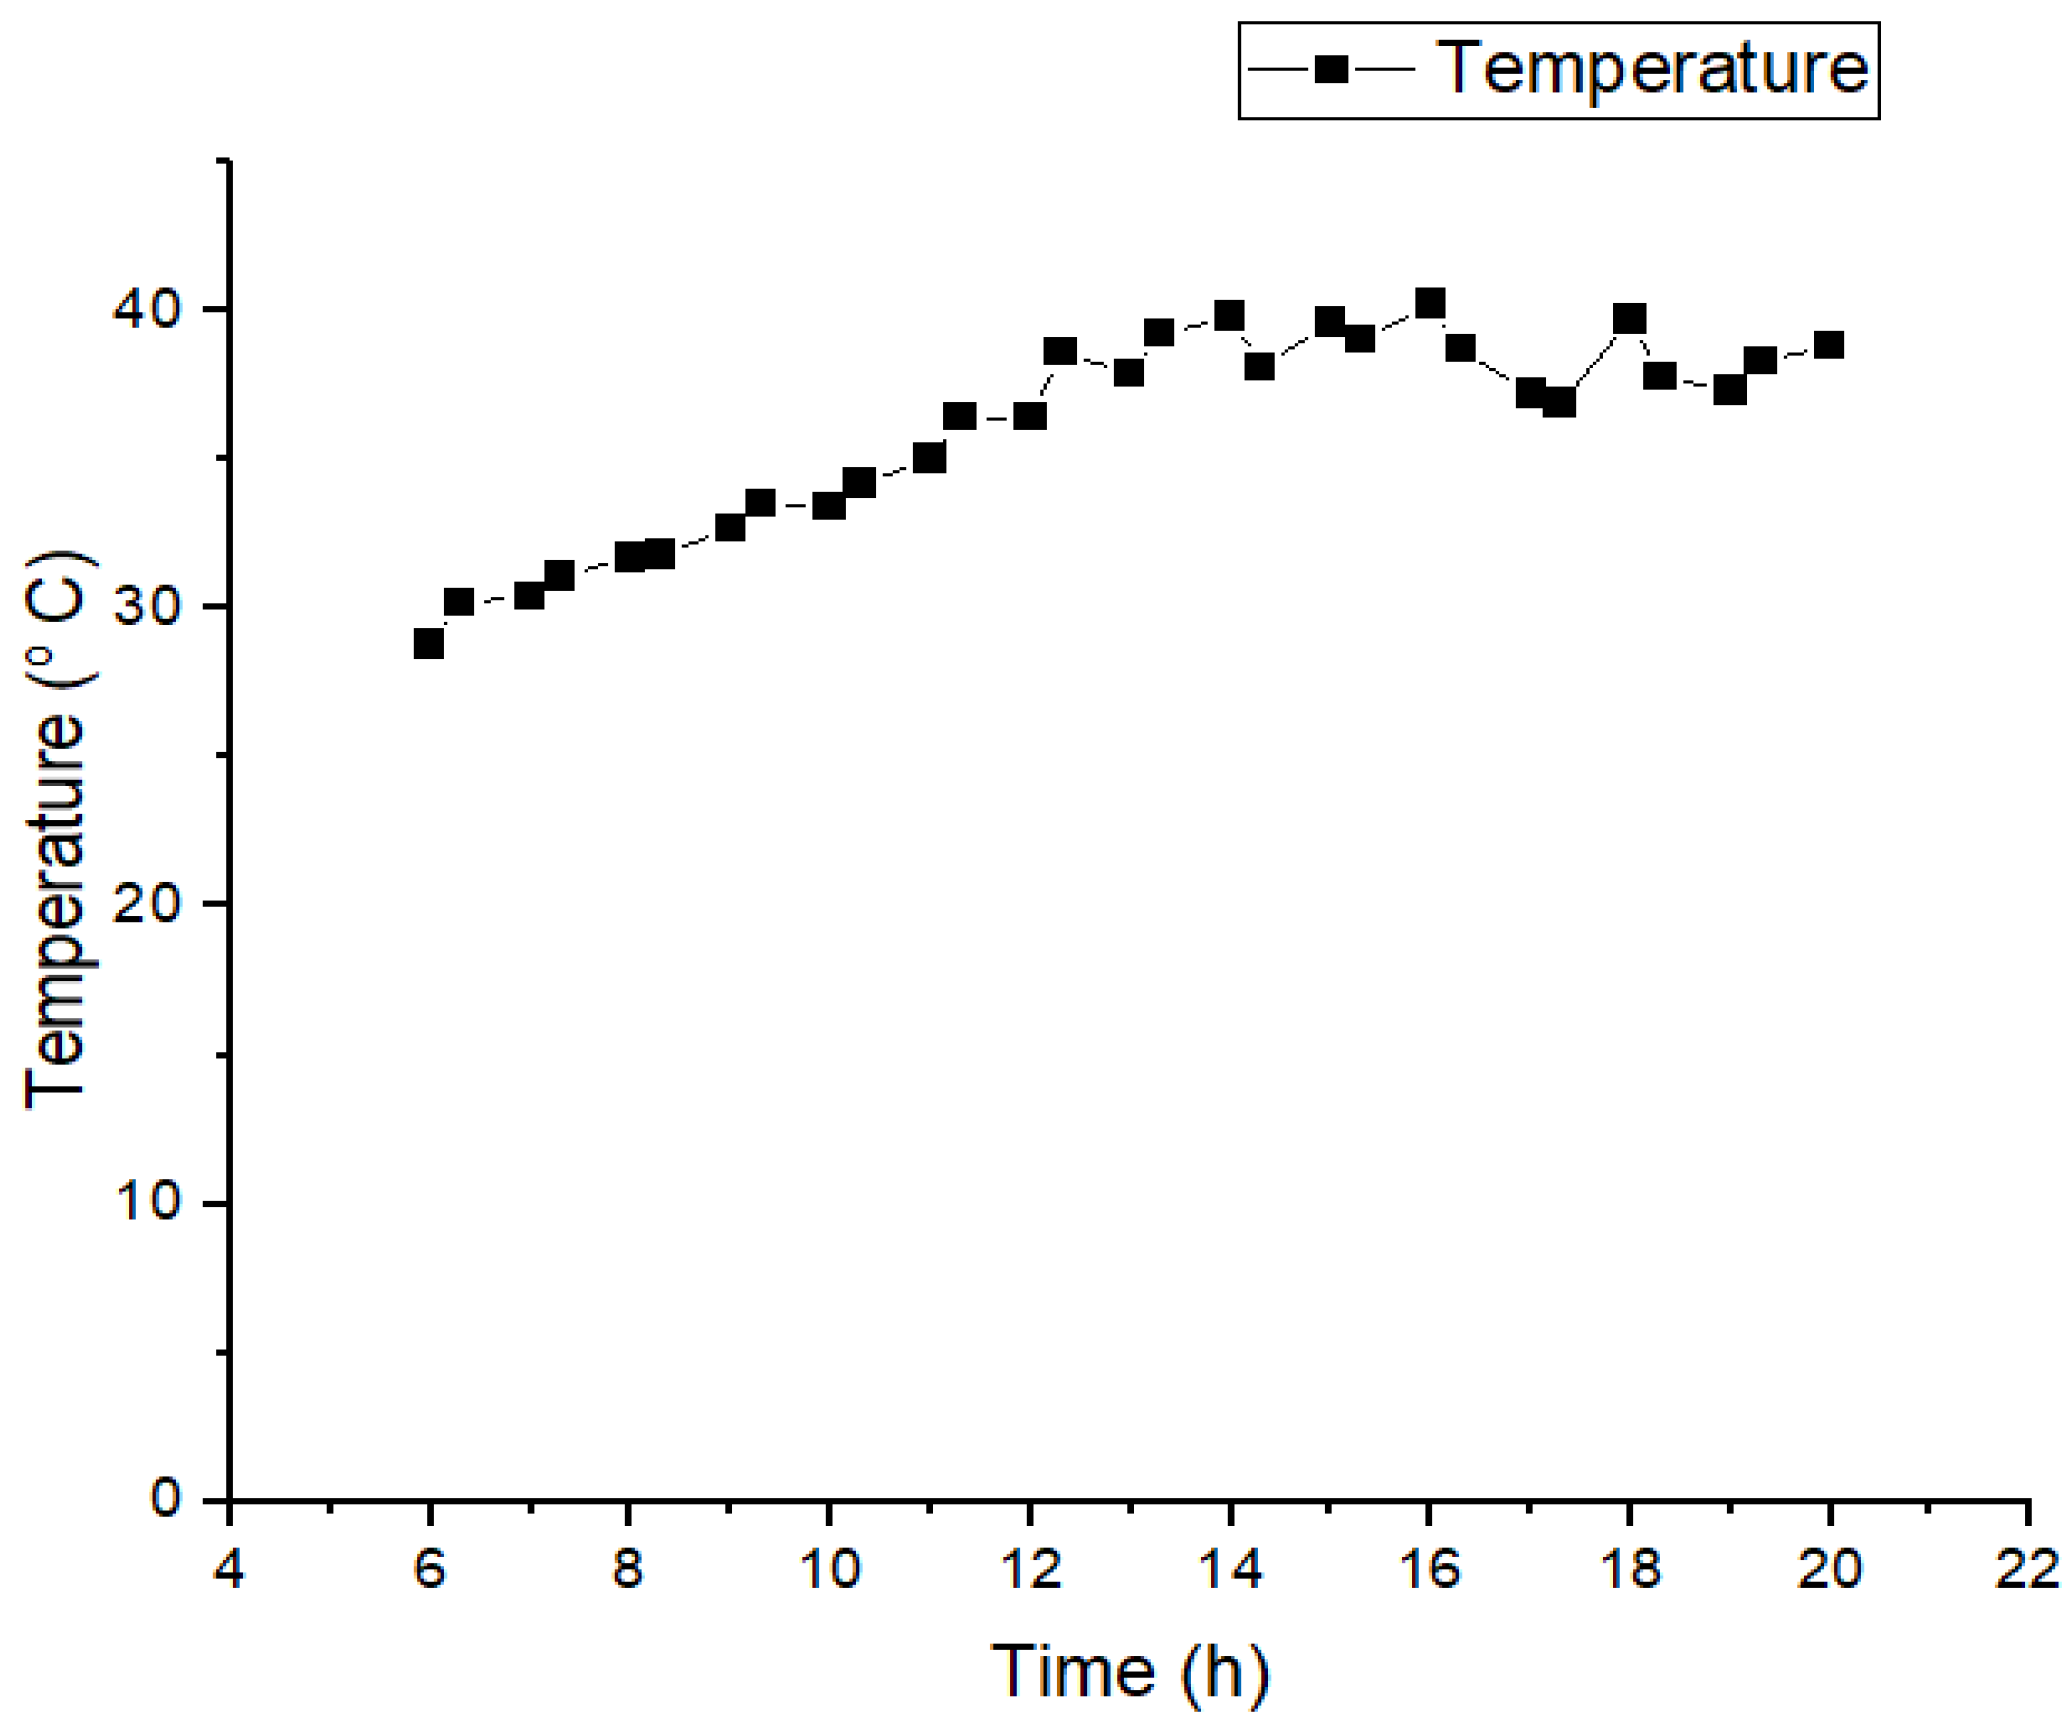
Figure 4.
Evolution of air temperature data collected on 24 March 2023.
3.1. Characterization of Polycrystalline and Monocrystalline Solar Modules Operate under Different Solar Irradiation
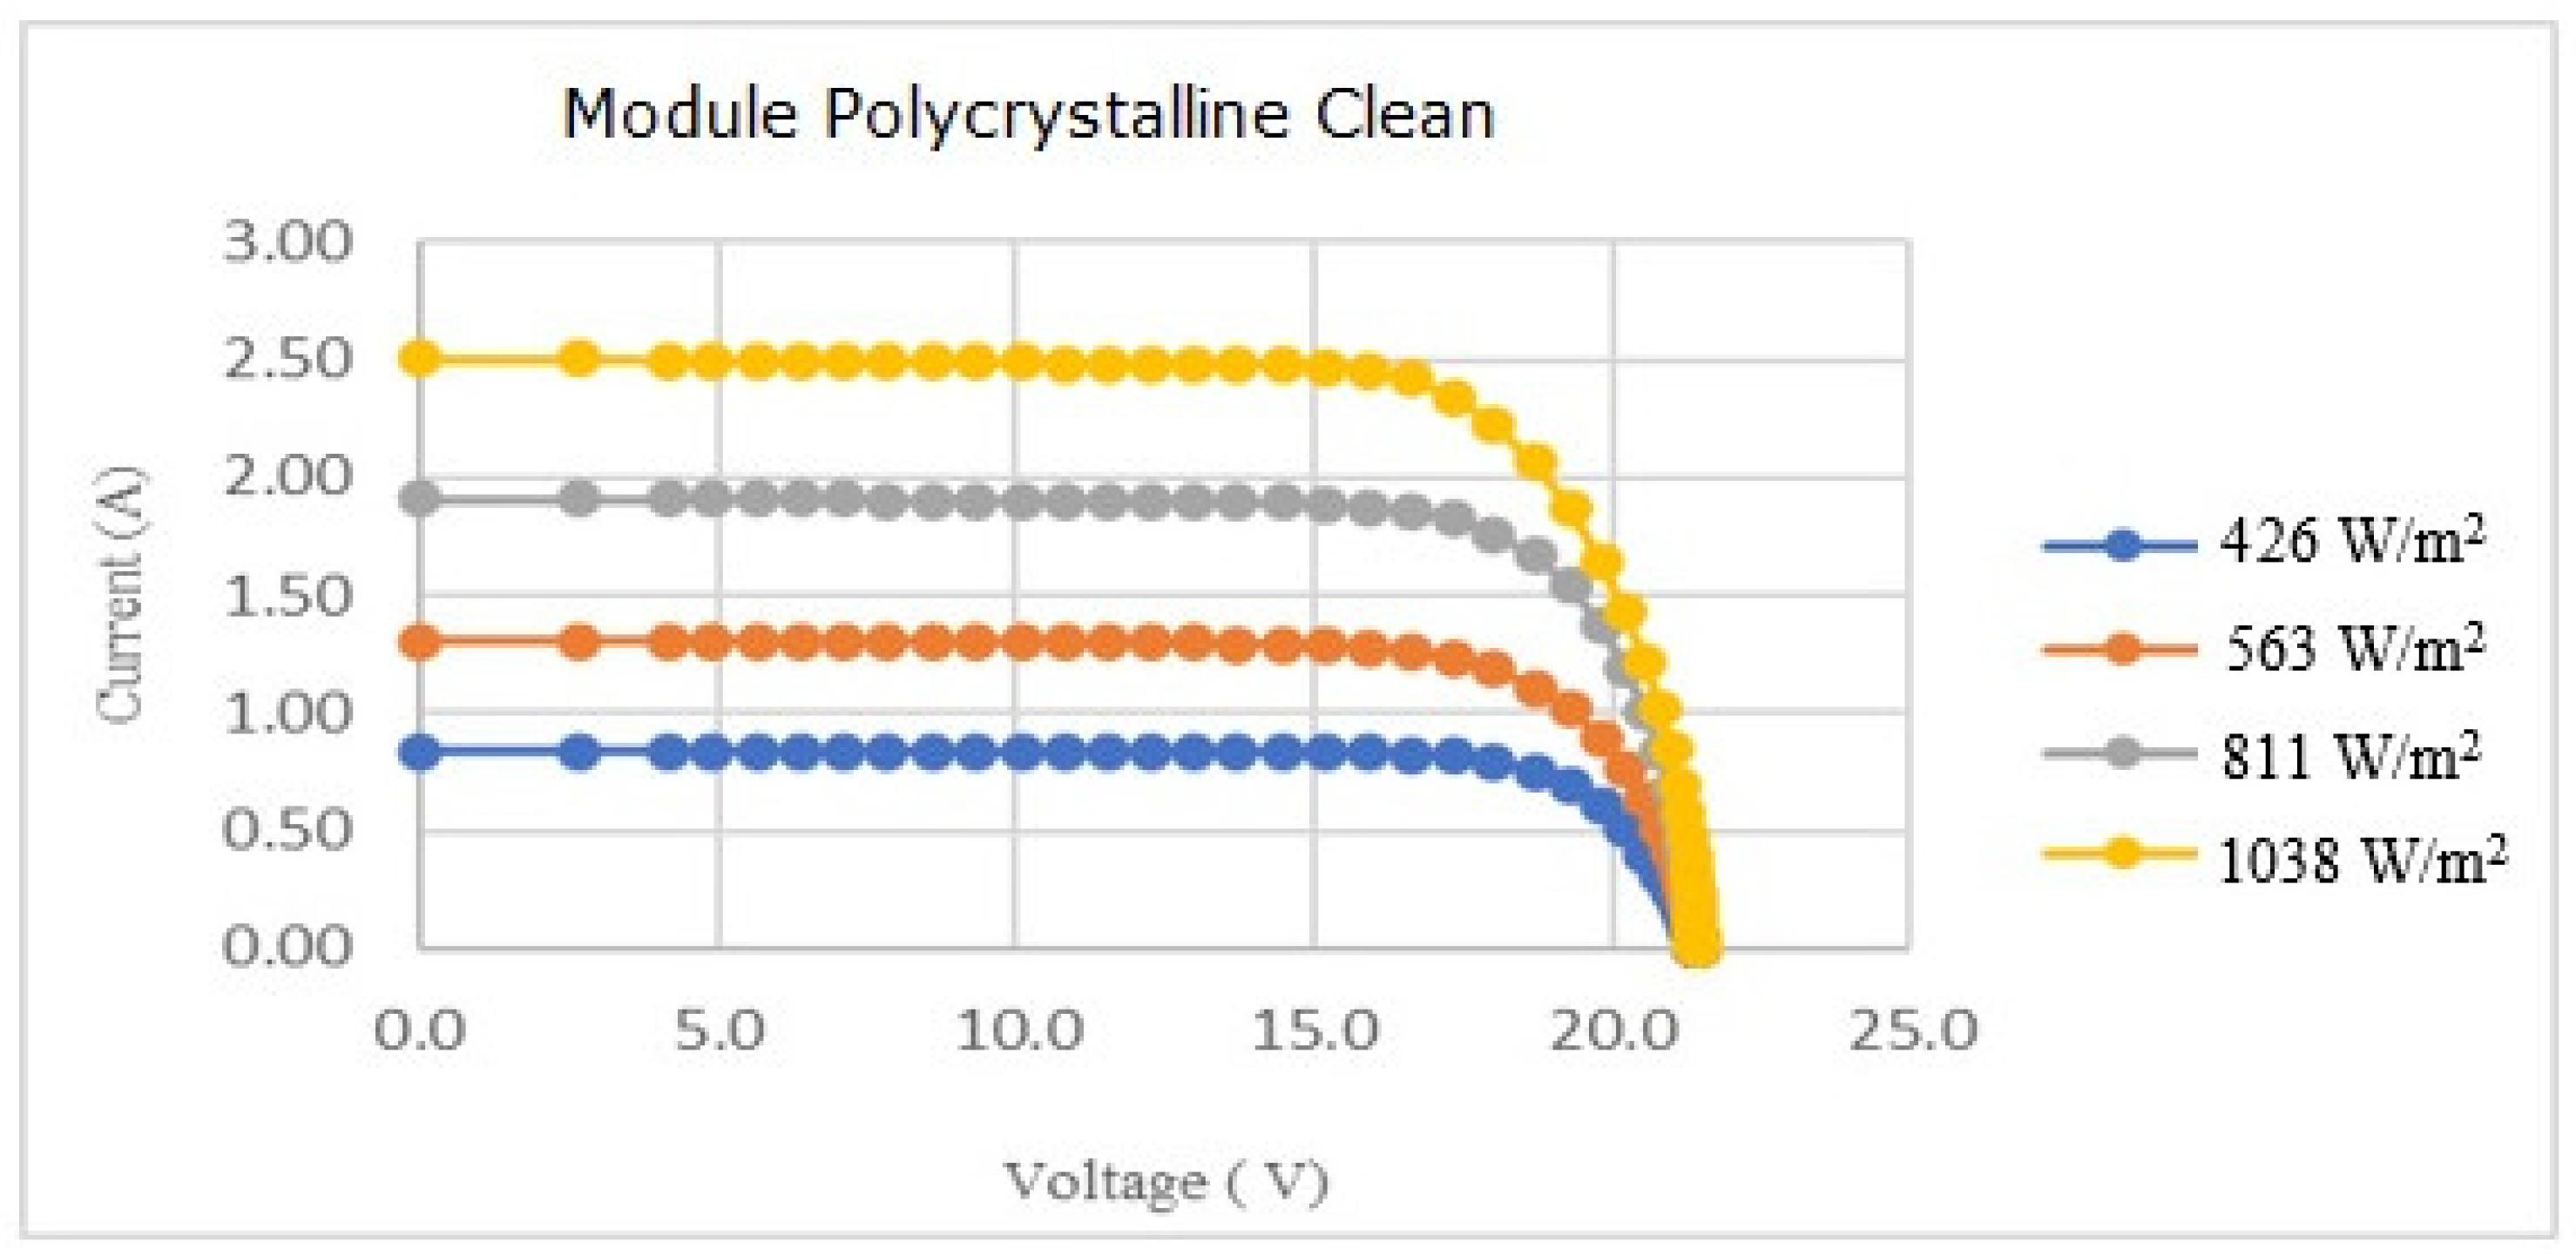
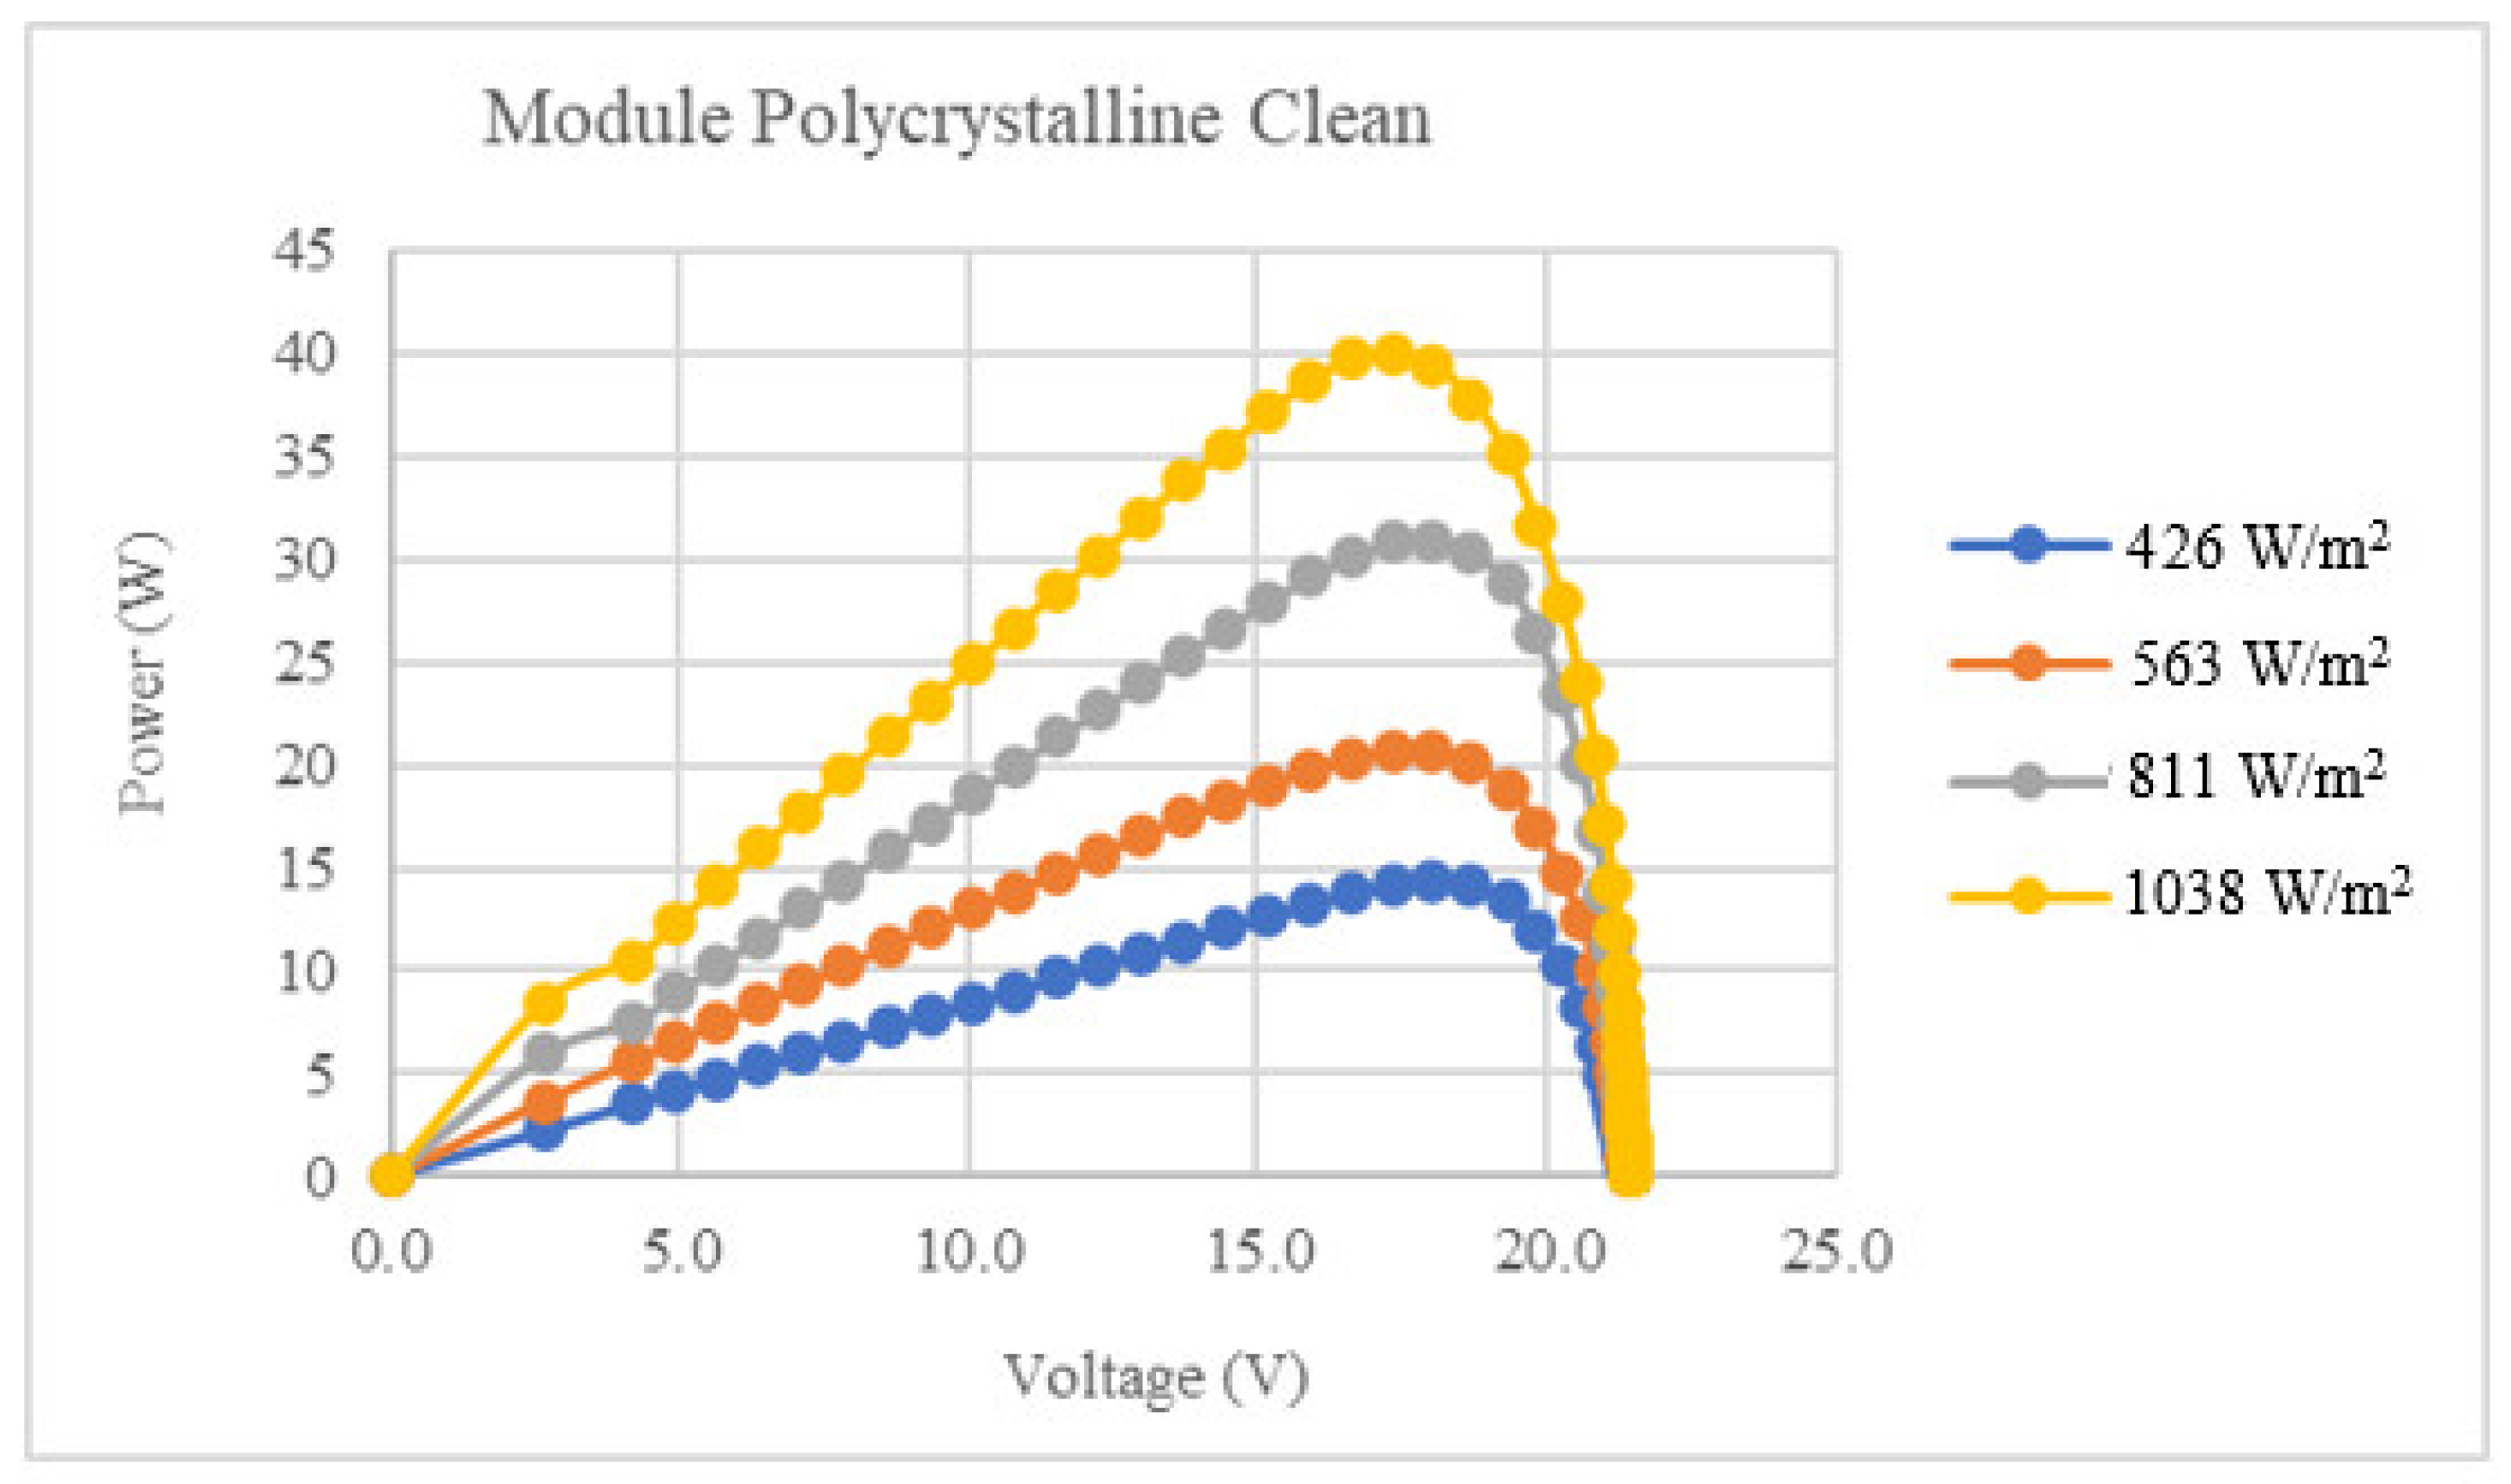
Figure 5 and Figure 6 show the current–voltage characteristics and power curves of polycrystalline (Poly) modules for different incident solar irradiation, respectively. It is noted that the short-circuit current (ISC) increases with the increase in incident solar irradiation.
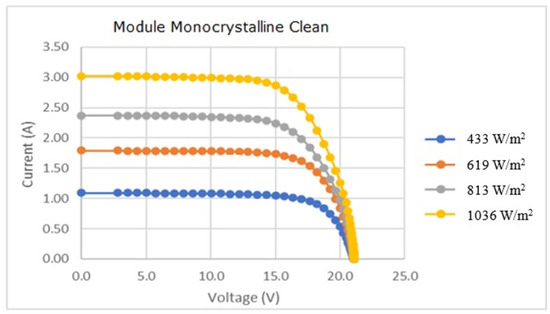
Figure 5.
I-V Characteristic of monocrystalline module of 50 W for different solar irradiations.
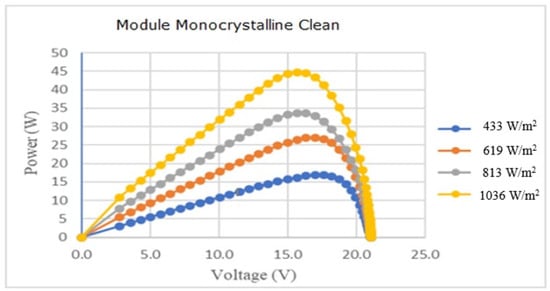
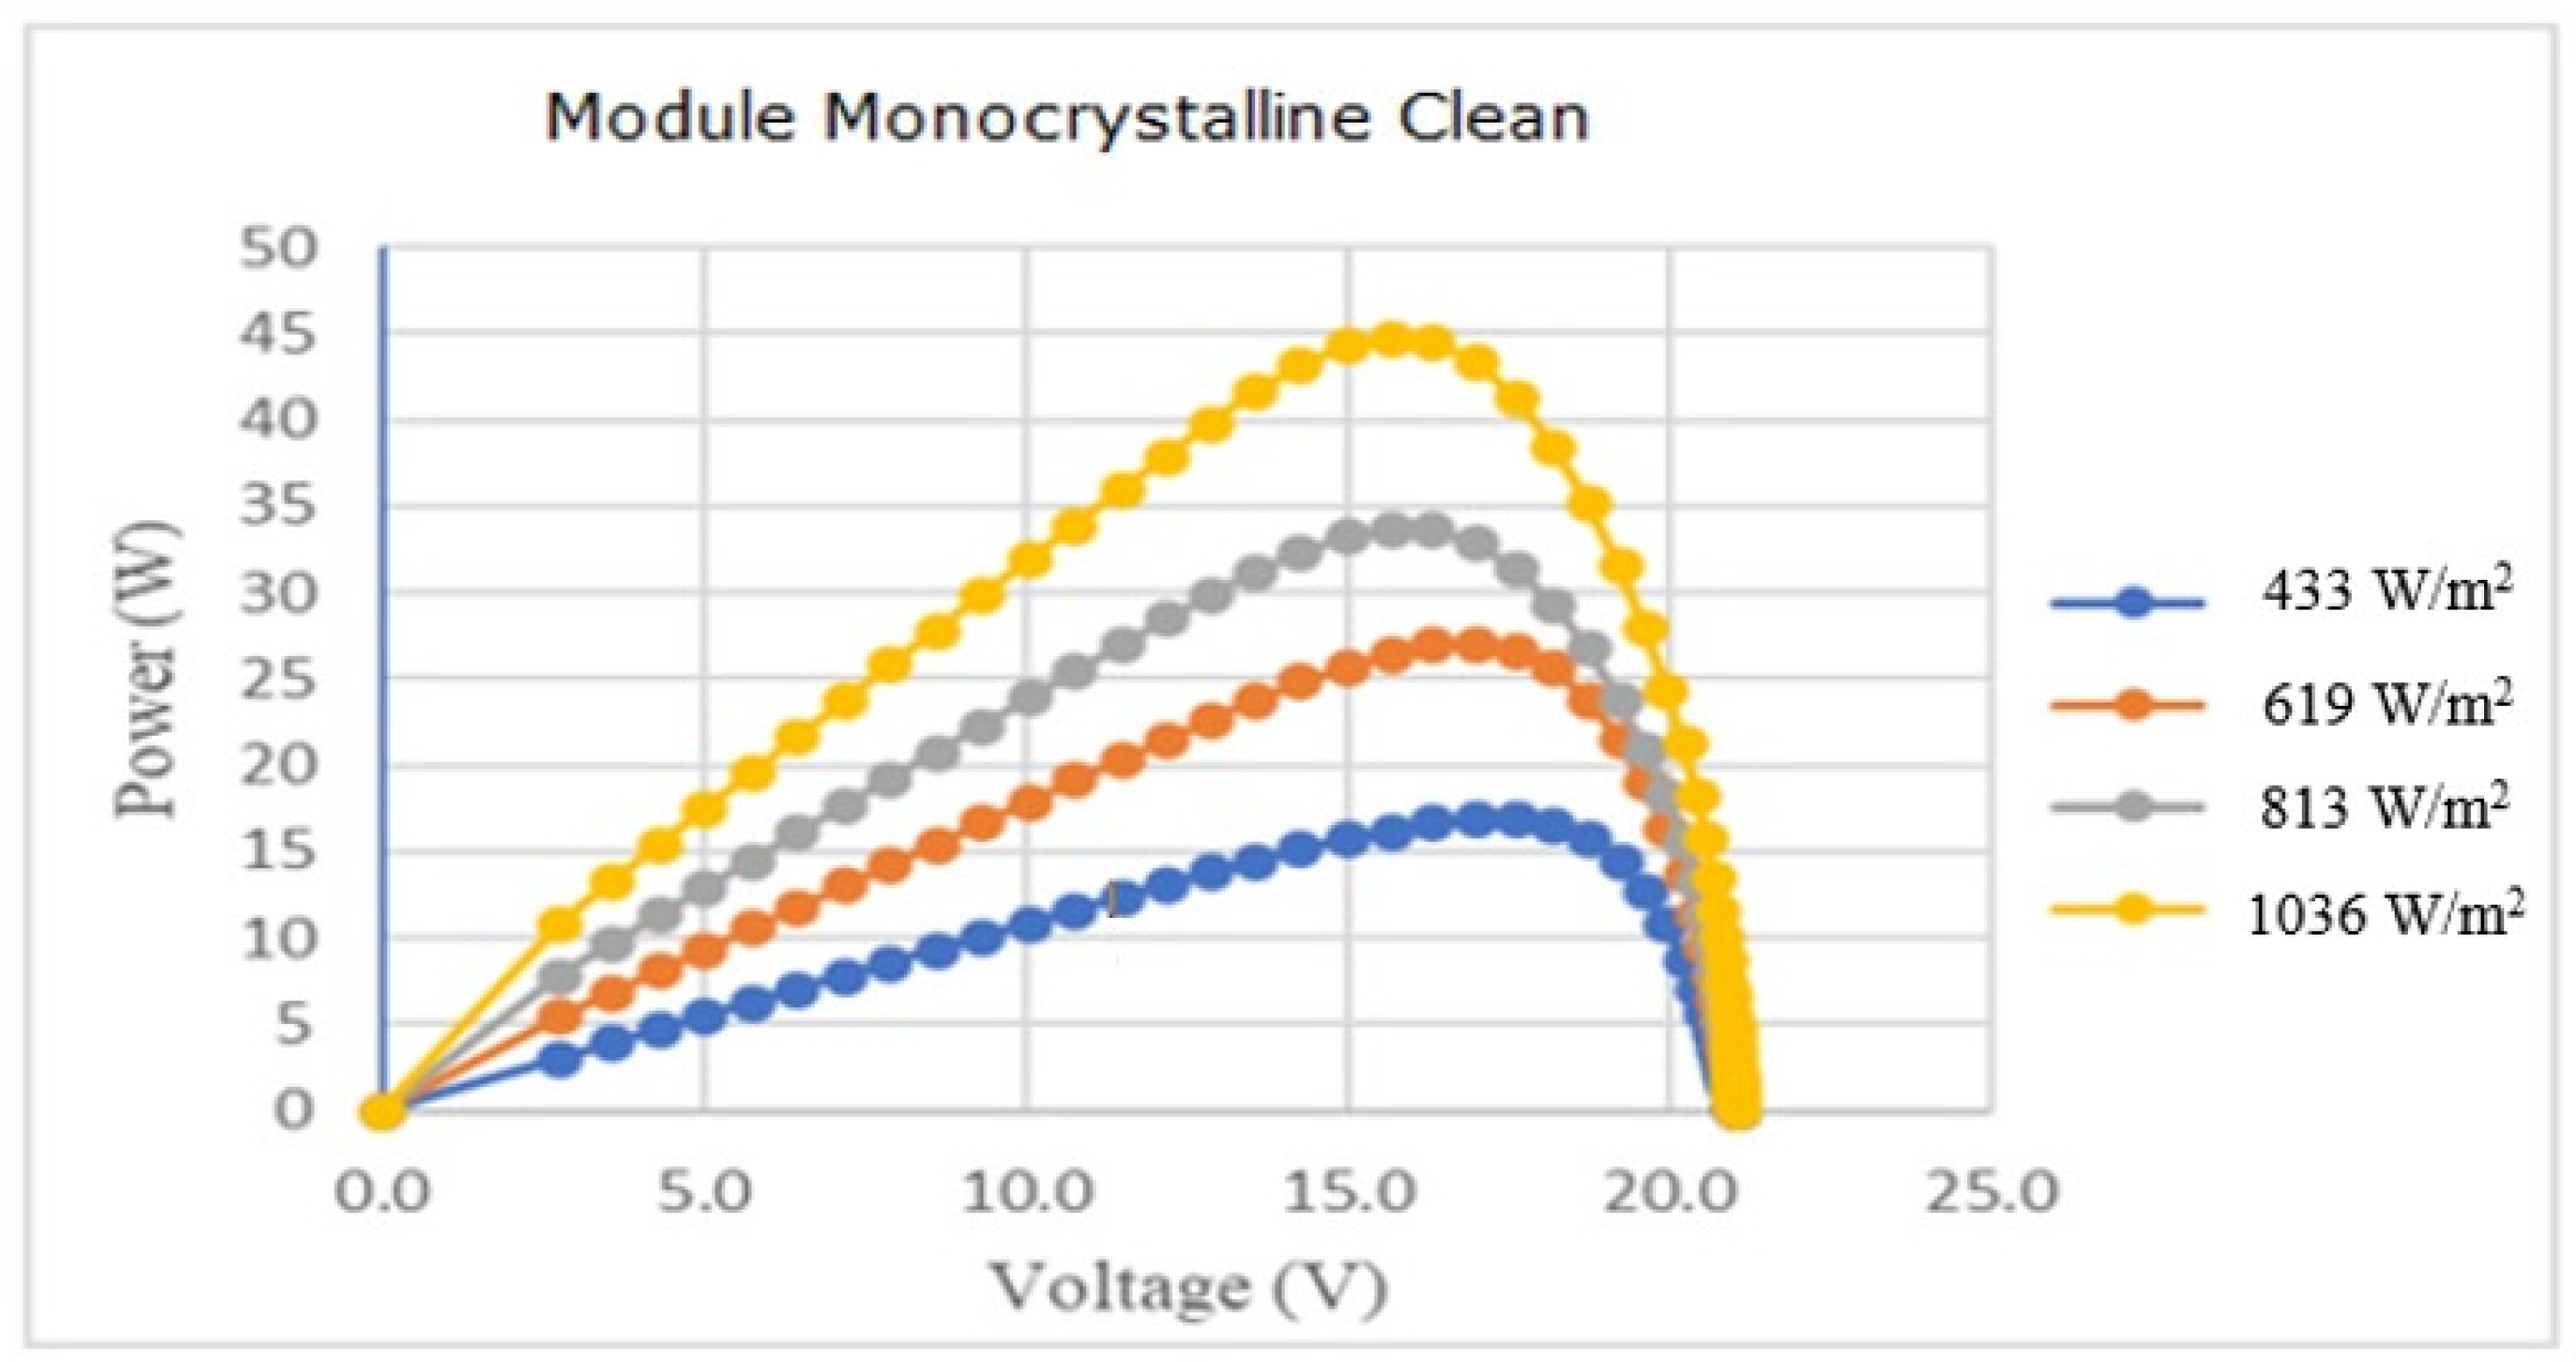
Figure 6.
Power curve of monocrystalline module of 50 W for different solar irradiations.
In addition, the maximum output power of the polycrystalline solar module is obtained with the maximum incident solar radiation of 1038 W/m2. Similarly, Figure 7 and Figure 8 illustrate the I-V and P-V curves of polycrystalline PV modules for different incident solar irradiations, respectively. It was shown that the short circuit current ISC increases when incident solar irradiation increases. Furthermore, the maximum output power of the monocrystalline module is obtained with the maximum incident solar radiation of 1036 W/m2.
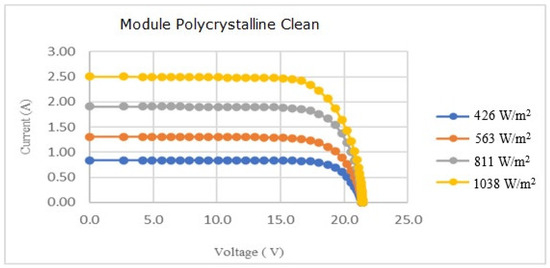
Figure 7.
I-V characteristic of polycrystalline module of 50 W for different solar irradiations.
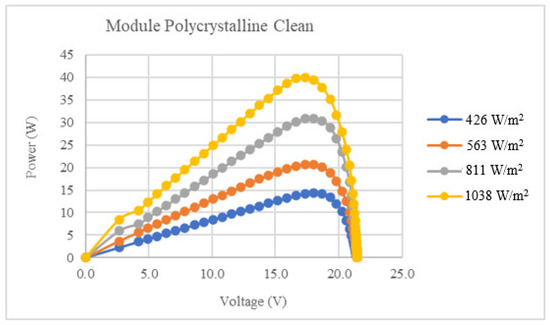
Figure 8.
Power curves of polycrystalline module of 50 W for different solar irradiations.
3.2. Comparison between Poly-Si and Mono-Si for Different Solar Irradiation
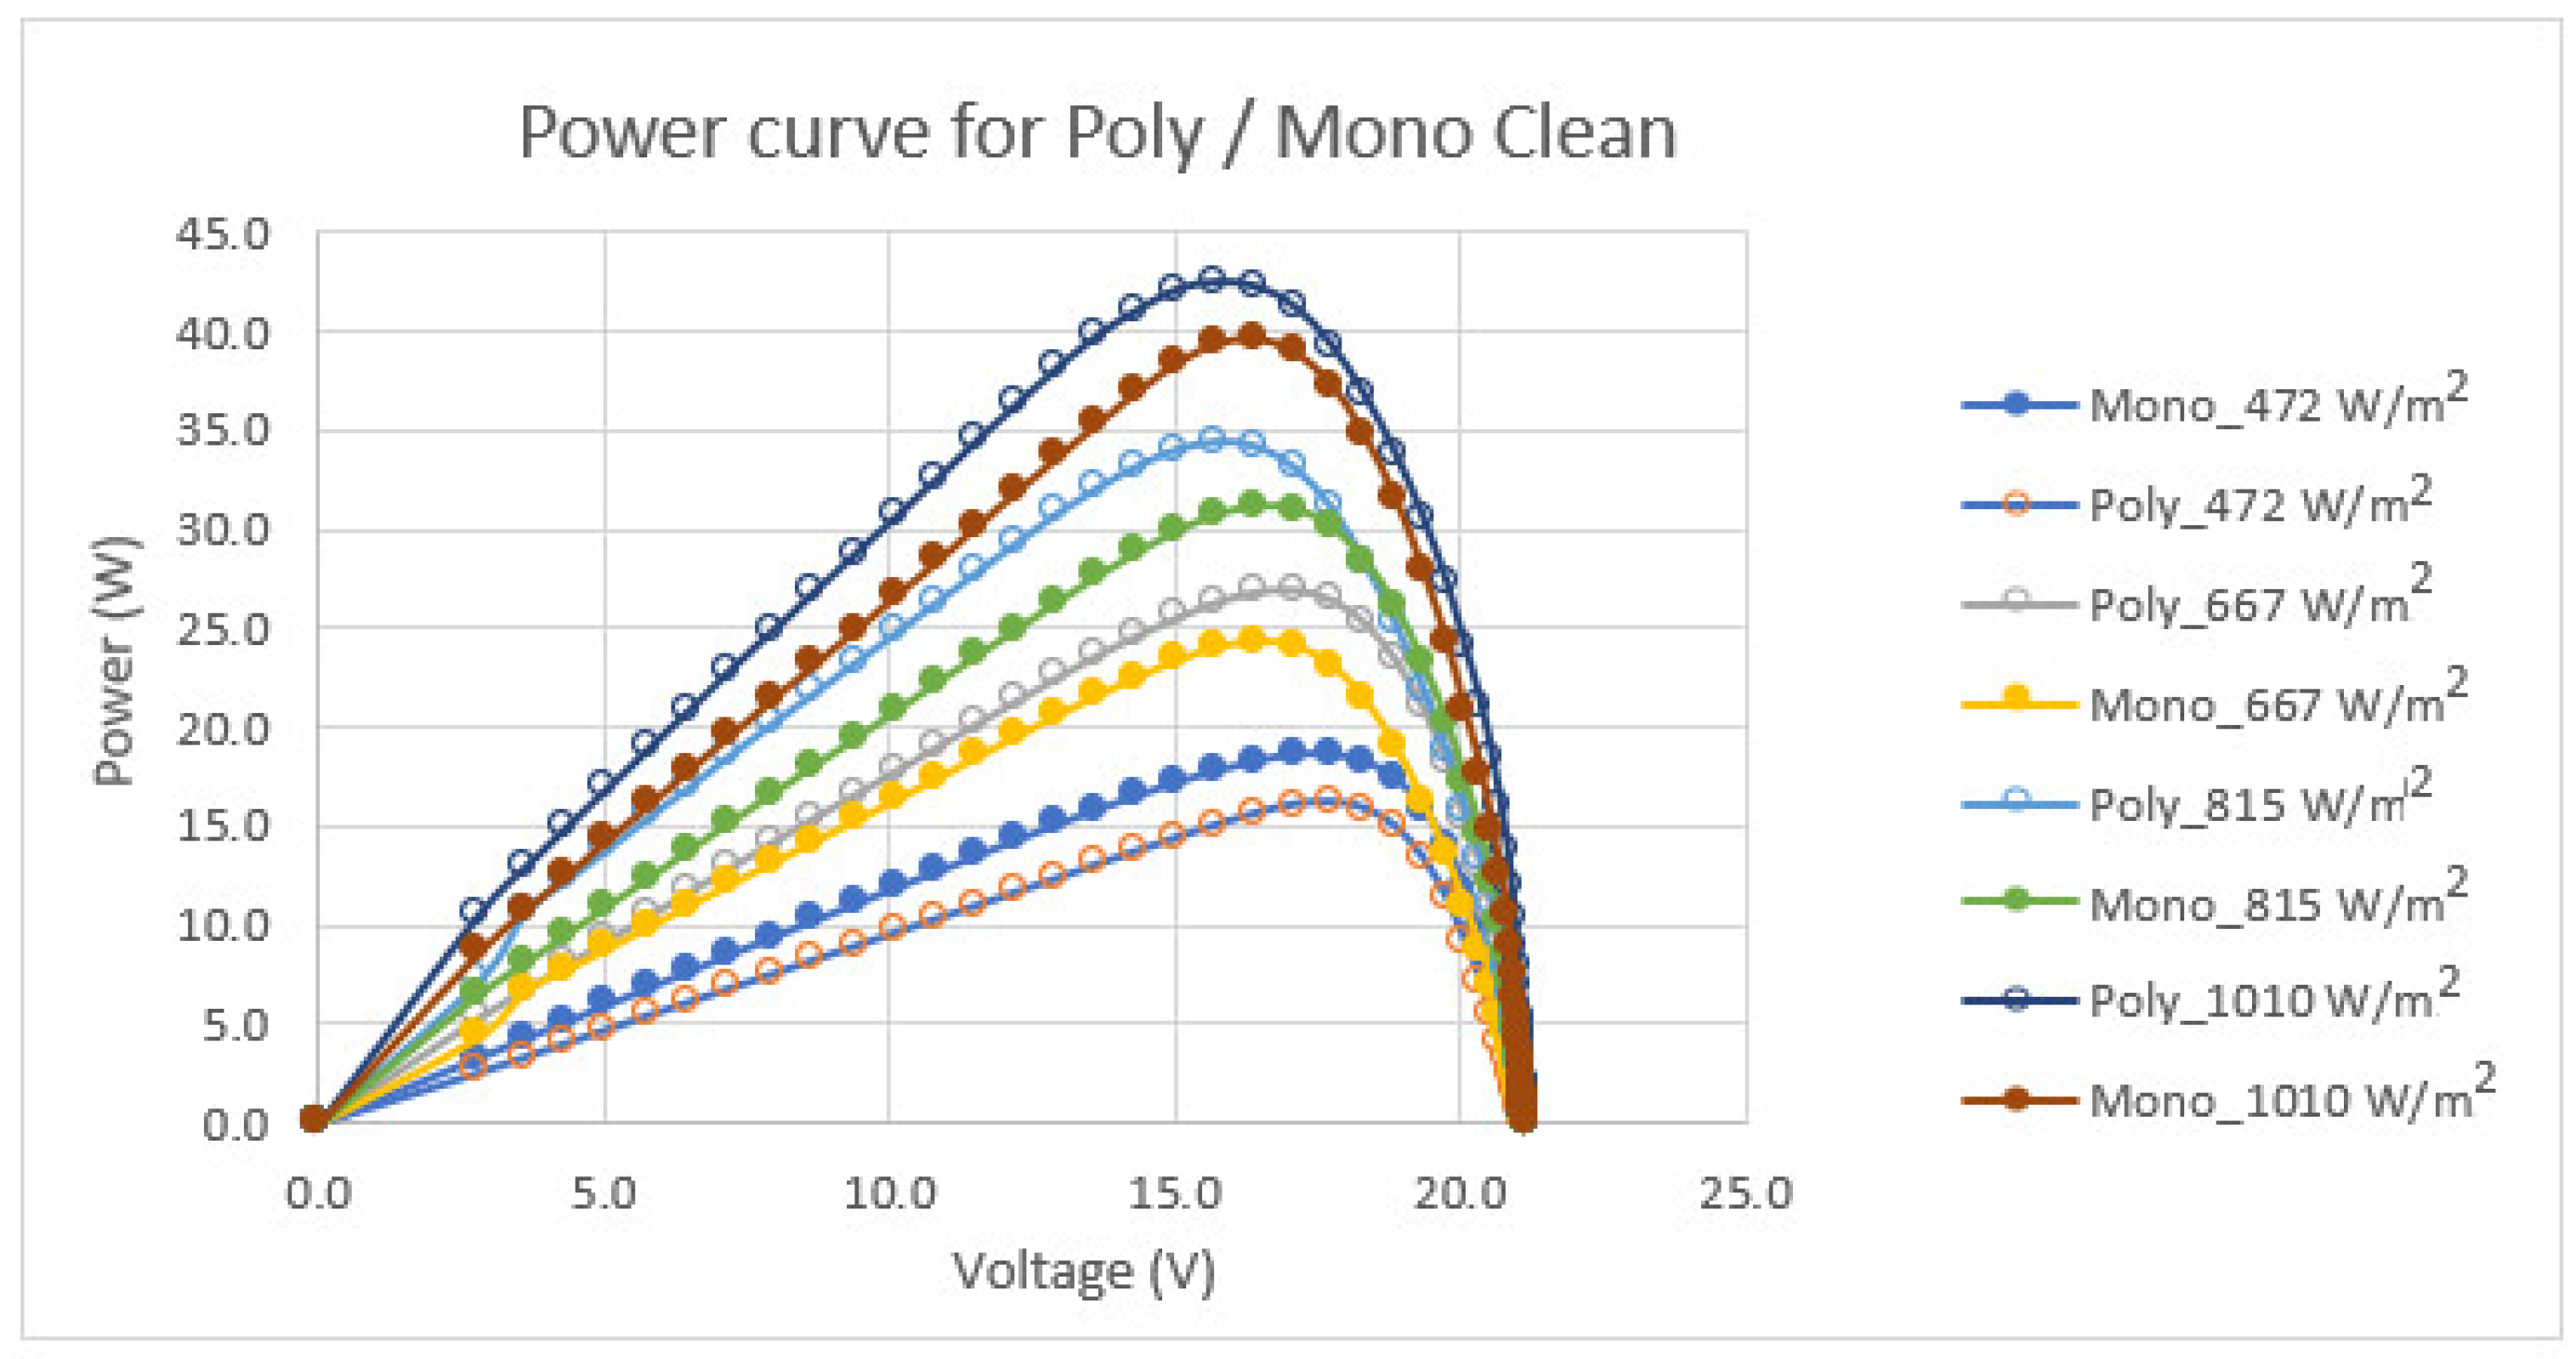
It is shown in Figure 9 and Figure 10 that the monocrystalline solar module (m-Si) provides higher output current (A) and power (W) compared to polycrystalline (p-Si) for low solar irradiation, which is 472 W/m2. However, for solar irradiation greater than 500 W/m2 (667 W/m2, 815 W/m2 and 1010 W/m2), the polycrystalline solar module (p-Si) provides higher output current (A) and power (W) compared to monocrystalline (m-Si).
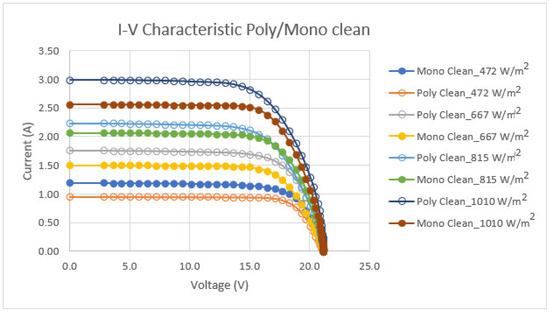
Figure 9.
I-V Characteristic of monocrystalline and polycrystalline module of 50 W under the same solar irradiations.
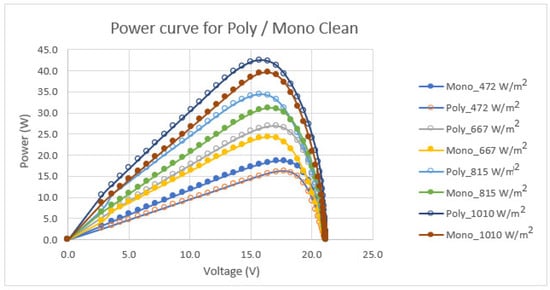
Figure 10.
Power curves of monocrystalline and polycrystalline module of 50 W under the same solar irradiations.
3.3. Effect of Dust on Monocrystalline Solar Module for Different Solar Irradiation
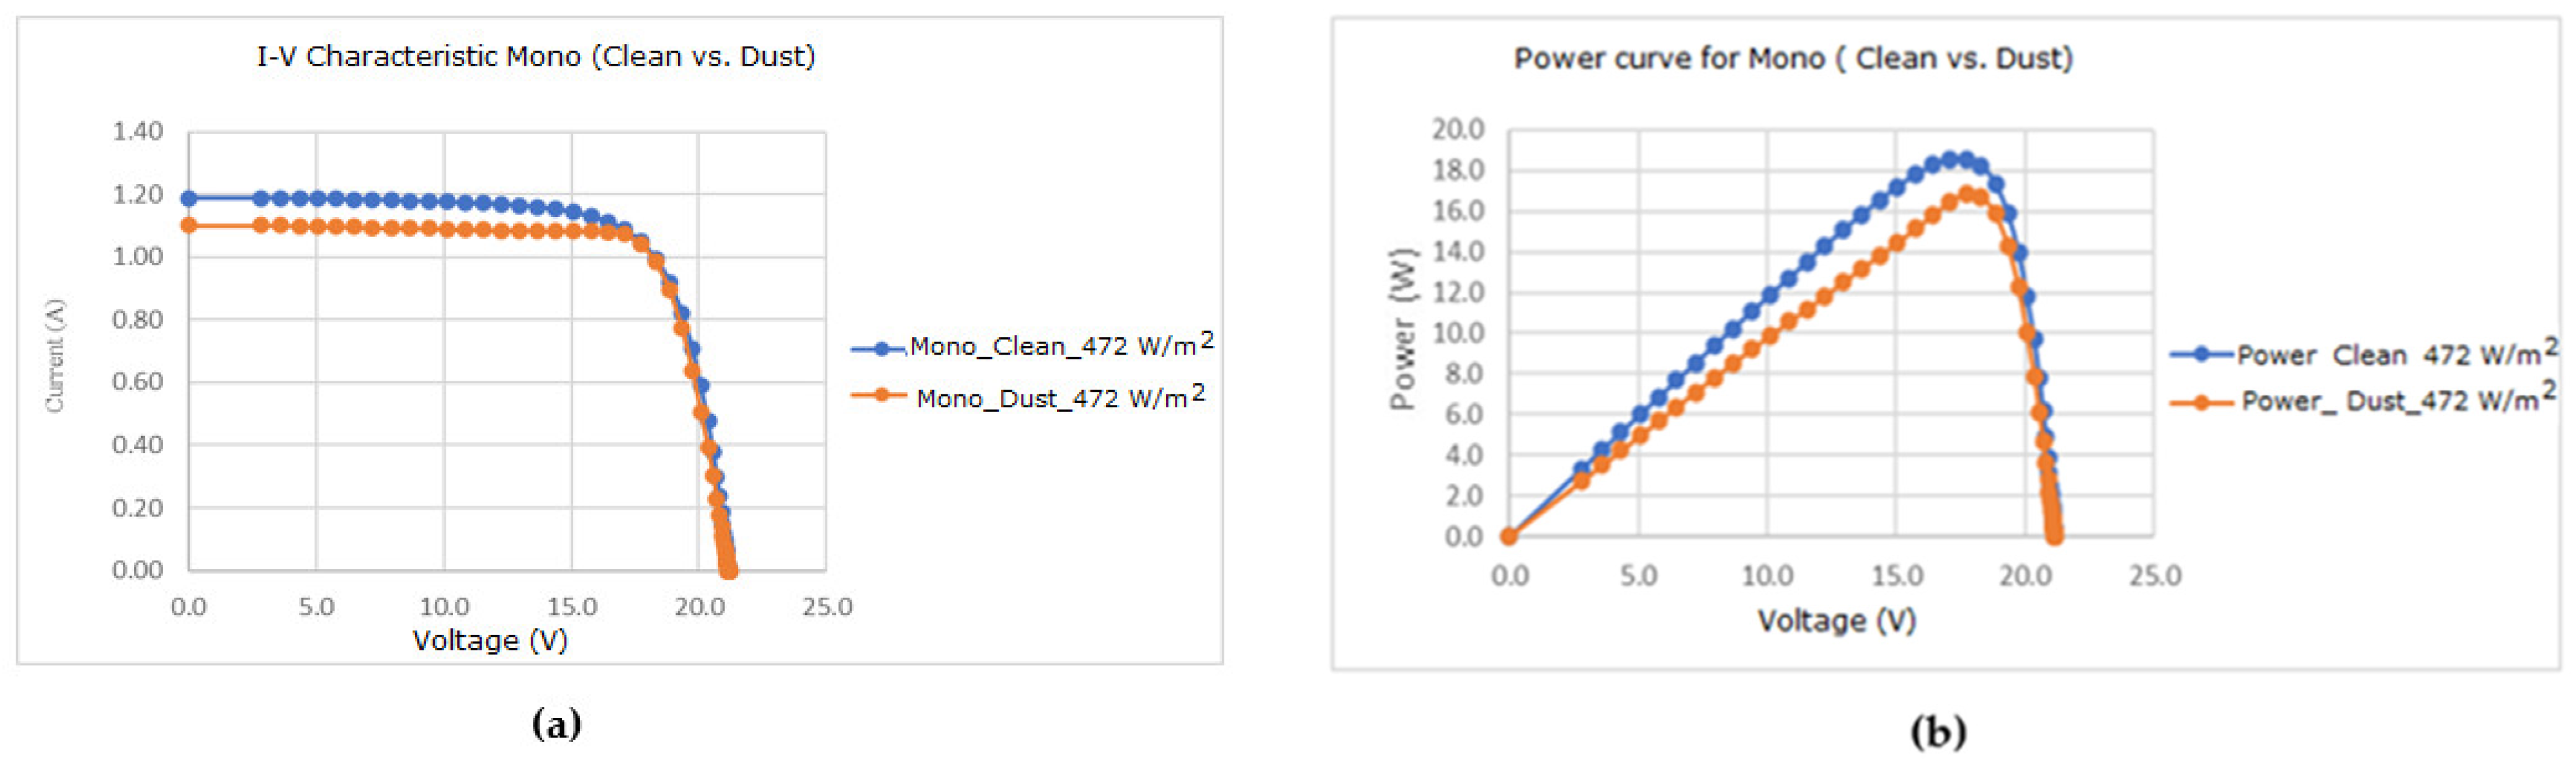
Figure 11, Figure 12, Figure 13 and Figure 14 represent the I-V characteristics and power curves for clean monocrystalline solar modules and dusty modules under different solar irradiation values (472, 620, 813, 1010 W/m2).
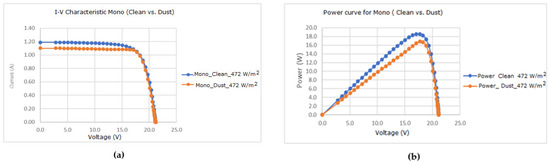
Figure 11.
Effect of dust on I-V characteristic (a) and on power curves (b) for monocrystalline PV module at 472 W/m2.
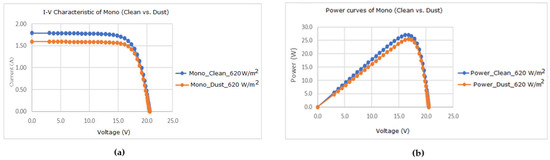
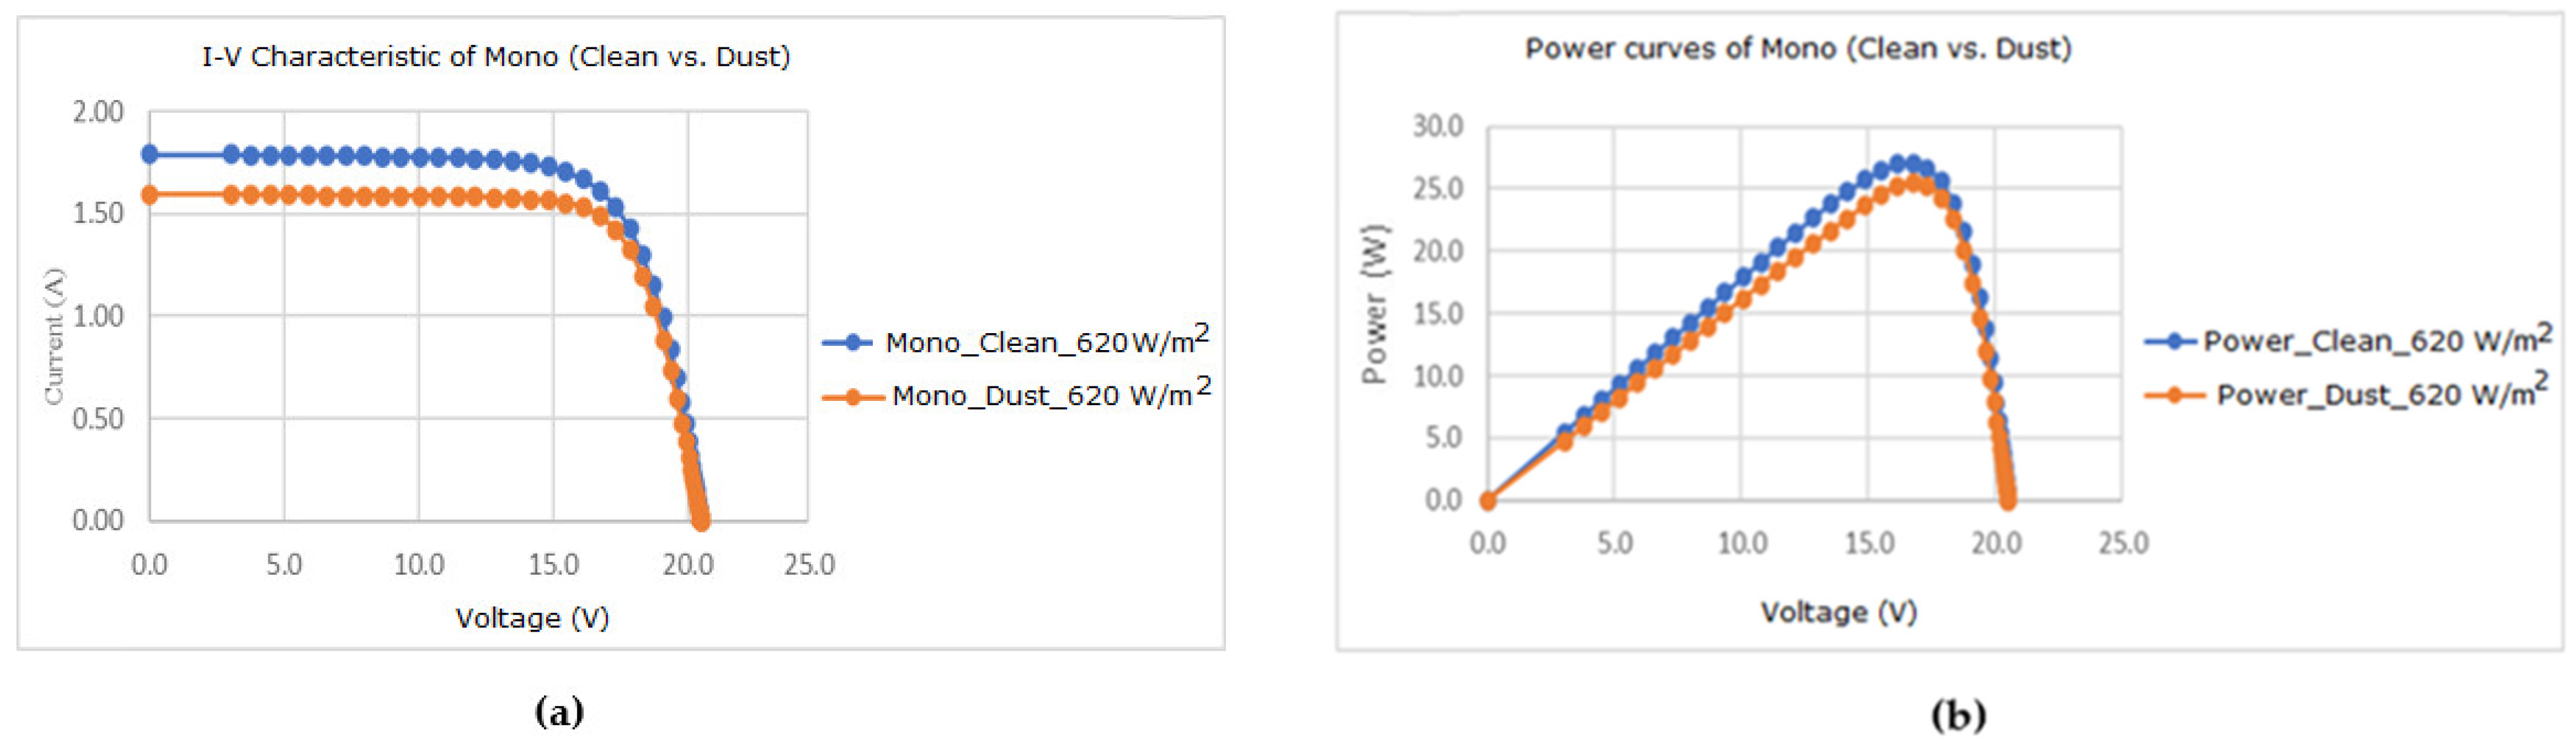
Figure 12.
Effect of dust on I-V characteristic (a) and on power curves (b) for monocrystalline PV module at 620 W/m2.
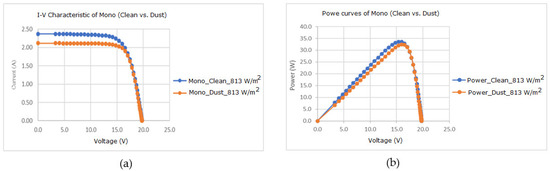
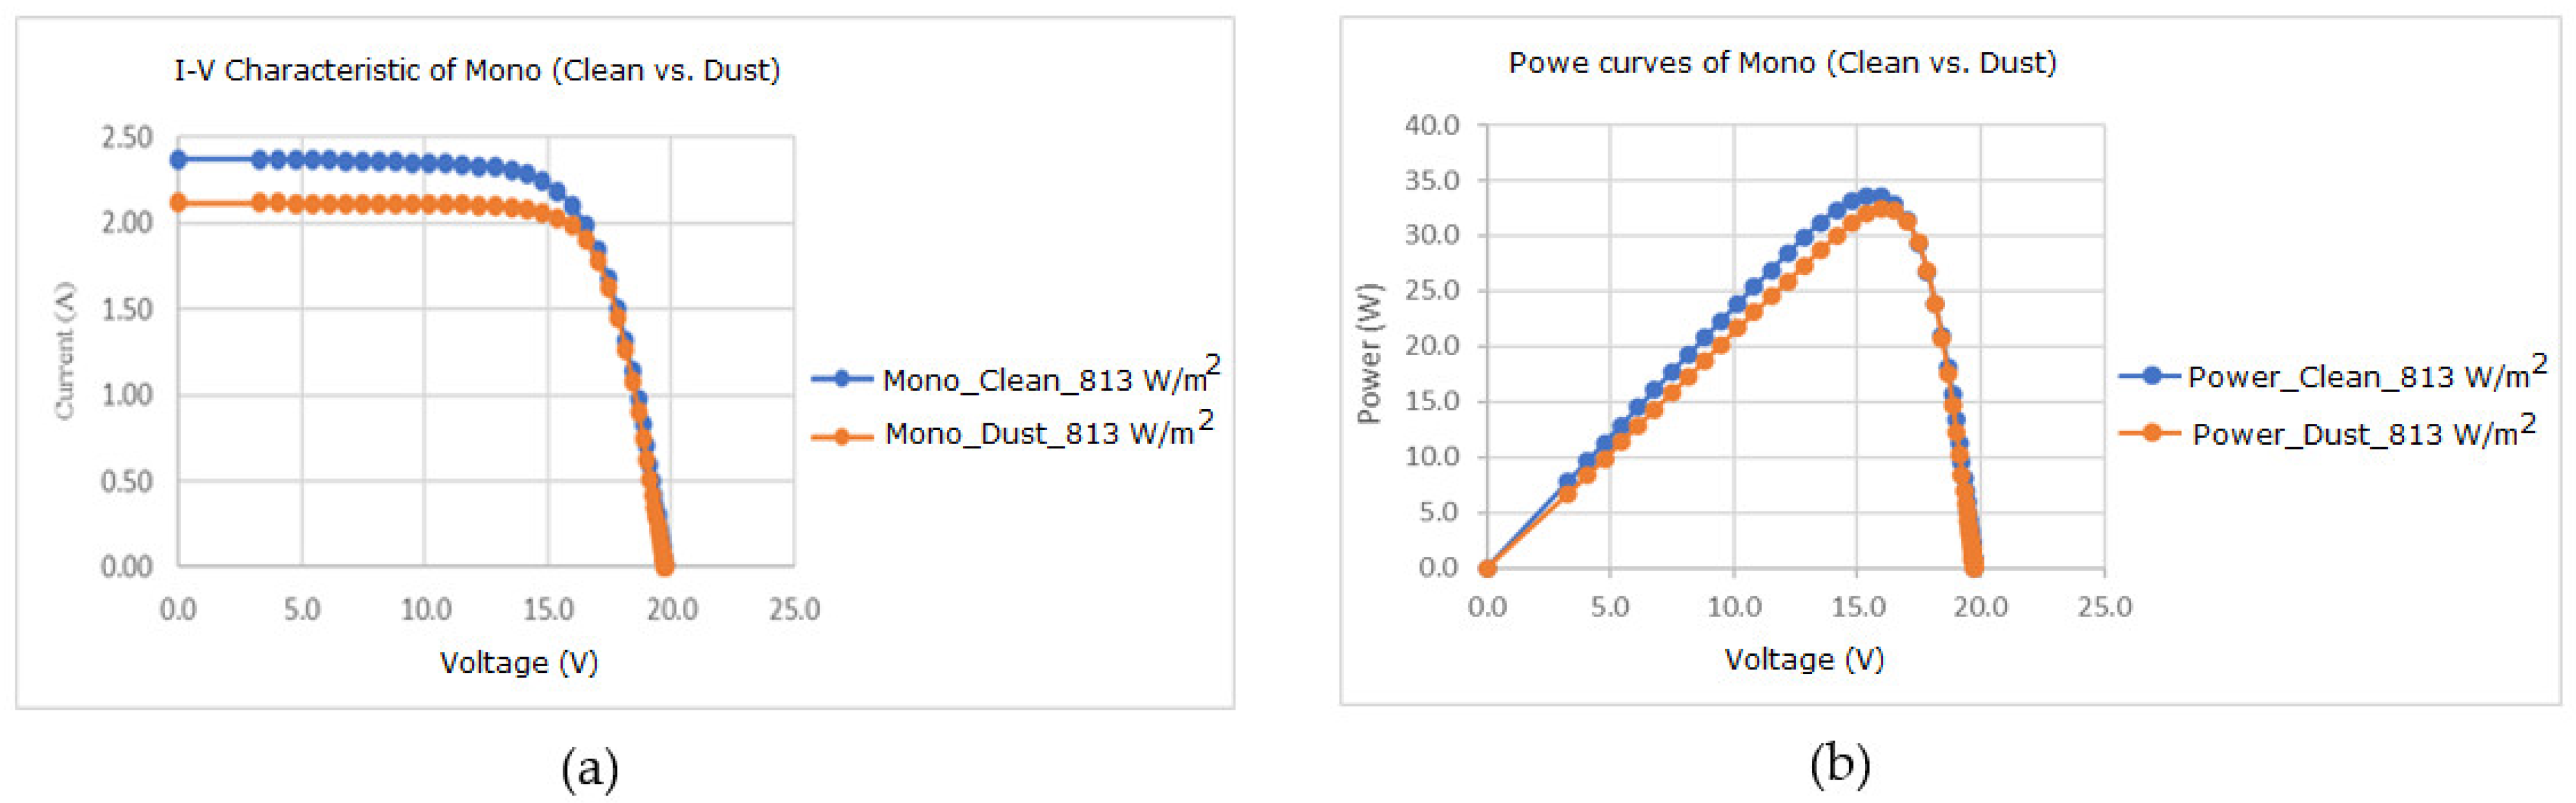
Figure 13.
Effect of dust on I-V characteristic (a) and on power curves (b) for monocrystalline PV module at 813 W/m2.
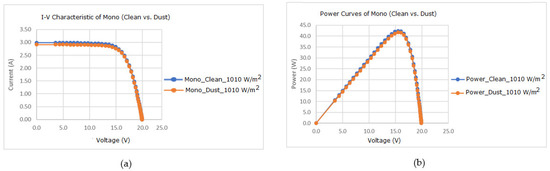
Figure 14.
Effect of dust on I-V characteristic (a) and on power curves (b) for monocrystalline PV module at 1010 W/m2.
3.4. Effect of Dust on Polycrystalline Solar Module for Different Solar Irradiation
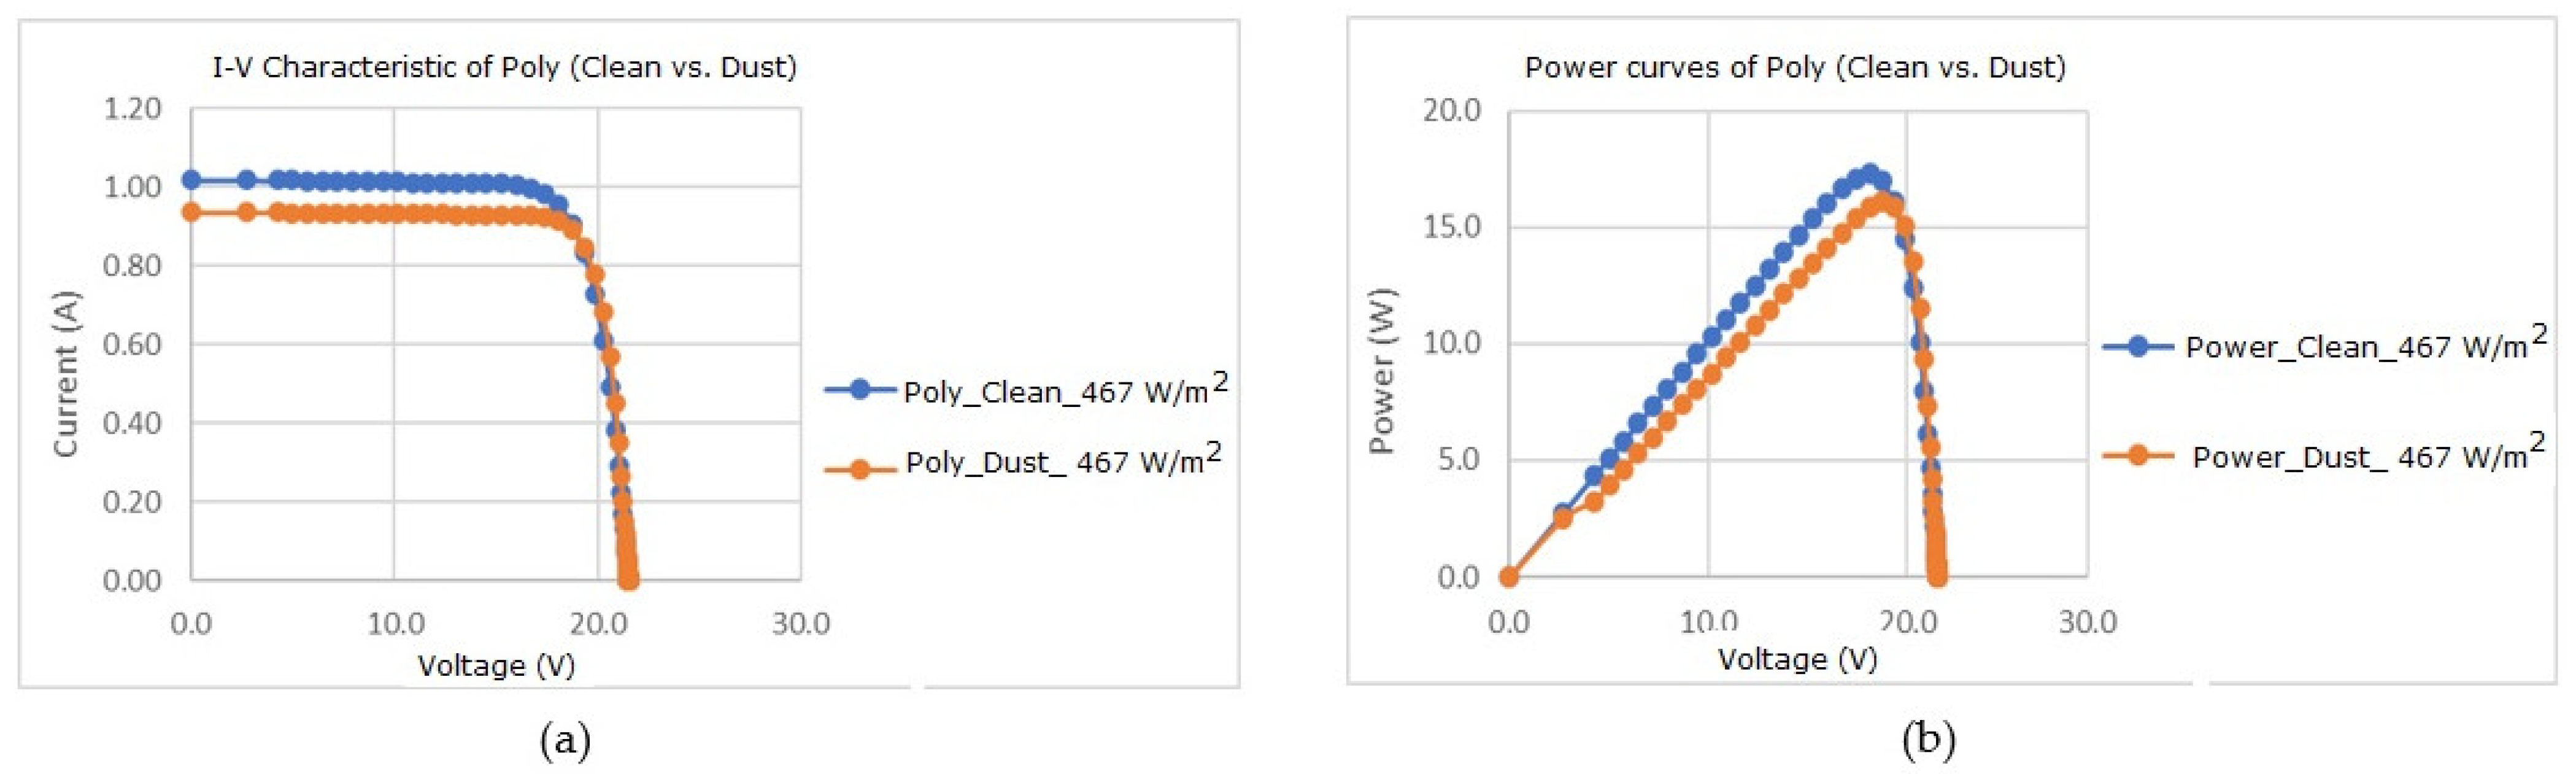
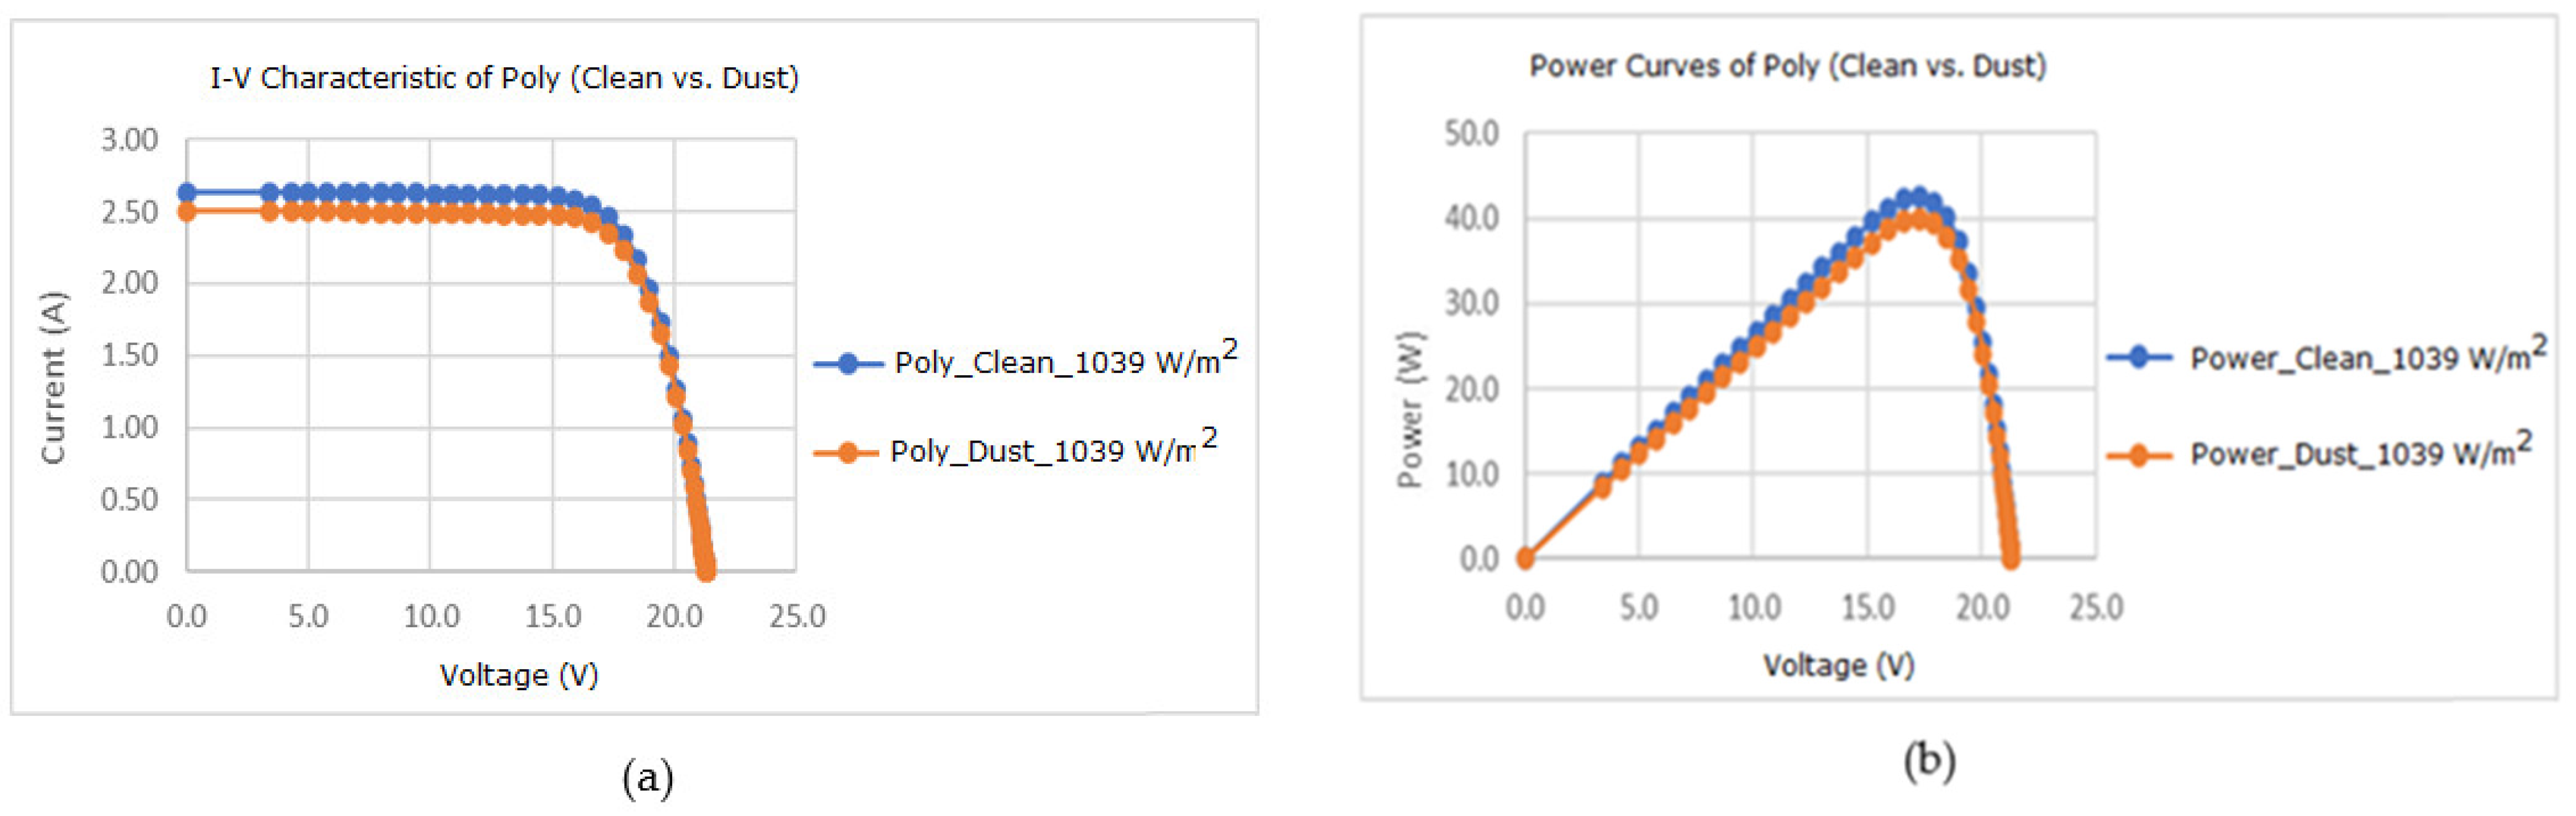
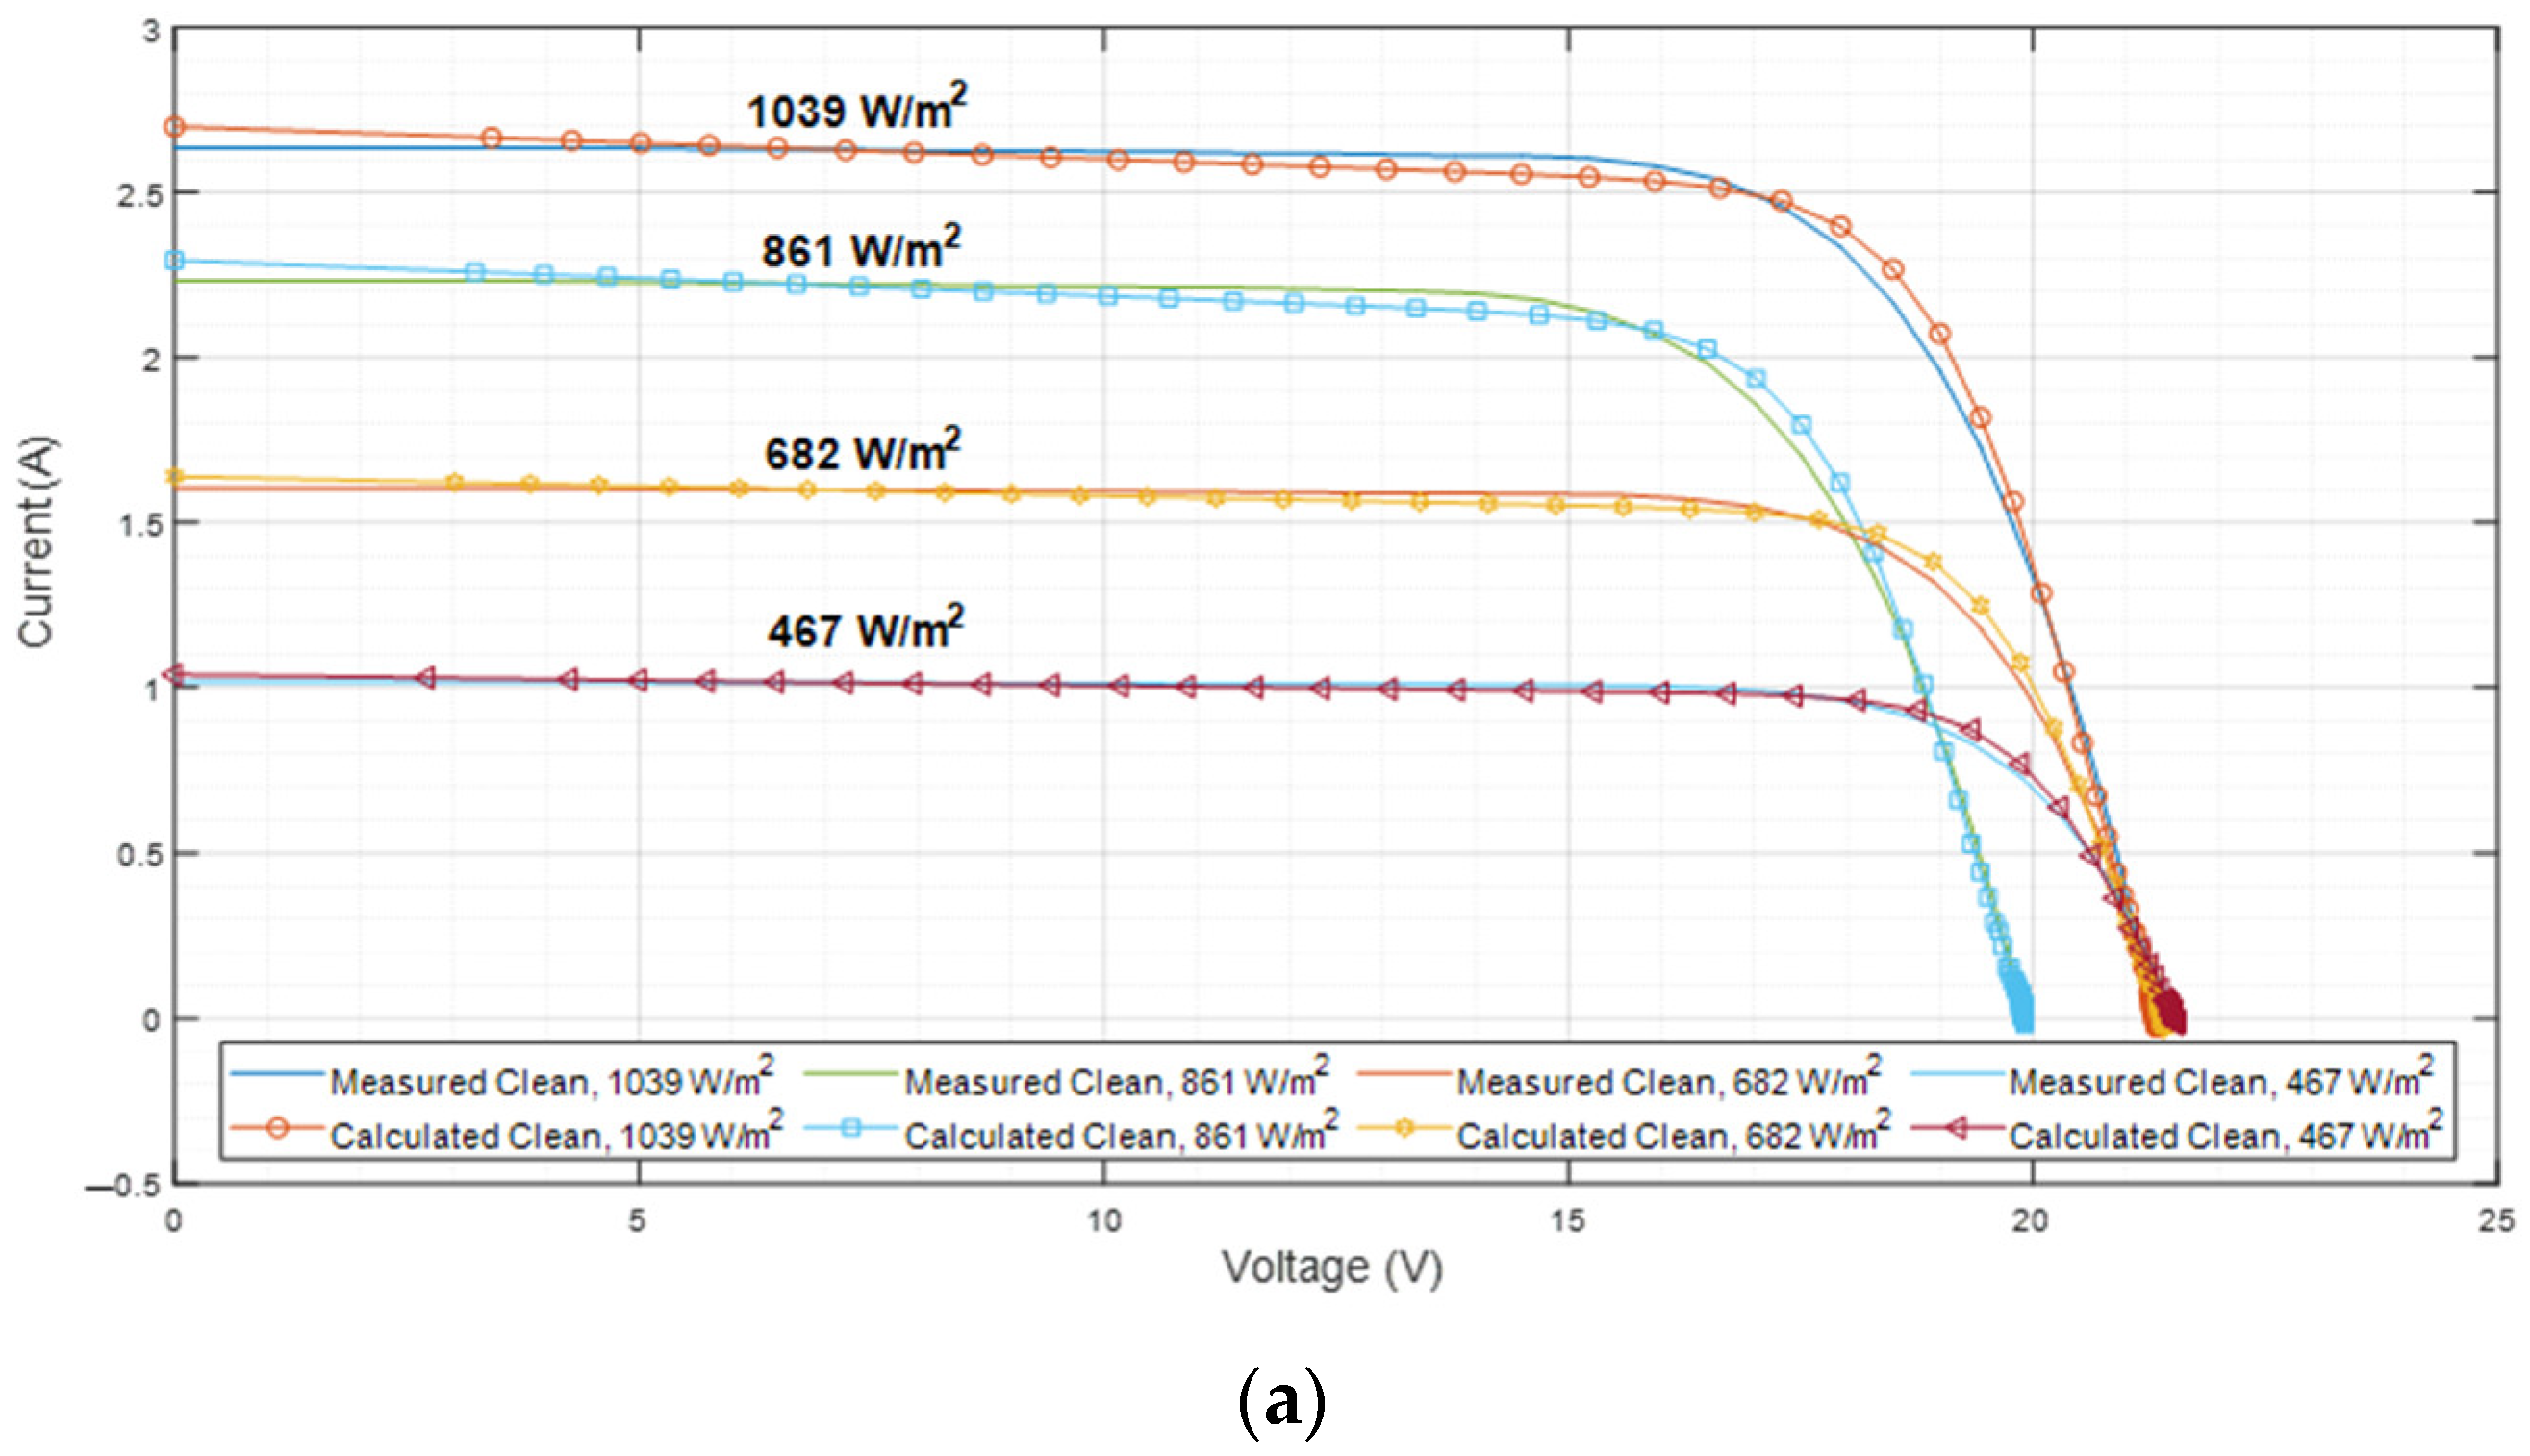
Figure 15, Figure 16, Figure 17 and Figure 18 represent the I-V characteristics and power curves for clean and dusty polycrystalline solar modules under different solar radiation values (467, 682, 861, 1039 W/m2) respectively.
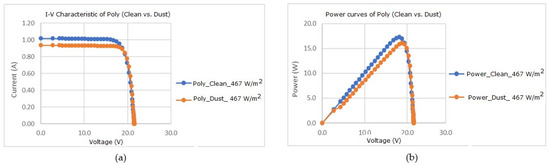
Figure 15.
Effect of dust on I-V characteristic (a) and on power curves (b) for polycrystalline PV module at 467 W/m2.
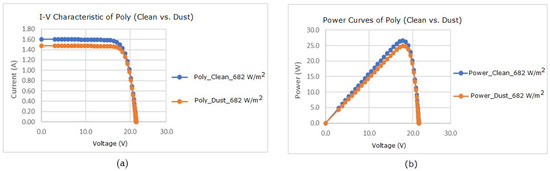
Figure 16.
Effect of dust on I-V characteristic (a) and on power curves (b) for polycrystalline PV module at 682 W/m2.
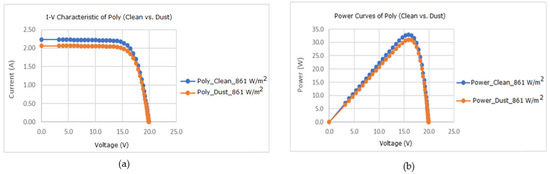
Figure 17.
Effect of dust on I-V characteristic (a) and on power curves (b) for polycrystalline PV module at 861 W/m2.
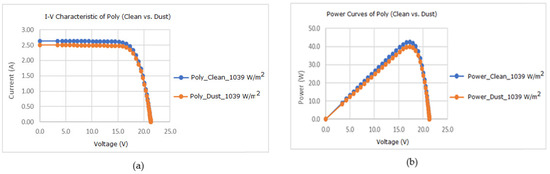
Figure 18.
Effect of dust on I-V characteristic (a) and on power curves (b) for polycrystalline PV module at 1039 W/m2.
Table 1 reports the drop in Isc and output power (Pout) due to the effect of dust on monocrystalline and polycrystalline solar modules under different solar irradiation levels.

Table 1.
Calculation of drop in short circuit current Isc and output power Pout.
Table 1 shows that the polycrystalline solar module presents a lower drop in output power due to the dust for high solar irradiation compared to the monocrystalline solar module. In addition, for low solar irradiation, the drop in the output power due to dust is greater for polycrystalline solar module than monocrystalline. Thus, m-Si technology is more affected by dust than p-Si technology under high solar irradiation. Additionally, the impact of dust decreases with the increase in solar irradiation in both cases.
3.5. Effect of Temperature on Polycrystalline and Monocrystalline Solar Modules for Different Incident Solar Irradiation
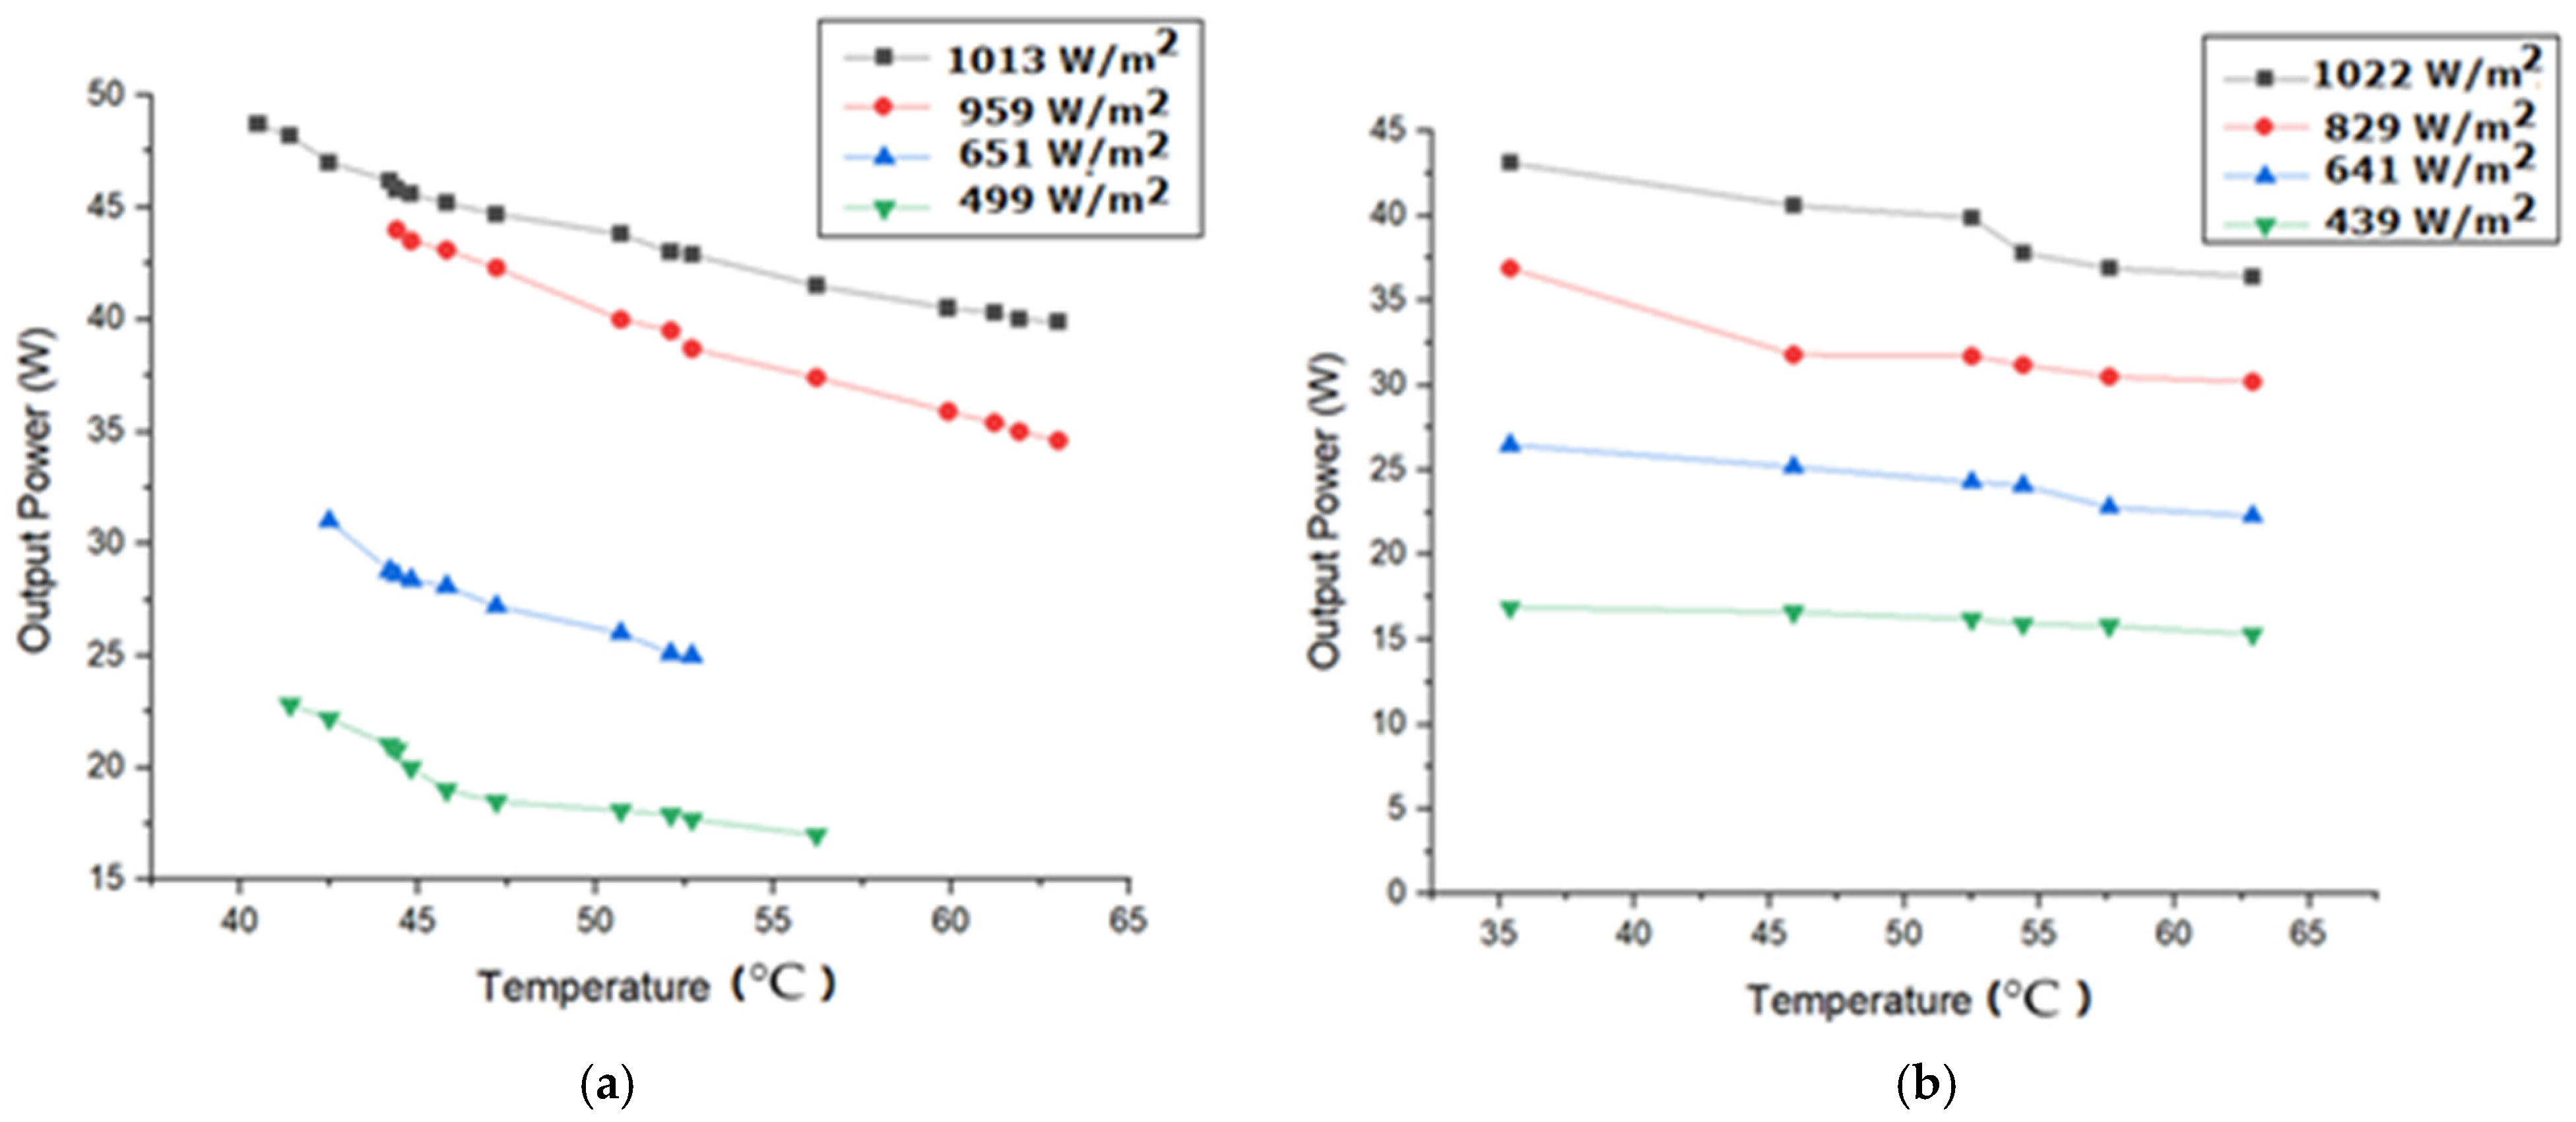
Figure 19 represents the evolution of output power of polycrystalline and monocrystalline solar modules, respectively, versus module temperature for different incident solar irradiation levels.

Figure 19.
Output power of polycrystalline module (a) and monocrystalline module (b) versus module temperature at different incident solar irradiation.
From Figure 19a,b, it can be clearly seen that the output power decreases when the module temperature increases for different values of solar radiation. We note that the decrease in output power is more considerable for polycrystalline solar modules than for monocrystalline solar modules for low solar radiation. In fact, p-Si solar modules have a greater temperature coefficient than m-Si solar modules. This explains why p-Si technology experiences a higher efficiency loss as the temperature increases. Table 2 shows the percentage drop in power (%) due to the increase in module temperature for both monocrystalline and polycrystalline devices.
Table 2.
Drop in output power for monocrystalline and polycrystalline solar modules.
We deduce from Table 2 that for high solar irradiation, the polycrystalline solar module provides fewer drops in output power compared to the monocrystalline solar module when the module temperature increases. However, for low solar radiation, it is better to use a monocrystalline module since the drop in output power is lower compared to the polycrystalline modules.
4. Numerical Results Using AHA
This paper presents an efficient optimization algorithm named the AHA (Artificial Hummingbirds Algorithm) for the PV parameter extraction problem. The AHA is an optimization algorithm that simulates the intelligent foraging and specialized flight skills of hummingbirds. The working phenomena are modeled based on flight skill strategies used in foraging, such as diagonal, axial and omnidirectional movements. Additionally, guided, territorial and migrating foraging is used to model the memory function of hummingbirds for food sources. Hence, we selected the AHA optimization technique to extract PV internal parameters due to its ability to solve several optimization problems and its high search capability. The technique is based on three strategies: territory, guided and migration process [22,28].
4.1. Problem Definition
Accurate extraction of the electrical parameters of different photovoltaic (PV) models and technologies is still an interesting subject due to the complexity of their models and, generally, the insufficient information data provided by manufacturers. Recently, meta-heuristic-based population algorithms have emerged as an efficient approach to overcome the limitations of analytical and deterministic methods. However, to apply these optimization algorithms, we need to define the variables to be extracted and the objective function that should be minimized.
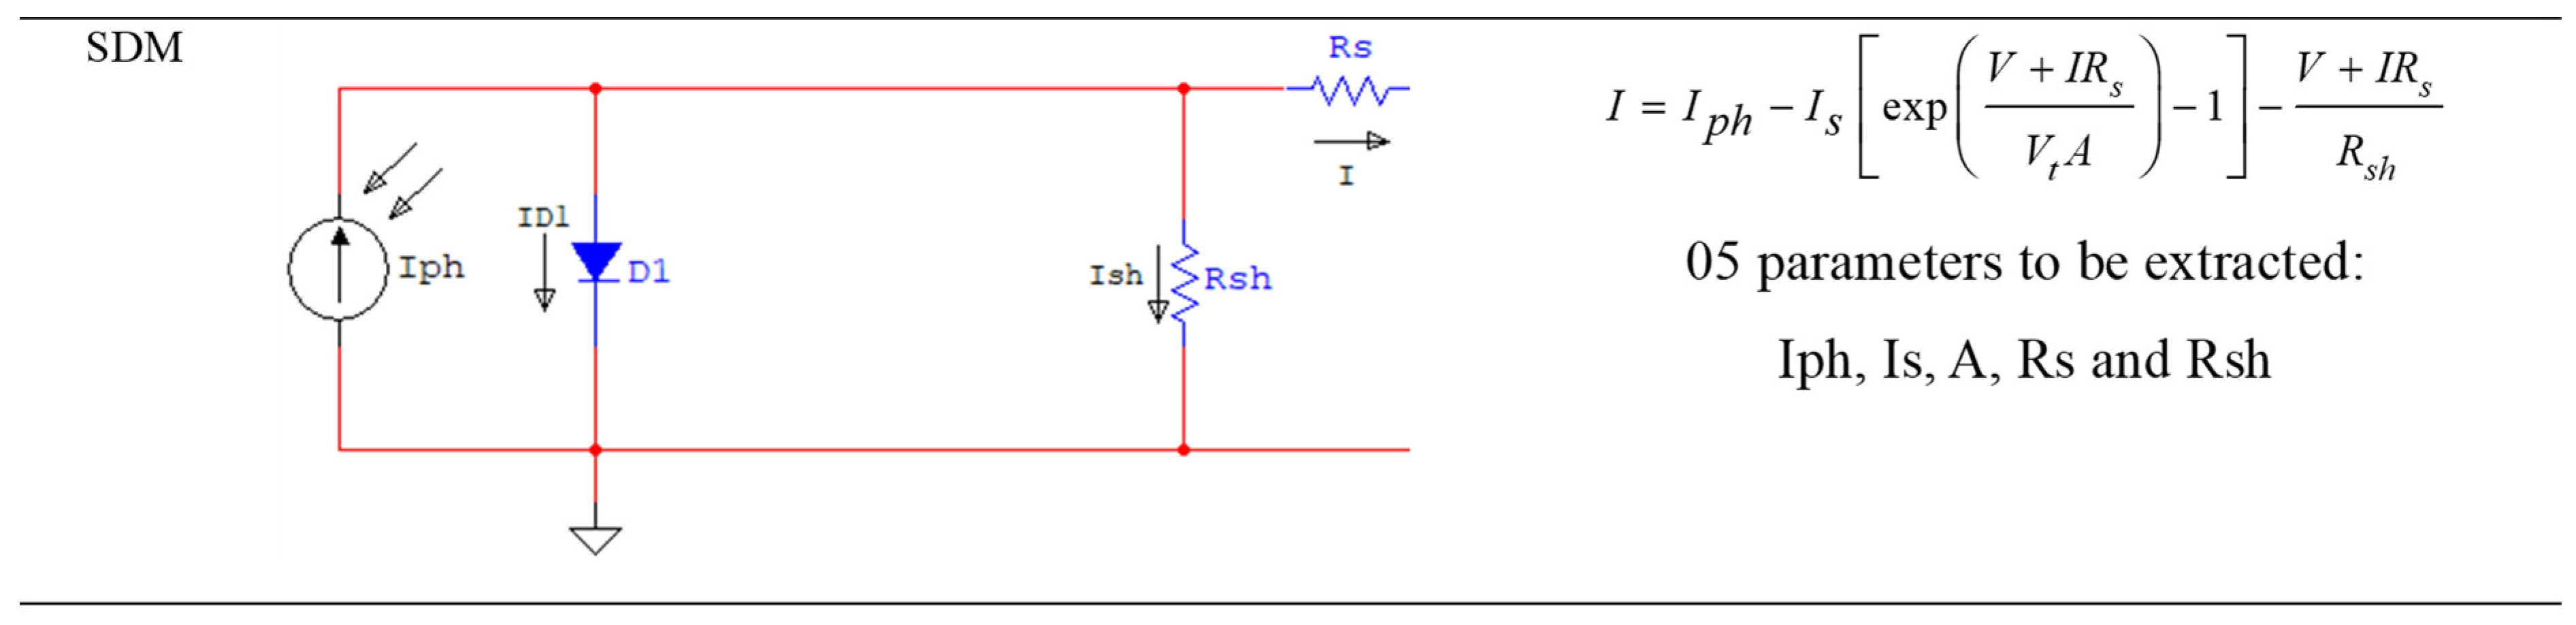
The simplest model is the single diode model (SDM), as presented in Figure 20. This model is based on only five parameters. Thus, the optimized parameters are the series resistance RS, the shunt resistance Rsh, the photocurrent IPh, the saturation current IS and the ideality factor A.
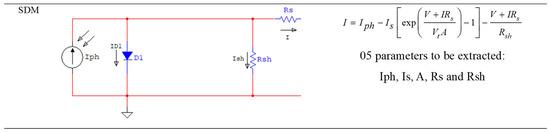
Figure 20.
SDM model. The arrows in the figure indicate the direction of currents in each branch.
In this work, the fitness function is the RMSE between the measured Imeas and the calculated Icalc currents. The considered objective function is given by:
where N is the number of measured points. Figure 21 shows the schematic process of AHA-based parameter identification used in this section. In order to construct an algorithm of optimization based on the AHA, we must use the following stages:
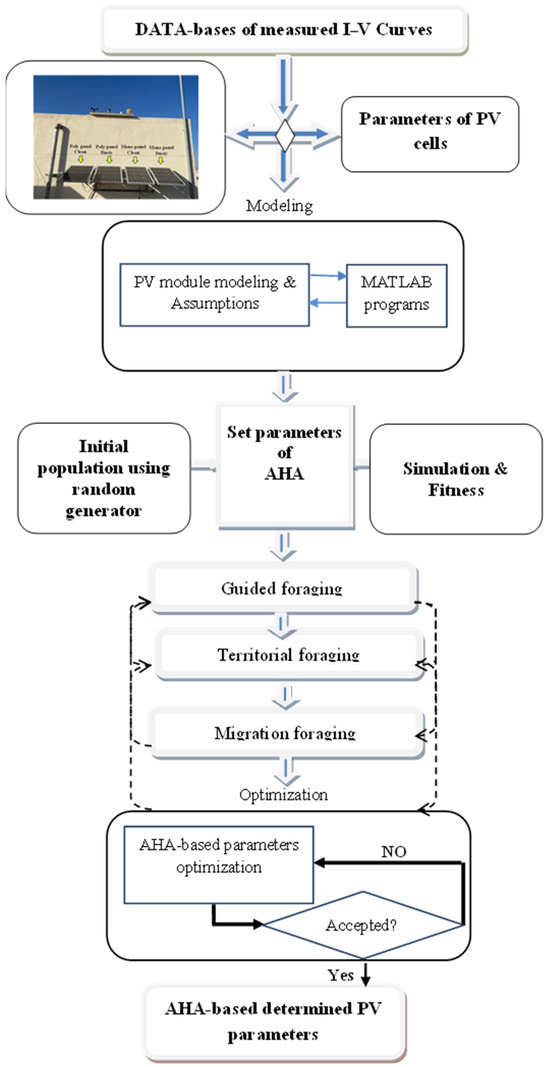
Figure 21.
AHA-based PV parameter determination.
- PV data acquisition under different conditions.
- Preprocess data and set objectives.
- Determine the initial configuration of the AHA.
- Generate the initial population.
- State the fitness function.
- Identify the AHA operators, i.e., guided, territorial and migration foraging.
4.2. AHA Mathematical Model
The mathematical formulation of the AHA is given as follows:
4.2.1. Initialization
The random initialization of a population of n hummingbirds that are placed on n food sources is given by [28]:
where L is the lower limit, and U presents the upper limit for a specified d-dimensional problem. r is a random vector in [0, 1], and xi denotes the position of the ith food source, i.e., the solution of the considered problem.
The visit table of food sources initialization is given by [28]:
When i = j, a hummingbird takes food from its specific food source, and if i ≠ j, the jth food source has just been visited by the ith hummingbird in the current iteration.
4.2.2. Guided Foraging
In the AHA, three flight skills, including omnidirectional, diagonal and axial flights, are used and modeled during foraging by introducing a direction switch vector to control one or more directions in the d-dimension space. The mathematical equation simulating the guided foraging behavior and a candidate food source is derived as follows [28]:
where xi(t) is the position of the ith food source at time t; xi,tar(t) is the position of the target food source that the ith hummingbird intends to visit; and a is a guided factor, which is subject to the normal distribution N (0, 1) with mean = 0 and standard deviation = 1.
The position update of the ith food source is as follows [28]:
where f (·) indicates the function fitness value.
4.2.3. Territorial Foraging
The mathematical equation simulates the local search of hummingbirds in the territorial foraging strategy, and a candidate food source is obtained as follows [28]:
where b is a territorial factor, which is subject to the normal distribution N (0, 1) with mean = 0 and standard deviation = 1.
4.2.4. Migration Foraging
The migration foraging of a hummingbird from the source with the worst nectar-refilling rate to a new one produced randomly can be given as follows [28]:
where xwor is the food source with the worst nectar-refilling rate in the population.
4.3. Extraction of Parameters Using AHA for Mono and Poly Solar Module
Table 3 and Table 4 show the values of five extracted parameters using the AHA in the case of monocrystalline and polycrystalline solar modules, respectively. The values obtained for Rs and Rsh by the AHA at each level of illumination for p-technology and m-technology are presented in Table 3 and Table 4. It is observed that the shunt resistance increases in the case of dusty modules in both technologies. In fact, the presence of dust on the surface of PV panels mean low solar irradiation is received. Therefore, this decreases in incident solar irradiation causes an increase in shunt resistance. This is due to the decrease in Isc, and then the slope near (0, Isc) reduces, and Rsh, which is the inverse of the slope, increases. However, the series resistance slightly changes in the presence of dust and exhibits a slight increase with the decrease in irradiation levels.
Table 3.
AHA-based estimated parameters of the single-diode model at the best RMSE for the polycrystalline module.
Table 4.
AHA-based estimated parameters of the single-diode model at the best RMSE for the monocrystalline module.
Obviously, the photocurrent (Iph) decreases in the case of dusty modules and also with the decrease in solar irradiation levels. Based on the obtained values of shunt resistance (Rsh) under the studied conditions, we observe that for both polycrystalline and monocrystalline panels, a decrease in sunlight levels leads to an increase in Rsh. Additionally, dusty conditions result in higher Rsh values compared to clean conditions for both panel types. Dust has a greater impact on increasing the shunt resistance of polycrystalline panels. Furthermore, monocrystalline panels generally exhibit lower Rsh values compared to polycrystalline panels. In summary, lower sunlight levels or the presence of dust cause an increase in shunt resistance for both panel types, with polycrystalline panels being more affected by dust, while monocrystalline panels tend to have lower overall shunt resistance.
However, the series resistance slightly changes in the presence of dust and exhibits a slight increase with the decrease in irradiation levels. Additionally, the photocurrent (Iph) decreases in the case of dusty panels and also decreases with the decrease in solar irradiation levels.
Based on an RMSE and StD analysis of the different current–voltage curves, this method has demonstrated good accuracy in both cases (clean and dusty modules) at various levels of illumination with different temperature degrees.
Figure 22 and Figure 23 represent the experimental IV characteristic of monocrystalline and polycrystalline solar modules, respectively, with the estimated one using the AHA.
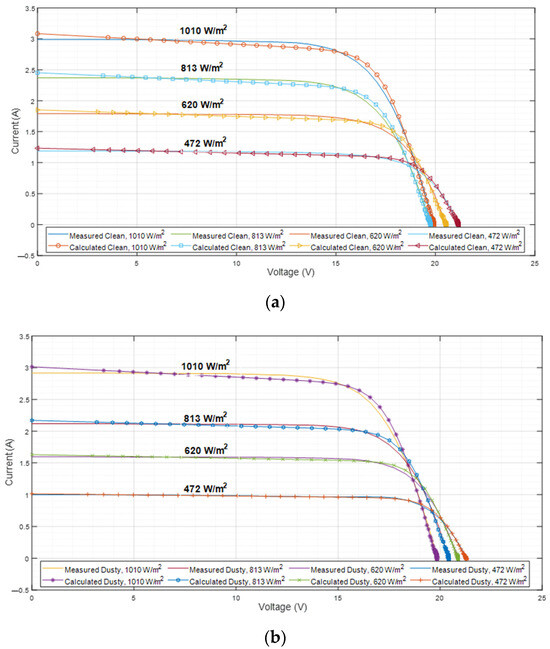
Figure 22.
Experimental and estimated IV characteristics (Mono) for different solar radiation: (a)clean monocrystalline solar module; (b) dusty monocrystalline solar module.
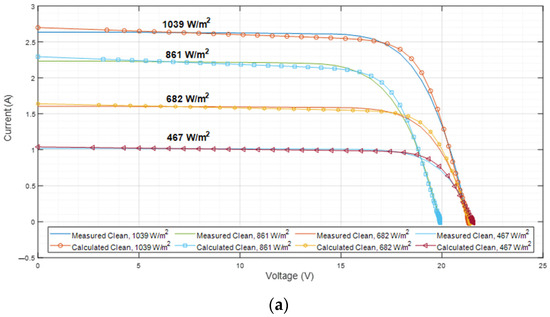
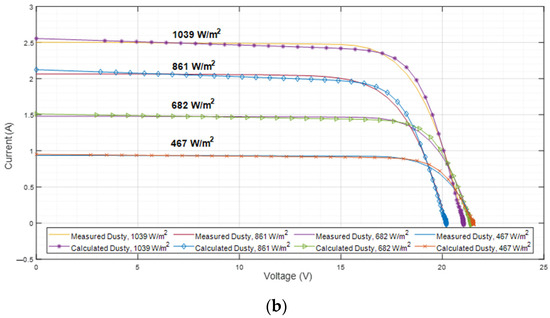
Figure 23.
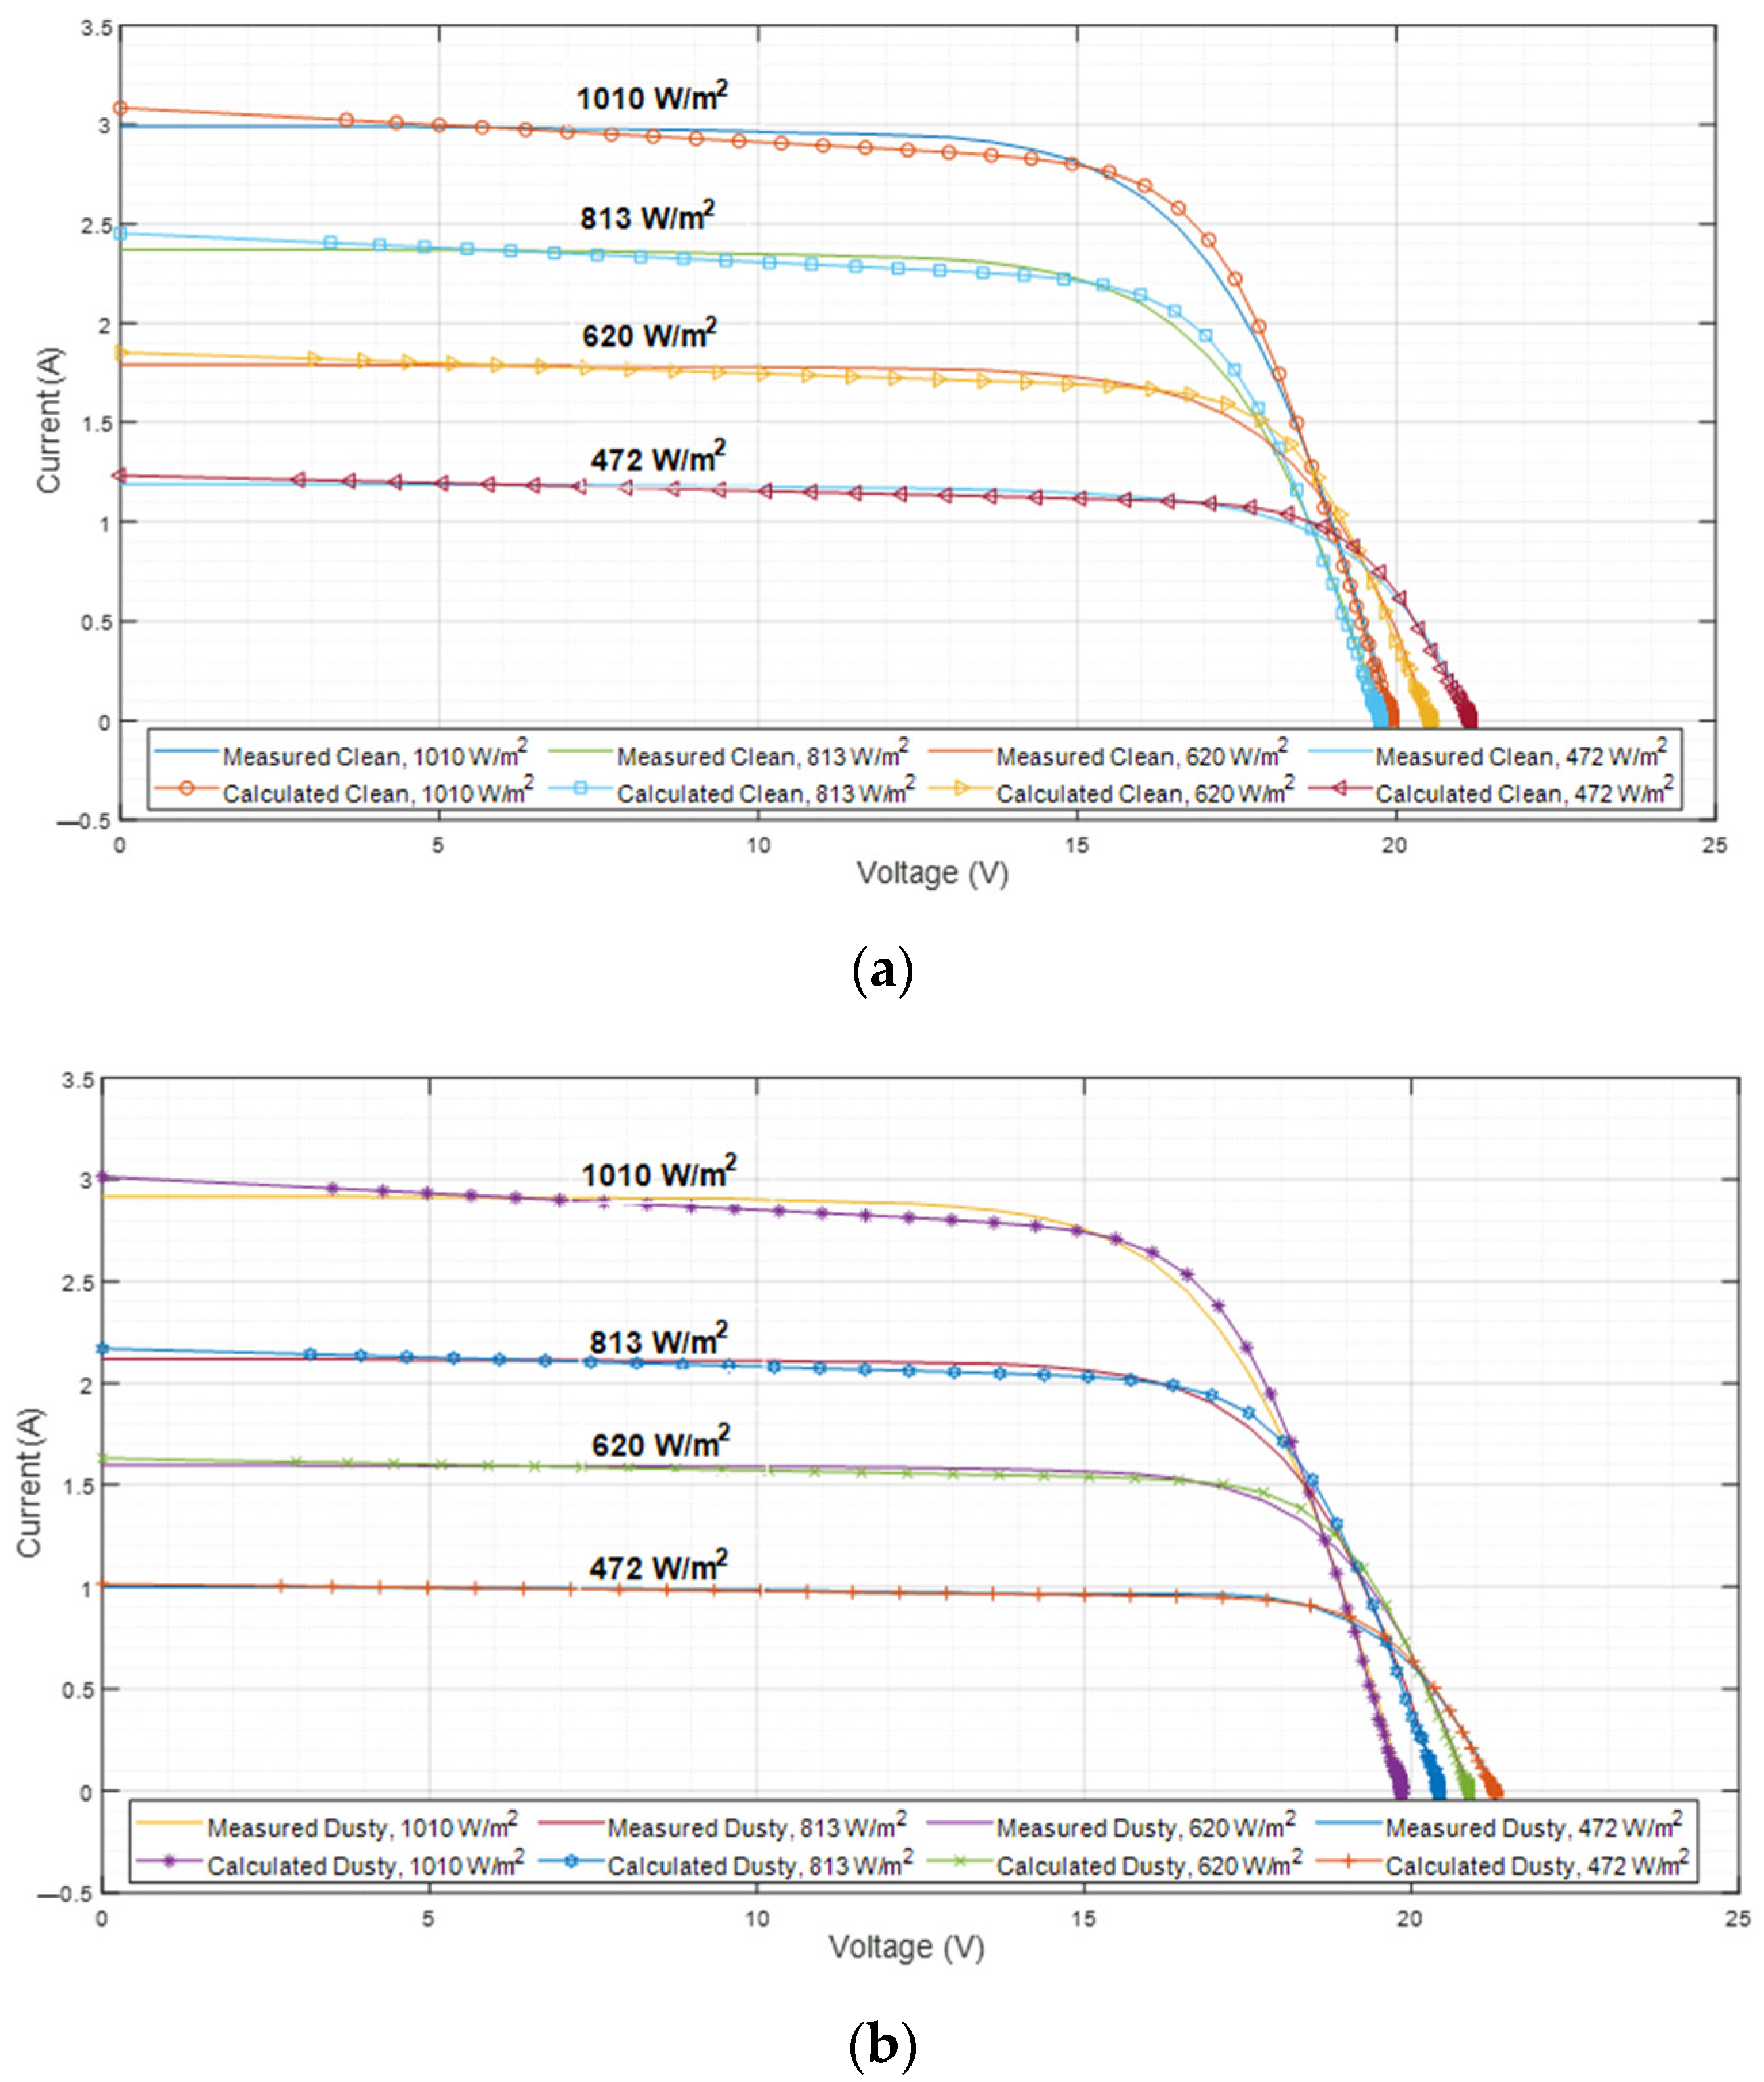
Experimental and estimated IV characteristics (Poly) for different solar radiation: (a) clean polycrystalline solar module; (b) dusty polycrystalline solar module.
Figure 22 and Figure 23 show how the I-V curves of the PV modules are affected at different irradiance levels. The amount of generated current is proportional to increases in solar irradiance intensity. The open-circuit voltage does not change significantly; its behavior remains relatively constant, even when solar irradiance intensity is varied. However, an increase in temperature for both technologies and cases result in a decrease in their open-circuit voltage.
4.4. Effect of Dust on Monocrystalline and Polycrystalline Solar Module
The impact of dust on the two technologies used in this study (monocrystalline and polycrystalline) was assessed by measuring the output power of each solar module under both clean and dusty conditions at different levels of solar radiation. Table 5 and Table 6 display the percentage drop in output power attributed to dust for the monocrystalline and polycrystalline solar modules, respectively. The power drop calculation is given as follows:
Table 5.
Power drop for different solar radiation due to the dusty monocrystalline solar module.
Table 6.
Power drop for different solar radiation due to the dusty polycrystalline solar module.
As reported in Table 5 and Table 6, we can observe a higher power drop for low solar irradiation for either polycrystalline or monocrystalline solar modules. The power drop for a mono solar module is greater than a polycrystalline solar module for solar irradiation above 500 W/m2. This suggests that it is better to use poly solar modules than mono solar modules for a site characterized by high solar radiation like Madinah City. However, for low solar irradiation (less than 500 W/m2), the drop in power is more considerable for polycrystalline solar modules than mono solar modules. Nevertheless, in both cases, the deposition of dust would considerably reduce the efficiency of PV production, especially in dusty and arid areas.
4.5. Discussion
The main difference between the two technologies used in this work is in the crystal purity of the solar cells. Monocrystalline solar panels are indeed composed of solar cells made from a single crystal of silicon, which results in a high level of purity and uniformity. Due to the uniform crystal structure, monocrystalline solar cells are generally recognized for their high efficiency. However, it is essential to note that the effectiveness of monocrystalline solar cells is not universally superior in all scenarios.
On the other hand, polycrystalline solar panels consist of solar cells made by melting together multiple fragments of silicon. These solar cells are created by blending silicon from different sources, leading to a less uniform crystal structure. In comparison to monocrystalline cells, polycrystalline solar cells typically exhibit slightly lower efficiency. Nonetheless, it is crucial to consider that the difference in effectiveness between the two types of solar panels can vary depending on specific factors such as technology, manufacturing processes and operating conditions.
Thin-film technology costs less than mono or poly modules but is also less efficient. Monocrystalline modules have a higher conversion efficiency than polycrystalline modules, which means they produce more output power than polycrystalline.
Typically, efficiencies for p-Si technology are in the range of 13–16%, while for m-Si technology, the efficiencies are in the range of 15–20%. Due to their lower efficiency rate, they are not as space-efficient since they produce less power per square meter. From the numerical values of different parameters, reported in Table 3, Table 4, Table 5 and Table 6, the variations produced in Rs, Rsh, Iph, Vmpp, Impp and Pmpp could be used for diagnostic purposes and the analysis of PV module efficiency operating under different climatic conditions.
The ambient temperature at the Madinah site is between 40 °C and 50 °C during the summer months and sometimes is over 50 °C. The cell temperature reaches the value of 83 °C [29], which affects the behaviors of solar cells (SC) and decreases their efficiency. The performance of solar cells was presented previously for the same site using a thermoelectric module (TEM) as a cooling system [29]. In fact, we found experimentally that the efficiency of solar cells decreases with an increase in temperature. The efficiency of solar cells drops by 0.5% per °C rise in temperature. Therefore, it is necessary to operate them at lower temperatures in order to increase their efficiency. Cooling the solar cells would enhance its performance. The hybrid PV/TEM system was proposed for PV applications in hot sites.
The novelty of this present study, compared with other similar studies [12,13,30,31,32], is that the obtained results show that it is recommended to use polycrystalline solar panels in regions characterized by high solar irradiation and high temperature instead of using monocrystalline solar panels, which are more efficient in any region in the world characterized by low solar irradiation and low temperature.
Many similar studies focused on PV panels’ degradations using data collection for more than one year [30]. The performance degradation rate, which is defined as the annual reduction rate of the maximum power expected from a PV module or a complete PV system, is not only associated with the specific PV technology but also related to several on-field factors, such as temperature, humidity, precipitation, dust, snow and solar irradiation [30].
Another work [12] focused on the energy performance analysis of three different photovoltaic (PV) module technologies under İzmit, Kocaeli, weather conditions in Northwest Turkey. For this purpose, three modules were installed using crystalline (c-Si), multi-crystalline (mc-Si) and cadmium–telluride (Cd–Te) modules. The results show that changes in the performance ratio (PR) of c-Si and mc-Si arrays are lower than Cd–Te arrays within the measurement period (8 months), and the mean values of PRs are 83.8%, 82.05% and 89.76% for mc-Si, c-Si and Cd–Te arrays, respectively. Therefore, the Cd–Te array can be accepted as a more reliable array under İzmit climatic conditions.
In [13], a comprehensive study of the performance of six large photovoltaic (PV) power plants with different mounting topologies over several years of operation was evaluated. In this study, the authors state that there are only a few contributions regarding the performance analysis of large PV power plants (from hundreds of kW to MW), and most of them focused on only one installation, one type of mounting topology and considering a period of time no longer than one year.
The performance of a fixed array 960 kWp PV system equipped with mc-Si panels located in southern Italy was not only evaluated over an 8-month period [31] but was also compared with the performance estimated using the SAM and PVsyst simulation tools [32]. Minimum and maximum average monthly efficiencies (PV) of 15.66% and 17.46% were obtained in July and March, respectively.
In another way, this present work reveals that each technology of solar panels could be more efficient in a specific region in the world and less efficient in other places since the performance of solar panels depends on the climate of the specific region. In particular, it is recommended to use polycrystalline solar panels in regions characterized by high solar irradiation and high temperatures instead of monocrystalline solar panels.
5. Conclusions
In this work, a comparative analysis between polycrystalline and monocrystalline PV modules of 50 Wp was performed under different conditions of solar irradiation and temperature during the period from October 2022 to March 2023. We found that dust and temperature affect both PV technologies. For high solar irradiation, the drop in output power due to dust is greater for monocrystalline modules than polycrystalline modules, especially when solar irradiation is above 500 W/m2. For low solar irradiation, there is a greater drop in output power due to dust for polycrystalline modules compared to monocrystalline modules. This observation is consistent with the data, as the polycrystalline module experienced a 1.65% reduction in power at 1039 W/m2 but a significant 9.17% reduction at 467 W/m2. In contrast, the monocrystalline module encountered a 6.06% power drop at 1010 W/m2 and a consistent 6.69% drop at 472 W/m2. Therefore, we conclude that it is better to use polycrystalline solar modules than monocrystalline solar modules for locations characterized by high solar irradiation, such as Madinah City.
The results regarding the effect of temperature on both p-Si and m-Si solar modules reveal that for high solar irradiation, polycrystalline solar modules experience a lesser drop in output power compared to monocrystalline solar modules when the module temperature increases. However, for low solar irradiation, it is better to use monocrystalline modules since the drop in output power is lower compared to polycrystalline modules. Therefore, it is recommended to use p-Si technology in hot–arid regions since it is more efficient than m-Si technology. These results are highlighted by the numerical data, with the polycrystalline module showing a reduction in photocurrent from approximately 2.715 A in clean conditions to 2.570 A in dusty conditions at 1039 W/m2 and 52.3 °C. Similarly, the monocrystalline module experienced a slight decrease in photocurrent from approximately 3.117 A in clean conditions to 3.043 A in dusty conditions at 1010 W/m2 and 63.1 °C.
This work provides valuable information on solar energy for communities. It evaluates system performance through experiments and offers insights into efficiency and reliability. Cooling strategies, like thermoelectric modules, are explored to reduce power drops. The research aims to provide findings that can be applied more widely by considering different regions. Practical recommendations are given for system design, installation and maintenance; addressing challenges; and suggesting improvements. The work also highlights potential advancements for future development. Its goal is to support informed decision-making and promote the successful adoption of solar energy.
Author Contributions
Literature review, M.B., S.H., A.M., H.A., M.K. and M.S.A.; methodology and organization, M.B. and S.H.; Data collection: M.B. and A.A.; writing—original draft preparation, M.B., S.H. and A.M.; writing review and editing, M.B., S.H., A.M., H.A., M.K. and M.S.A.; supervision, M.B., S.H., A.M. and A.A.; project administration, M.B. All authors have read and agreed to the published version of the manuscript.
Funding
This research is funded by the Deputyship of Research and Innovation, Ministry of Education in Saudi Arabia, through project number 809.
Informed Consent Statement
Not applicable.
Data Availability Statement
Not applicable.
Acknowledgments
This work is funded by the Deputyship of Research and Innovation, Ministry of Education in Saudi Arabia, through project number 809. In addition, the authors would like to express their appreciation for the support provided by the Islamic University of Madinah.
Conflicts of Interest
The authors declare no conflict of interest.
Nomenclature
| A | Ideality factor. |
| AHA | Artificial Hummingbirds Algorithm. |
| CPV | concentrated PV. |
| HG | Daily solar irradiation (Wh/m2). |
| Icalc | Calculated currents (A). |
| Impp | Maximum current power point (A). |
| Imeas | Measured currents (A). |
| IPh | Photocurrent (A) |
| IS | Saturation current (A). |
| ISC | Short circuit current (A). |
| Mono-Si (m-Si) | Monocrystalline silicon solar module. |
| N | Number of measured points. |
| Pmpp | Maximum power point (W). |
| Poly-Si (p-Si) | Polycrystalline silicon solar module. |
| Pout | Output power (W). |
| PV | Photovoltaic. |
| RMSE | Root mean square error. |
| RS | Series resistance. |
| RSh | Shunt resistance. |
| SC | Solar cells. |
| SDM | Single diode model. |
| StD | Standard deviation |
| T | Ambient temperature (°C). |
| TM | Thermoelectric module. |
| Vmpp | Maximum voltage power point (V). |
| VOC | Open circuit voltage (V) |
| VT | Visit table of food sources in the AHA |
References
- Strielkowski, W.; Civín, L.; Tarkhanova, E.; Tvaronavičienė, M.; Petrenko, Y. Renewable Energy in the Sustainable Development of Electrical Power Sector: A Review. Energies 2021, 14, 8240. [Google Scholar] [CrossRef]
- Available online: https://www.worldbank.org/en/topic/energy/publication/solar-photovoltaic-power-potential-by-country (accessed on 20 March 2023).
- Solanki, C.S. Solar Photovoltaic Fundamentals, Technologies and Applications; PHI Learning Pvt. Ltd.: Delhi, India, 2016. [Google Scholar]
- Moller, H.J. Semiconductors for Solar Cells; Artech House Publishers: Norwood, MA, USA, 1993. [Google Scholar]
- Garg, H.P.; Prakash, J. Solar Energy: Fundamentals and Applications; McGraw-Hill: New York, NY, USA, 1997. [Google Scholar]
- Kymakis, E.; Kalykakis, S.; Papazoglou, T.M. Performance analysis of a grid connected photovoltaic park on the island of Crete. Energy Convers. Manag. 2009, 50, 433–438. [Google Scholar] [CrossRef]
- Chokmaviroj, S.; Wattanapong, R.; Suchart, Y. Performance of a 500 kWP grid connected photovoltaic system at Mae Hong Son Province, Thailand. Renew. Energy 2006, 31, 19–28. [Google Scholar] [CrossRef]
- Sharma, V.; Chandel, S. Performance analysis of a 190 kWp grid interactive solar photovoltaic power plant in India. Energy 2013, 55, 476–485. [Google Scholar] [CrossRef]
- Mpholo, M.; Nchaba, T.; Monese, M. Yield and performance analysis of the first grid-connected solar farm at Moshoe shoe I International Airport, Lesotho. Renew. Energy 2018, 81, 845–852. [Google Scholar] [CrossRef]
- Ghiani, E.; Pilo, F.; Cossu, S. Evaluation of photovoltaic installations performances in Sardinia. Energy Convers. Manag. 2013, 76, 1134–1142. [Google Scholar] [CrossRef]
- Abu Hussein, L.; Ayadi, O.; Fathi, M. Performance comparison for sun-tracking mechanism photovoltaic (PV) and concentrated photovoltaic (CPV) solar panels with fixed system PV panels in Jordan. In Proceedings of the 12th international renewable engineering conference, (IREC), Amman, Jordan, 14–15 April 2021; pp. 1–8. [Google Scholar]
- Başoğlu, M.E.; Kazdaloğlu, A.; Erfidan, T.; Bilgin, M.Z.; Cąkir, B. Performance analyzes of different photovoltaic module technologies under izmit, Kocaeli climatic conditions. Renew. Sustain. Energy Rev. 2015, 52, 357–365. [Google Scholar] [CrossRef]
- Martín-Martínez, S.; Cañas-Carretón, M.; Honrubia-Escribano, A.; Gómez- Lázaro, E. Performance evaluation of large solar photovoltaic power plants in Spain. Energy Convers. Manag. 2019, 183, 515–528. [Google Scholar] [CrossRef]
- Ayadi, O.; Jamra, M.; Jaber, A.; Ahmad, L.; Alnaqep, M. An experimental comparison of bifacial and monofacial PV modules. In Proceedings of the 12th international renewable engineering conference (IREC), Amman, Jordan, 14–15 April 2021; pp. 1–8. [Google Scholar]
- Beskirli, A.; Dag, I. Parameter extraction for photovoltaic models with tree seed algorithm. Energy Rep. 2023, 9, 174–185. [Google Scholar] [CrossRef]
- Farayola, A.M.; Sun, Y.; Ali, A. Global maximum power point tracking and cell parameter extraction in Photovoltaic systems using improved frefly Algorithm. Energy Rep. 2022, 8, 162–186. [Google Scholar] [CrossRef]
- Abd El-Mageed, A.A.; Abohany, A.A.; Saad, H.M.H.; Sallam, K.M. Parameter extraction of solar photovoltaic models using queuing search optimization and differential evolution. Appl. Soft Comput. 2023, 134, 110032. [Google Scholar] [CrossRef]
- Ali, F.; Sarwar, A.; Bakhsh, F.I.; Ahmad, S.; Shah, A.A.; Ahmed, H. Parameter extraction of photovoltaic models using atomic orbital search algorithm on a decent basis for novel accurate RMSE calculation. Energy Convers. Manag. 2023, 277, 116613. [Google Scholar] [CrossRef]
- Qaraad, M.; Amjad, S.; Hussein, N.K.; Badawy, M.; Mirjalili, S.; Elhosseini, M.A. Photovoltaic parameter estimation using improved moth flame algorithms with local escape operators. Comput. Elect. Eng. 2023, 106, 108603. [Google Scholar] [CrossRef]
- Benhmamou, D.; Elyaqouti, M.; Arjdal, E.H.; Saadaoui, D.; Lidaighbi, S.; Chaouf, J.; Ibrahim, A.; Aqel, R.; El fatmi, D.D.; Obukhov, S. A novel hybrid numerical with analytical approach for parameter extraction of photovoltaic modules. Energy Convers. Manag. 2022, 14, 100219. [Google Scholar]
- Xu, J.; Zhou, C.; Wei Li, W. Photovoltaic single diode model parameter extraction by dI/dV-assisted deterministic method. Solar Energy 2023, 251, 30–38. [Google Scholar] [CrossRef]
- Haddad, S.; Lekouaghet, B.; Benghanem, M.; Soukkou, A. Parameter Estimation of Solar Modules Operating Under Outdoor Operational Conditions Using Artificial Hummingbird Algorithm. IEEE Access 2022, 10, 1109. [Google Scholar] [CrossRef]
- Zorrilla-Casanova, J.; Piliougine, M.; Carretero, J.; Bernaola, P.; Carpena, P.; Mora-López, L.; Sidrach-de-Car Dona, M. Analysis of dust losses in photovoltaic Modules. In Proceedings of the World Renewable Energy Congress 2011, Linköping, Sweden, 8–13 May 2011. [Google Scholar]
- Colvin, D.J.; Iqbal, N.; Yerger, J.H.; Li, F.; Sinha, A.; Vicnansky, G.; Brummer, G.; Zheng, N.; Schneller, E.J.; Barkaszi, J.; et al. Degradation of Monocrystalline Silicon Photovoltaic Modules From a 10-Year-Old Roof top System in Florida. IEEE J. Photovolt. 2023, 13, 275–282. [Google Scholar] [CrossRef]
- Benghanem, M.; Almohammedi, A.; Al-Mashraqi, A.; Mellit, A. Dust Effect of Solar Cell Characteristic Using Matlab/Simulink: Case Study at Madinah City, KSA. Int. J. Energy Environ. Econ. 2018, 26, 59–76. [Google Scholar]
- Abdellatif, S.O.; Amr, L.; Kirah, K.; Ghali, H.A. Experimental Studies for Glass Light Transmission Degradation in Solar Cells Due to Dust Accumulation Using Effective Optical Scattering Parameters and Machine Learning Algorithm. IEEE J. Photovolt. 2023, 13, 158–164. [Google Scholar] [CrossRef]
- Boubaker, S.; Benghanem, M.; Mellit, A.; Kahouli, O.; Kolsi, L. Deep Neural Networks for Predicting Solar Radiation at Hail Region, Saudi Arabia. IEEE Access 2021, 9, 36719–36729. [Google Scholar] [CrossRef]
- Zhao, W.; Wang, L.; Mirjalili, S. Artificial hummingbird algorithm: A new bioinspired optimizer with its engineering applications. Comput. Methods Appl. Mech. Eng. 2022, 388, 114194. [Google Scholar] [CrossRef]
- Benghanem, M.; Al-Mashraqi, A.A.; Daffallah, K.O. Performance of solar cells using thermoelectric module in hot sites. Renew. Energy 2016, 89, 51–59. [Google Scholar] [CrossRef]
- Phinikarides, A.; Kindyni, N.; Makrides, G.; Georghiou, G.E. Review of photovoltaic degradation rate methodologies. Renew. Sustain Energy Rev. 2014, 40, 143–152. [Google Scholar] [CrossRef]
- Congedo, P.; Malvoni, M.; Mele, M.; Giorgi, M.D. Performance measurements of monocrystalline silicon PV modules in South-eastern Italy. Energy Convers. Manag. 2013, 68, 1–10. [Google Scholar] [CrossRef]
- Malvoni, M.; Leggieri, A.; Maggiotto, G.; Congedo, P.; Giorgi, M.D. Long term performance, losses and efficiency analysis of a 960 kWp photovoltaic system in the Mediterranean climate. Energy Convers. Manag. 2017, 145, 169–181. [Google Scholar] [CrossRef]


Disclaimer/Publisher’s Note: The statements, opinions and data contained in all publications are solely those of the individual author(s) and contributor(s) and not of MDPI and/or the editor(s). MDPI and/or the editor(s) disclaim responsibility for any injury to people or property resulting from any ideas, methods, instructions or products referred to in the content. |
© 2023 by the authors. Licensee MDPI, Basel, Switzerland. This article is an open access article distributed under the terms and conditions of the Creative Commons Attribution (CC BY) license (https://creativecommons.org/licenses/by/4.0/).