Article

Exploring the Critical Factors of Biomass Pyrolysis for Sustainable Fuel Production by Machine Learning

Department of Energy Systems Engineering, Istanbul Bilgi University, Eyupsultan, Istanbul 34060, Turkey
*
Author to whom correspondence should be addressed.
These authors contributed equally to this work.
Sustainability 2023, 15(20), 14884; https://doi.org/10.3390/su152014884
Submission received: 13 September 2023 / Revised: 10 October 2023 / Accepted: 13 October 2023 / Published: 15 October 2023

Abstract

:
The goal of this study is to use machine learning methodologies to identify the most influential variables and optimum conditions that maximize biochar, bio-oil, and biogas yields for slow pyrolysis. First, experimental results reported in 37 articles were compiled into a database. Then, an explainable machine learning approach, Shapley Additive exPlanations (SHAP), was employed to find the effects of descriptors on the targets, and it was found that higher biochar yields can be obtained at lower temperatures using biomass with low volatile matter and high ash content. Following that, decision tree classification was used to discover the variables leading to high levels of the targets, and the most generalizable path for high biogas yield was found to be where the maximum particle diameter was less than or equal to 6.5 mm and the temperature was greater than 912 K. Finally, association rule mining models were created to find associations of descriptors with very high levels of yields, and among many findings, it was discovered that biomass with larger particles cannot be converted into bio-oil efficiently. It was then concluded that machine learning methods can help to determine the best slow pyrolysis conditions for the production of renewable and sustainable biofuels.

1. Introduction

The utilization of biomass as a source for biofuel production presents a potential ecologically sustainable alternative to conventional fossil fuels. Indeed, in prehistoric times, wood-based biomass was the primary source of fuel, and its processing into more efficient fuels had an immense effect on human history. For a very long time, humanity remained in the Stone Age because humans were unable to create temperatures high enough to melt most metals and facilitate the manufacture of metal tools using conventional wood due to the fact that the temperature of wood fire is roughly 600 °C (depending on the wood type). However, when humans discovered how to make charcoal from biomass, they were able to create higher temperatures and eventually melt copper (melting point 1084.6 °C) and tin (melting point 231.9 °C) to produce bronze. This was the end of the Stone Age, which lasted for thousands of years, and the beginning of the Bronze Age, during which the tools and weapons produced from bronze made hunting, farming, and defense much easier and more effective. Since then, people have learned how to make biochar from different raw materials, such as lignocellulosic biomass, which is mostly made up of plant materials like forestry and agricultural residues [1]. Today, charcoal is still the primary energy source for millions of people all over the world, and this trend is expected to continue in the coming decades [2].
Today, modern pyrolysis is used for producing biofuels including biochar (or charcoal), bio-oil, and biogas from non-edible biomass sources, such as wood and its wastes, that do not compete with food production [3]. The pyrolysis process takes place under high temperatures (550–1250 °C), and in the absence of oxygen to prevent the combustion of biomass, in order to yield various energy carriers for different purposes. The chemistry behind the pyrolysis process is quite complex, involving thousands of fundamental reactions across three phases that produce hundreds of volatile species [4]. Consequently, the kind of biomass affects the product yield, together with variables like pyrolysis type (slow, fast, and flash), temperature, and particle size.
Machine learning (ML) may play a crucial role at this stage in determining the combination of variables that results in the highest product yield with the desired properties [5]. Machine learning is a tool for extracting hidden patterns in large and complicated datasets [6,7,8]. Moreover, machine learning makes it simpler to comprehend the data and make predictions based on the available dataset. As recent reviews have affirmed, the use of machine learning methodologies in renewable and sustainable energy technologies is also quite common for energy systems in general [9], and specifically for solar energy [10], wind energy [11], geothermal energy [12], bioenergy [13], and hydrogen production [14]. In addition, we have recently conducted two critical analyses in the field of bioenergy and proposed an outlook for future research on biofuel production from algae [15] and lignocellulosic ethanol production [16].
Likewise, a diverse range of successful machine learning applications for the pyrolysis process can be found in the literature. For instance, in a study that was conducted for microwave pyrolysis, the biochar yield and higher heating values were obtained by applying various machine learning techniques, including eXtreme Gradient Boosting and Shapley Additive exPlanations (SHAP) [17]. Another study on microwave pyrolysis used regression models as a machine learning approach to determine the importance of biomass variables on biochar yield [18]. Furthermore, in an article published by Mathur et al., bio-oil yields of various lignocellulosic biomass sources were predicted using three machine learning algorithms [19]. On the other hand, Cao et al. used least-squares support-vector machines and artificial neural networks to predict the biochar yield obtained from the pyrolysis of cattle manure [20]. Likewise, Chen et al. obtained results that support the previous work by applying support-vector machines and artificial neural networks to predict the bio-oil yield from rapid pyrolysis [21]. As an example of the torrefaction process (also known as low-temperature pyrolysis), Liu et al. used a random forest model with feature reduction to predict the properties of torrefied biomass based on feedstock and torrefaction conditions, which in turn provided detailed information for comprehending biomass torrefaction [22].
As discussed above, biofuel production using the pyrolysis process is quite complex, depending on the type of biomass as well as several process variables. As a result, a large number of experimental results have been reported in the literature in an effort to optimize the process variables for pyrolysis. However, due to the complexity of the experimental variables and the large amount of data dispersed across numerous publications, it is difficult to determine the optimal conditions for the pyrolysis process using conventional methods. In light of this, we compiled experimental results from the slow pyrolysis process reported in 37 articles into a database, which allowed the integration of the experimental results of different process conditions with various biomass types as well as the knowledge and expertise of various research groups. Then, we utilized various machine learning techniques to uncover hidden relationships between the descriptors (variables related to proximate and ultimate analysis, and operational variables) and target variables (biochar, bio-oil, and biogas yields). The primary goal of this research is to close the gaps in understanding the effects of pyrolysis parameters for the production of renewable and sustainable biofuels with higher efficiency.

2. Overview of Pyrolysis

Pyrolysis is a multipurpose technology for utilizing diverse feedstocks to produce a broad range of sustainable energy products, such as biochar, bio-oil, and biogas, with high potential for a variety of applications [23]. Biochar is a highly carbonaceous material with a carbon content between 65 and 90%, whereas bio-oil is a dark brown liquid containing a variety of oxygenated elements that is used to produce fuels/chemicals. Finally, biogas is a mixture of CO, H2, CH4, N2, CO2 and other hydrocarbons, which can be directly burned to generate heat and electricity or upgraded to more advanced fuels [24].
Pyrolysis can be divided into three subclasses based on operating conditions: slow pyrolysis, fast pyrolysis, and flash pyrolysis. Each one has its own set of advantages and disadvantages [25]. Among these, slow pyrolysis is the traditional type of pyrolysis, distinguished by a slow heating rate and a long residence time in the reactor. Slow pyrolysis involves heating the biomass to temperatures ranging from 550 to 950 °C with slow heating rates (0.1–1.0 °C/s) [26]. Char is more likely to be produced during slow pyrolysis, but small amounts of liquid and gaseous products are also generated during this process. On the other hand, fast pyrolysis is the thermal degradation of biomass at temperatures between 850 and 1250 °C with high heating rates (10–200 °C/s), producing primarily liquid products with minor amounts of char and non-condensable gases [4]. Finally, flash pyrolysis is an enhanced type of fast pyrolysis performed at 800–1200 °C with much higher heating rates (>1000 °C/s) and a very short residence time (<2 s) [23]. In flash pyrolysis, the combination of a rapid heating rate, high temperature, and low vapor residence time results in a high liquid yield but a lower char yield [27].
High temperatures are required to break down the bonds holding the biomass together; however, finding an optimum temperature is a challenging process depending on the type of biomass that is used. In general, increasing the pyrolysis temperature to elevated levels causes a drop in biochar yield due to the thermal decomposition of the heavy hydrocarbon components, producing more liquid and gaseous products and less biochar [27]. This is probably because of the secondary reactions taking place after the main pyrolysis reaction, increasing the amount of liquid and gaseous products produced at the expense of solid char. Furthermore, at very high temperatures, the amount of liquid products decreases due to further cracking of the volatiles, resulting in an increase in biogas yield [25].
Biomass is made up mostly of organic compounds like lignin, hemicelluloses, and cellulose, as well as some inorganic material. Different types of biomass have varying proportions of organic to inorganic compounds by mass, and these differences in biomass species composition have significant consequences for the final composition of the pyrolysis product [28]. Furthermore, soil, age, and planting conditions can all affect the composition of the same biomass, which in turn may affect the production process. Biomass having a higher cellulose and hemicellulose content than lignin-rich biomass typically results in greater bio-oil production. On the other hand, high structural stability makes lignin decomposition more challenging, resulting in greater char production [25]. Moreover, the generation of bio-oil is aided by the presence of substantial quantities of volatile material in the raw biomass [29]. Finally, the product profile of the pyrolysis process is also heavily influenced by the presence of ash, which contains incombustible minerals and metals. In general, a higher ash content decreases the bio-oil yield and increases the production of biochar and gas [30].
Due to its weak thermal conductivity, biomass presents challenges for heat transfer during pyrolysis. As a result, particle size affects bio-oil yield and plays a crucial role in reducing heat transfer issues [25]. In fast pyrolysis systems, smaller particle sizes are generally favored due to the fact that smaller particles heat up more uniformly than particles of larger sizes. On the other hand, in the case of larger particles, inadequate heat transfer to the inner surfaces will result in low average particle temperatures, lowering the yield of liquids [28]. Furthermore, in the case of large particles, the distance between the surface of the biomass and its core increases creating a temperature gradient, which in turn provides more charcoal formation [27].

3. Materials and Methods

3.1. Database

The database used in this study was built by gathering information from publications from major online sources (like ACS, RSC, Elsevier, and Wiley) highlighting the slow pyrolysis process employed on a variety of biomass types. Initially, hundreds of publications were collected; however, some of the papers were eliminated due to missing values, unreported experimental details, or certain unique experimental conditions that are unlikely to be replicated by other researchers. Furthermore, it was our intention to concentrate on papers published in the last 20 years in order to capture the recent trends in the field. As a result, 324 pyrolysis process cases were extracted from the experimental results reported in 37 different articles (additional details related to these articles are given in the Appendix A section). The types of variables were classified under proximate analysis of the biomass (moisture, volatile matter, fixed carbon, and ash contents), ultimate analysis of the biomass (C, H, O, and N percentages) and operational variables (minimum and maximum particle sizes and pyrolysis temperature). Finally, biochar, bio-oil, and biogas yield percentages were taken as target variables. The ranges of descriptor and target variables are summarized in Table 1.

3.2. Computational Details

In this study, three different machine learning methodologies under the Python programming environment (version 3.9.13) were employed to address three distinct tasks as shown through the framework in Figure 1. First, an explainable machine learning approach, the SHAP (Shapley Additive exPlanations) method, which was developed by Nobel Prize-winning economist Lloyd Shapley, was utilized to investigate the effects of features on the target variable [31]. For this purpose, the XGBoost regressor model was trained on the dataset, and SHAP bee-swarm plots were plotted to determine the most impactful variables.
Next, decision tree classification models were built with SKLearn and visualized with Graphviz library under Python to determine the pathways leading to high values of the target variables. The median value of biofuel yields was established as the margin between high and low yields (yields greater than the median correspond to high yields). The criterion parameter in a decision tree classifier determines the function with which the quality of a split is measured, and the Gini Index (also known as the Gini impurity) was chosen for this purpose. The Gini Index measures the likelihood of misclassifying a randomly selected sample. As a result, a lower Gini Index is preferred because it indicates a lower likelihood of misclassification. When all of the data belongs to a single class, the Gini Index is zero, indicating maximum purity and thus no possibility of misclassification. Equation (1). shows the Gini Index formula, where n is the total number of classes and P is the probability of a sample being classified as a certain class [32].
G i n i   I n d e x = 1 i = 1 n P i 2
Before the construction of the decision trees, the dataset was split randomly into training and test sets with an 80:20 ratio. The training set was used to construct the decision trees, and 5-fold cross-validation was employed during training for hyperparameter tuning and pruning of the trees. The test set was kept separate until the end, and it was used to determine the generalization accuracy of the tree over the data not seen before. Classification reports show the main classification metrics for each class. These metrics and their brief definitions are as follows:
  • Precision is a metric showing what percent of samples were classified correctly.
  • Recall is a parameter measuring the ability of a classifier model to identify all samples of a certain class. It shows what percentage of samples belonging to a certain class were classified correctly.
  • The f1 score is the weighted harmonic mean of precision and recall. The maximum value for an f1 score is 1, and the minimum is 0.
  • Support is the actual number of samples belonging to a certain class in the given dataset.
Finally, association rule mining models were built on the dataset to find the relation between variables leading to very high yields of targets. Association rule mining can work on categorical or binary type descriptors and target variables. Accordingly, first, the descriptor variables were discretized into distinct ranges. Then, the target variables were divided into quartiles, with the first quartile (the lower 25% of the samples) representing very low yield and the fourth quartile (the upper 25% of the samples) representing very high yield. The “apriori algorithm” with “association rules” was applied, and PyCaret library under Python was used to visualize the results.
The primary outcomes of association rule mining are support, confidence, and lift [33,34]. Support is a metric that indicates the frequency or incidence of an item set in a dataset, while confidence is a measure of how frequently a rule holds true in data. On the other hand, lift corresponds to the type of relation among variables and ranges between 0 and infinity. Lift values are interpreted based on their distance from “1”, where a negative distance indicates a negative relationship and a positive distance indicates a positive relationship, with higher values having a greater impact.

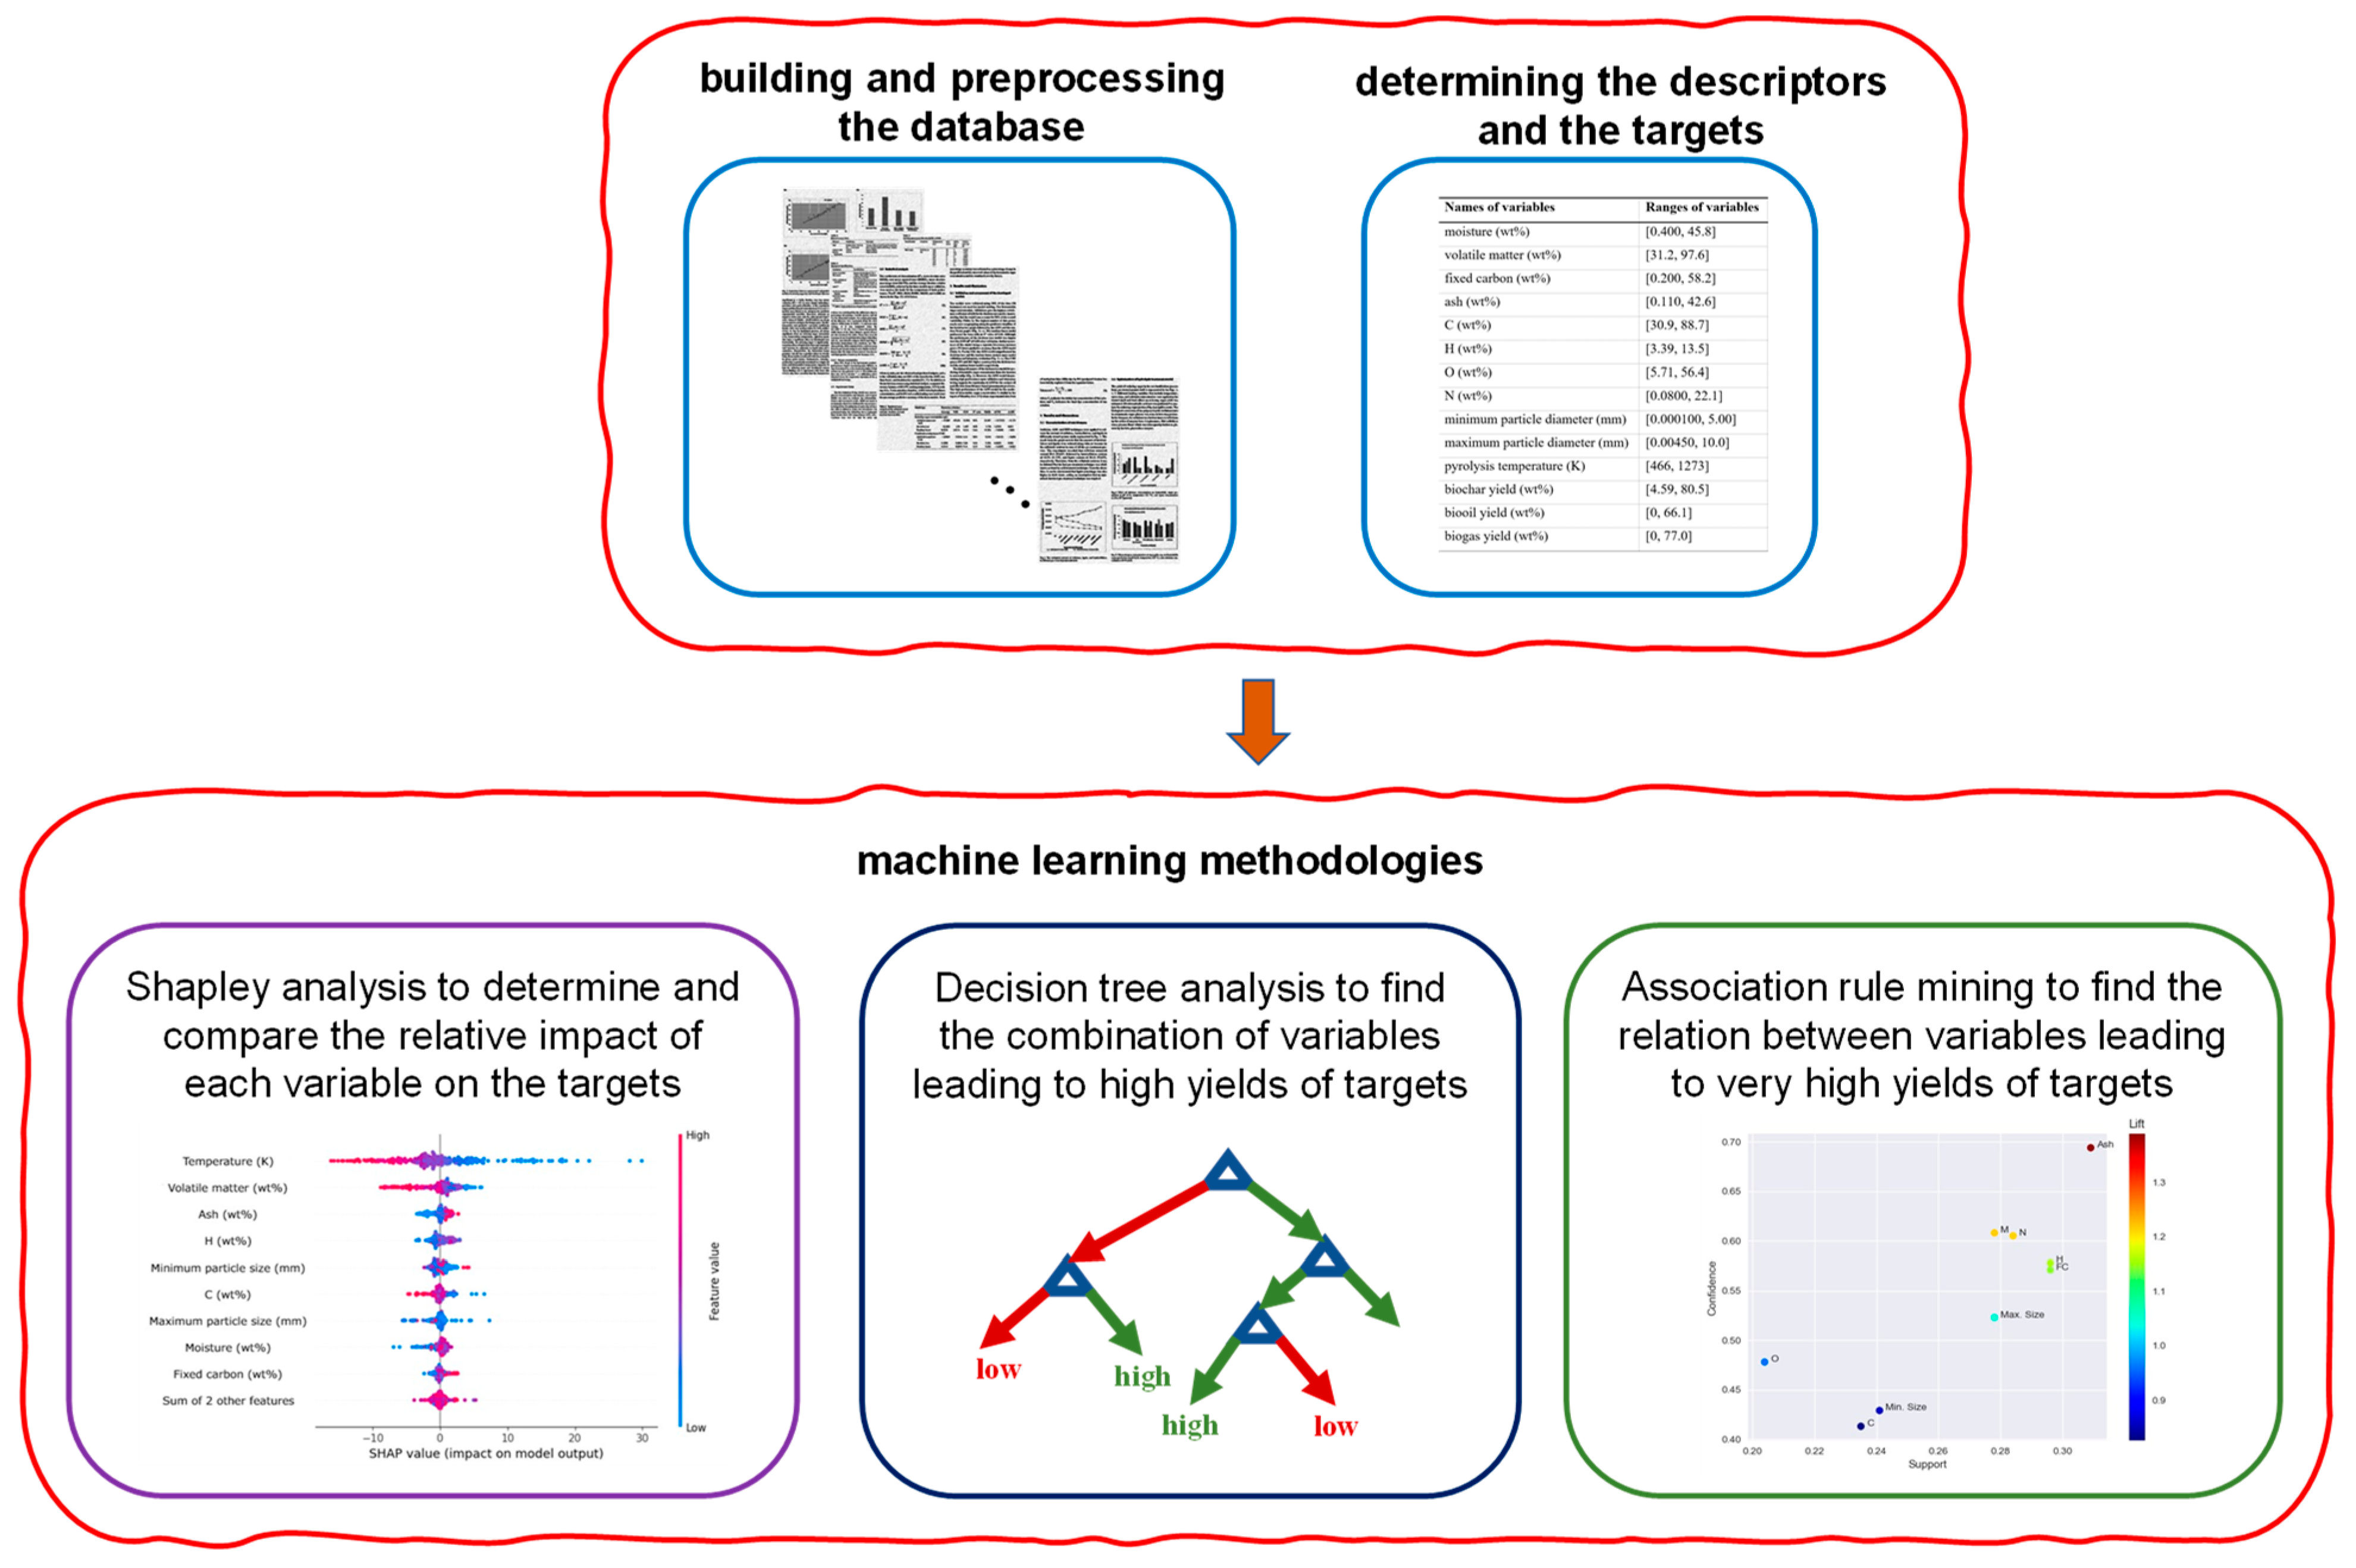
4. Results and Discussion
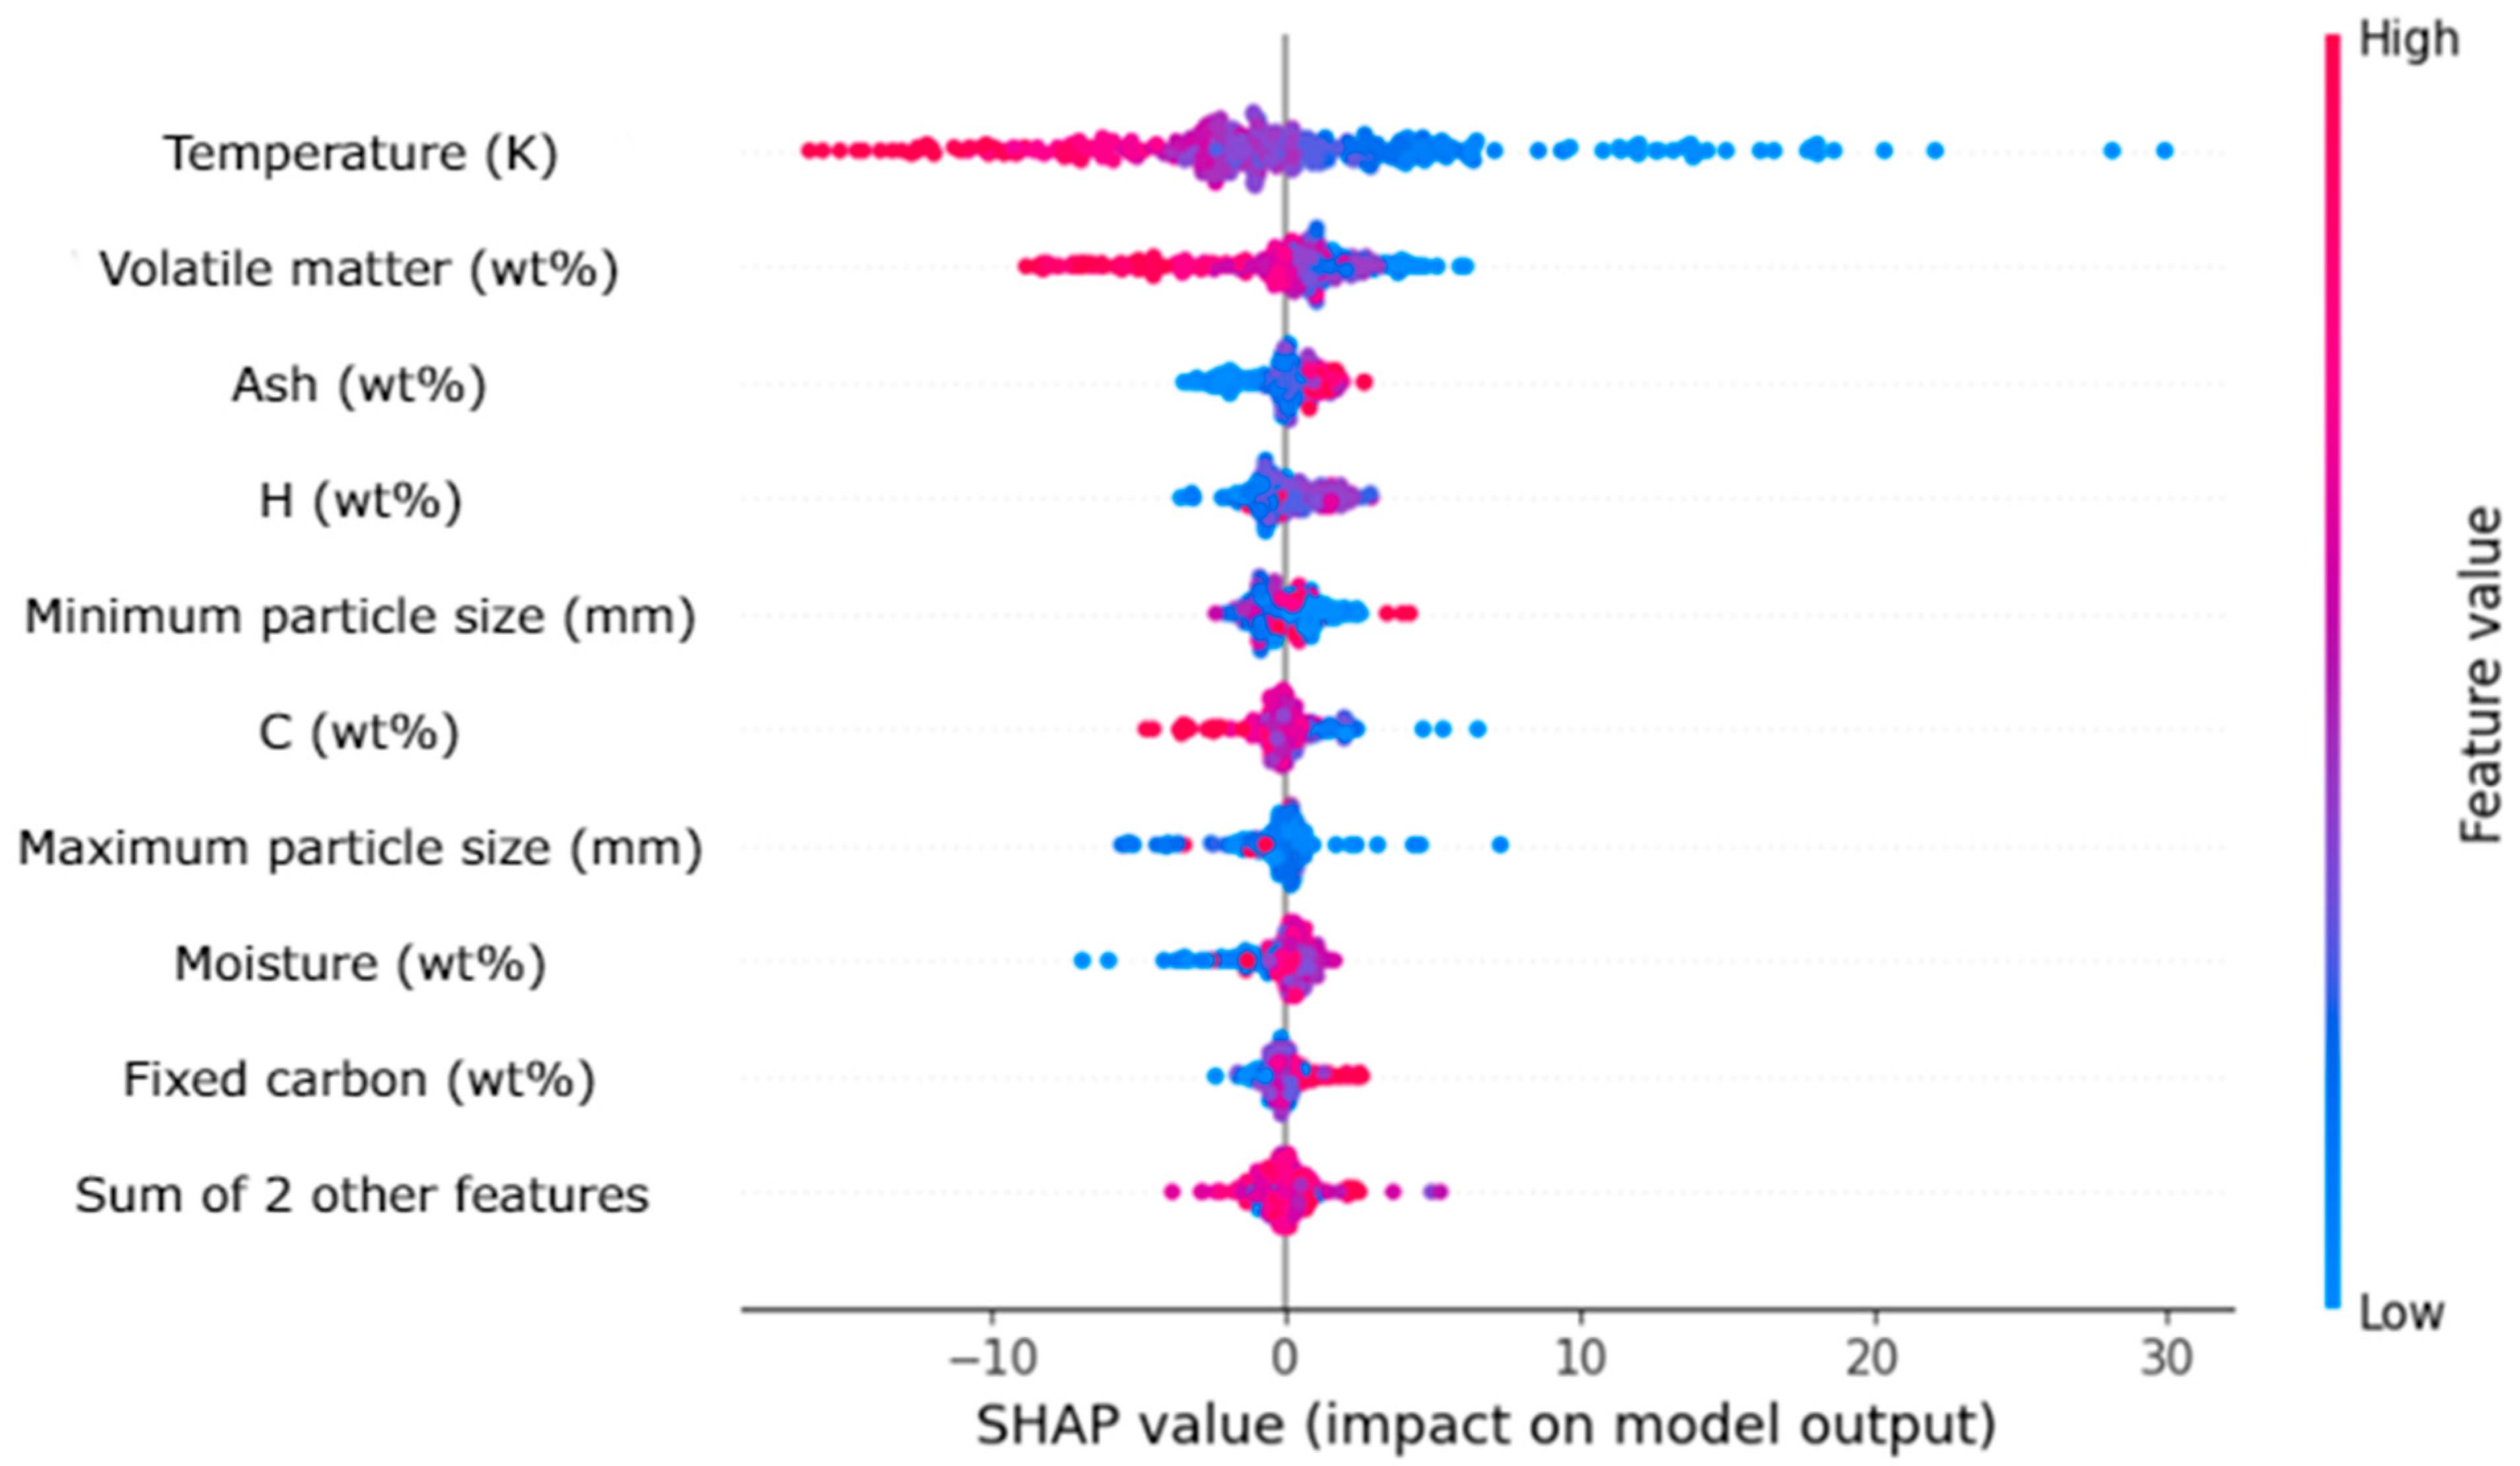
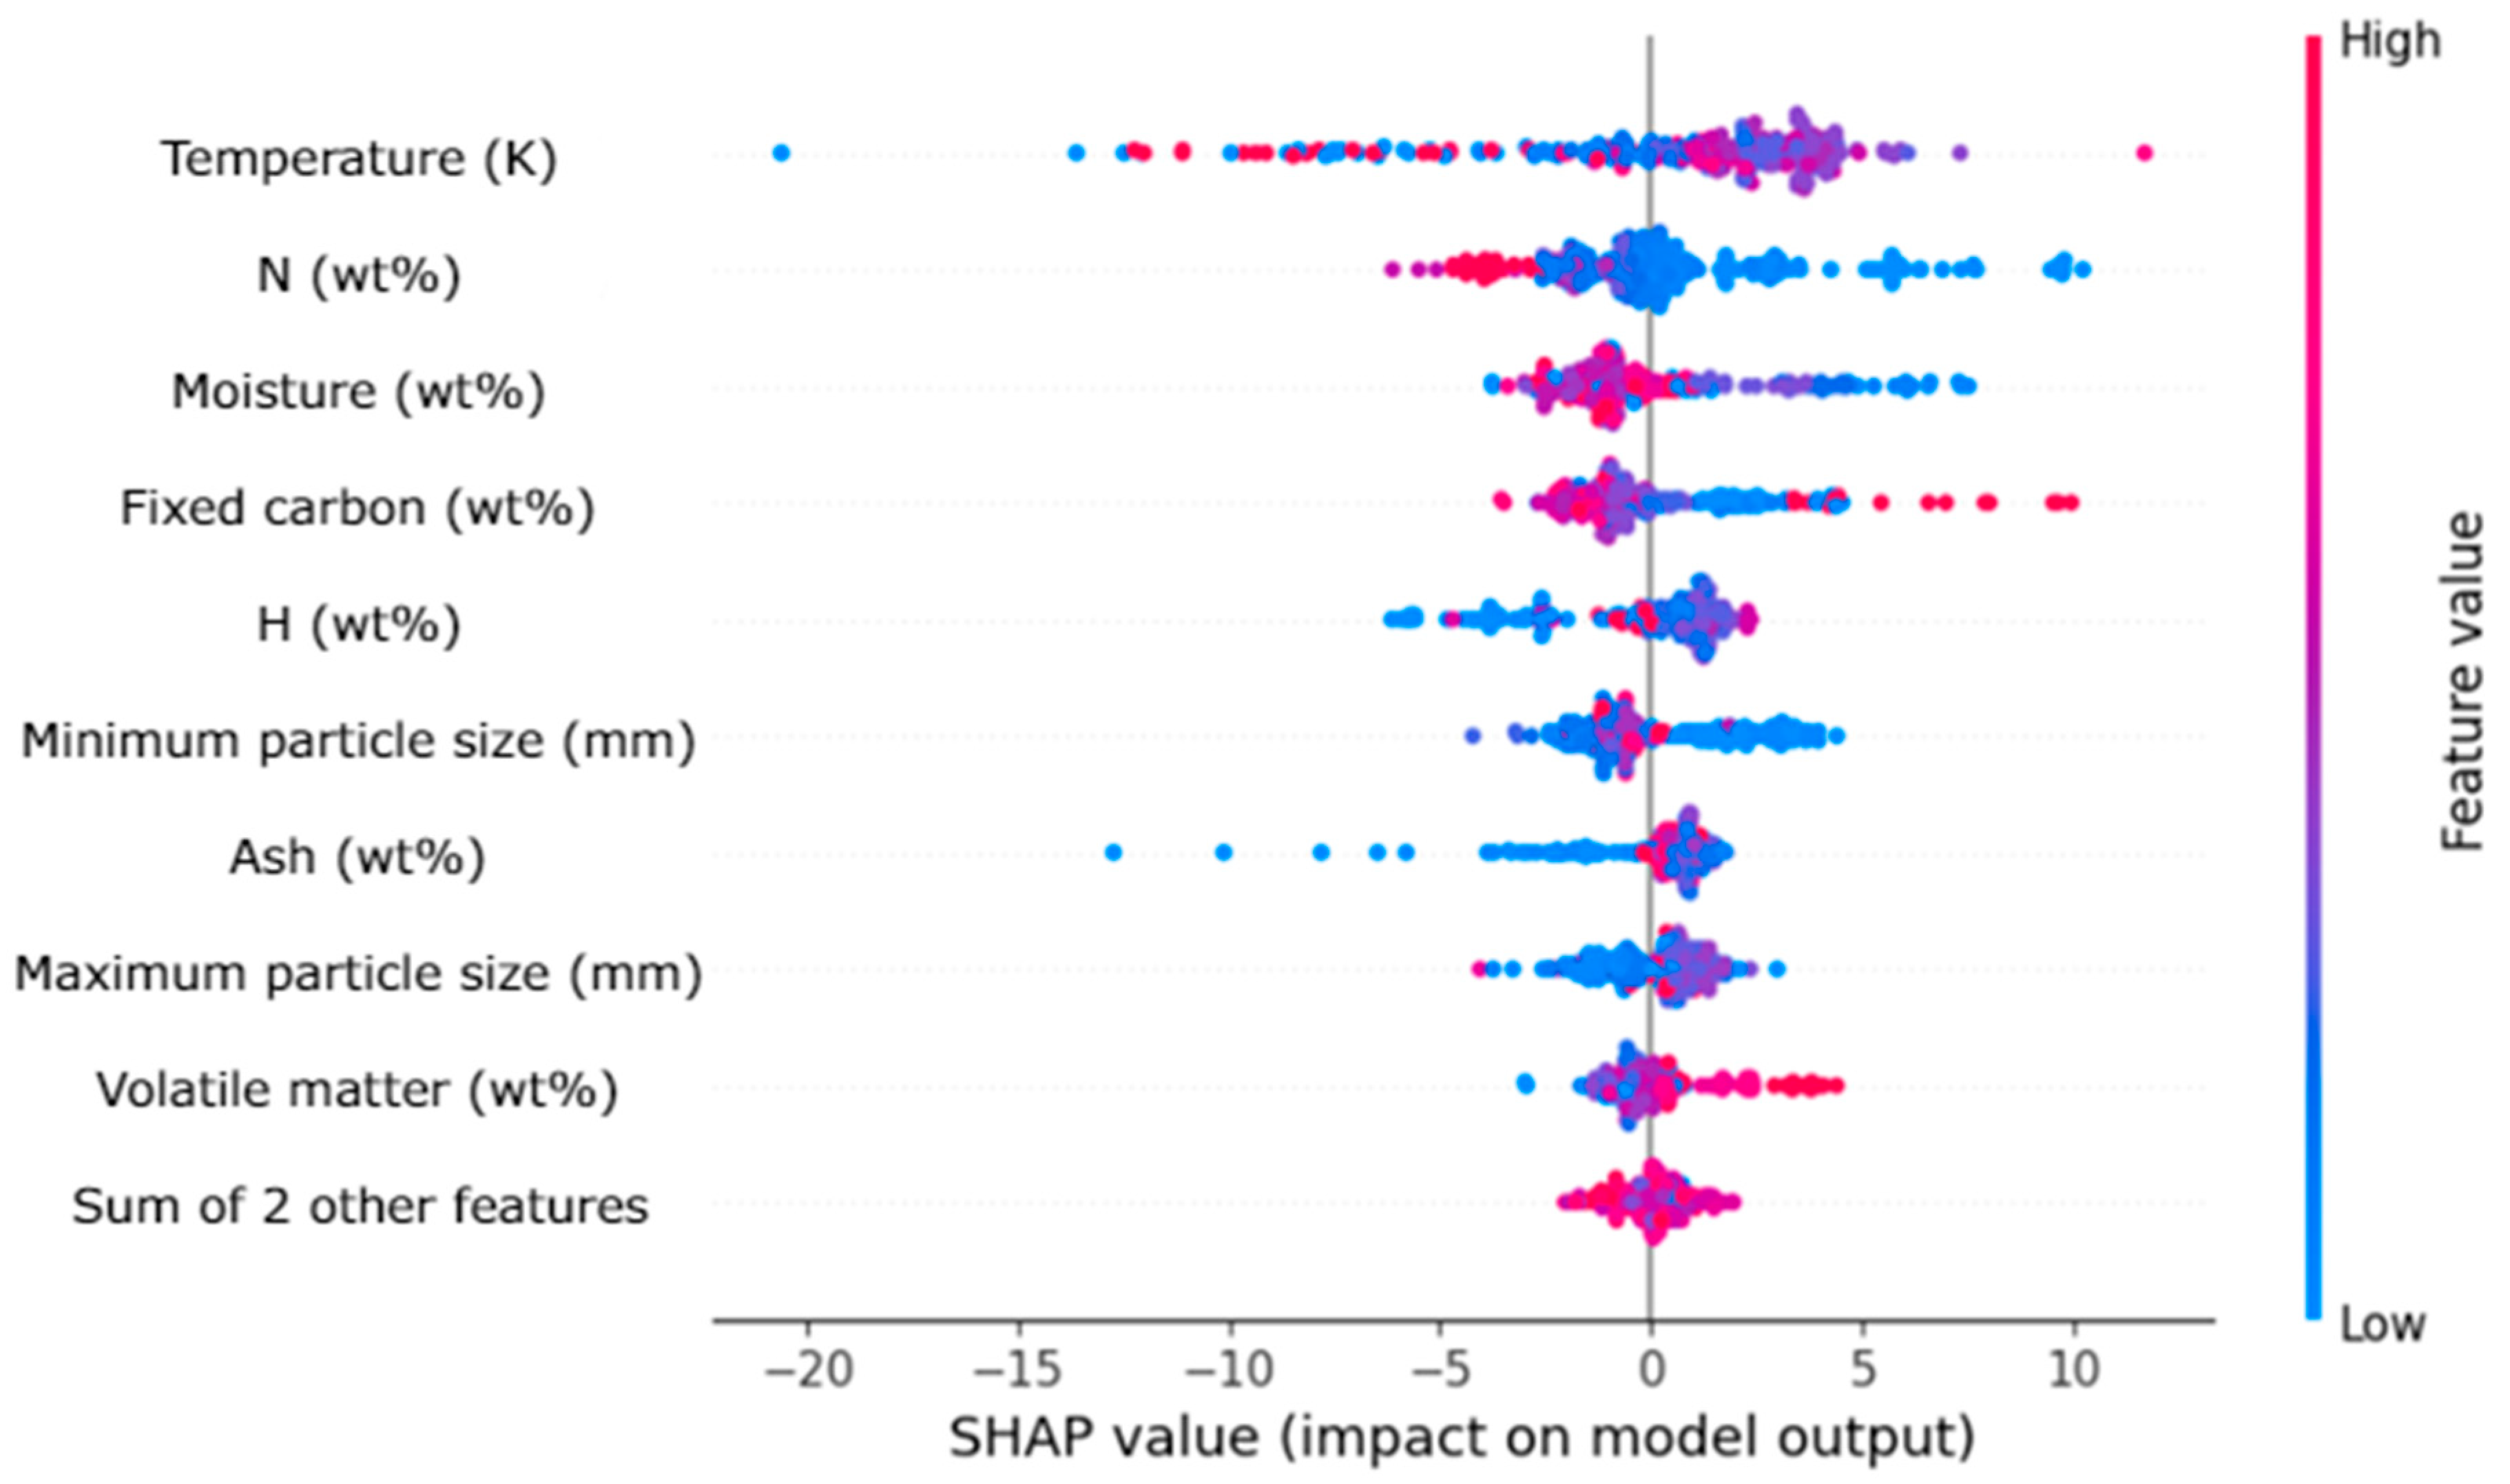
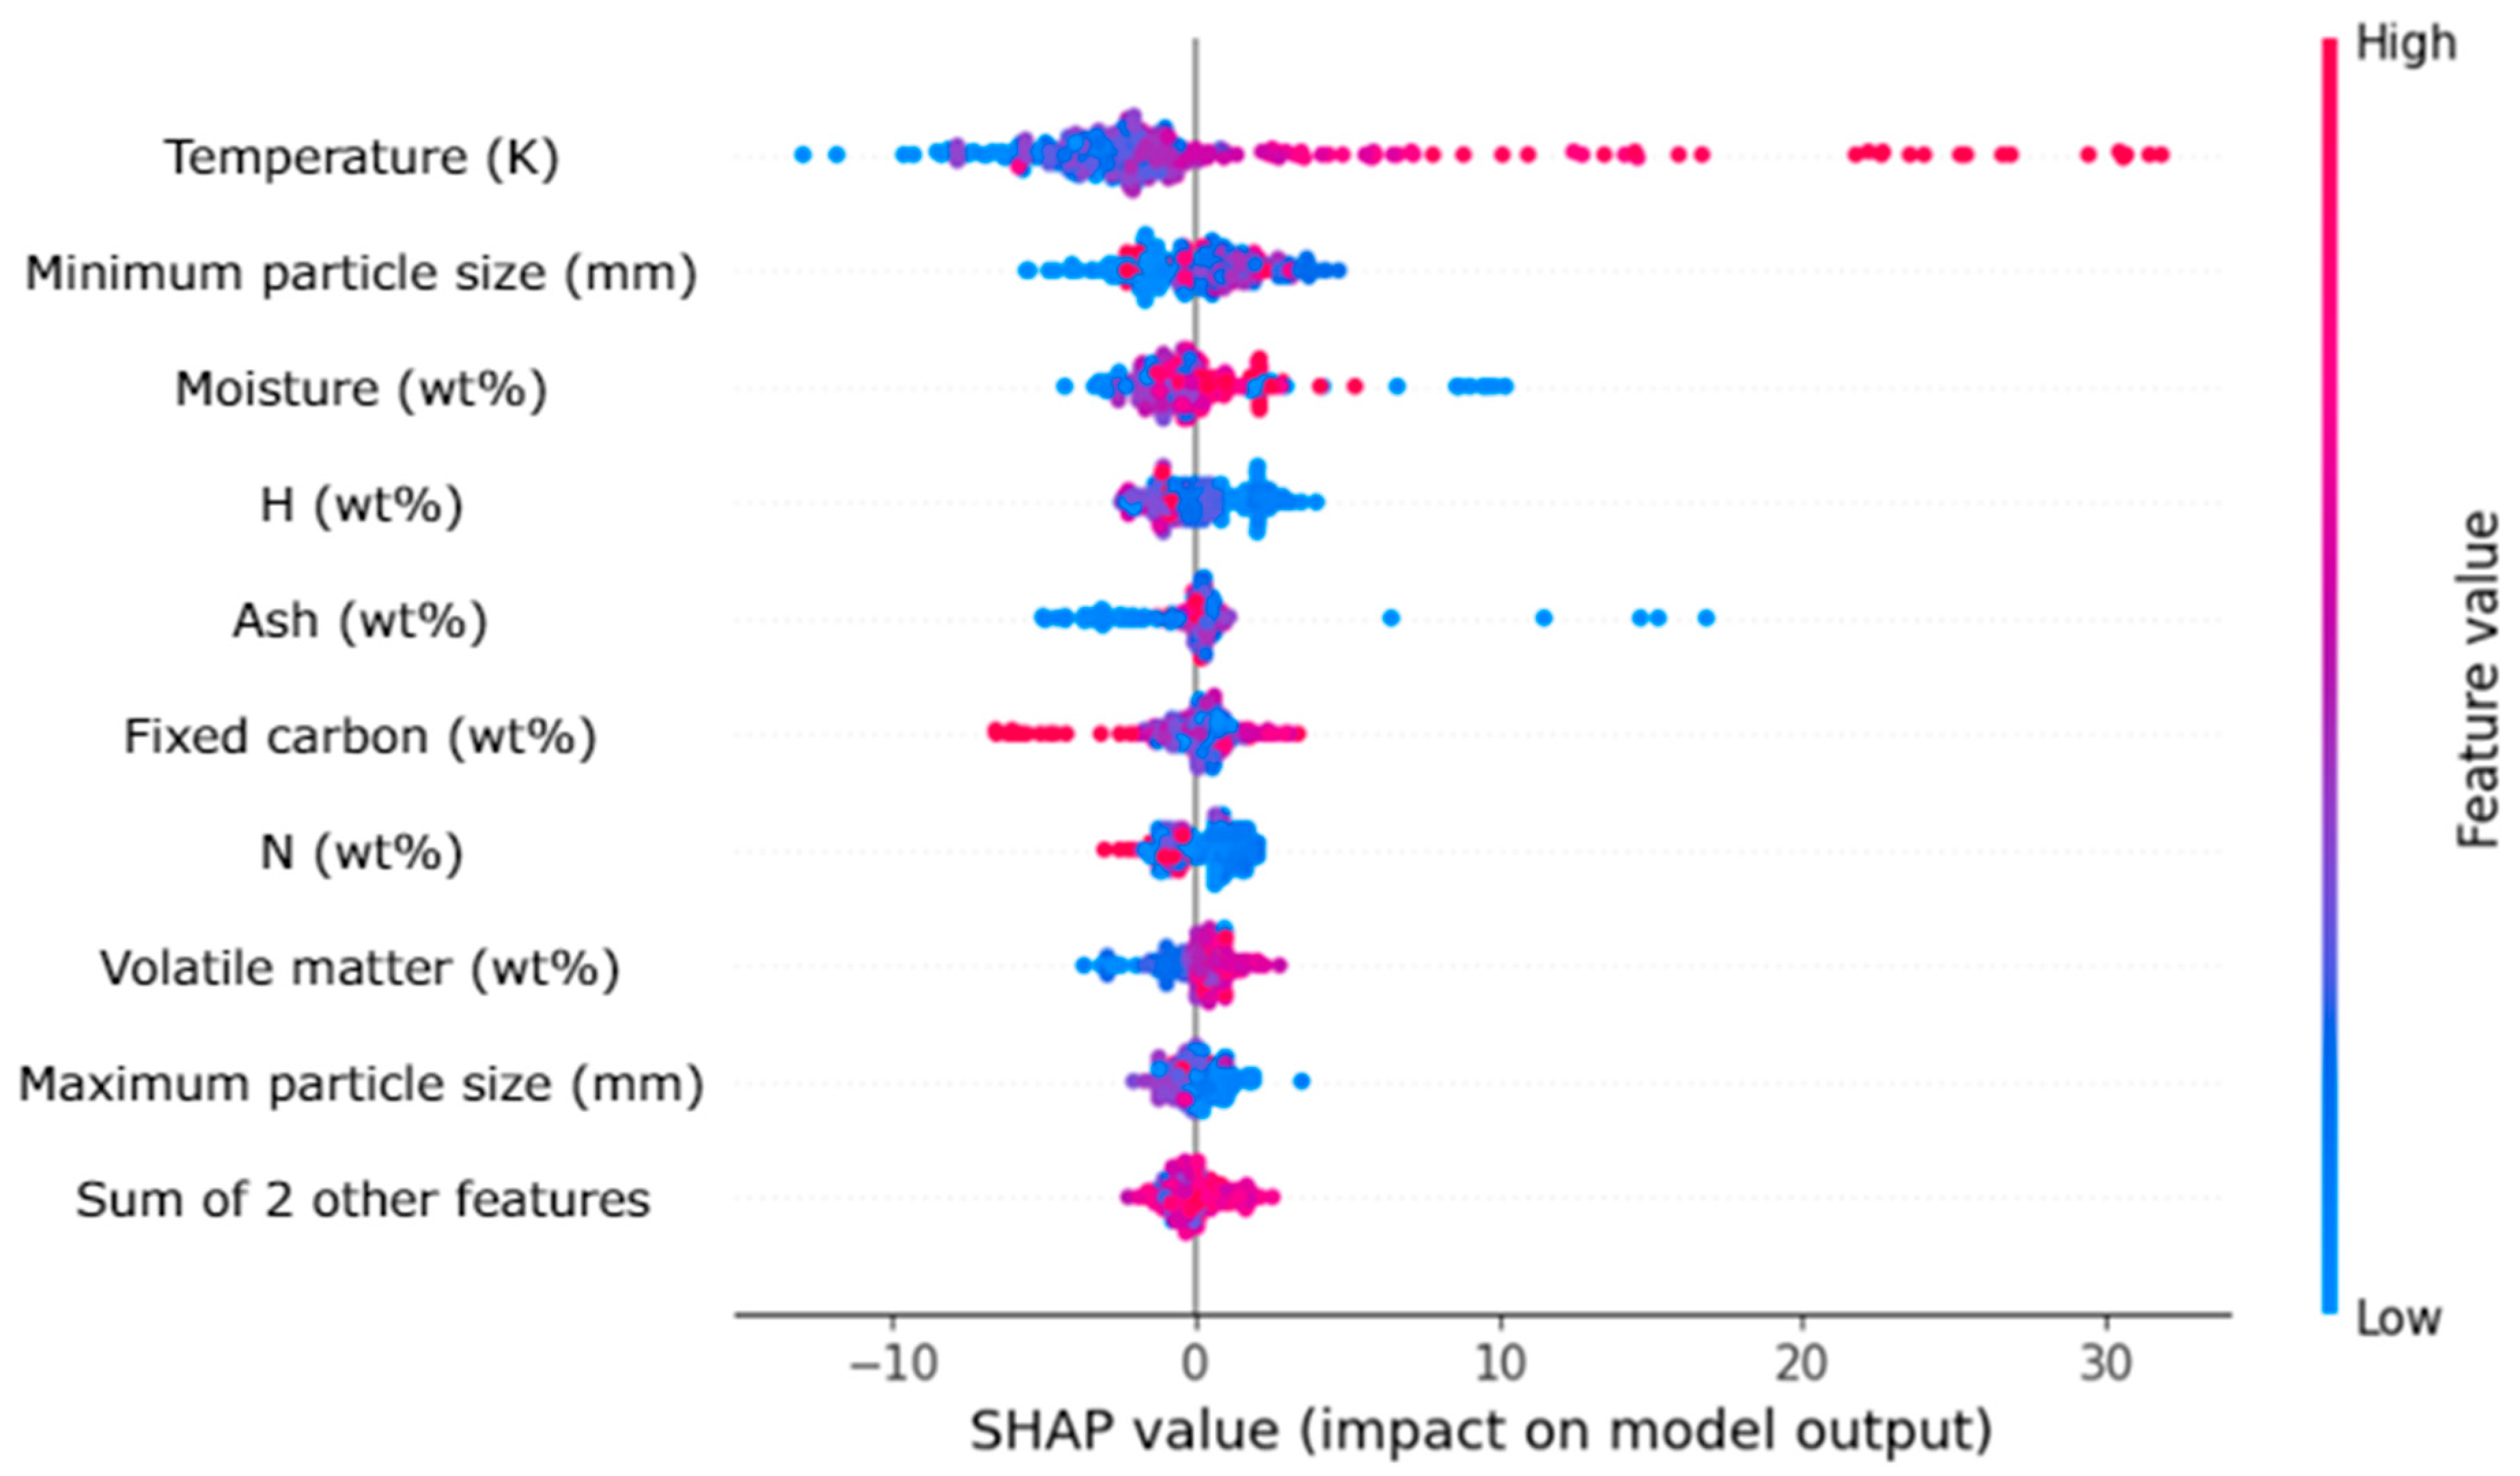
As described in Section 3.2, three different machine learning approaches are employed. First, the results of the SHAP analysis are shown, and the effects of descriptors on the targets are discussed. Then, decision tree classification is applied to discover the variables leading to high levels of the targets. Finally, to enhance the decision tree results even further, association rule mining models are developed to identify the ranges of variables that are associated with very high levels of yield.

4.1. SHAP Analysis

SHAP bee-swarm plots are created to determine the impact of descriptor variables on biochar, bio-oil, and biogas yields separately. In a bee-swarm plot, the variables are ordered from top to bottom by their mean absolute SHAP values. The mean absolute SHAP value of a variable indicates the magnitude of the impact of that variable on the target (with the same unit as the target). It should be noted that a higher mean absolute SHAP value indicates a greater influence on the target. In addition, in bee-swarm plots, each dot in a variable row represents a data entry and is colored according to the actual value of the variable that corresponds to that entry. For instance, a dot appears with different shades of red if the actual value is high, while dots appear with different shades of blue if the value is low.
The SHAP analysis for biochar yield is shown in Figure 2, in which temperature is located on the topmost row, meaning that it has the greatest impact on the biochar yield compared to the other variables. The color of the dots on the temperature row implies that higher biochar yields can be obtained at lower temperatures. This phenomenon was also observed in previous studies; for instance, Selvarajoo and Oochit observed a decrease in biochar yield with increasing temperature and stated that it was caused by the rapid decomposition of lignocellulosic components at higher temperatures [35]. Figure 2 also indicates that temperature is followed by volatile matter and ash content, and low volatile matter and high ash content are favorable for higher levels of biochar production. The inverse relationship between volatile matter content and biochar yield can be explained by the loss of mass caused by the release of volatile matter during the pyrolysis process. Since biomass with higher volatile matter content releases more volatile gases and therefore loses more mass, the resulting biochar yield is less. On the other hand, the positive impact of high ash content on biochar yield may be associated with secondary pyrolysis reactions. These reactions produce biochar along with tar and gases and require ash to occur [36].
Next, for the SHAP bee-swarm plot created for bio-oil yield, the top three variables are temperature, nitrogen content, and moisture content (Figure 3). Although temperature is the most important variable, the relation between temperature and bio-oil yield is not completely decisive. In other words, there are data entries with high temperatures and low bio-oil yield or vice versa. Nevertheless, it still seems that most of the data entries with high temperatures accumulate over a high bio-oil yield. In general, bio-oil yield increases with increasing pyrolysis temperatures as weak chemical bonds in the biomass break down at higher temperatures, as proven experimentally by Sakhiya et al. [37]. By contrast, both nitrogen and moisture content appear to have an inverse relationship with bio-oil yield.
Finally, temperature, minimum particle size, and moisture content are the most impactful variables for biogas production using slow pyrolysis, as indicated by the SHAP analysis for biogas yield (Figure 4). The analysis suggests that all these variables have a positive relationship with biogas yields. The increase in biogas yield with increasing temperatures may be associated with the conversion of cellulose, hemicellulose, and lignin into gases, as speculated by Shafiq et al. [38] Also, there is an ideal particle size range that maximizes the biogas yield, as minimum particle size has a positive relationship with biogas yields, while maximum particle size has an inverse relationship with them.

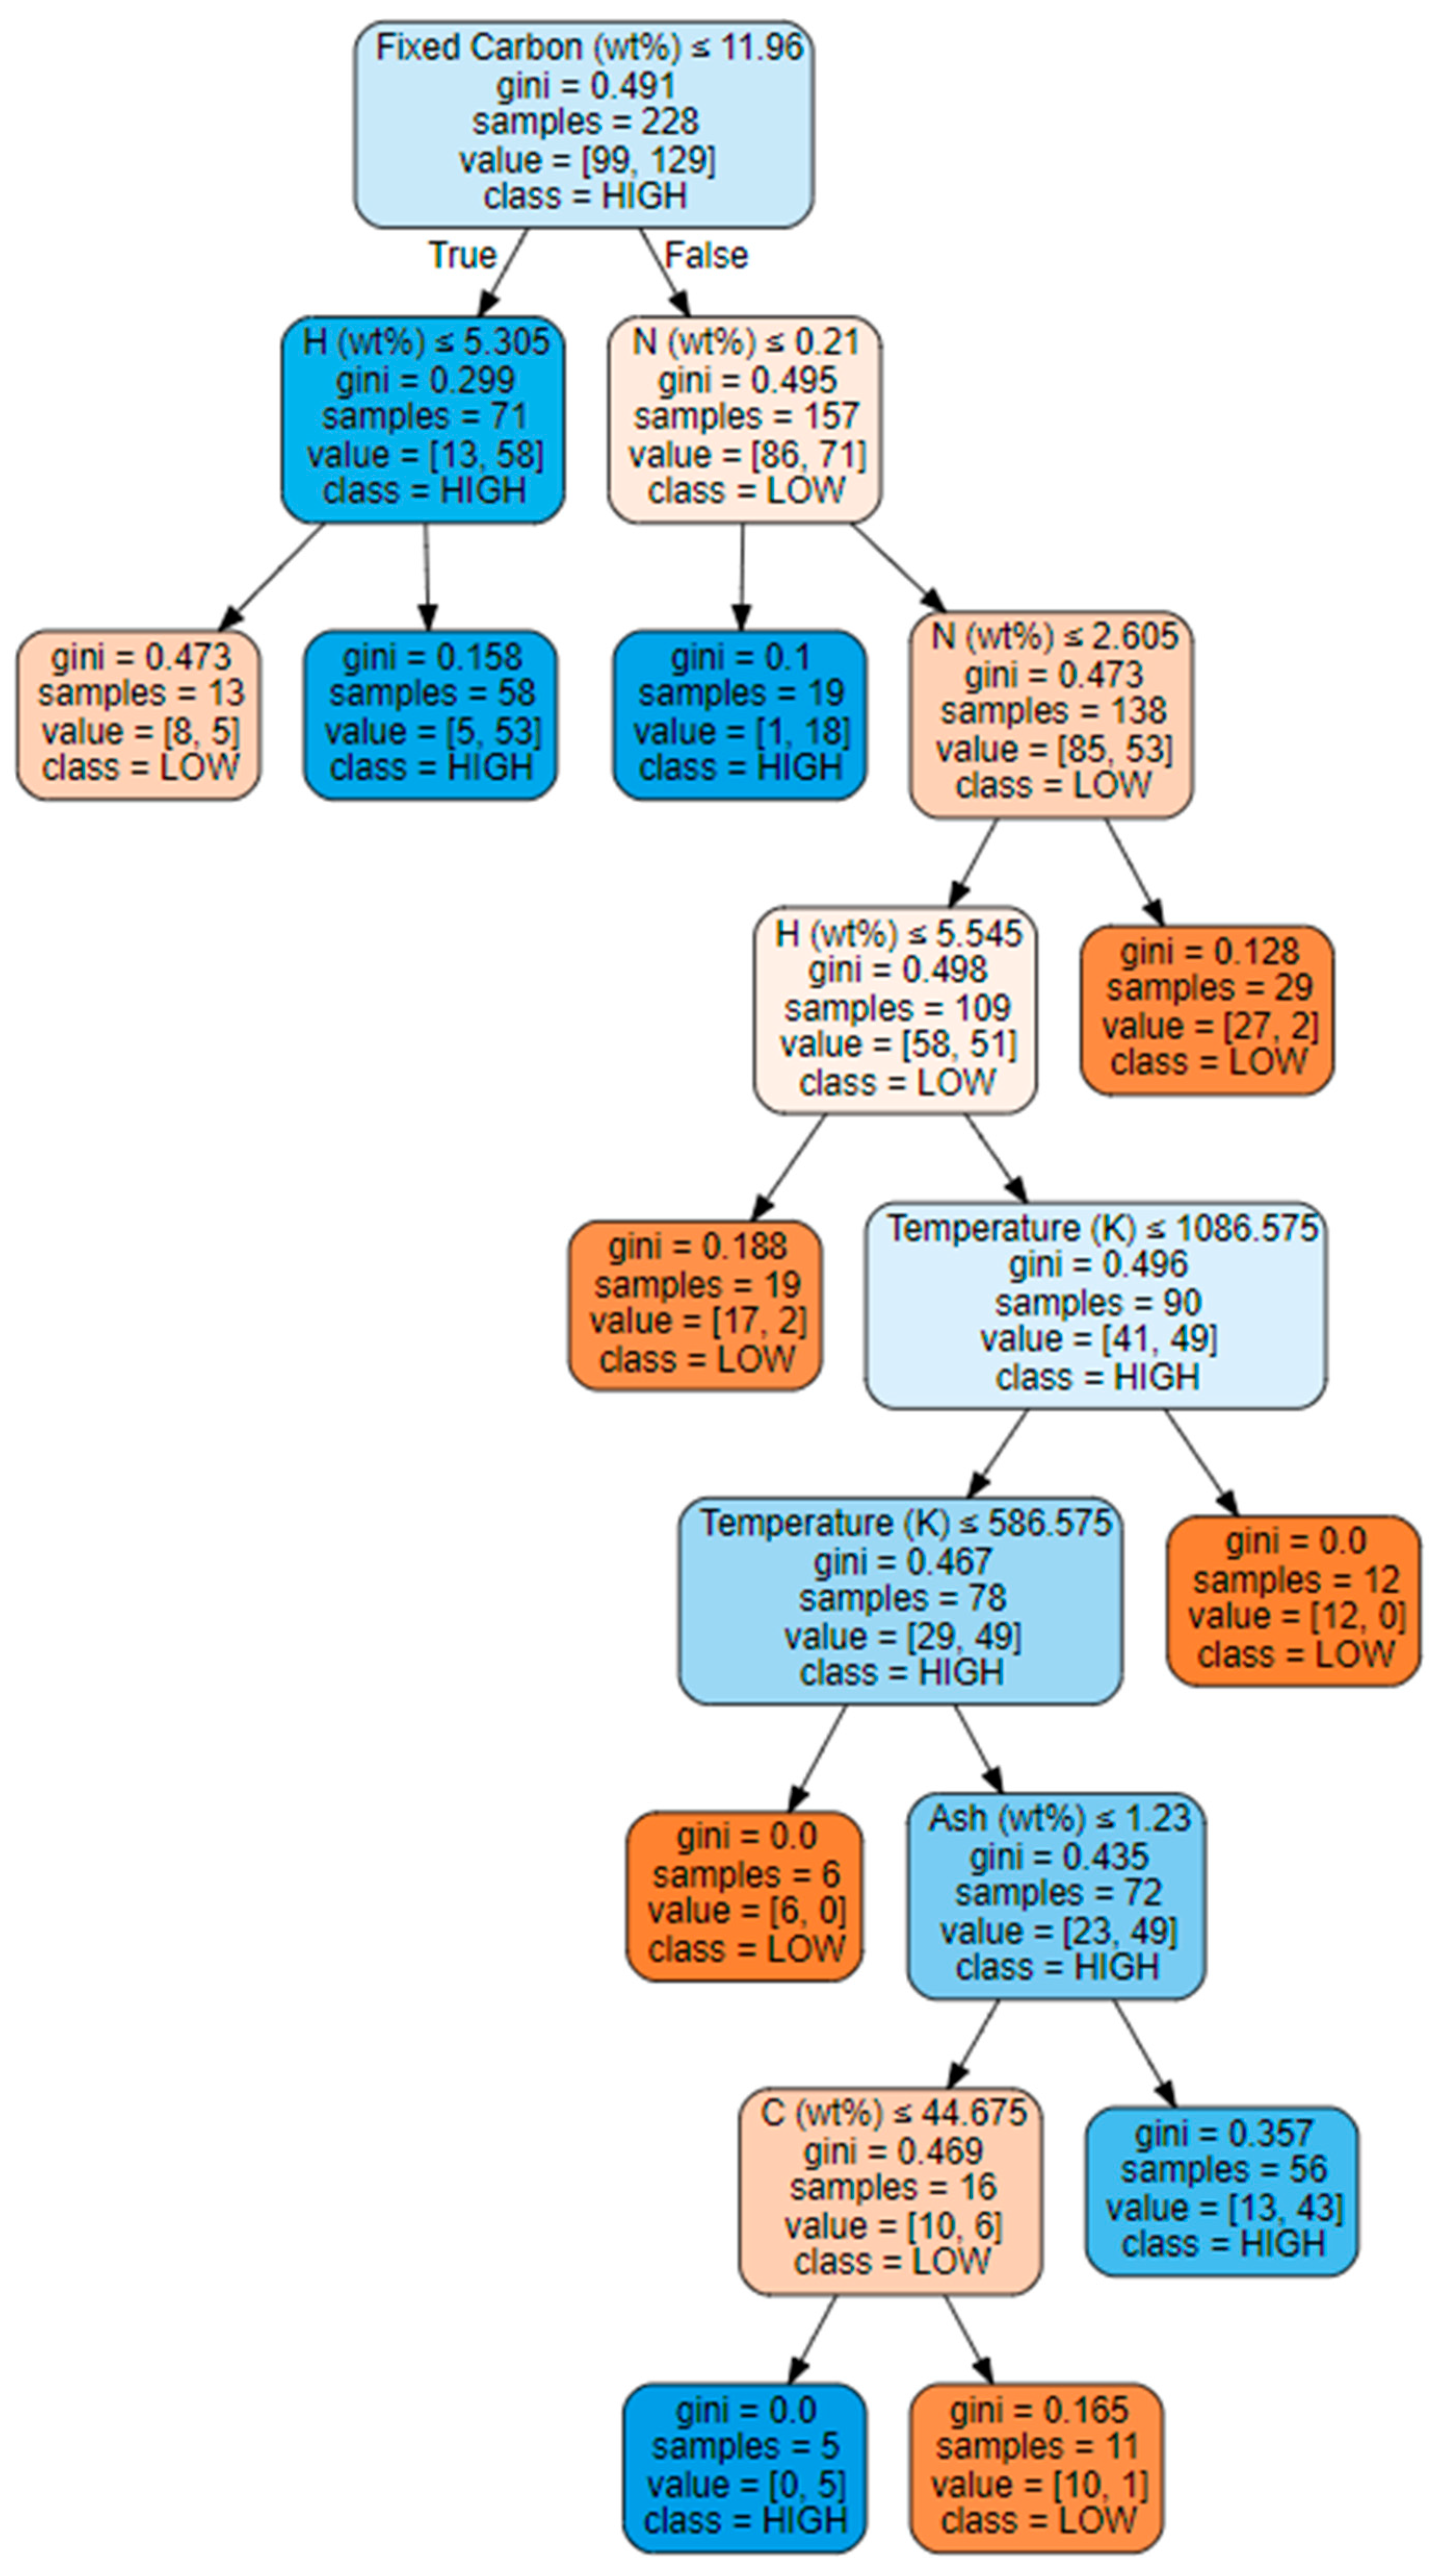
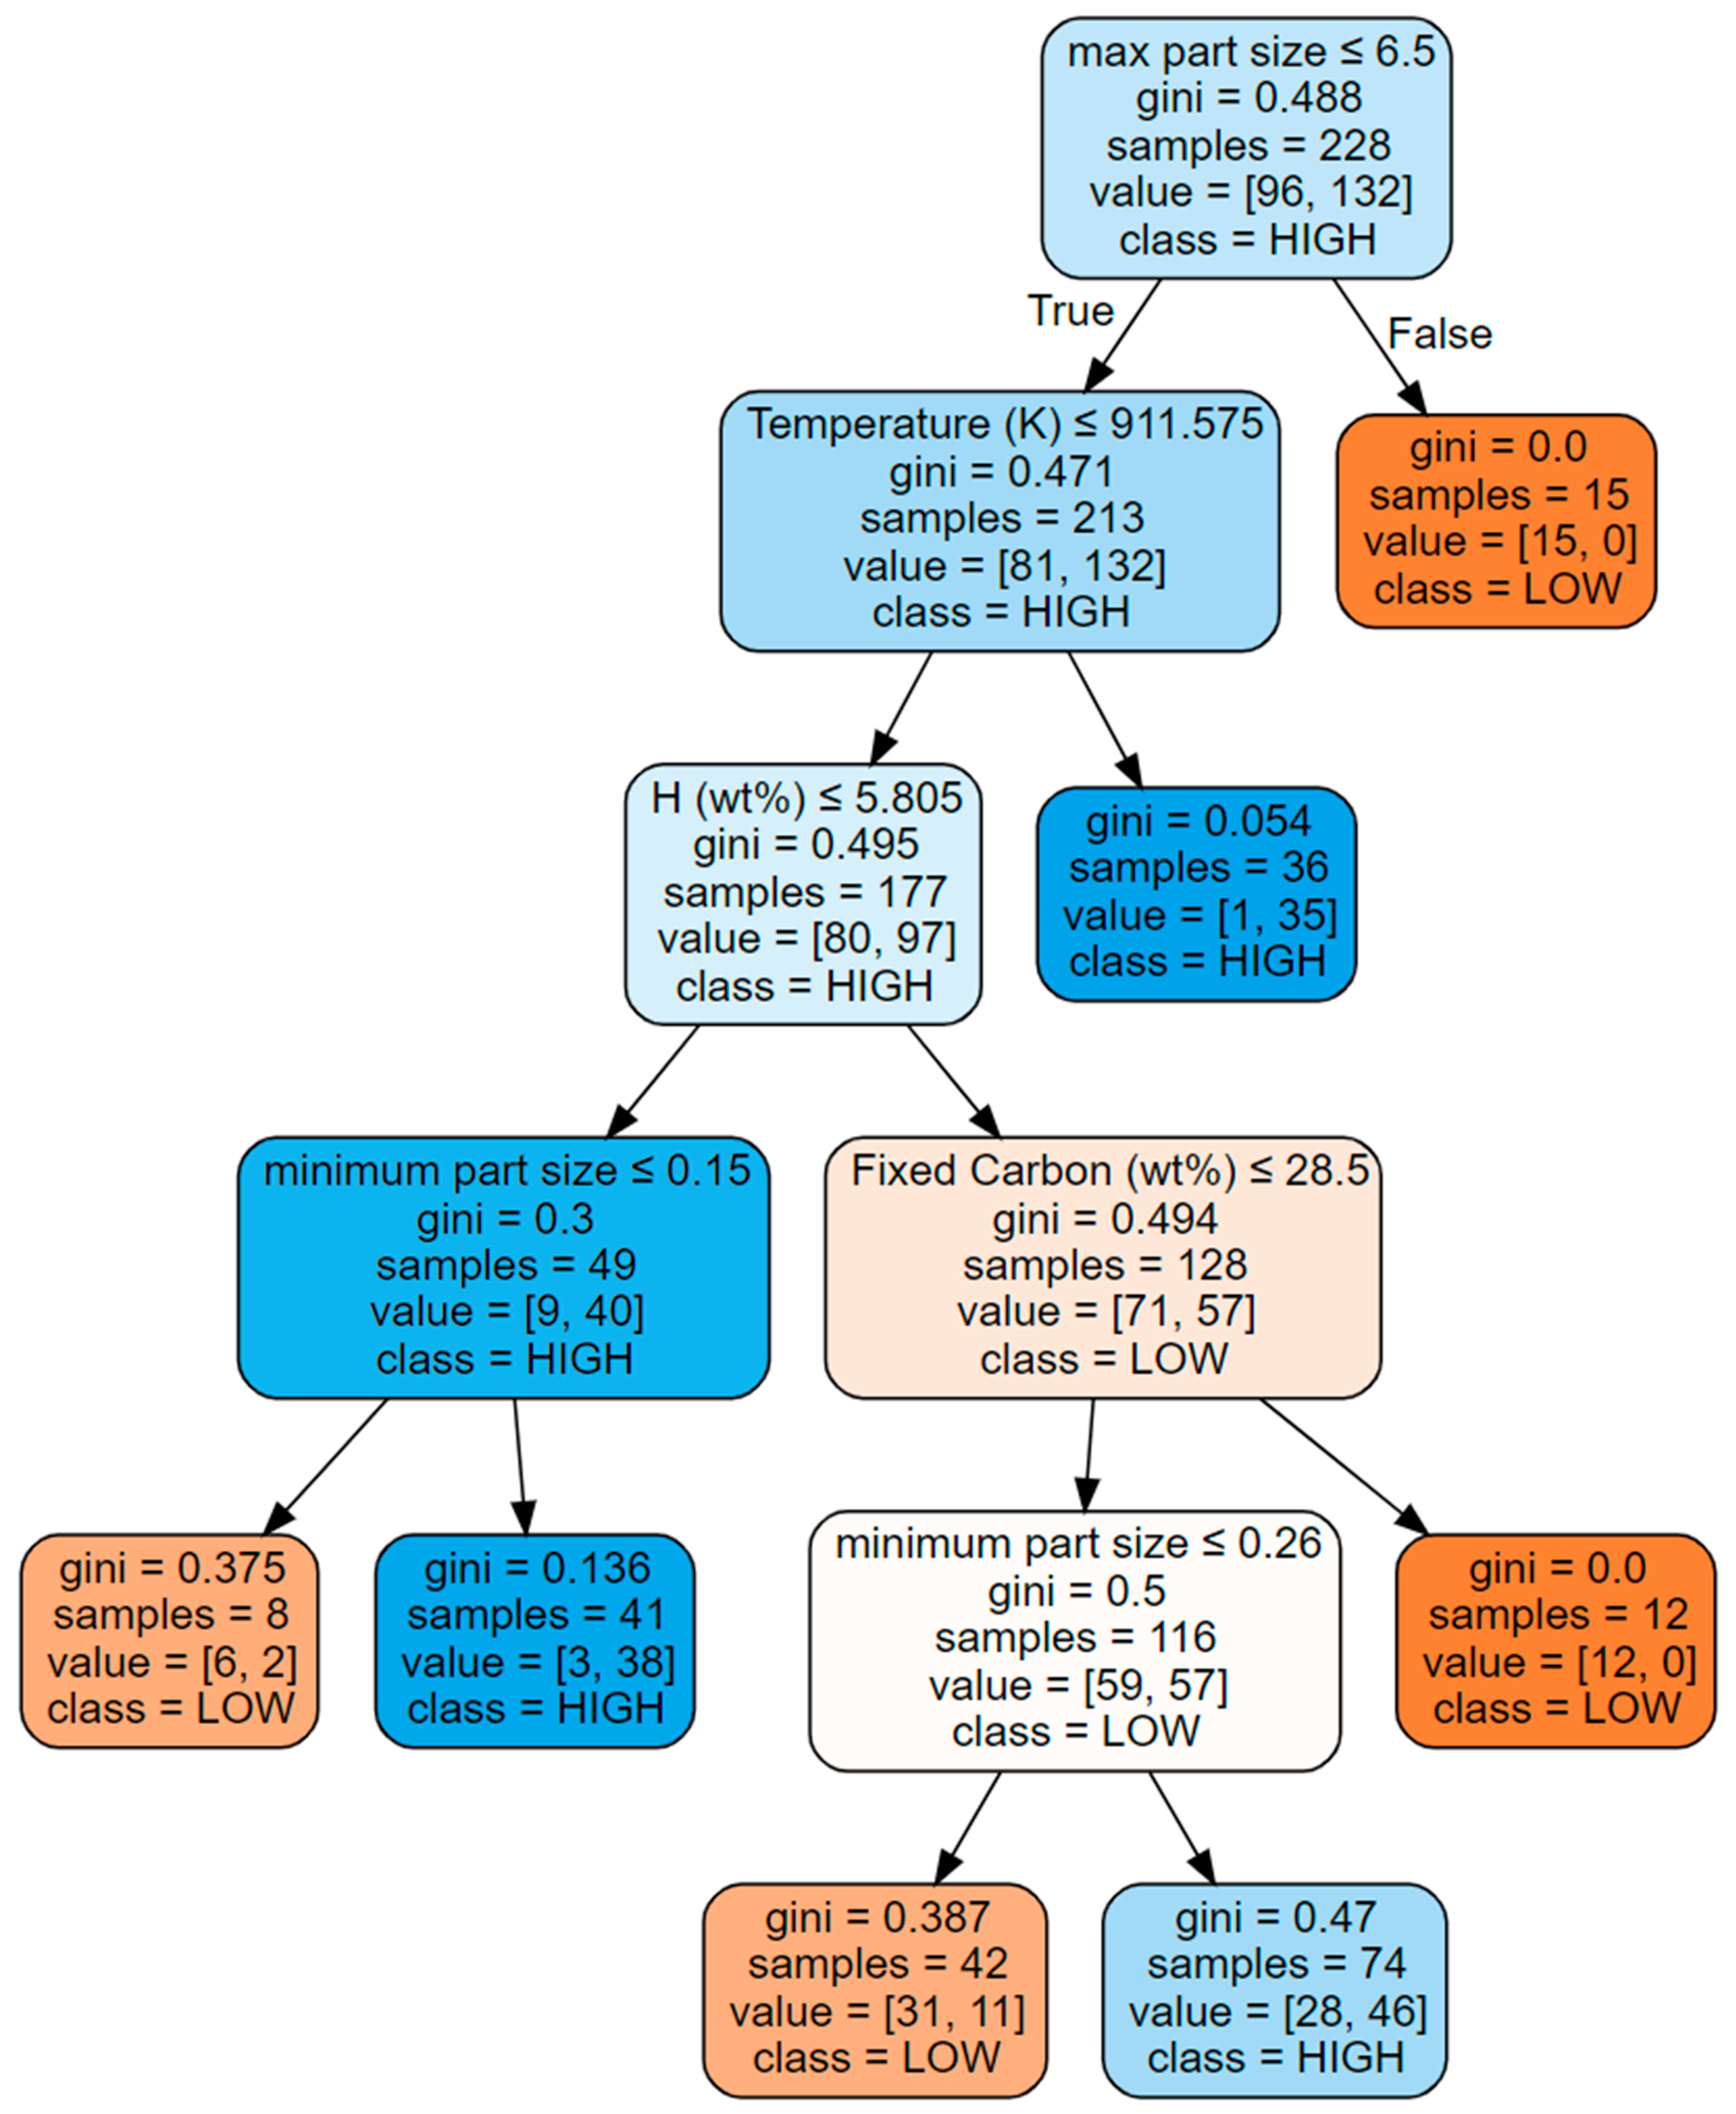
4.2. Decision Tree Classification

Before starting this part of the analysis, it should be noted that variables at each node of a decision tree are determined depending on how purely they split the data. Since the root node represents the entire dataset, the variable at the root node is the variable that splits the entire data most purely. Hence, based on the model developed for biochar yield (Figure 5), temperature is the variable that divides the entire dataset most precisely. Three pathways leading to high biochar yield are observed on the decision tree. Among them, it is possible to obtain high biochar yield with a pyrolysis temperature below 752.6 K for biomass including less than 84.2% volatile matter with a very high accuracy (Gini Index = 0.188) and with a good number of samples (95 samples). Lower pyrolysis temperature leading to high biochar yield is an expected result considering the fact that heavy hydrocarbon components of the biomass are decomposed into liquid and gas products at high temperatures, as discussed elsewhere [27]. On the other hand, in the case of a pyrolysis temperature greater than 752.6 K, it is possible to have a high biochar yield if the carbon content of the biomass is less than 43.7% (Gini Index = 0.320). However, if the carbon content of the biomass is higher than 43.7%, volatile matter should be less than 67.6%, and the pyrolysis temperature should be kept between 752.6 K and 1023.2 K to lead to high biochar yield (Gini Index = 0.386).
The generalization ability of the tree is further checked on the test set, and a confusion matrix is built to show the accuracy of classification (Table 2). The table shows that 33 out of 40 pieces of data with low yield are correctly classified (a recall value of 0.83), while the classification for high yield is even more successful, with 24 out of 25 correct classifications (a recall value of 0.96). On the other hand, the precision values for low yield and high yield are found to be 0.97 and 0.77, respectively. Finally, f1 scores (the harmonic average of the recall and precision values) for low and high yields are found to be 0.89 and 0.86, respectively, indicating a very high degree of generalization accuracy.
The decision tree model developed for bio-oil yield begins with fixed carbon content as the root node (Figure 6). Four pathways leading to high bio-oil yield can be observed on the tree. First, if the fixed carbon content of the biomass is less than or equal to 12.0% and the H content is greater than 5.3%, it is possible to reach a high bio-oil yield with a considerably high accuracy (Gini Index = 0.158). On the other hand, if the fixed carbon content of the biomass is greater than 12.0% and the nitrogen content is less than or equal to 0.21%, it is also possible to reach a high bio-oil yield with even higher accuracy (Gini Index = 0.100). In the case of fixed carbon greater than 12.0% and nitrogen content greater than 0.21%, several other factors (like H wt.%, C wt.%, ash content, and temperature) play a role in the determination of bio-oil yield, and the tree grows further down with these variables.
As in the previous case, the generalization ability of the tree is further verified on the test set. The confusion matrix (Table 3) shows that 17 out of 25 low-yield entries are correctly classified (a recall value of 0.68), while 25 out of 32 high-yield entries are correctly classified (a recall value of 0.78). Although the statistical accuracy of the bio-oil yield is slightly lower than that of the biochar yield, the results are still acceptable given that the decision tree was never exposed to the test set during its construction.
Finally, the optimal decision tree structure for the biogas yield is shown in Figure 7. This time, the tree starts with the maximum particle diameter as the root node. In the case of the maximum particle diameter being greater than 6.5 mm, it is not possible to reach a high biogas yield. On the other hand, if the maximum particle diameter is less than or equal to 6.5 mm and the pyrolysis temperature is greater than 912 K, a high biogas yield can be achieved with a very high accuracy (Gini Index = 0.054). When the pyrolysis temperature is less than 912 K, there are two other paths leading to a high biogas yield, one of which requires the H content of the biomass to be less than or equal to 5.8% and the minimum particle diameter to be less than or equal to 0.15 mm (Gini Index = 0.136). On the other hand, if the H content of the biomass is higher than 5.8%, fixed carbon content and minimum particle diameter play a role in reaching a high biogas yield. However, this path cannot be considered reliable, due to its low accuracy (Gini Index = 0.47). When the confusion matrix of the biogas yield over the test set (Table 4) is examined, it is found that both low and high yields are classified with very good accuracy, having f1 scores of 0.82 and 0.86, respectively.

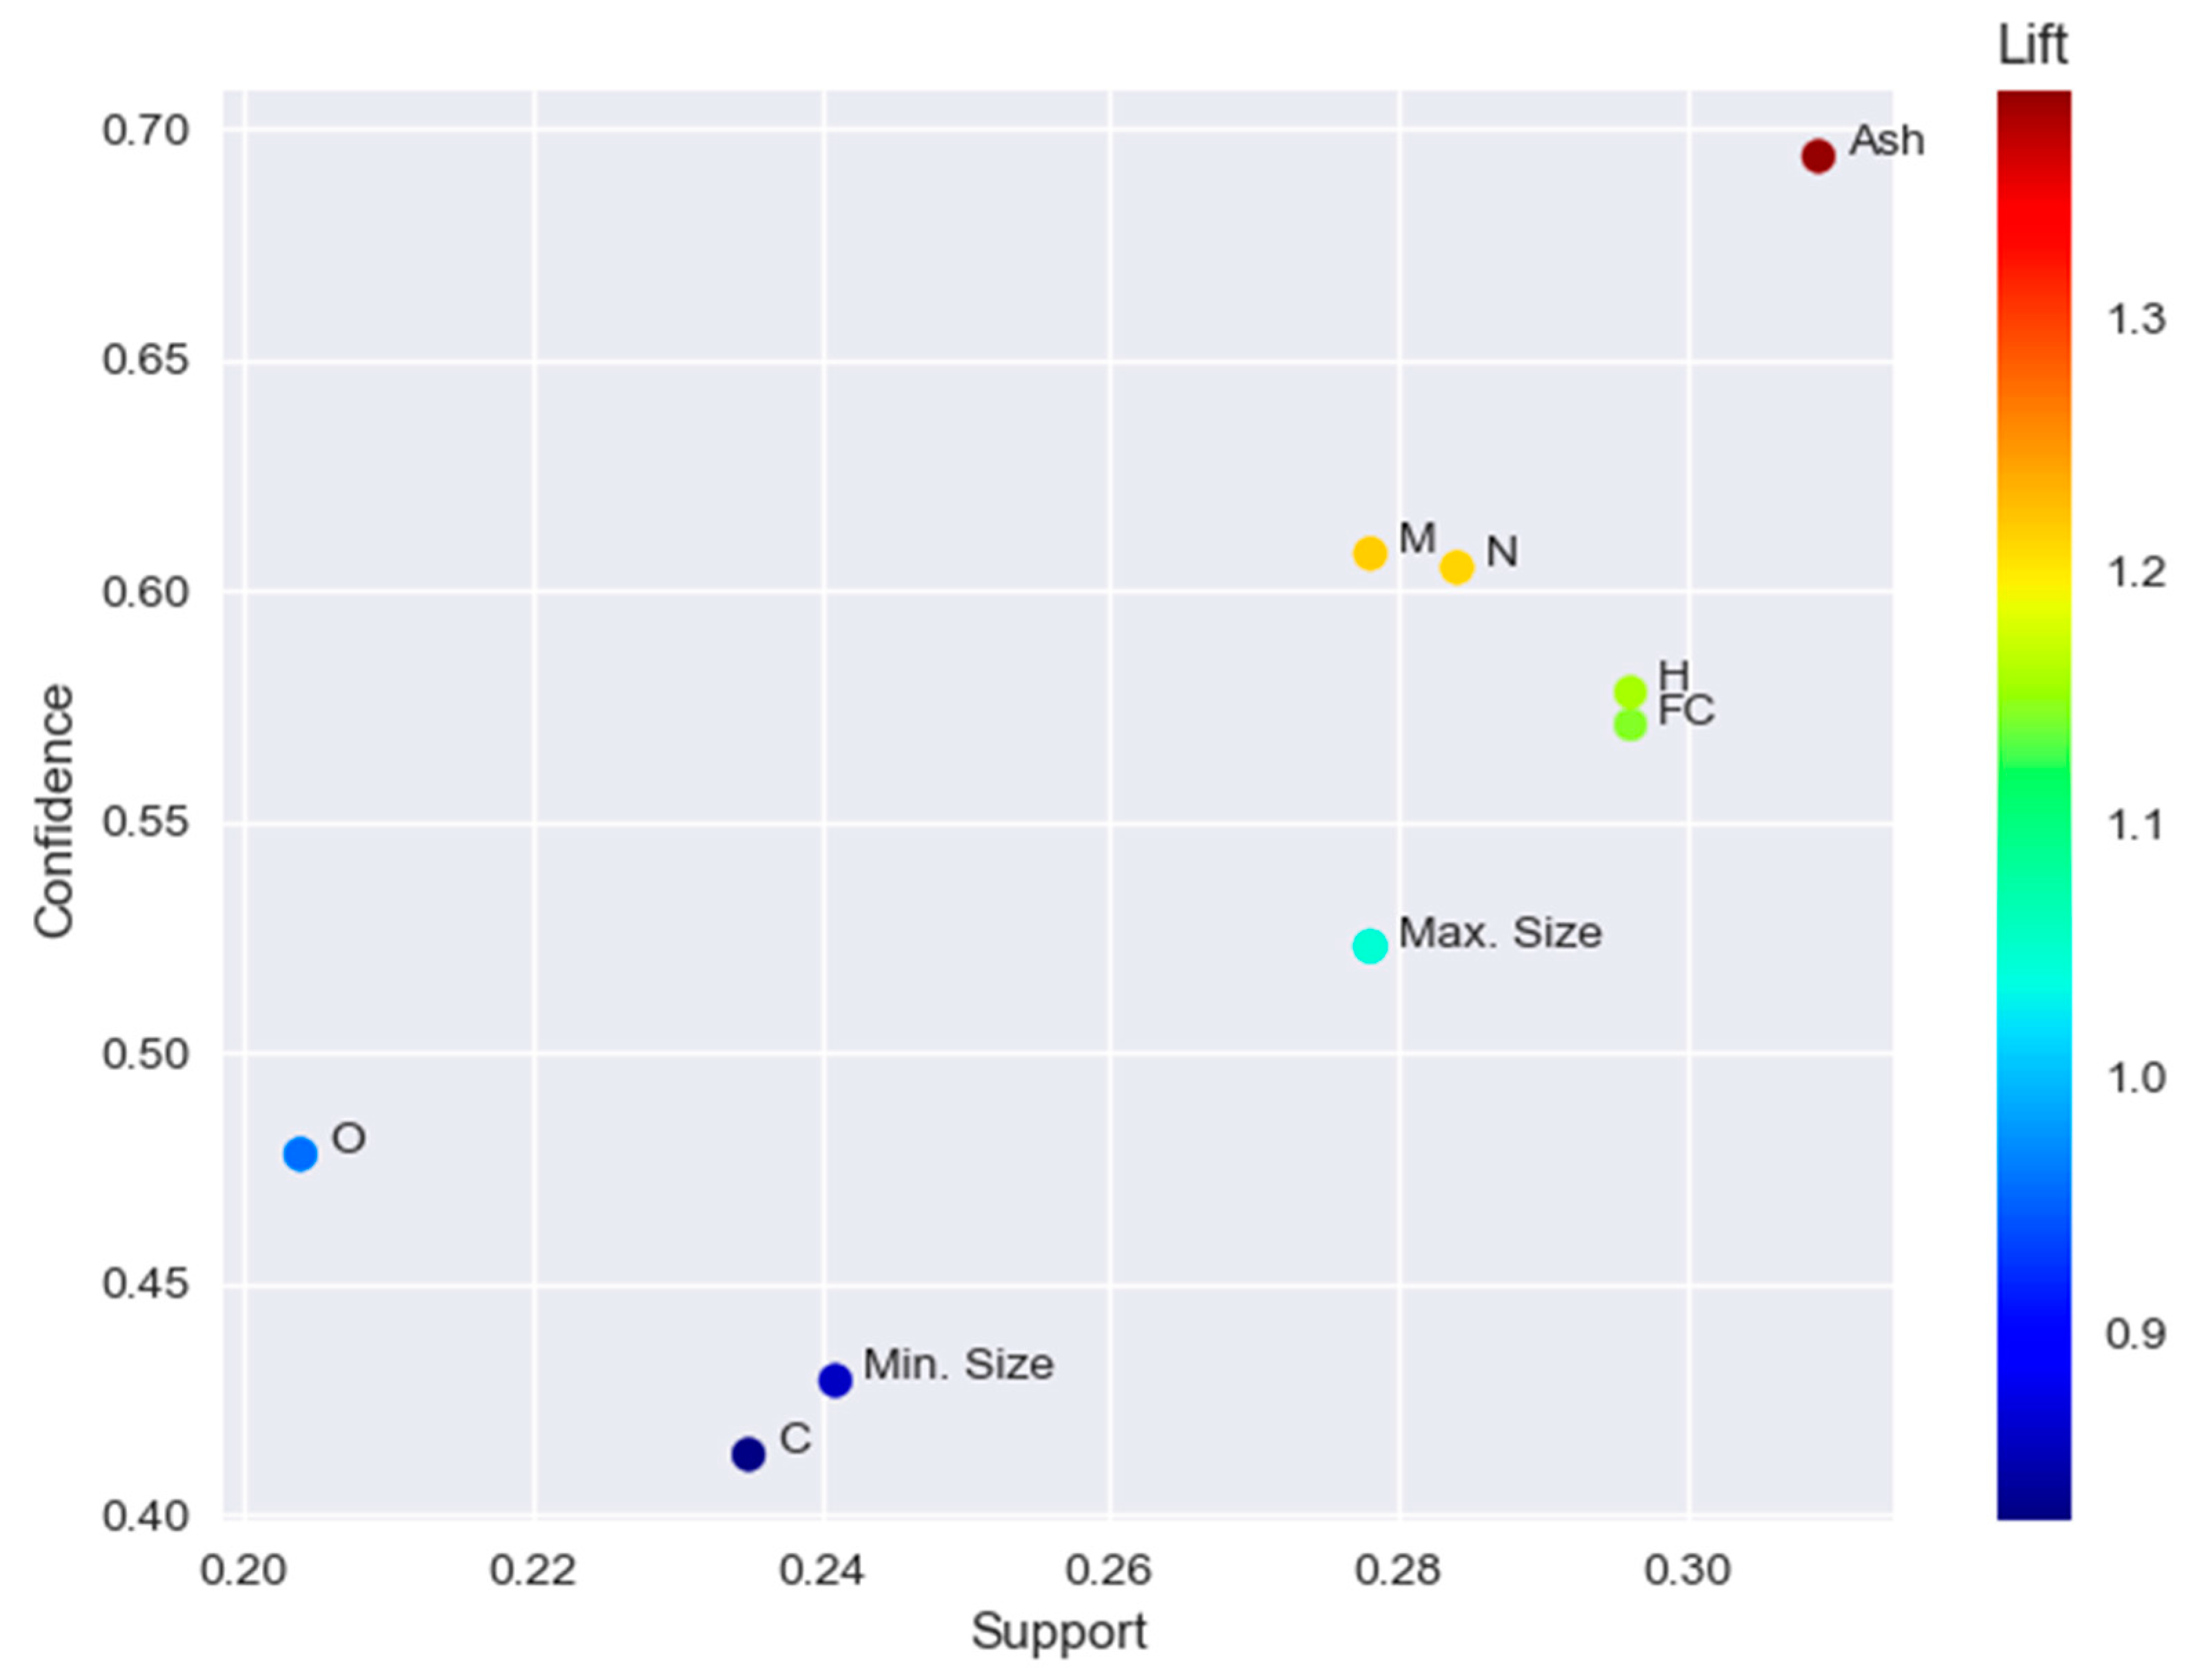
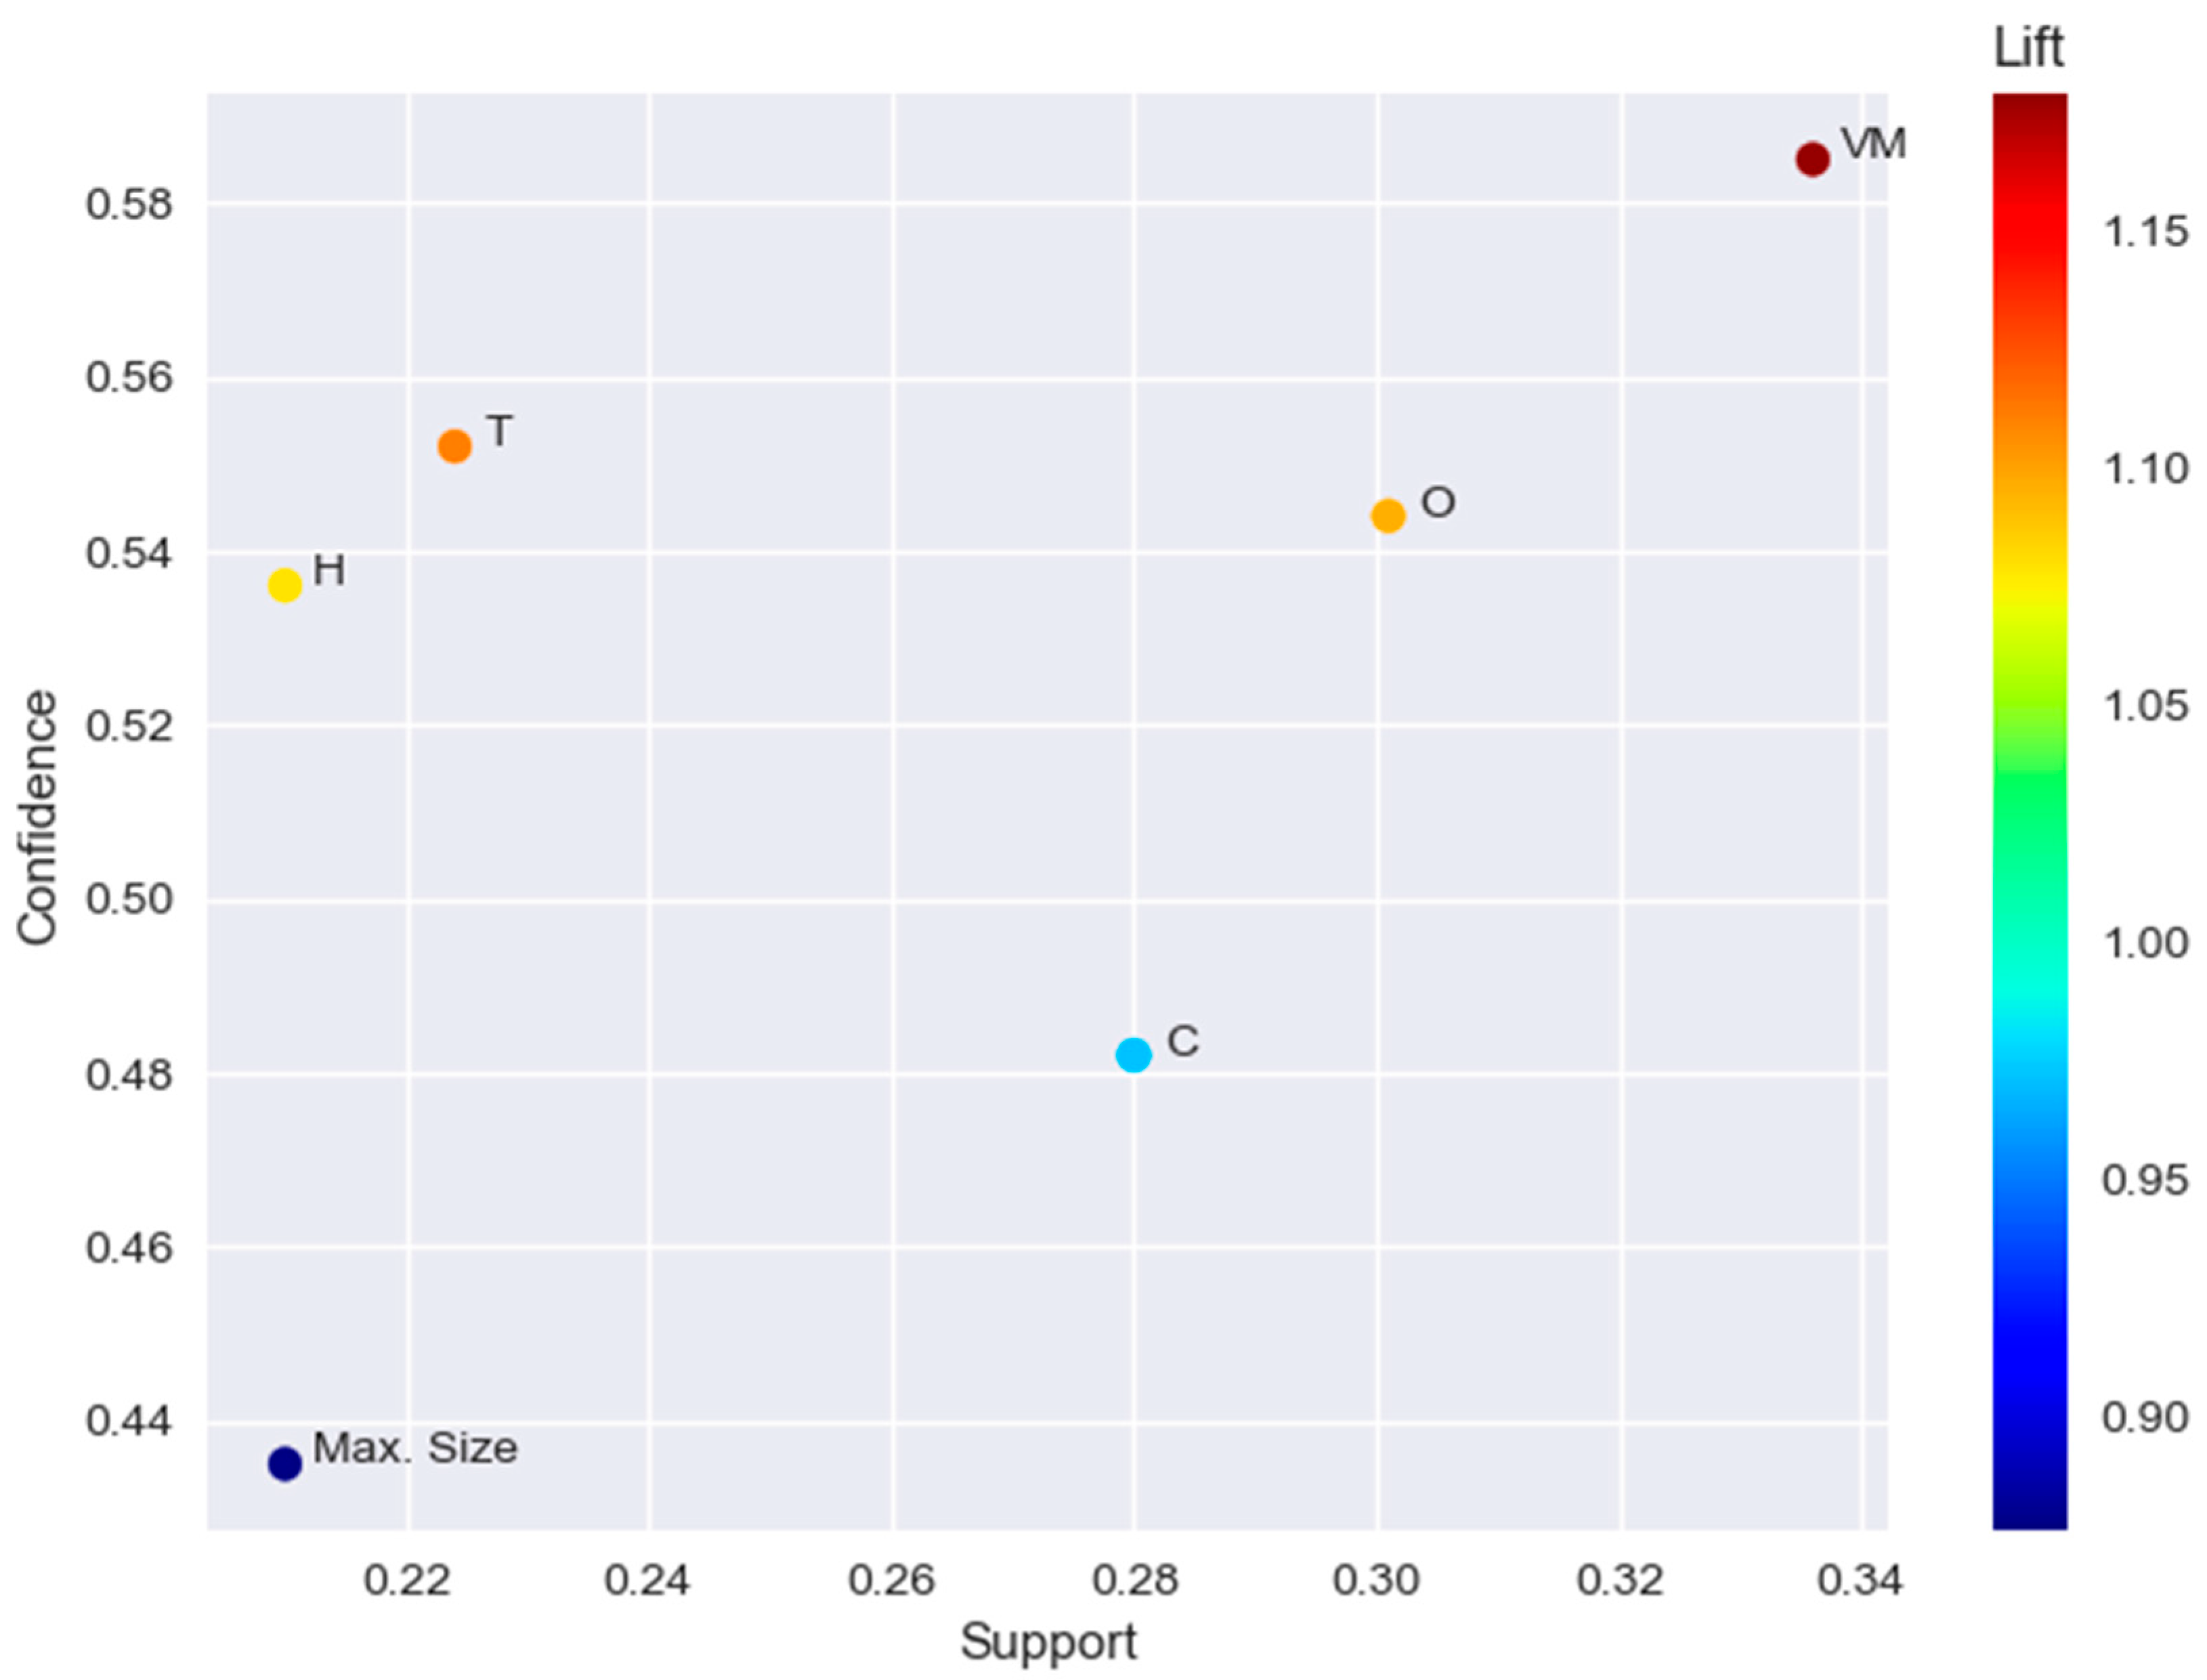
4.3. Association Rule Mining

In this section of the work, the association rule mining technique is utilized to collect and analyze the relationships between descriptor variables and target variables in order to identify the patterns that can lead to very high and very low yields [34]. Accordingly, nine descriptor variables are determined to be influential in achieving very high biochar yield. The support, confidence, and lift values of those variables are summarized in Table 5 and plotted in Figure 8. As explained in the Section 3.2, variables having a lift value greater than 1 indicate a positive correlation between a descriptor variable and the target variable (i.e., increasing the value of the descriptor increases the value of the target), whereas a lift value less than 1 indicates a negative correlation. In instances of a very high biochar yield, it is observed that ash content is the variable with the highest lift (the highest positive impact), as also reported by Venderbosch and Prins [30]. The rest of the variables having a positive influence are moisture, N, H, fixed carbon contents, and maximum particle diameter. It is also observed that C and O contents and minimum particle diameter affect the biochar yield negatively.
Likewise, the results of association rule mining for very high bio-oil yield are summarized in Table 6 and plotted in Figure 9. It is observed that six descriptor variables are influential in achieving very high bio-oil yield, among which maximum particle diameter has the smallest lift, meaning that biomass with bigger particles does not turn into bio-oil efficiently, as also discussed by Akhtar et al. [28]. On the other hand, volatile matter is found to be the variable with the highest positive effect, followed by pyrolysis temperature, in achieving a very high bio-oil yield, as also argued by Omar et al. [29]. It has also been discovered that high O and H contents in biomass favor a very high bio-oil yield, while a high C content in biomass has a negative effect on bio-oil yield.
Finally, Table 7 and Figure 10 present a summary of the results of association rule mining for very high biogas yield. It is observed that the lift value of the pyrolysis temperature (1.57) is the greatest among the other descriptor variables. This means that increasing the pyrolysis temperature results in a very high biogas yield, which is most likely due to the cracking of the volatiles in the biomass at high temperatures, as also discussed by Guedes et al. [25]. On the other hand, fixed carbon has the least lift (0.95), indicating a negative association with the biogas yield. Likewise, a high moisture content in the biomass influences the biogas yield negatively.

5. Conclusions

In this work, a database with 324 data points was formed using the experimental results from the slow pyrolysis process reported in 37 articles. Variables related to the proximate and ultimate analysis of biomass as well as some operational variables were used as the descriptors, together with three target variables (biochar, bio-oil, and biogas yields). Three distinct machine learning methodologies were applied to extract useful information from the database: SHAP analysis to find the importance of descriptors, decision tree classification to find the combination of variables leading to high yields, and association rule mining to identify the variables associated with very high levels of the yields.
The SHAP analysis revealed that pyrolysis temperature is the most significant variable influencing biochar, bio-oil, and biogas yields. Among many findings of the decision tree classification, it is of note that the most generalizable path for high biochar yield requires the pyrolysis temperature to be lower than 752.6 K and the biomass to include less than 84.2% volatile matter. If the fixed carbon content of the biomass is less than or equal to 12.0% and the hydrogen content is greater than 5.3%, it is possible to achieve a high bio-oil yield with a high degree of accuracy. As an example of a path leading to high biogas yield, the maximum particle diameter should be less than or equal to 6.5 mm, and the pyrolysis temperature should be greater than 912 K. Finally, association rule mining discovered associations between different levels of the descriptors and very high levels of the yields. For instance, maximum particle diameter has the lowest lift for very high bio-oil yield, suggesting that biomass with larger particles cannot be converted into bio-oil efficiently. Finally, it is of note that machine learning techniques can aid in determining the optimal conditions for the pyrolysis process to produce biochar, bio-oil, and biogas in a more sustainable manner. The information provided by machine learning can subsequently serve as a framework for the development of future projects.

Author Contributions

Conceptualization, K.M.M.T. and M.E.G.; Methodology, A.İ., K.Ö. and M.E.G.; Software, A.İ. and K.Ö.; Investigation, A.İ. and K.Ö.; Data curation, A.İ. and K.Ö.; Writing—review & editing, K.M.M.T. and M.E.G.; Supervision, K.M.M.T. and M.E.G. All authors have read and agreed to the published version of the manuscript.

Funding

This research received no external funding.

Institutional Review Board Statement

Not applicable.

Informed Consent Statement

Not applicable.

Data Availability Statement

Data will be made available on request.

Conflicts of Interest

The authors declare no conflict of interest.

Appendix A

Table A1. Details related to the publications used to extract data.
Reference PaperPublication YearNumber of Data ExtractedBiomass TypeRange of Operating Temperature (K)Maximum
Biochar
Yield (wt%)
Maximum
Bio-Oil
Yield (wt%)
Maximum
Biogas
Yield (wt%)
Pütün et al. [39]20028soybean—cake673–97330.130.430.1
Şensöz and Can [40]200210pine chips573–82329.030.923.6
Demirbas [41]200439olive husk,
corncob, tea waste
466–120443.5--
Onay and Koçkar [42]200410rapeseed673–97324.649.630.5
Pütün et al. [43]20057cotton stalk,673–97330.323.832.0
Demirbas [44]200632hazelnut, walnut, almond, sunflower seed shells500–120044.439.577.0
Demiral and Şensöz [45]200613hazelnut bagasse623–77335.033.232.0
Şensöz et al. [46]20068olive bagasse623–82338.137.730.3
Asadullah et al. [47]20077sugarcane bagasse
573–87377.066.117.8
Sánchez et al. [48]20092rape, sunflower82336.034.041.0
Abnisa et al. [49]201115palm shell,673–107334.846.047.5
Fu et al. [50]201120maize stalk, rice straw, cotton straw, rice husk873–127332.151.461.6
Duman et al. [51]20118cherry seed573–87340.030.621.7
Açıkalın et al. [52]20125pistachio shell,623–92330.652.829.7
Alper et al. [53]201412cornelian cherry stones, grape seeds573–107353.947.334.8
Yorgun and Yıldız [54]20159Paulownia wood (Paulownia tomentosa)623–87331.529.529.0
Biswas et al. [55]201716corn cob, wheat straw, rice straw, rice husk573–72343.347.339.8
Sakthivel and Ramesh [56]20173calophyllum inophyllum723–82338.347.522.6
Yang et al. [57]20184municipal solid waste723–112333.647.124.7
Mulimani and Navindgi [58]201810de-oiled seed cake of madhuca indica623–87344.238.832.0
Patel et al. [59]20193biosolids from a water recycling facility773–117344.736.840.8
Sahoo et al. [60]202021rice straw, wheat straw, sugarcane bagasse623–92339.752.637.7
Vieira et al. [61]20203rice husk573–77335.936.825.5
Setter et al. [62]20203coffee husk briquettes623–72339.831.933.6
Setter et al. [63]20203sugarcane bagasse573–77343.431.941.3
Sakhiya et al. [64]20214rice straw573–87357.939.526.0
del Pozo et al. [65]20213coffee silverskin553–77380.515.722.4
Maniscalco et al. [66]20213low-density polyethylene/polypropylene mixture693–77320.962.137.9
Lampropoulos et al. [67]20213olive kernel573–107359.841.233.8
Patra et al. [68]20214food waste573–87352.842.822.7
Selvarajoo et al. [69]20225citrus peel (lemon and orange peels)573–97353.644.962.0
Kaur et al. [70]20225citronella waste573–77334.137.736.8
Baghel et al. [71]20224prosopis juliflora573–87363.638.532.1
Mukhambet et al. [72]20223flax straw waste673–87343.240.439.9
Hosseinzaei et al. [73]20229pistachio shell, orange peel, saffron petals623–72350.050.045.0
de Almeida et al. [74]20225sugarcane (bagasse, straw), treated biomass723–92336.850.328.5
Abdullah et al. [75]20235banana pseudo-stem673–87342.745.327.3

References

  1. Zhu, X.; Li, Y.; Wang, X. Machine learning prediction of biochar yield and carbon contents in biochar based on biomass characteristics and pyrolysis conditions. Bioresour. Technol. 2019, 288, 121527. [Google Scholar] [CrossRef] [PubMed]
  2. Rose, J.; Bensch, G.; Munyehirwe, A.; Peters, J. The forgotten coal: Charcoal demand in sub-Saharan Africa. World Dev. Perspect. 2022, 25, 100401. [Google Scholar] [CrossRef]
  3. Plavniece, A.; Dobele, G.; Volperts, A.; Zhurinsh, A. Hydrothermal Carbonization vs. Pyrolysis: Effect on the Porosity of the Activated Carbon Materials. Sustainability 2022, 14, 15982. [Google Scholar] [CrossRef]
  4. Venderbosch, R.H. Fast Pyrolysis. In Thermochemical Processing of Biomass; Wiley: Croydon, UK, 2019; pp. 175–206. [Google Scholar]
  5. Niaze, A.A.; Sahu, R.; Sunkara, M.K.; Upadhyayula, S. Model construction and optimization for raising the concentration of industrial bioethanol production by using a data-driven ANN model. Renew. Energy 2023, 216, 119031. [Google Scholar] [CrossRef]
  6. Alpaydın, E. Introduction to Machine Learning; The MIT Press: London, UK, 2004. [Google Scholar]
  7. Larose, D.T. Discovering Knowledge in Data: An Introduction to Data Mining; John Wiley & Sons, Inc.: Hoboken, NJ, USA, 2005. [Google Scholar]
  8. Tan, P.-N.; Steinbach, M.; Kumar, V. Introduction to Data Mining; Pearson: Boston, MA, USA, 2005. [Google Scholar]
  9. Forootan, M.M.; Larki, I.; Zahedi, R.; Ahmadi, A. Machine Learning and Deep Learning in Energy Systems: A Review. Sustainability 2022, 14, 4832. [Google Scholar] [CrossRef]
  10. Sohani, A.; Sayyaadi, H.; Cornaro, C.; Shahverdian, M.H.; Pierro, M.; Moser, D.; Karimi, N.; Doranehgard, M.H.; Li, L.K.B. Using machine learning in photovoltaics to create smarter and cleaner energy generation systems: A comprehensive review. J. Clean. Prod. 2022, 364, 132701. [Google Scholar] [CrossRef]
  11. Zhao, E.; Sun, S.; Wang, S. New developments in wind energy forecasting with artificial intelligence and big data: A scientometric insight. Data Sci. Manag. 2022, 5, 84–95. [Google Scholar] [CrossRef]
  12. Okoroafor, E.R.; Smith, C.M.; Ochie, K.I.; Nwosu, C.J.; Gudmundsdottir, H.; Aljubran, M. Machine learning in subsurface geothermal energy: Two decades in review. Geothermics 2022, 102, 102401. [Google Scholar] [CrossRef]
  13. Wang, Z.; Peng, X.; Xia, A.; Shah, A.A.; Huang, Y.; Zhu, X.; Zhu, X.; Liao, Q. The role of machine learning to boost the bioenergy and biofuels conversion. Bioresour. Technol. 2022, 343, 126099. [Google Scholar] [CrossRef]
  14. Faizollahzadeh Ardabili, S.; Najafi, B.; Shamshirband, S.; Minaei Bidgoli, B.; Deo, R.C.; Chau, K.-w. Computational intelligence approach for modeling hydrogen production: A review. Eng. Appl. Comput. Fluid. Mech. 2018, 12, 438–458. [Google Scholar] [CrossRef]
  15. Coşgun, A.; Günay, M.E.; Yıldırım, R. Machine learning for algal biofuels: A critical review and perspective for the future. Green Chem. 2023, 25, 3354–3373. [Google Scholar] [CrossRef]
  16. Coşgun, A.; Günay, M.E.; Yıldırım, R. A critical review of machine learning for lignocellulosic ethanol production via fermentation route. Biofuel Res. J. 2023, 10, 1859–1875. [Google Scholar] [CrossRef]
  17. Mari Selvam, S.; Balasubramanian, P. Influence of Biomass Composition and Microwave Pyrolysis Conditions on Biochar Yield and Its Properties: A Machine Learning Approach. BioEnergy Res. 2022, 16, 138–150. [Google Scholar] [CrossRef]
  18. Narde, S.R.; Remya, N. Biochar production from agricultural biomass through microwave-assisted pyrolysis: Predictive modelling and experimental validation of biochar yield. Environ. Dev. Sustain. 2021, 24, 11089–11102. [Google Scholar] [CrossRef]
  19. Mathur, J.; Baruah, B.; Tiwari, P. Prediction of bio-oil yield during pyrolysis of lignocellulosic biomass using machine learning algorithms. Can. J. Chem. Eng. 2022, 101, 2457–2471. [Google Scholar] [CrossRef]
  20. Cao, H.; Xin, Y.; Yuan, Q. Prediction of biochar yield from cattle manure pyrolysis via least squares support vector machine intelligent approach. Bioresour. Technol. 2016, 202, 158–164. [Google Scholar] [CrossRef] [PubMed]
  21. Chen, X.; Zhang, H.; Song, Y.; Xiao, R. Prediction of product distribution and bio-oil heating value of biomass fast pyrolysis. Chem. Eng. Process. Process Intensif. 2018, 130, 36–42. [Google Scholar] [CrossRef]
  22. Liu, X.; Yang, H.; Yang, J.; Liu, F. Application of Random Forest Model Integrated with Feature Reduction for Biomass Torrefaction. Sustainability 2022, 14, 16055. [Google Scholar] [CrossRef]
  23. Vuppaladadiyam, A.K.; Vuppaladadiyam, S.S.V.; Sikarwar, V.S.; Ahmad, E.; Pant, K.K.; Murugavelh, S.; Pandey, A.; Bhattacharya, S.; Sarmah, A.; Leu, S.Y. A critical review on biomass pyrolysis: Reaction mechanisms, process modeling and potential challenges. J. Energy Inst. 2023, 108, 101236. [Google Scholar] [CrossRef]
  24. Yogalakshmi, K.N.; Poornima, D.T.; Sivashanmugam, P.; Kavitha, S.; Yukesh, K.R.; Sunita, V.; AdishKumar, S.; Gopalakrishnan, K.; Rajesh, B.J. Lignocellulosic biomass-based pyrolysis: A comprehensive review. Chemosphere 2022, 286 Pt 2, 131824. [Google Scholar]
  25. Guedes, R.E.; Luna, A.S.; Torres, A.R. Operating parameters for bio-oil production in biomass pyrolysis: A review. J. Anal. Appl. Pyrolysis 2018, 129, 134–149. [Google Scholar] [CrossRef]
  26. Li, L.; Rowbotham, J.S.; Christopher Greenwell, H.; Dyer, P.W. An Introduction to Pyrolysis and Catalytic Pyrolysis: Versatile Techniques for Biomass Conversion. In New and Future Developments in Catalysis; Elsevier: Amsterdam, Netherlands, 2013; pp. 173–208. [Google Scholar]
  27. Tripathi, M.; Sahu, J.N.; Ganesan, P. Effect of process parameters on production of biochar from biomass waste through pyrolysis: A review. Renew. Sustain. Energy Rev. 2016, 55, 467–481. [Google Scholar] [CrossRef]
  28. Akhtar, J.; Saidina Amin, N. A review on operating parameters for optimum liquid oil yield in biomass pyrolysis. Renew. Sustain. Energy Rev. 2012, 16, 5101–5109. [Google Scholar] [CrossRef]
  29. Omar, R.; Idris, A.; Yunus, R.; Khalid, K.; Aida Isma, M.I. Characterization of empty fruit bunch for microwave-assisted pyrolysis. Fuel 2011, 90, 1536–1544. [Google Scholar] [CrossRef]
  30. Venderbosch, R.H.; Prins, W. Fast pyrolysis technology development. Biofuels Bioprod. Biorefining 2010, 4, 178–208. [Google Scholar] [CrossRef]
  31. Saffary, S.; Rafiee, M.; Varnoosfaderani, M.S.; Günay, M.E.; Zendehboudi, S. Smart paradigm to predict copper surface area of Cu/ZnO/Al2O3 catalyst based on synthesis parameters. Chem. Eng. Res. Des. 2023, 191, 604–616. [Google Scholar] [CrossRef]
  32. Tangirala, S. Evaluating the Impact of GINI Index and Information Gain on Classification using Decision Tree Classifier Algorithm. Int. J. Adv. Comput. Sci. Appl. 2020, 11, 612–619. [Google Scholar] [CrossRef]
  33. Coşgun, A.; Günay, M.E.; Yıldırım, R. Analysis of lipid production from Yarrowia lipolytica for renewable fuel production by machine learning. Fuel 2022, 315, 122817. [Google Scholar] [CrossRef]
  34. Singh, V.; Mishra, V. Analysing the effects of culture parameters on wastewater treatment capability of microalgae through association rule mining. J. Environ. Chem. Eng. 2022, 10, 108444. [Google Scholar] [CrossRef]
  35. Selvarajoo, A.; Oochit, D. Effect of pyrolysis temperature on product yields of palm fibre and its biochar characteristics. Mater. Sci. Energy Technol. 2020, 3, 575–583. [Google Scholar] [CrossRef]
  36. Shariff, A.; Aziz, N.S.M.; Abdullah, N. Slow Pyrolysis of Oil Palm Empty Fruit Bunches for Biochar Production and Characterisation. J. Phys. Sci. 2014, 25, 97–112. [Google Scholar]
  37. Sakhiya, A.K.; Baghel, P.; Pathak, S.; Vijay, V.K.; Kaushal, P. Effect of Process Parameters on Slow Pyrolysis of Rice Straw: Product Yield and Energy Analysis. In Proceedings of the 2020 International Conference and Utility Exhibition on Energy, Environment and Climate Change (ICUE), Pattaya City, Thailand, 20–22 October 2020; pp. 1–9. [Google Scholar]
  38. Shafiq, M.; Capareda, S.C. Effect of different temperatures on the properties of pyrolysis products of Parthenium hysterophorus. J. Saudi Chem. Soc. 2021, 25, 101197. [Google Scholar] [CrossRef]
  39. Pütün, A.E.; Apaydin, E.; Pütün, E. Bio-oil production from pyrolysis and steam pyrolysis of soybean-cake: Product yields and composition. Energy 2002, 27, 703–713. [Google Scholar] [CrossRef]
  40. Şensöz, S.; Can, M. Pyrolysis of Pine (Pinus brutia Ten.) Chips: 1. Effect of Pyrolysis Temperature and Heating Rate on the Product Yields. Energy Sources 2002, 24, 347–355. [Google Scholar] [CrossRef]
  41. Demirbas, A. Effects of temperature and particle size on bio-char yield from pyrolysis of agricultural residues. J. Anal. Appl. Pyrolysis 2004, 72, 243–248. [Google Scholar] [CrossRef]
  42. Onay, O.; Mete Koçkar, O. Fixed-bed pyrolysis of rapeseed (Brassica napus L.). Biomass Bioenergy 2004, 26, 289–299. [Google Scholar] [CrossRef]
  43. Pütün, A.E.; Özbay, N.; Önal, E.P.; Pütün, E. Fixed-bed pyrolysis of cotton stalk for liquid and solid products. Fuel Process. Technol. 2005, 86, 1207–1219. [Google Scholar] [CrossRef]
  44. Demirbas, A. Effect of temperature on pyrolysis products from four nut shells. J. Anal. Appl. Pyrolysis 2006, 76, 285–289. [Google Scholar] [CrossRef]
  45. Demiral, İ.; Şensöz, S. Fixed-Bed Pyrolysis of Hazelnut (Corylus Avellana L.) Bagasse: Influence of Pyrolysis Parameters on Product Yields. Energy Sources Part A Recovery Util. Environ. Eff. 2006, 28, 1149–1158. [Google Scholar] [CrossRef]
  46. Sensoz, S.; Demiral, I.; Ferdi Gercel, H. Olive bagasse (Olea europea L.) pyrolysis. Bioresour. Technol. 2006, 97, 429–436. [Google Scholar] [CrossRef] [PubMed]
  47. Asadullah, M.; Rahman, M.A.; Ali, M.M.; Rahman, M.S.; Motin, M.A.; Sultan, M.B.; Alam, M.R. Production of bio-oil from fixed bed pyrolysis of bagasse. Fuel 2007, 86, 2514–2520. [Google Scholar] [CrossRef]
  48. Sánchez, M.E.; Lindao, E.; Margaleff, D.; Martínez, O.; Morán, A. Pyrolysis of agricultural residues from rape and sunflowers: Production and characterization of bio-fuels and biochar soil management. J. Anal. Appl. Pyrolysis 2009, 85, 142–144. [Google Scholar] [CrossRef]
  49. Abnisa, F.; Daud, W.M.A.W.; Husin, W.N.W.; Sahu, J.N. Utilization possibilities of palm shell as a source of biomass energy in Malaysia by producing bio-oil in pyrolysis process. Biomass Bioenergy 2011, 35, 1863–1872. [Google Scholar] [CrossRef]
  50. Fu, P.; Yi, W.; Bai, X.; Li, Z.; Hu, S.; Xiang, J. Effect of temperature on gas composition and char structural features of pyrolyzed agricultural residues. Bioresour. Technol. 2011, 102, 8211–8219. [Google Scholar] [CrossRef] [PubMed]
  51. Duman, G.; Okutucu, C.; Ucar, S.; Stahl, R.; Yanik, J. The slow and fast pyrolysis of cherry seed. Bioresour. Technol. 2011, 102, 1869–1878. [Google Scholar] [CrossRef]
  52. Açıkalın, K.; Karaca, F.; Bolat, E. Pyrolysis of pistachio shell: Effects of pyrolysis conditions and analysis of products. Fuel 2012, 95, 169–177. [Google Scholar] [CrossRef]
  53. Alper, K.; Tekin, K.; Karagöz, S. Pyrolysis of agricultural residues for bio-oil production. Clean. Technol. Environ. Policy 2014, 17, 211–223. [Google Scholar] [CrossRef]
  54. Yorgun, S.; Yıldız, D. Slow pyrolysis of paulownia wood: Effects of pyrolysis parameters on product yields and bio-oil characterization. J. Anal. Appl. Pyrolysis 2015, 114, 68–78. [Google Scholar] [CrossRef]
  55. Biswas, B.; Pandey, N.; Bisht, Y.; Singh, R.; Kumar, J.; Bhaskar, T. Pyrolysis of agricultural biomass residues: Comparative study of corn cob, wheat straw, rice straw and rice husk. Bioresour. Technol. 2017, 237, 57–63. [Google Scholar] [CrossRef]
  56. Sakthivel, R.; Ramesh, K. Influence of temperature on yield, composition and properties of the sub-fractions derived from slow pyrolysis of Calophyllum inophyllum de-oiled cake. J. Anal. Appl. Pyrolysis 2017, 127, 159–169. [Google Scholar]
  57. Yang, Y.; Heaven, S.; Venetsaneas, N.; Banks, C.J.; Bridgwater, A.V. Slow pyrolysis of organic fraction of municipal solid waste (OFMSW): Characterisation of products and screening of the aqueous liquid product for anaerobic digestion. Appl. Energy 2018, 213, 158–168. [Google Scholar] [CrossRef]
  58. Mulimani, H.V.; Navindgi, M.C. Production and Characterization of Bio-Oil by Pyrolysis of Mahua De-Oiled Seed Cake. ChemistrySelect 2018, 3, 1102–1107. [Google Scholar] [CrossRef]
  59. Patel, S.; Kundu, S.; Halder, P.; Veluswamy, G.; Pramanik, B.; Paz-Ferreiro, J.; Surapaneni, A.; Shah, K. Slow pyrolysis of biosolids in a bubbling fluidised bed reactor using biochar, activated char and lime. J. Anal. Appl. Pyrolysis 2019, 144, 104697. [Google Scholar] [CrossRef]
  60. Sahoo, K.; Kumar, A.; Chakraborty, J.P. A comparative study on valuable products: Bio-oil, biochar, non-condensable gases from pyrolysis of agricultural residues. J. Mater. Cycles Waste Manag. 2020, 23, 186–204. [Google Scholar] [CrossRef]
  61. Vieira, F.R.; Romero Luna, C.M.; Arce, G.L.A.F.; Ávila, I. Optimization of slow pyrolysis process parameters using a fixed bed reactor for biochar yield from rice husk. Biomass Bioenergy 2020, 132, 105412. [Google Scholar] [CrossRef]
  62. Setter, C.; Silva, F.T.M.; Assis, M.R.; Ataíde, C.H.; Trugilho, P.F.; Oliveira, T.J.P. Slow pyrolysis of coffee husk briquettes: Characterization of the solid and liquid fractions. Fuel 2020, 261, 116420. [Google Scholar] [CrossRef]
  63. Setter, C.; Sanchez Costa, K.L.; Pires de Oliveira, T.J.; Farinassi Mendes, R. The effects of kraft lignin on the physicomechanical quality of briquettes produced with sugarcane bagasse and on the characteristics of the bio-oil obtained via slow pyrolysis. Fuel Process. Technol. 2020, 210, 106561. [Google Scholar] [CrossRef]
  64. Sakhiya, A.K.; Anand, A.; Aier, I.; Vijay, V.K.; Kaushal, P. Suitability of rice straw for biochar production through slow pyrolysis: Product characterization and thermodynamic analysis. Bioresour. Technol. Rep. 2021, 15, 100818. [Google Scholar] [CrossRef]
  65. Del Pozo, C.; Rego, F.; Yang, Y.; Puy, N.; Bartrolí, J.; Fàbregas, E.; Bridgwater, A.V. Converting coffee silverskin to value-added products by a slow pyrolysis-based biorefinery process. Fuel Process. Technol. 2021, 214, 106708. [Google Scholar] [CrossRef]
  66. Maniscalco, M.; La Paglia, F.; Iannotta, P.; Caputo, G.; Scargiali, F.; Grisafi, F.; Brucato, A. Slow pyrolysis of an LDPE/PP mixture: Kinetics and process performance. J. Energy Inst. 2021, 96, 234–241. [Google Scholar] [CrossRef]
  67. Lampropoulos, A.; Kaklidis, N.; Athanasiou, C.; Montes-Morán, M.A.; Arenillas, A.; Menéndez, J.A.; Binas, V.D.; Konsolakis, M.; Marnellos, G.E. Effect of Olive Kernel thermal treatment (torrefaction vs. slow pyrolysis) on the physicochemical characteristics and the CO2 or H2O gasification performance of as-prepared biochars. Int. J. Hydrogen Energy 2021, 46, 29126–29141. [Google Scholar] [CrossRef]
  68. Patra, B.R.; Nanda, S.; Dalai, A.K.; Meda, V. Slow pyrolysis of agro-food wastes and physicochemical characterization of biofuel products. Chemosphere 2021, 285, 131431. [Google Scholar] [CrossRef] [PubMed]
  69. Selvarajoo, A.; Wong, Y.L.; Khoo, K.S.; Chen, W.H.; Show, P.L. Biochar production via pyrolysis of citrus peel fruit waste as a potential usage as solid biofuel. Chemosphere 2022, 294, 133671. [Google Scholar] [CrossRef]
  70. Kaur, R.; Kumar, A.; Biswas, B.; Krishna, B.B.; Bhaskar, T. Investigations into pyrolytic behaviour of spent citronella waste: Slow and flash pyrolysis study. Bioresour. Technol. 2022, 366, 128202. [Google Scholar] [CrossRef]
  71. Baghel, P.; Sakhiya, A.K.; Kaushal, P. Influence of temperature on slow pyrolysis of Prosopis Juliflora: An experimental and thermodynamic approach. Renew. Energy 2022, 185, 538–551. [Google Scholar] [CrossRef]
  72. Mukhambet, Y.; Shah, D.; Tatkeyeva, G.; Sarbassov, Y. Slow pyrolysis of flax straw biomass produced in Kazakhstan: Characterization of enhanced tar and high-quality biochar. Fuel 2022, 324, 124676. [Google Scholar] [CrossRef]
  73. Hosseinzaei, B.; Hadianfard, M.J.; Aghabarari, B.; García-Rollán, M.; Ruiz-Rosas, R.; Rosas, J.M.; Rodríguez-Mirasol, J.; Cordero, T. Pyrolysis of pistachio shell, orange peel and saffron petals for bioenergy production. Bioresour. Technol. Rep. 2022, 19, 101209. [Google Scholar] [CrossRef]
  74. de Almeida, S.G.C.; Tarelho, L.A.C.; Hauschild, T.; Costa, M.A.M.; Dussán, K.J. Biochar production from sugarcane biomass using slow pyrolysis: Characterization of the solid fraction. Chem. Eng. Process. Process Intensif. 2022, 179, 109054. [Google Scholar] [CrossRef]
  75. Abdullah, N.; Mohd Taib, R.; Mohamad Aziz, N.S.; Omar, M.R.; Disa, N.M. Banana pseudo-stem biochar derived from slow and fast pyrolysis process. Heliyon 2023, 9, e12940. [Google Scholar] [CrossRef]
Figure 1. The framework of the computational methods.
Sustainability 15 14884 g001
Figure 2. SHAP analysis for biochar yield.
Sustainability 15 14884 g002
Figure 3. SHAP analysis for bio-oil yield.
Sustainability 15 14884 g003
Figure 4. SHAP analysis for biogas yield.
Sustainability 15 14884 g004
Figure 5. Decision tree model created for biochar yield (pathways on the left show the true outcome of the statement in the parent node).
Sustainability 15 14884 g005
Figure 6. Decision tree model created for bio-oil yield (pathways on the left show the true outcome of the statement in the parent node).
Sustainability 15 14884 g006
Figure 7. Decision tree model created for biogas yield (pathways on the left show the true outcome of the statement in the parent node).
Sustainability 15 14884 g007
Figure 8. Association rule mining plot for biochar yield (N, H, O and C refer to weight percentages of the elements; FC refers to fixed carbon weight percent, M refers to moisture weight percent; Ash refers to ash weight percent; and Min. Size and Max. Size refer to minimum particle diameter and maximum particle diameter respectively).
Sustainability 15 14884 g008
Figure 9. Association rule mining plot for bio-oil yield (H, O and C refer to weight percentages of the elements; VM refers to volatile matter weight percent, T refers to temperature and Max. Size refers to maximum particle diameter).
Sustainability 15 14884 g009
Figure 10. Association rule mining plot for biogas yield (O and C refer to weight percentages of the elements; FC refers to fixed carbon weight percent, M refers to moisture weight percent; VM refers to volatile matter weight percent; T refers to temperature; and Min. Size and Max. Size refer to minimum particle diameter and maximum particle diameter respectively).
Sustainability 15 14884 g010
Table 1. Ranges of the descriptor and target variables.
Types of VariablesNames of VariablesRanges of Variables
Proximate analysismoisture (wt%)[0.400, 45.8]
volatile matter (wt%)[31.2, 97.6]
fixed carbon (wt%)[0.200, 58.2]
ash (wt%)[0.110, 42.6]
Ultimate analysisC (wt%)[30.9, 88.7]
H (wt%)[3.39, 13.5]
O (wt%)[5.71, 56.4]
N (wt%)[0.0800, 22.1]
Operational variablesminimum particle diameter (mm)[0.000100, 5.00]
maximum particle diameter (mm)[0.00450, 10.0]
pyrolysis temperature (K)[466, 1273]
Target variablesbiochar yield (wt%)[4.59, 80.5]
bio-oil yield (wt%)[0, 66.1]
biogas yield (wt%)[0, 77.0]
Table 2. Confusion matrix of the decision tree model for biochar yield over the test set.
Experimental DataPredictionsClassification Accuracy (Recall)
ClassNumber of Data (Support)LowHigh
low4033733/40 = 0.83
high2512424/25 = 0.96
precision 33/34 = 0.9724/31 = 0.77
F1 score 0.890.86
Table 3. Confusion matrix of the decision tree model for bio-oil yield over the test set.
Experimental DataPredictionsClassification Accuracy (Recall)
ClassNumber of Data (Support)LowHigh
low2517817/25 = 0.68
high3272525/32 = 0.78
precision 17/24 = 0.7125/33 = 0.76
f1 score 0.690.77
Table 4. Confusion matrix of the decision tree model for biogas yield over the test set.
Experimental DataPredictionsClassification Accuracy (Recall)
ClassNumber of Data (Support)LowHigh
low2721621/27 = 0.78
high3032727/30 = 0.90
precision 21/24 = 0.8827/33 = 0.82
f1 score 0.820.86
Table 5. Association rule mining parameters for biochar yield.
SupportConfidenceLift
ash (wt%)0.310.691.39
moisture (wt%)0.280.611.22
N (wt%)0.280.611.21
H (wt%)0.300.581.16
fixed carbon (wt%)0.300.571.14
maximum particle diameter (mm)0.280.521.05
O (wt%)0.200.480.96
minimum particle diameter (mm)0.240.430.86
C (wt%)0.230.410.83
Table 6. Association rule mining parameters for bio-oil yield.
SupportConfidenceLift
volatile matter (wt%)0.340.591.18
temperature0.220.551.11
O (wt%)0.300.541.10
H (wt%)0.210.541.08
C (wt%)0.280.480.97
maximum particle diameter (mm)0.210.430.88
Table 7. Association rule mining parameters for biogas yield.
SupportConfidenceLift
temperature (K)0.290.771.57
minimum particle diameter (mm)0.300.631.27
O (wt%)0.240.571.15
C (wt%)0.310.561.14
volatile matter (wt%)0.270.531.07
maximum particle diameter (mm)0.260.491.00
moisture (wt%)0.210.480.97
fixed carbon (wt%)0.250.470.95
Disclaimer/Publisher’s Note: The statements, opinions and data contained in all publications are solely those of the individual author(s) and contributor(s) and not of MDPI and/or the editor(s). MDPI and/or the editor(s) disclaim responsibility for any injury to people or property resulting from any ideas, methods, instructions or products referred to in the content.

