Article

Comprehensive Analysis of PM1 Composition in the Eastern Indo-Gangetic Basin: A Three-Year Urban Study

1
Laboratory of Applied Stress Biology, Department of Botany, University of Gour Banga, Malda 732103, India
2
Academy of Scientific and Innovative Research (AcSIR), Ghaziabad 201002, India
3
Section of Basic Research in Horticulture, Department of Plant Protection, Institute of Horticultural Sciences, Warsaw University of Life Sciences—SGGW, Nowoursynowska Street 159, 02-776 Warsaw, Poland
4
Environmental Engineering and Social Planning Division, LEA Associates South Asia Pvt. Ltd., New Delhi 110044, India
5
Department of Bioengineering and Biotechnology, Birla Institute of Technology, Mesra, Ranchi 835215, India
6
Instytut Techniki Budowlanej, Filtrowa Street 1, 00-611 Warsaw, Poland
7
Department of Applied Sciences, University of Petroleum and Energy Studies, Dehradun 248007, India
*
Authors to whom correspondence should be addressed.
Sustainability 2023, 15(20), 14894; https://doi.org/10.3390/su152014894
Submission received: 11 September 2023 / Revised: 11 October 2023 / Accepted: 11 October 2023 / Published: 16 October 2023
(This article belongs to the Special Issue Atmospheric Pollution and Air Quality Studies)

Abstract

:
Particulate matter (PM) pollution poses a severe threat to the environment and health worldwide. This study aimed to evaluate the mass concentration, physicochemical characteristics, and emission sources of aerodynamic diameters of ≤1 µm (PM1) within an urban sprawl situated in the eastern Indo-Gangetic basin over three years (2017–2019). The study encompassed the monitoring of PM1 using an ambient PM1 sampler; physicochemical characteristics were determined through scanning electron microscopy (SEM), energy dispersive X-ray spectroscopy (EDX), and inductively coupled plasma-optical emission spectrometry (ICP-OES). Possible emission sources were analysed through principal component analysis (PCA) and enrichment factor (EF) analyses. The results showed that the PM1 concentrations were consistently high throughout the research period, even exceeding the national standards for PM2.5 and PM10, especially during the post-monsoon period. Significant seasonal fluctuations were confirmed by the elemental and inorganic ion analyses, highlighting the dominance of elements like Al, Ca, Fe, K, and Mg and inorganic ions like NH4+, SO42−, and NO3. Vehicular exhaust and non-exhaust (47%), sea salt and biomass burning (26%), and industrial activities (10.3%) are the dominant sources of PM1. Therefore, the findings are thought-provoking and could inspire policymakers to formulate reduction policies in India.

1. Introduction

To address the effects of Particulate Matter (PM) pollution on the environment and public health, it is crucial to investigate the details of smaller fractions of PM, along with large-size PM [1], as small-size PM has a greater ability to infiltrate deep inside the body, ultimately affecting it more. With over a million premature deaths caused by air pollution each year, India has the highest burden of air pollution-related health problems [2]. These impacts primarily result from PM, which continuously exceeds the national and global standards, particularly in urban areas. However, recent studies indicate that the PM fraction with an aerodynamic diameter ≤1 µm (PM1) causes the most deleterious health impacts [3,4,5] and is potentially behind the majority of cases that are attributed to PM [4,5,6]. Despite not being the focus of any recommendations by the World Health Organisation (WHO) or other national government organisations due to the smaller number of studies, PM1 poses a higher level of risk [7,8]. Hence, there is a need for particular interest in PM1 measurement. Like other countries, policymakers in India are also taking steps to address air pollution; the most significant of which is the National Clean Air Programme (2019) for Indian cities, which aims to reduce PM2.5 emissions by 20–30 per cent by 2024 compared to the 2017 levels [9]. However, the focus continues on national and state capitals, metro and Class-I cities in relation to PM2.5 and PM10 only. There is neither a monitoring network nor a standard for PM1, which seems to forfeit the objective of protecting public health by focusing on PM2.5 and PM10. Additionally, due to their small size, these particles travel long distances; hence, from the long-term perspective, focusing on major cities is not sufficient. Some of the existing studies indicate that the chemical composition determines the magnitude of these impacts, which in turn depends on the pollution sources [3].
Some studies have proposed that the small-size fraction of PM has a greater effect on the environment [10] and health [11]. According to Kasimov et al. [12], PM1 in Moscow contained enriched concentrations of 51–60% Cd, Bi, As, Sb, and Sn, 31–50% Cr, Mo, Pb, Ni, Zn, Co, Cu, and 15–30% W, V, Fe, Mn, Be, Ti, and Sr. They concluded that the primary sources of these components are vehicular exhaustive and non-exhaustive operations. Anthropogenic sources of different sizes of PM include building construction, biomass combustion, power plants, vehicle exhausts, and agriculture crop residue burning [13]. Additionally, it is released naturally through spores of plants, forest fires, volcano eruptions, and soil erosion [14]. Hence, it is important to understand and identify the sources of air pollutants. The source identification of PM1 was determined through the application of various techniques, including stable carbon isotopic analyses and receptor models such as positive matrix factorisation (PMF), multiple linear regression (MLR), and principal component analysis (PCA) [3,15,16,17,18]. Evidently, comparatively less emphasis has been placed on the investigation of PM1, with the majority of the existing research concentrating on studying the composition, sources, and impacts of PM2.5 and PM10 [19]. Due to the limited available studies, neither the World Health Organisation (WHO) nor other government organisations have suggested standards for PM1 to date; therefore, more extensive monitoring and epidemiological studies are needed to assess the level of risk that PM1 poses.
To design strategies and standards related to PM1, it is important to understand the characterisation of PM1. Hence, in the present study, an effort has been made to understand the physicochemical characteristics and emission source apportionment of PM1 over an urban sprawl in the Indo-Gangetic Basin. The main portion of the present study involves: (a) daily monitoring at three sites in Malda for three consecutive years (2017, 2018, and 2019, respectively); (b) chemical characterisation of elements; (c) characterisation of inorganic ions, and the emission sources identification of PM1. Details of the processes and steps used to fulfil the objectives will be discussed in detail in the next section, Material and Methods. The findings of this study might help to understand and design probable and feasible mitigation strategies for particulate pollution, especially PM1.

2. Materials and Methods

2.1. Monitoring Sites, PM1 Sampler, and Monitoring Schedule

Data from PM monitoring at a single site over a large geographic area can be challenging to understand [20]; therefore, three monitoring sites (MS-1, MS-2, and MS-3) were selected within Malda for PM1 collection according to the predominant wind direction (Figure 1).
MS-1 (latitude 24°54.124′ N and longitude 088°04.828′ E) was located about 12 km south of Malda. MS-2 (latitude 24°59’32.54″ N and longitude 088°08′13.17″ E) and MS-3 (latitude 25°00.150′ N and longitude 088°08.165′ E) were situated about 10–12 km from MS-1 in the upwind direction. These sites are experiencing high pressure due to the dense population, vertical and horizontal urban growth, growing residential and commercial buildings, and rising energy consumption. A national highway-34 (NH-34) traverses these sites, facilitating the continuous movement of approximately 9350 vehicles daily [21]. Brick kilns, rice and jute mills, food and beverage manufacturers, silk factories, and beedi factories are the additional pollution sources that exist a short distance away from these sites.
First, 24 h sampling of PM1 was conducted using a PM1 sampler (Model: APM 577, Envirotech, New Delhi, India) positioned 1.8 metres from the ground at the monitoring sites, following the Central Pollution Control Board (CPCB) of India and U.S. Environmental Protection Age (US EPA) guidelines to maintain distance from pollution sources and ensure free air circulation. Sampling took place during the pre-monsoon (February–May), monsoon (June–September), and post-monsoon (October–January) seasons in the overall study period (2017–2019). The flow rate of the sampler was consistently maintained at 10 litres per minute (LPM) using a needle valve and vacuum pump, as measured by the rotameter. The samples were collected using polytetrafluoroethylene (PTFE) (Teflon) filters with a diameter of 47 millimetres (mm) and a pore size of 2 µm, specifically chosen for their chemical inertness, minimal moisture absorption, high efficiency in collecting PM, and overall stability in varying weather conditions. All filters were stored at 25 °C and 60% RH for 24 h before sampling [22], then weighed and fixed into the filter cassette of the sampler. After sampling, the filters were removed, transferred to the plastic string container, and stored for 24 h at 25 °C and 60% RH before they were weighed again [16,22]. A total of 156 (pre-monsoon: 54; monsoon: 59; post-monsoon: 59), 183 (pre-monsoon: 61; monsoon: 60; post-monsoon: 61), and 189 (pre-monsoon: 57; monsoon: 63; post-monsoon: 54) PM1 samples were collected in 2017, 2018, and 2019, respectively. The difference in the filter weights before and after sampling yielded the measured mass of PM1, which consequently allowed for the determination of the concentration by dividing the PM1 mass by the volume of air measured [22]. To avoid any potential contamination, strict necessary precautions were adopted throughout the study. Clean forceps were employed to handle the filters, and after each use, the forceps were cleaned using ethanol. The flow rate was assessed at regular intervals of 30 min to account for any variations in the airflow. Additionally, all glassware items underwent acid washing and were thereafter dried in an oven before their utilisation [23].
An automated weather monitoring station (Model: WMS10108, Hydro Flow Tech Engineer, Nashik, India) was used at the monitoring sites to monitor the meteorological parameters (temperature, relative humidity, and rainfall) [24] in a continuous mode in addition to collecting filter-based PM1 samples.

2.2. Surface Morphology and Elemental Composition of PM1

A section of 1 mm2 was excised from the exposed PM1 filter using scissors. The section was then mounted onto an aluminium plate (with Scotch Ruban Adhesive) and coated with carbon (Agar SEM Carbon Coater) to enhance its conductivity. Subsequently, it was kept in the designated area of the scanning electron microscope (SEM) (Model: EVO18, Zeiss, Jena, Germany) chamber under a magnification of 2000, resulting in a field size of 60 × 50 µm. Then, the images of this sample were captured. The instrument was operated with the probe current ranging between 50 µA and 100 µA, and the accelerating voltage varying between 0.5 and 30 kV. The samples intended for analysis were positioned at a distance of 20 mm from the (Si) detector. The X-ray detection was confined to approximately 0.1%, and the acquisition time for X-ray measurement was set at 60 s. The morphological parameters, including the shape and size of the particles, were measured manually by thoroughly analysing the entire set of complete photographs. For semi-quantitative (relative elemental concentration) elemental analysis, the PM1 particle was scanned using Energy Dispersive X-ray spectroscopy (EDX) (Model: X slafh-6i30, Bruker, Karlsruhe, Germany) attached a with scanning electron microscope, resulting in the acquisition of the EDX spectra. Various peaks were identified based on the acquired spectra, and the intensities of these peaks were measured using a computer program. Subsequently, the percentage of weight was calculated [25].
After weighing the exposed PM1 filter, the Teflon portion was separated and cut into two equal halves. One half was divided into small fragments and put into the digestion solution (mixture of 7, 2, 1, and 2 mL of HNO3, HCl, H2O2, and HF; volume made up to 50 mL by adding double distilled water). Then, the mixture was placed over a hot air oven at 180 °C for around two hours and filtered for analysis. Each blank filter was also digested in the same way. Then, 18 elements—including Al, Bi, Ca, Co, Cr, Cu, Fe, Ga, K, Mg, Mn, Na, Ni, Pb, Zn, As, Mo, and Ti—were quantified using Inductively Coupled Plasma-Optical Emission Spectrometry (ICP-OES) (Model:2100DV, Perkin Elmer, Waltham, USA) [22]. Multi-element standard solution (Cat No. 111355 & 109487) was used for QA/QC.
The water-soluble inorganic ionic components (WSIIC) of the exposed PM1 filter were measured using an ion chromatograph (Model: Dionex ICS-3000, Sunnyvale, CA, USA) [26]. The aqueous extract bottles were submerged overnight in 2% HNO3 before being treated with deionised water to remove any impurities. The determination of water-soluble ions was performed using separation columns: an Ion Pac-AS11-HC analytical column with a guard column, an ASRS-300 4 mm anion micro-membrane suppressor, 20 mM sodium hydroxide (NaOH; 50% w/w) as eluent, and deionised water as the regenerator. The cations (Na+, NH4+, K+, Ca2+, and Mg2+) and anions (Cl, SO42−, and NO3) were determined using a separation column with a guard column, a CSRS-300 suppressor, and 5 mM methanesulphonic acid (MSA) as eluent. Chromatography data were collected at 5 Hz, and chromatograms were processed using the Chromeleon® software package, ver. 7.3.2. Calibration standards have been prepared by the National Institute of Standards and Technology (NIST, Gaithersburg, MD, USA), traceable certified standards for the calibration of ion chromatograph [27]. Sampling artefacts (positive and negative) can impact the accuracy of measurements of semi-volatile aerosol components, and deionised water as the regenerator was prepared and used to detect anions with a pump flow rate of 1.5 mL/min. A 2.6 mM methanesulphonic acid (CH3SO3H) solution was used as an eluent for cation analysis with a pump flow rate of 1 mL/min. Ions were identified based on their retention time [3]. Working standards were prepared from standard stock solutions obtained from DIONEX, Sunnyvale, CA, USA [27].

2.3. Source Apportionment of PM1

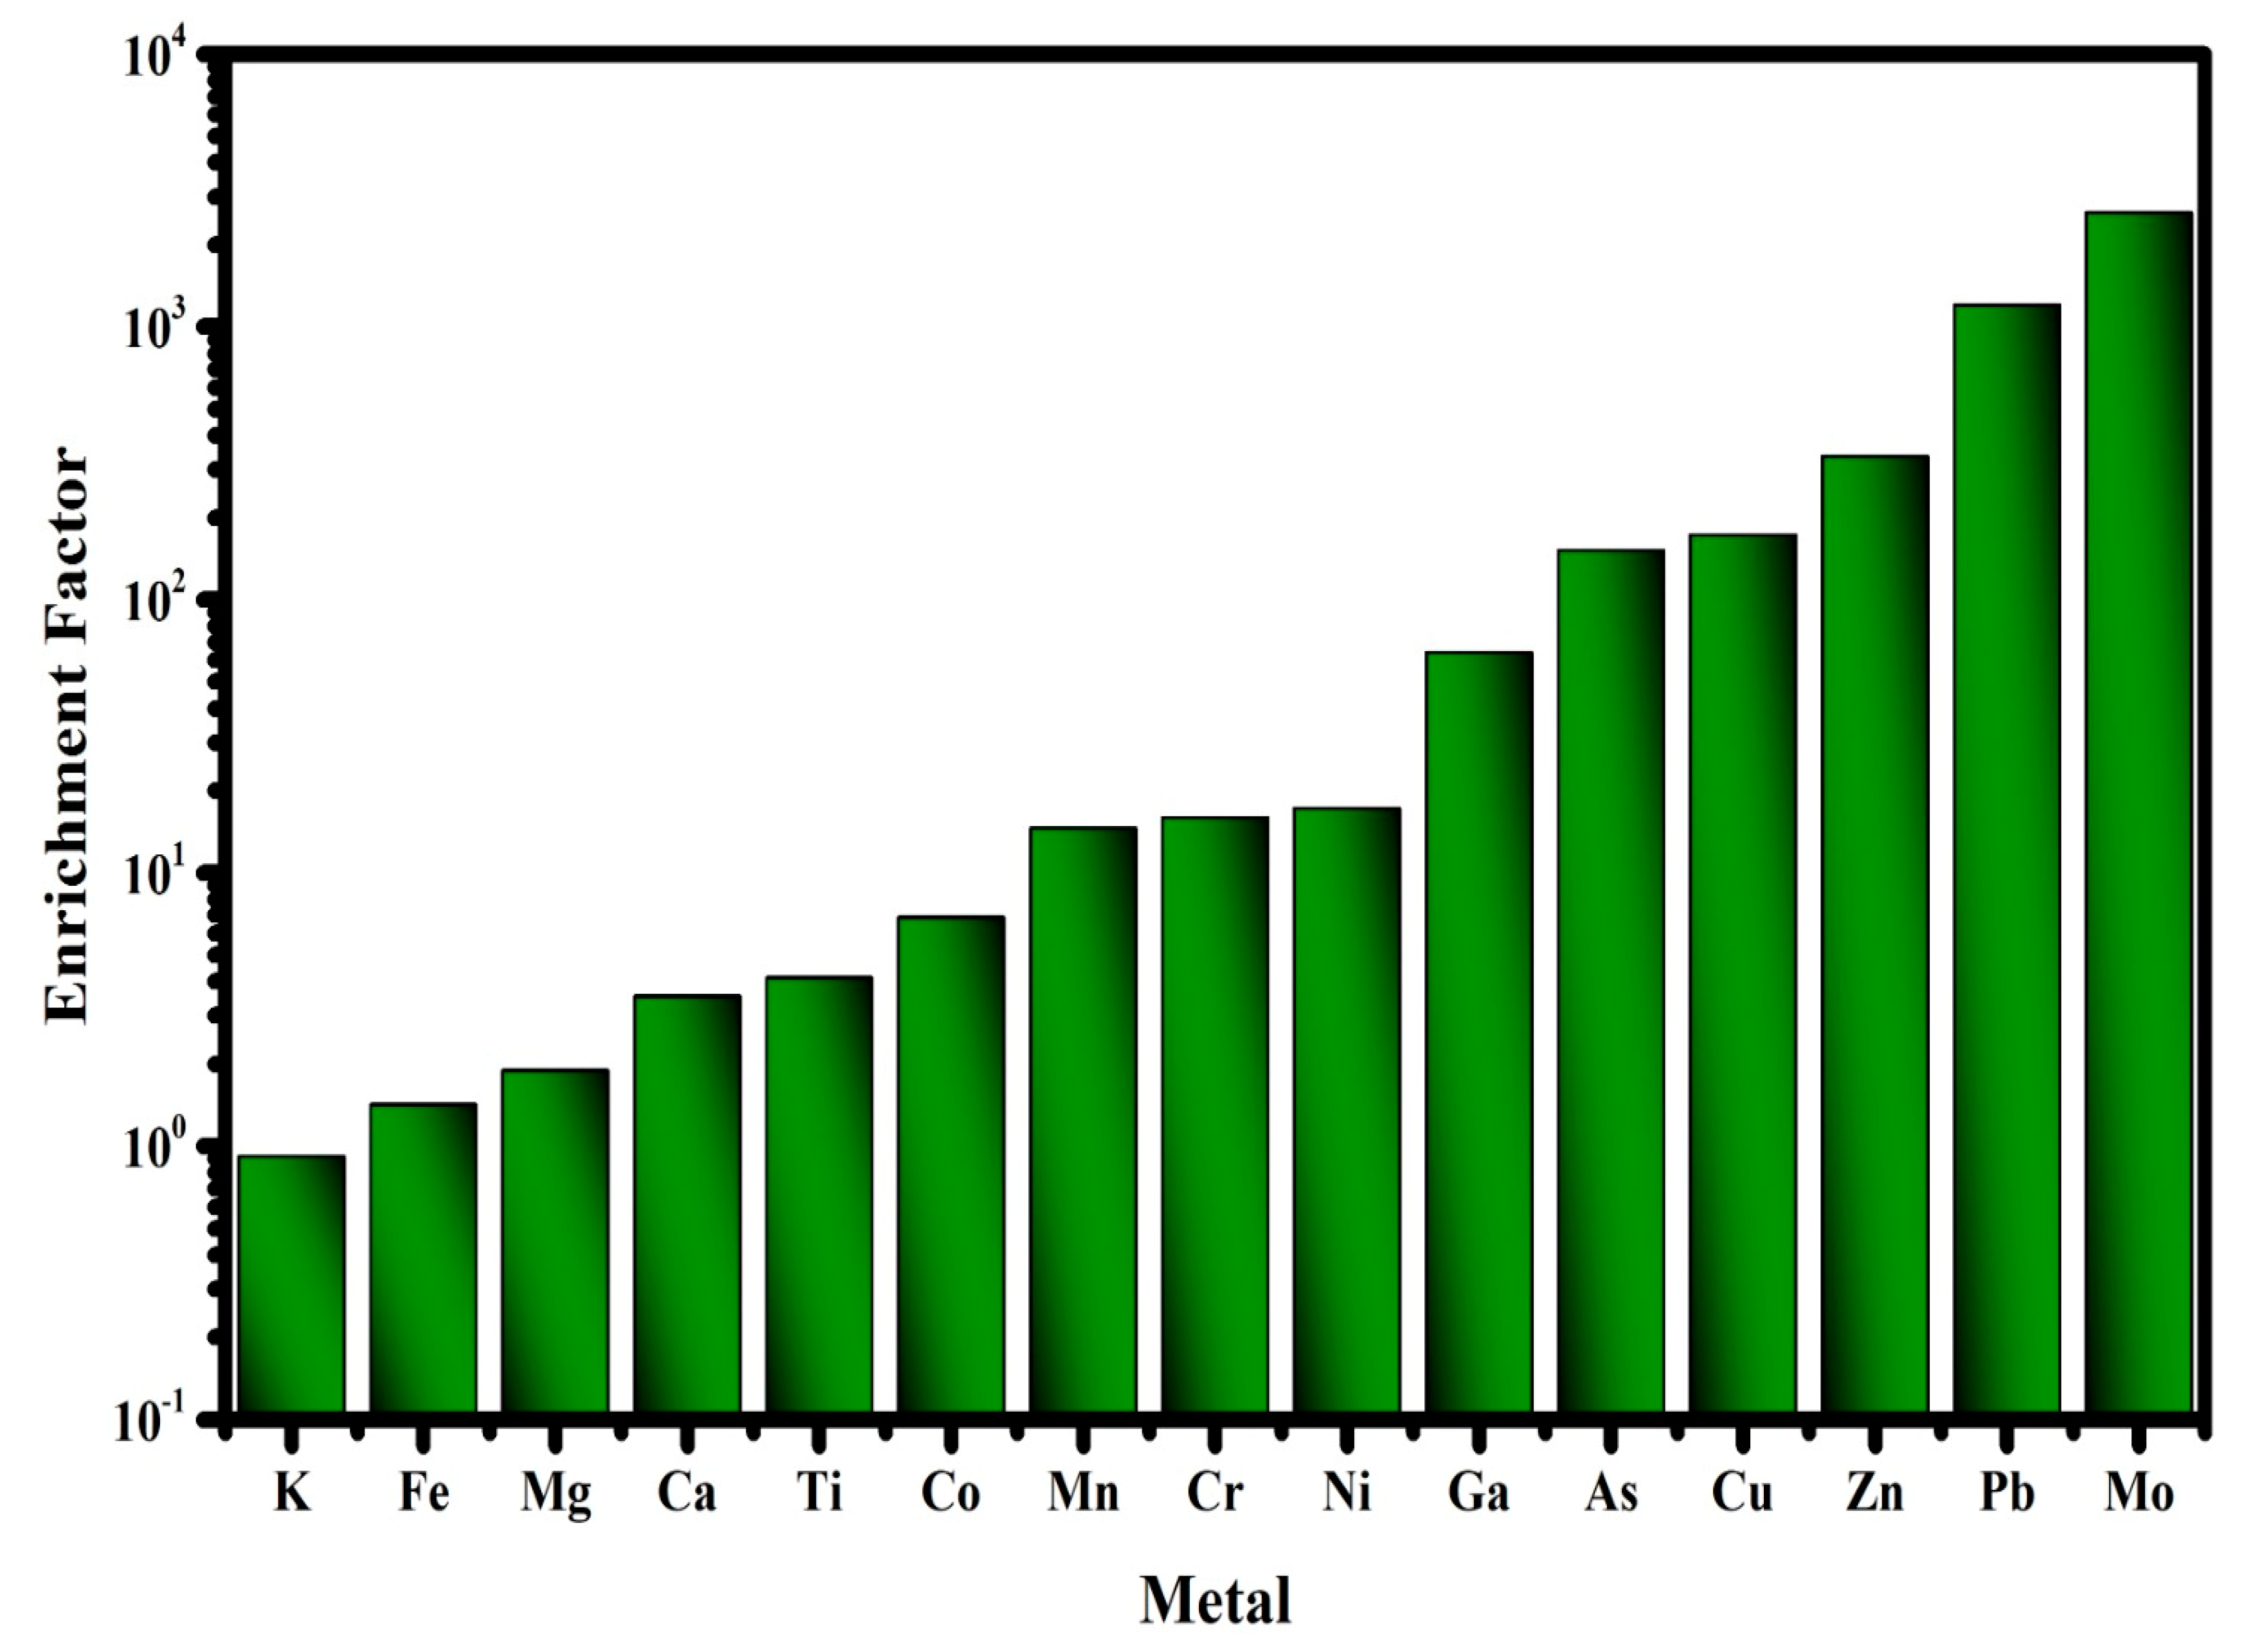
2.3.1. Enrichment Factor (EF) Analysis

It was conducted to determine the relative abundance of each element in the PM1 sample, as well as in crustal and non-crustal sources [25,28]. EF analysis is a valuable tool for determining whether ambient elemental species are anthropogenic or natural and is also used to measure how much an elemental species has been enriched in the ambient environment in comparison to its relative abundance in crustal and non-crustal sources. The EF of 15 elements (Al, AS, Ca, Cr, Cu, Fe, Ga, K, Mg, Mn, Mo, Ni, Pb, Ti, and Zn) was calculated following the method of Wang et al. [26]; i.e., EF = (Ex/Eref) air/(Ex/Eref) crust. Here, “Ex” refers to the targeting element, and “Eref” indicates the reference element. For this calculation, Al is used as the reference element. Elements with EF values below 10 were found to be less enriched, indicating that their emission sources were crustal (natural). However, the elements with EF values ranging between 10 and 100 and above 100 were found to be intermediately and highly enriched, but their origin was non-crustal (anthropogenic) [28,29].

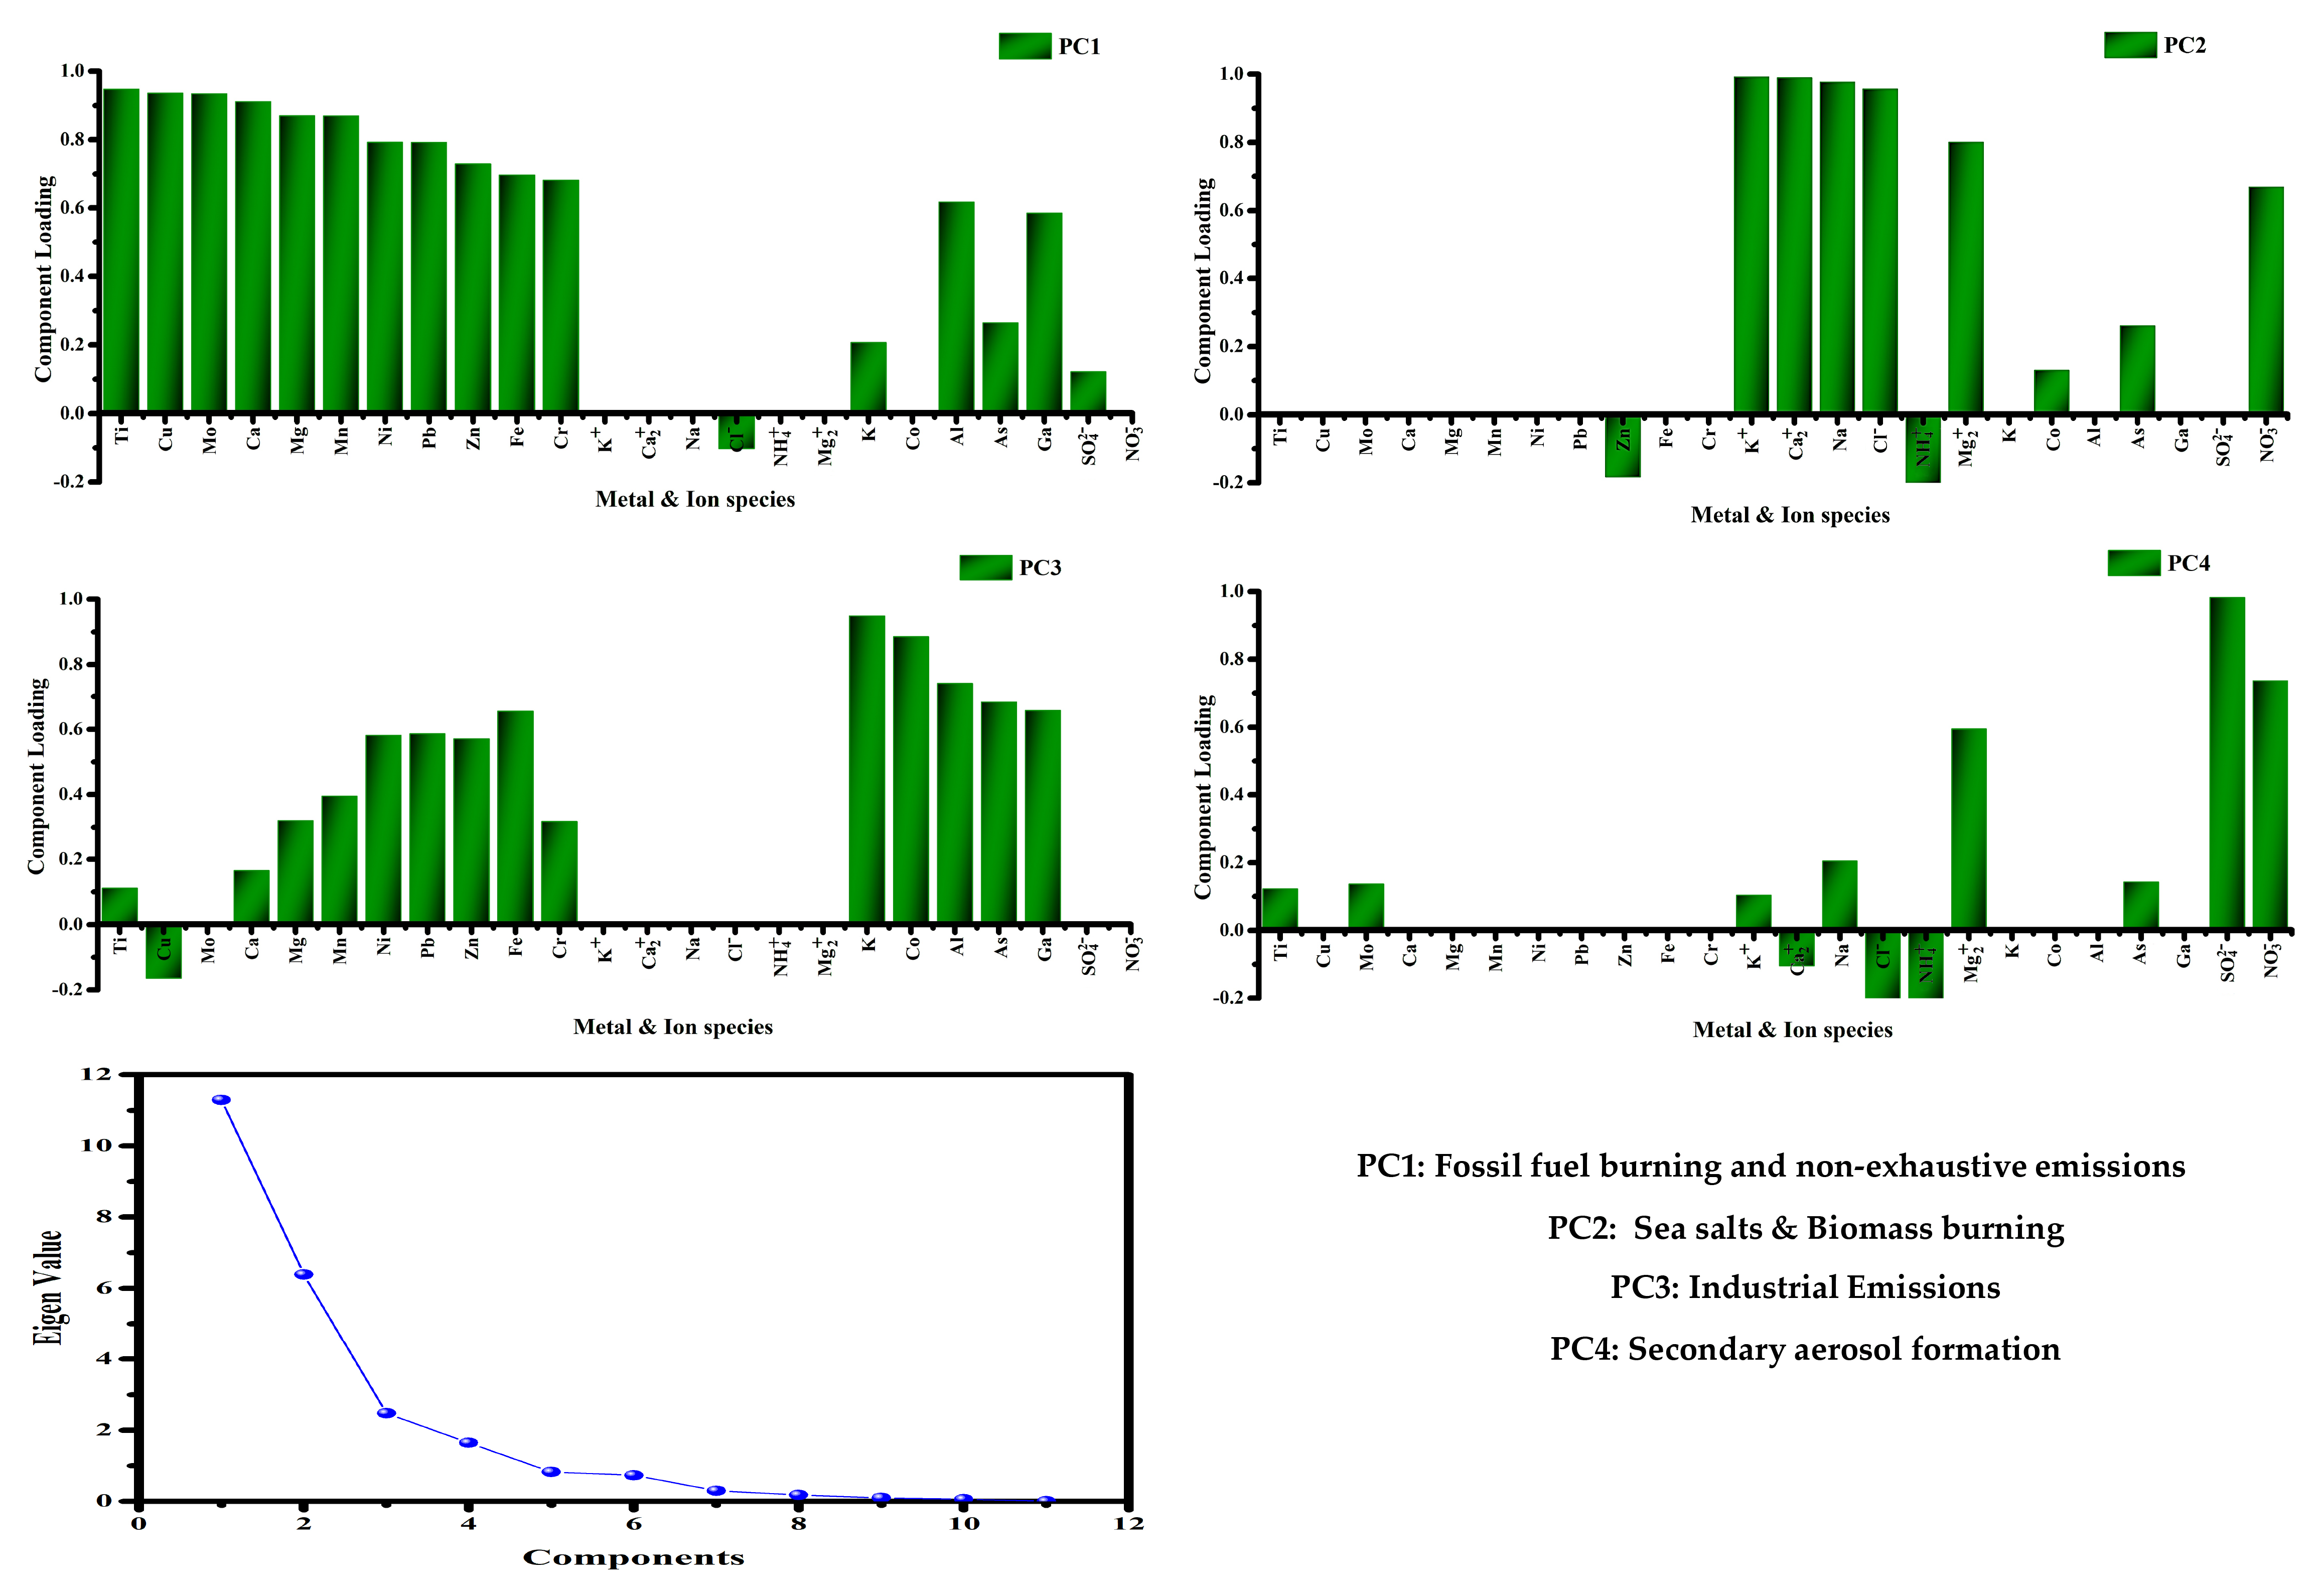
2.3.2. Principal Component Analysis (PCA)

PCA was applied to identify the emission sources of the metal component of PM1. It was performed using Kaiser’s normalisation and the Varimax rotated factor matrix approach, which is based on the orthogonal rotation condition [22]. PCA is a statistical tool that explains the variance of a large amount of data with inter-correlated variables and transforms them into a smaller dataset of independent variables called principal components (PCs). PCs with eigenvalues greater than 1 (>1) were selected. Varimax rotation was employed to ensure that each variable was maximally correlated with one PC and had minimal associations with the other components. Both the results of the ICP-OES and the ion chromatograph were taken for PCA analysis.

2.4. Statistical Analysis

Box and whisker plots were drawn using Sigma Plot (ver. 12.5) to illustrate the distribution of data in terms of the lower quartile, median, upper quartile, minimum, and maximum value in order to identify seasonal variation in the PM1 concentration. The Shapiro–Wilk test was used to determine the normality of all datasets. The distribution was considered normal based on p values above 0.05 (significance level). The seasonal quantitative change of elements and ions in PM1 was then evaluated using a one-way ANOVA and Duncan’s multiple range tests as post hoc analyses. These statistical tests were carried out using the SPSS software (SPSS Inc., ver. 21.0, Chicago, IL, USA).

3. Results and Discussion

3.1. Meteorological Conditions at the Sites

Table 1 summarises the meteorological data at different monitoring sites. The temperature at the monitoring site varied between 16.2 ± 0.4 and 33.9 ± 0.2 °C during the entire study period. The highest maximum mean temperature (33.9 ± 0.2 °C) was recorded during the monsoon season of 2019 and the lowest (26.9 ± 0.4 °C) during the post-monsoon season of 2019. The Relative Humidity (RH) level over Malda in the post-monsoon season varied between 51 ± 0.8% and 91.3 ± 0.3% between 2018 and 2019. The total rainfall was the highest (942.2 mm) during the monsoon season of 2017. During the study period, the wind’s direction was primarily northwest during the pre-monsoon season, with average wind speeds of 2.2 ms−1. During the monsoon season of the entire study period, the major wind direction was east–south, with average wind speeds of 2.5 ms−1. Throughout the post-monsoon season, the dominant wind direction was northwest, with an average wind speed of 1.1 ms−1 (Figure 1). Such meteorological conditions might favour local source-based air pollution rather than long-range transport and/or dispersion [30].

3.2. Overview of PM1 Concentrations

The box and whisker plots in Figure 2 represent the 24 h average concentration of PM1, which was monitored at the monitoring sites of NH-34—within Malda (an urban sprawl in the Eastern Indo-Gangetic Basin of India) during the pre-monsoon (February–May), monsoon (June–September), and post-monsoon (October–January) seasons of the overall study period. The maximum average value of the PM1 concentration was determined during the post-monsoon, followed by the pre-monsoon and monsoon seasons (Figure 2). Its highest concentration was observed during the post-monsoon seasons of 2017, 2018, and 2019, measuring 196.4 ± 15.1, 133.8 ± 9.0, and 170.8 ± 6.4 µg m−3, respectively, with the upper quartile values of 254.4, 163.1, and 202.2 µg m−3. The highest monthly mean recorded during the post-monsoon seasons likely resulted from reduced dispersion due to low temperatures and the lowering of mixing height over the region [22,31]. Because of the lower mixing height, vertical dispersion is reduced in post-monsoon season; hence, PM is more likely to be trapped within the restricted mixing layer. More accumulation near the earth’s surface results in higher concentrations of PM during the post-monsoon season, when, in general, the nights are cooler, with less solar radiation and drier air [32]. The PM1 concentrations are highly dependent on the meteorological conditions and, as observable during the winter season in Kanpur, were 18 to 348 µg m−3 [33]. In Kanpur, Singh and Gupta [34] measured the PM1 concentrations during fog and non-foggy days and found that during fog, a higher concentration was observed (160.16 ± 37.70 µg m−3) in comparison to non-foggy conditions (132.87 ± 27.97 µg m−3). Halek et al. [35] reported that the PM1 concentration varied from 10.29 to 23.05 μg m−3 during the non-foggy conditions and 45.81 to 61.35 μg m−3 during the foggy conditions in Tehran, Iran. During foggy days, the temperature and wind speed are generally very low, leading to air stagnancy and the accumulation of pollutants nearer to the emission sources rather than transport and/or dispersion occurring. Therefore, the PM1 concentration is probably high on foggy days [34,35].
However, its concentration was lowest—i.e., 64.1 ± 5.2, 49.4 ± 5.0, and 52.3 ± 3.2 µg m−3—during the monsoon season of the overall study period, with upper quartile values of 84.8, 63.5, and 75.1 µg m−3, respectively (Figure 2); this is due to the washout of particles during rainy conditions, as has also been suggested by others [22,31,36]. The linear regression result demonstrated a negative correlation between the total rainfall (independent variable) and PM1 concentration (dependent variable) during the monsoon season of the overall study period. Based on the linear regression, it is observed that a 1 unit increase in the total rainfall results in a decrease of 0.41 units of PM1. The coefficient of determination (r2) is 0.1011, which means that 10.11% of the total variation in the PM1 concentration is explained by the total rainfall (Figure S1). This finding is consistent with a previous study by Khan et al. [28], which reported that the PM1 concentration was negatively correlated with rainfall; this might be because of the significant wet removal processes caused by rain.

3.3. Morphology and Relevant Elements of PM1

SEM is used to understand the morphology of PM1, and the SEM results are shown in Figure 3. Based on their diameter, the SEM images demonstrated that the majority of the particles belonged to the fine fraction (≤1.0) variety. Natural particles include plant fragments, spores, and soil dust (minerals), all possessing irregular forms and rough surfaces. The anthropogenic particles comprise shoot particles and fly ash, which are clustered, smooth, cylindrical, and spherical (Figure 3A–C). The semi-quantitative elemental analysis of PM1 through EDX was characteristic, with matrix elements such as C, O, Pb, S, Ga, P, K, Zn, Ni, Cu, Fe, Co, Mn, Ca, Si, Cr, Na, and Al. The average weight percentage of these elements demonstrated that it varied from a high of 45.7 ± 3.0% for C to a low of 0.05 ± 0.01% for Cr. The weight percentage decreasing trends among the elements were observed as C > O > Pb > S > P > K > Ga > Zn > Ni > Cu > Fe > Co > Si > Mn > Al > Na > Ca and Cr. The results of the bar graph based on the one-way ANOVA showed that the weight percentage of C, O, and Pb recorded a significant variation compared to the other elements (Figure 3D). The natural particles are irregular in shape and contain a maximum amount of C and O elements [25]. However, soot particles (anthropogenic particles) can be randomly chained, powdery, dense, and clustered; they primarily consist of Pb, Ga, C, and Zn, whose main sources are due to the combustion of petroleum-based fuels, gasoline, and diesel. Fly ash (anthropogenic particle) is predominantly spherical, has a smooth surface, and contains Si, S, and O, along with variable quantities of Fe and Ni. Usually, fly ash is emitted from the combustion of coal and biomass [37]. These findings are consistent with the results of the SEM examination of PM, which revealed that inorganic or anthropogenic particles are aggregated in nature [38].
The ICP-OES analysis showed that 16 elements (Al, As, Ca, Co, Cr, Cu, Fe, Ga, K, Mg, Mn, Mo, Ni, Pb, Ti, and Z) were present at measurable levels in the exposed PM1 filter, while Bi and Na were mainly below the detection limit. The average concentration of elements ranged between 0.0009 ± 0.0005 and 0.9 ± 0.5 μg m−3 during the post-monsoon season of the overall study periods, with K (0.92 ± 0.48 μg m−3) being the highest, followed by Al (0.773 ± 0.27 μg m−3), Fe (0.731 ± 0.19 μg m−3), Ca (0.705 ± 0.08 μg m−3), and Mg (0.219 ± 0.05 µg m−3). In the pre-monsoon season, the average concentration was found to be highest for Ca (0.808 ± 0.06 µg m−3), followed by Al (0.567 ± 0.10 µg m−3), Fe (0.501 ± 0.09 µg m−3), Mg (0.252 ± 0.02 µg m−3), and K (0.231 ± 0.02 µg m−3), but lowest for Co (0.0003 ± 0.0002 µg m−3), followed by Ga (0.006 ± 0.001 µg m−3) and Ni (0.009 ± 0.001 µg m−3). The monsoon season had the lowest average concentration of all elements, with the exception of Ca (0.296 ± 0.03 μg m−3) and Ga (0.003 ± 0.001μg m−3). The one-way ANOVA results demonstrated non-significant variation in the concentration of these elements during the different seasons of the study period. However, there was a significant variation in the concentration of Ca during the pre-monsoon season compared to the monsoon and post-monsoon seasons (Figure 4). The present study agrees with a previous study by Caggino et al. [6], in which the elemental concentration was measured using ICP-OES analysis by considering only 14 elements (Al, Ca, Cd, Cr, Cu, Fe, K, Mg, Mn, Na, Ni, Pb, Ti, and Zn), and Ca had the highest mean concentration, followed by Fe, Al, and K. They also reported that vehicular exhaust, fuel combustion, and other industrial processes might be the major sources of these elements in PM1 in urban areas. The 16 detectable elements (Al, AS, Ca, Co, Cr, Cu, Fe, Ga, K, Mg, Mn, Mo, Ni, Pb, Ti, and Zn) are linked to motor vehicle operations, including burning fossil fuels, braking, tyres, and road surface deterioration, as well as the re-suspension of road dust [39,40]. Additionally, industrial activities and thermal power plants might be the sources of these elements in PM1 [40]. Popek et al. [41] reported that Pb and Cr mainly originated from vehicular exhaustive activities, and Fe, Mn, Ni, and Zn from non-exhaustive activities. Slezakova et al. [42] noted the predominantly crustal origins of metals like Mg, Al, Si, and Ca and the anthropogenic origins of metals like S, Mn, Zn, Pb, P, K, and Cr.

3.4. Ion Composition of PM1

Table 2 shows the seasonal variation in the PM1’s water-soluble inorganic ionic concentration (WSII). The sum of ΣWSII (Na+, K+, Ca2+, Mg2+, NH4+, Cl, SO42−, and NO3) accounted for about 10–30% of the total particle mass concentration (Table 2). Overall, the highest level of ΣWSIIs was detected in the post-monsoon season, followed by the pre-monsoon and monsoon seasons, and ranged between 6 and 30, 4 and 22, and 4 and 12 µg m−3, respectively. The concentrations of NH4+, SO42−, and NO3 in PM1 were 2.4 ± 0.8, 6.3 ± 1.7, and 2.8 ± 1.2 µg m−3 during the pre-monsoon seasons; 3.6 ± 0.4, 2.6 ± 1.3, and 0.86 ± 0.4 µg m−3 in the monsoon season; 2.1 ± 1.1, 3.4 ± 1.8, and 2.4 ± 0.9 µg m−3 in the post-monsoon season, respectively, during the study period (Table 2). NH4+ was the dominant cation among all of the detectable cations in PM1. The NH4+ concentration in PM1 is comparable with that in previous Indian studies [36,43,44], which reported that high relative humidity (RH) in the air may have contributed to the higher level of NH4+ during the monsoon by encouraging the conversion of NH3+ to NH4+. However, SO42− and NO3 anions were dominant in the PM1. This result is in congruence with a previous study by Zhang et al. [40]. They reported that the concentration of these anions was found to be maximum in PM1, possibly due to the influence of local and regional emissions from industrial, vehicular, and agricultural sources. The SO42− and NO3 concentrations were also similar to the other Indian studies [19,36,43]. In a previous study, the author stated that these ions were believed to be created by the chemical interactions of oxides of sulphur and nitrogen and discharged into the environment [45]. The SO42− content in PM1 outweighed the NO3 content. This outcome is consistent with the preceding research [19]. The ionic fraction of PM1 was dominated by the water-soluble anion during the pre-monsoon (9.9 µg m−3) and post-monsoon seasons (9.6 µg m−3), likely as a result of the gas phase to particle conversion [46]. The washout of PM1 containing water-soluble anion may be the cause of the low concentration during the monsoon season (4.1 µg m−3) [46].
The burning of coal at the local, regional, and global levels may be the cause of the high levels of Cl during the post-monsoon season. This is supported by the high Cl-/K+ and low Cl/SO42− ratios (i.e., 1.4 vs. 0.3), which indicate coal combustion as a dominant source. Additionally, the Cl/Na+ ratio at the study site in Malda was found to be >0.9, which indicates the influence of a thermal power plant and urban dust. These findings are consistent with previous research [47]. The NH4+, Na+, Ca2+, and K+ cations were predominant in PM1 over the study period. The emission of ammonia from agricultural operations may contribute to the higher concentration of NH4+. The burning of biomass may be the cause of the high K+ levels [40]. Additionally, the prevalence of Na+, Ca2+, and Mg2+ in PM1 indicates their crustal origin [40]. Furthermore, the area is connected to the Indo-Gangetic Plain (IGP); therefore, it is assumed that the advection of air masses rich in pollutants from the IGP may have also impacted the ionic levels of PM1 at the study site.
In addition to the ionic characteristics, elemental ratios are often used to determine the possible sources of PM1 [48,49,50]. A Zn/Pb ratio of between 0.3 and 0.4 indicates vehicular emissions, while a ratio of approximately 1.2 indicates oil burning. The Zn/Pb ratio in the PM1 samples in the Malda region was calculated as 1.21, which demonstrates the impact of vehicle emissions and oil combustion. This is consistent with previous research [50]. The calculated Fe/Al ratio (0.48) is far above the indicator for crustal sources (0.44–1.9), indicating its anthropogenic nature. Similarly, the Zn/Al ratio in the study (0.17 to 0.78), which is higher than those for the crustal origin (0.05–0.14), also indicates anthropogenic sources.

3.5. Pollution Source Apportionment

3.5.1. Enrichment Factor Analysis

The enrichment factor (EF) analysis of 15 elements revealed that Mo, Pb, Cu, Zn, Cr, As, Ga, and Ni were highly enriched, indicating their non-crustal origin, while Ca, Fe, K, and Mg were less enriched and could be ascribed to natural sources (Figure 5). Mo and Pb had the highest EF values (>1000), suggesting that they were highly enriched and may have originated from fossil fuel combustion, vehicular emissions, and non-exhaustive activities at the site. Zn, Cr, Ga, Cu, As, Co, Mn, and Ni were moderately enriched (10 < EF < 100). The high enrichment of these elements suggests that their dominant sources are non-crustal and various forms of pollution. Among them, vehicle emissions, fuel combustion, and coal combustion are major sources of these trace elements in the studied region. Ti, Ca, Fe, K, and Mg were less enriched as their EF values were less than 5, indicating that a natural source (airborne dust) could be their possible emission source. These findings are consistent with a previous study [40]. They determined the EF of 14 elements and reported that Na, Mg, Cr, Mn, Fe, Ni, Cu, Zn, Sb, S, Ti, Sr, and Pb were found to be enriched in PM1 and could be attributed to anthropogenic sources, while Ca was less enriched and could be derived from natural sources.

3.5.2. Principle Component Analysis

The elemental concentrations obtained from the ICP-OES analysis were reduced using a multivariate dimension reduction method called principal component analysis (PCA). Varimax orthogonal rotation was used to identify the possible sources or principal components. The concentrations of 15 elements (Zn, Ca, Mg, Ni, Cr, Mn, Fe, Pb, Ti, Cu, Mo, As, Ga, K, and Al) were used as the input to reduce the high-dimensional dataset to a low-dimensional dataset by identifying and extracting the principal components of the data that capture the most substantial patterns of variation in the data. A component with an eigenvalue greater than one is considered a major emission source and is shown in Figure 6.
As one element can be emitted from multiple sources, most elements have numerous emission sources. Therefore, knowledge of the interrelation between the different sources of the elements in the surroundings of the sampling site is essential for the interpretation of the PCA results. Hence, in the present study, identification of the sources using ground-truthing and the existing literature has been conducted. Based on the PCA (Figure 6), four major components were extracted using the varimax rotation method, with a cumulative variance of 91%. The source with the highest loading factor among the principal components was considered the representative element. PC1 was dominated by the elements Ti (0.95), Cu (0.94), Mo (0.93), Ca (0.91), Mg (0.87), Ni (0.79), Pb (0.79), Zn (0.73), and Cr (0.68), followed by Al and Ga. PC2 was dominated by the ionic species K+ (0.99), Ca2+ (0.99), Na+ (0.98), Cl (0.96), NH4+ (−0.90), and Mg2+ (0.80). PC3 was dominated by the metals Co (0.89), Al (0.74), As (0.68), Ga and Fe (0.66), and slightly by Mn (0.4), Pb (0.59), and Zn (0.57). PC4 showed moderate loading of Cl (−0.27), Na+ (0.21), NH4+ (−0.44), and Mg2+ (0.59), with a dominance of SO42− (0.98) and NO3 (0.74) ions (Figure 6).
The PCA indicated that exhaustive and non-exhaustive emissions from road traffic over the region accounted for 47% of the total variance. Moderate loading of Al (0.62) and Ga (0.58) is also recorded in PC1, whereas K and As showed the lowest loading in vehicular exhaustive and non-exhaustive emissions. Ni, Mn, Fe, Cr, and As are used as indicators of oil burning, whereas Al, Sc, Se, Co, As, and Ti are indicators of coal burning [46]. Previous studies have also reported the emission of Fe, Cu, Ca, Ba, Cr, and Zn from non-exhaust sources, which include particles released into the air from brake wear, tyres wear, road surface wear, and the re-suspension of road dust during on-road vehicle usage [51]. Asphalt pavement is also reported as a source of Cu, Cr, Ni, As, Pb, Ca, Mg, Al, Fe, and Si [52]. Considering the dominance of major heavy metals and the vicinity of the National and State Highway in Malda, vehicular activity appears to be the dominant source of metals in PM1.
The second observed component (PC2) was dominated by ionic species, such as K+ (0.99), Ca2+ (0.99), Na+ (0.98), Cl (0.96), NH4+ (−0.90), and Mg2+ (0.80). Mg2+ and Na+ are exclusive sea salt tracers. However, these ions are also present in the soil, and during dust episodes, the soil contribution cannot be neglected. The dominance of NH4+ and K+ signifies the source of biomass burning emissions. In India, people burn biomass, such as cow dung, rice straw, and wood, to cook meals or to keep themselves warm. Stubble burning could also be a reason for the high loading of NH4+ and K+ in this factor. The presence of NO3 in this source concurs with the possibility of its marine origin through the condensation of HNO3.
Industrial activity was identified as the third most dominant source of PM1, accounting for 10.3% of the variance (PC3). The component was dominated by metals, including K (0.95), Co (0.89), Al (0.74), and moderately by Ga (0.66), As (0.68), Pb (0.59), Ni (0.58), Fe (0.66) and Zn (0.57), with the lowest loading of Cr, Ti, Mg, Ca, and Cu. This pattern indicates PM1 originating from fossil fuel burning. Ga and As are mainly used in light-emitting diodes, and Ga is used in optoelectronics, telecommunication devices, and glass industries, suggesting that the industrial activities in Malda—where there are more than 100 industries, including glass manufacturing—could be significant sources.
The dominance of SO42− (0.94) and NO3 (0.74) with moderate loading of NH4+ (−0.44), and Mg (0.59) was recorded in PC4, indicating a secondary origin of aerosol at the site. Secondary aerosol forms in the atmosphere via gas-to-particle conversion. Secondary nitrate is formed in the atmosphere through the oxidation of NOx in low-temperature conditions, while high-temperature and strong solar radiations favour the formation of secondary sulphates through photochemical reactions. NH4+ and SO42− have also been used as markers for biomass burning and coal combustion.

4. Conclusions

The present study was conducted in India in order to comprehend, for the first time, the pollution load and characteristics of PM1, focusing on the monitoring, characterisation, and source identification of ambient PM1. Three years (2017 to 2019) of PM1 monitoring data revealed that the post-monsoon season had the highest concentrations, followed by the pre-monsoon season, and the monsoon season had the lowest concentration. SEM-EDX analyses showed that natural particles have irregular shapes, rough surfaces, and enrichment with C, O, Si, and Al elements. In contrast, anthropogenic particles are cylindrical, clustered, spherical, and round, with smooth surfaces, mainly including F, Pb, S, K, Ga, and Zn elements. ICP-OES analysis revealed 16 elements in PM1, with K having the maximum average concentration, followed by Al, Fe, Ca, and Mg during the post-monsoon season. In the pre-monsoon season, Ca, followed by Al, Fe, Mg, and K, exhibited the highest concentration. The lowest elemental concentrations were observed during the monsoon season. Ion chromatography analysis of WSII concentrations showed that the three most common ions in Malda were NH4+, SO42−, and NO3; they collectively accounted for 30–60%, 24%, and 24–74% of the WSIIs in the pre–monsoon, and post–monsoon periods, respectively. PCA analysis demonstrated that vehicular exhaustive and non-exhaustive activities account for 47% of the PM1 emissions in Malda. Industrial activity throughout the region was the third most dominant source of PM1, accounting for 10.3% of the variance, while 26% were influenced by sea salt and biomass burning. The elevated level at the site could lead to a serious health hazard as these fine particles can easily absorbed into the blood through the alveoli. The dominance of carcinogenic elements like As, Ni, Ga, Cr, and Co in PM1 could lead to higher toxicity compared to large particles.
Several advanced analyses, such as positive matrix factorisation (PMF) and the chemical mass balance (CMB) receptor model, can be used for the emission source apportionment of PM1 in Malda, and possibly other urban areas, to improve source identification. PM1 is associated with many detrimental effects on human health—including chronic obstructive pulmonary disease (COPD), pneumonia, autism spectrum disorder, hypertension, lung cancer, and even death—which are not investigated in the present manuscript and are considered as the future scope of the present study. The findings of this study enhanced our knowledge about PM1 characterisation and its emission sources in Malda. Furthermore, this research also provides a unique dataset for targeted legislation for improving air quality. Therefore, PM1 requires more focus in future research and should be included in national standards and health guidelines. This research article will help to identify an overview of the PM1 pollution status, its characterisation, and emission sources and to encourage future researchers who will work in this field.

Supplementary Materials

The following supporting information can be downloaded at: https://www.mdpi.com/article/10.3390/su152014894/s1, Figure S1: Simple linear regression between total rainfall (mm) and PM1 concentration (µg m−3).

Author Contributions

Conceptualisation, S.D. and A.S.; methodology, S.D. and D.P.; software, S.D. and R.M.; validation, S.D., A.S. and R.P.; formal analysis, R.M.; investigation, A.S.; resources, A.S.; data curation, S.D. and R.M.; writing—original draft preparation, S.D.; writing—review and editing, S.D., A.S., M.M., A.R., R.P., M.C., D.P., F.C. and A.A.; visualisation, S.D., R.M., M.M., A.R., R.P., M.C., D.P., A.A. and A.S.; supervision, A.S.; project administration, A.S.; funding acquisition, F.C. and A.S. All authors have read and agreed to the published version of the manuscript.

Funding

This research was financed by the Department of Science and Technology and Biotechnology (DST&BT). We wish to thank the Government of West Bengal for providing such financial support in the form of a research project (Memo No.: 207 (Sanc.)-ST/P/S&T/5G-14/2018, dated: 20 February 2019), and the Ministry of Science and Higher Education in Poland under Agreement No. 6967/IA/2019 of 9 July 2019.

Institutional Review Board Statement

Not applicable.

Informed Consent Statement

Not applicable.

Data Availability Statement

Requests for data supporting reported results should be addressed to A.S.

Acknowledgments

All the authors thankfully acknowledge the funding sources and the facilities provided by the authorities of the University of Gour Banga, Malda, India; Carl Zeiss India, Kolkata, India; CSIR—National Physical Laboratory, New Delhi, India; and Birla Institute of Technology, Mesra, Ranchi, India.

Conflicts of Interest

The authors declare no conflict of interest.

References

  1. Kelly, F.J.; Fussell, J.C. Air pollution and public health: Emerging hazards and improved understanding of risk. Environ. Geochem. Health 2015, 37, 631–649. [Google Scholar] [CrossRef] [PubMed]
  2. Balakrishnan, K.; Dey, S.; Gupta, T.; Dhaliwal, R.S.; Brauer, M.; Cohen, A.J.; Stanaway, J.D.; Beig, G.; Joshi, T.K.; Aggarwal, A.N. The impact of air pollution on deaths, disease burden, and life expectancy across the states of India: The Global Burden of Disease Study 2017. Lancet Planet. Health 2019, 3, e26–e39. [Google Scholar] [CrossRef] [PubMed]
  3. Gupta, L.; Bansal, M.; Nandi, P.; Habib, G.; Raman, R.S. Source apportionment and potential source regions of size-resolved particulate matter at a heavily polluted industrial city in the Indo-Gangetic Plain. Atmos. Environ. 2023, 298, 119614. [Google Scholar] [CrossRef]
  4. Holland, N.A.; Fraiser, C.R.; Sloan, R.C.; Devlin, R.B.; Brown, D.A.; Wingard, C.J. Ultrafine particulate matter increases cardiac ischemia/reperfusion injury via mitochondrial permeability transition pore. Cardiovasc. Toxicol. 2017, 17, 441–450. [Google Scholar] [CrossRef] [PubMed]
  5. Talbi, A.; Kerchich, Y.; Kerbachi, R.; Boughedaoui, M. Assessment of annual air pollution levels with PM1, PM2.5, PM10 and associated heavy metals in Algiers, Algeria. Environ. Pollut. 2018, 232, 252–263. [Google Scholar] [CrossRef]
  6. Caggiano, R.; Sabia, S.; Speranza, A. Trace elements and human health risks assessment of finer aerosol atmospheric particles (PM1). Environ. Sci. Pollut. Res. 2019, 26, 36423–36433. [Google Scholar] [CrossRef]
  7. Trippetta, S.; Sabia, S.; Caggiano, R. Fine aerosol particles (PM1): Natural and anthropogenic contributions and health risk assessment. Air Qual. Atmos. Health 2016, 9, 621–629. [Google Scholar] [CrossRef]
  8. India Should Monitor PM1, the Least Visible Particle in Air. Available online: https://www.downtoearth.org.in/news/india-should-monitor-pm1-the-least-visible-particle-in-air-68293 (accessed on 5 August 2023).
  9. Ganguly, T.; Selvaraj, K.L.; Guttikunda, S.K. National Clean Air Programme (NCAP) for Indian cities: Review and outlook of clean air action plans. Atmos. Environ. X 2020, 8, 100096. [Google Scholar] [CrossRef]
  10. Moreno-Ríos, A.L.; Tejeda-Benítez, L.P.; Bustillo-Lecompte, C.F. Sources, characteristics, toxicity, and control of ultrafine particles: An overview. Geo. Front. 2022, 13, 101147. [Google Scholar] [CrossRef]
  11. Schraufnagel, D.E. The health effects of ultrafine particles. Exp. Mol. Med. 2020, 52, 311–317. [Google Scholar] [CrossRef]
  12. Kasimov, N.S.; Vlasov, D.V.; Kosheleva, N.E. Enrichment of road dust particles and adjacent environments with metals and metalloids in eastern Moscow. Urban Clim. 2020, 32, 100638. [Google Scholar] [CrossRef]
  13. Klimont, Z.; Kupiainen, K.; Heyes, C.; Purohit, P.; Cofala, J.; Rafaj, P.; Borken-Kleefeld, J.; Schöpp, W. Global anthropogenic emissions of particulate matter including black carbon. Atmos. Chem. Phys. 2017, 17, 8681–8723. [Google Scholar] [CrossRef]
  14. Mandal, M.; Das, S.; Roy, A.; Rakwal, R.; Jones, O.A.; Popek, R.; Agrawal, G.K.; Sarkar, A. Interactive relations between plants, phyllosphere microbial community, and particulate matter pollution. Sci. Total Environ. 2023, 890, 164352. [Google Scholar] [CrossRef] [PubMed]
  15. Xue, W.; Xue, J.; Mousavi, A.; Sioutas, C.; Kleeman, M.J. Positive matrix factorization of ultrafine particle mass (PM0.1) at three sites in California. Sci. Total Environ. 2020, 715, 136902. [Google Scholar] [CrossRef] [PubMed]
  16. Rai, P.; Chakraborty, A.; Mandariya, A.K.; Gupta, T. Composition and source apportionment of PM1 at urban site Kanpur in India using PMF coupled with CBPF. Atmos. Res. 2016, 178, 506–520. [Google Scholar] [CrossRef]
  17. Jaiprakash. Chemical characterization of PM1.0 aerosol in Delhi and source apportionment using positive matrix factorization. Environ. Sci. Pollut. Res. 2017, 24, 445–462. [Google Scholar] [CrossRef]
  18. Tao, M.; Liu, Q.; Schauer, J.J. Direct measurement of the deposition of submicron soot particles on leaves of Platanus acerifolia tree. Environ. Sci. Process. Impacts 2022, 24, 2336–2344. [Google Scholar] [CrossRef]
  19. Prakash, J.; Lohia, T.; Mandariya, A.K.; Habib, G.; Gupta, T.; Gupta, S.K. Chemical characterization and quantitative assessment of source-specific health risk of trace metals in PM1.0 at a road site of Delhi, India. Environ. Sci. Pollut. Res. 2018, 25, 8747–8764. [Google Scholar] [CrossRef]
  20. Levy, J.I.; Hanna, S.R. Spatial and temporal variability in urban fine particulate matter concentrations. Environ. Pollut. 2011, 159, 2009–2015. [Google Scholar] [CrossRef]
  21. National Highways Authority of India, Ministry of Road Transport and Highways. Memo No- 63013/1/2017-18/OTHS/Misc/103/1461; NHAI’s Office: Malda, India, 2017.
  22. Chakraborty, A.; Gupta, T. Chemical characterization and source apportionment of submicron (PM1) aerosol in Kanpur region, India. Aerosol Air Qual. Res. 2010, 10, 433–445. [Google Scholar] [CrossRef]
  23. Gupta, T.; Chakraborty, A.; Ujinwal, K.K. Development and performance evaluation of an indigenously developed air sampler designed to collect submicron aerosol. Ann. Natl. Acad. Eng. 2010, 7, 189–193. [Google Scholar]
  24. Lagouvardos, K.; Kotroni, V.; Bezes, A.; Koletsis, I.; Kopania, T.; Lykoudis, S.; Mazarakis, N.; Papagiannaki, K.; Vougioukas, S. The automatic weather stations NOANN network of the National Observatory of Athens: Operation and database. Geosci. Data J. 2017, 4, 4–16. [Google Scholar] [CrossRef]
  25. Usman, F.; Zeb, B.; Alam, K.; Huang, Z.; Shah, A.; Ahmad, I.; Ullah, S. In-depth analysis of physicochemical properties of particulate matter (PM10, PM2. 5 and PM1) and its characterization through FTIR, XRD and SEM–EDX Techniques in the Foothills of the Hindu Kush Region of Northern Pakistan. Atmosphere 2022, 13, 124. [Google Scholar] [CrossRef]
  26. Tao, M.; Xu, Y.; Gong, J.; Liu, Q. Estimation of aerosol acidity at a suburban site of Nanjing using the machine learning method. J. Atmos. Chem. 2022, 79, 141–151. [Google Scholar] [CrossRef]
  27. Sharma, S.K.; Kumar, M.; Gupta, N.C.; Saxena, M.; Mandal, T.K. Characteristics of ambient ammonia over Delhi, India. Meteorol. Atmos. Phys. 2014, 124, 67–82. [Google Scholar] [CrossRef]
  28. Tasića, M.; Rajšića, S.; Tomaševića, M.; Mijića, Z.; Aničića, M.; Novakovića, V.; Markovic, D.M.; Markovic, D.A.; Lazic, L.; Radenkovic, M.; et al. Assessment of air quality in an urban area of Belgrade, Serbia. In Environmental Technologies: New Developments, 1st ed.; Burcu Özkaraova Güngör, E., Ed.; I-Tech Education and Publishing: Vienna, Austria, 2008; pp. 209–244. [Google Scholar]
  29. Wang, X.; Sato, T.; Xing, B.; Tamamura, S.; Tao, S. Source identification, size distribution and indicator screening of airborne trace metals in Kanazawa, Japan. J. Aerosol Sci. 2005, 36, 197–210. [Google Scholar] [CrossRef]
  30. Chaudhary, I.J.; Rathore, D. Dust pollution: Its removal and effect on foliage physiology of urban trees. Sustain. Cities Soc. 2019, 51, 101696. [Google Scholar] [CrossRef]
  31. Khan, J.Z.; Sun, L.; Tian, Y.; Shi, G.; Feng, Y. Chemical characterization and source apportionment of PM1 and PM2.5 in Tianjin, China: Impacts of biomass burning and primary biogenic sources. J. Environ. Sci. 2021, 99, 196–209. [Google Scholar] [CrossRef]
  32. Pérez, I.A.; García, M.Á.; Sánchez, M.L.; Pardo, N.; Fernández-Duque, B. Key Points in Air Pollution Meteorology. Int. J. Environ. Res. Public Health 2020, 17, 8349. [Google Scholar] [CrossRef]
  33. Rajput, P.; Mandaria, A.; Kachawa, L.; Singh, D.K.; Singh, A.K.; Gupta, T. Chemical characterisation and source apportionment of PM1 during massive loading at an urban location in Indo-Gangetic Plain: Impact of local sources and long-range transport. Tellus B Chem. Phys. Meteorol. 2016, 68, 30659. [Google Scholar] [CrossRef]
  34. Singh, D.K.; Gupta, T. Source apportionment and risk assessment of PM1 bound trace metals collected during foggy and non-foggy episodes at a representative site in the Indo-Gangetic plain. Sci. Total Environ. 2016, 550, 80–94. [Google Scholar] [CrossRef]
  35. Halek, F.; Kianpour-Rad, M.; Kavousirahim, A. Seasonal variation in ambient PM mass and number concentrations (case study: Tehran, Iran). Environ. Monit. Assess. 2010, 169, 501–507. [Google Scholar] [CrossRef]
  36. Reyes-Villegas, E.; Panda, U.; Darbyshire, E.; Cash, J.M.; Joshi, R.; Langford, B.; Di Marco, C.F.; Mullinger, N.; Acton, W.J.F.; Drysdale, W.; et al. PM1 composition and source apportionment at two sites in Delhi, India across multiple seasons. Atmos. Chem. Phys. 2021, 21, 11655–11667. [Google Scholar] [CrossRef]
  37. Mohammadi-Moghadam, F.; Heidari, M.; Farhadkhani, M.; Sadeghi, M.; Forouzandeh, S.; Ahmadi, A.; Khabaz-Ghasemi, E. TSP, PM10, PM2.5, and PM1 in ambient air of Shahr-e Kord, Iran’s rooftop; levels, characterisation and health risk assessment of particles-bound heavy metals. Int. J. Environ. Anal. Chem. 2022, 102, 5356–5372. [Google Scholar] [CrossRef]
  38. Popek, R.; Fornal-Pieniak, B.; Chyliński, F.; Pawełkowicz, M.; Bobrowicz, J.; Chrzanowska, D.; Piechota, N.; Przybysz, A. Not only trees matter—Traffic-related PM accumulation by vegetation of urban forests. Sustainability 2022, 14, 2973. [Google Scholar] [CrossRef]
  39. Onat, B.; Sahin, U.A.; Akyuz, T. Elemental characterization of PM2.5 and PM1 in dense traffic area in Istanbul, Turkey. Atmos. Pollut. Res. 2013, 4, 101–105. [Google Scholar] [CrossRef]
  40. Zhang, Y.; Lang, J.; Cheng, S.; Li, S.; Zhou, Y.; Chen, D.; Zhang, H.; Wang, H. Chemical composition and sources of PM1 and PM2.5 in Beijing in autumn. Sci. Total Environ. 2018, 630, 72–82. [Google Scholar] [CrossRef]
  41. Popek, R.; Łukowski, A.; Bates, C.; Oleksyn, J. Accumulation of particulate matter, heavy metals, and polycyclic aromatic hydrocarbons on the leaves of Tilia cordata Mill. in five Polish cities with different levels of air pollution. Int. J. Phytoremediat. 2017, 19, 1134–1141. [Google Scholar]
  42. Slezakova, K.; Pereira, M.C.; Alvim-Ferraz, M.C. Influence of tobacco smoke on the elemental composition of indoor particles of different sizes. Atmos. Environ. 2009, 43, 486–493. [Google Scholar] [CrossRef]
  43. Deshmukh, D.K.; Deb, M.K.; Tsai, Y.I.; Mkoma, S.L. Water soluble ions in PM2.5 and PM1 aerosols in Durg city, Chhattisgarh, India. Aerosol Air. Qual. Res. 2011, 11, 696–708. [Google Scholar] [CrossRef]
  44. Deshmukh, D.K.; Tsai, Y.I.; Deb, M.K.; Mkoma, S.L. Characterization of dicarboxylates and inorganic ions in urban PM10 aerosols in the eastern central India. Aerosol Air. Qual. Res. 2012, 12, 592–607. [Google Scholar] [CrossRef]
  45. Seinfeld, J.H.; Pandis, S.N. From air pollution to climate change. In Atmospheric Chemistry and Physics, 2nd ed.; John Wiley & Sons, Inc.: New York, NY, USA, 1998; p. 1326. [Google Scholar]
  46. Li, Q.; Yang, Z.; Li, X.; Ding, S.; Du, F. Seasonal characteristics of sulfate and nitrate in size-segregated particles in ammonia-poor and-rich atmospheres in Chengdu, Southwest China. Aerosol Air Qual. Res. 2019, 19, 2697–2706. [Google Scholar] [CrossRef]
  47. Luo, L.; Zhang, Y.Y.; Xiao, H.Y.; Xiao, H.W.; Zheng, N.J.; Zhang, Z.Y.; Xie, Y.J.; Liu, C. Spatial distributions and sources of inorganic chlorine in PM2.5 across China in winter. Atmosphere 2019, 10, 505. [Google Scholar] [CrossRef]
  48. Kayee, J.; Sompongchaiyakul, P.; Sanwlani, N.; Bureekul, S.; Wang, X.; Das, R. Metal concentrations and source apportionment of PM2.5 in Chiang Rai and Bangkok, Thailand during a biomass burning season. ACS Earth Space Chem. 2020, 4, 1213–1226. [Google Scholar] [CrossRef]
  49. Kong, S.; Ji, Y.; Lu, B.; Chen, L.; Han, B.; Li, Z.; Bai, Z. Characterization of PM10 source profiles for fugitive dust in Fushun-a city famous for coal. Atmos. Environ. 2011, 45, 5351–5365. [Google Scholar] [CrossRef]
  50. Matawle, J.L.; Pervez, S.; Dewangan, S.; Shrivastava, A.; Tiwari, S.; Pant, P.; Deb, M.K.; Pervez, Y. Characterization of PM2.5 source profiles for traffic and dust sources in Raipur, India. Aerosol Air Qual. Res. 2015, 15, 2537–2548. [Google Scholar] [CrossRef]
  51. Adamiec, E.; Jarosz-Krzemińska, E.; Wieszała, R. Heavy metals from non-exhaust vehicle emissions in urban and motorway road dusts. Environ. Monit. Assess. 2016, 188, 369. [Google Scholar] [CrossRef]
  52. Murphy, L.U.; Cochrane, T.A.; O’Sullivan, A. The influence of different pavement surfaces on atmospheric copper, lead, zinc, and suspended solids attenuation and wash-off. Water Air Soil Pollut. 2015, 226, 232. [Google Scholar] [CrossRef]
Figure 1. Represents the wind rose plots that exhibit the distribution of wind speed and direction during the pre-monsoon (February–May), monsoon (June–September), and post-monsoon (October–January) seasons of the entire study period in Malda (an urban sprawl in the Eastern Indo-Gangetic Basin of India), within which several small-scale industries are present, alongside two national highways (NH-34 and NH-81) and one state highway (SH-10). A total of 03 monitoring sites were selected in NH-34 at suitable locations based on human interferences and population density on building rooftops and 20 to 25 m away from the direct pollution sources.
Sustainability 15 14894 g001
Figure 2. Box and whisker plots display 24 h average PM1 concentrations monitored alongside NH-34 in Malda (an urban sprawl in the Eastern Indo-Gangetic Basin of India) during the pre-monsoon (February–May), monsoon (June–September), and post-monsoon (October–January) seasons of three consecutive years (2017–2019).
Sustainability 15 14894 g002
Figure 3. (AC) Scanning electron microscopy (SEM) analysis of exposed PM1 filters; (D) weight percentages of elements deposited on the exposed PM1 samples. Values represent mean ± SE. Bars showing different letters indicate variation according to Duncan’s test at p < 0.05.
Sustainability 15 14894 g003
Figure 4. Seasonal variation of elements in PM1 obtained through Inductively Coupled Plasma-Optical Emission Spectrometry (ICP-OES). Values represent mean ± SE. Bars showing different letters indicate variation according to Duncan’s test at p < 0.05.
Sustainability 15 14894 g004
Figure 5. Enrichment factor (EF) analysis of elements deposited on the exposed PM1 filter at Malda (an urban sprawl in the Eastern Indo-Gangetic Basin of India) during the study period.
Sustainability 15 14894 g005
Figure 6. The loading of elements in the first, second, third, and fourth principal components (PC1, PC2, PC3, and PC4), which were used to identify the major emission sources of PM1 elements in the ambient atmosphere of Malda (a prominent urban sprawl in the Eastern Indo-Gangetic Basin of India).
Sustainability 15 14894 g006
Table 1. Different meteorological parameters were monitored in the monitoring sites of the study area during the pre-monsoon (February–May), monsoon (June–September), and post-monsoon (October–January) seasons of three consecutive years (2017–2019). Values represent mean ± SE. Different letters indicate variation according to Duncan’s test at p < 0.05.
YearsSeasonsMean
Temperature (°C)
Mean Relative Humidity (%)Total Rainfall
(mm)
MaxMinMaxMin
2017Pre-monsoon31.4 ± 0.3 b20.2 ± 0.4 b85.8 ± 0.7 b52.8 ± 1.5 c174.9 b
Monsoon33.7 ± 0.1 a27 ± 0.08 a89.7 ± 0.3 a71.1 ± 0.8 a942.2 a
Post-Monsoon26.5 ± 0.4 c17.6 ± 0.5 c91.2 ± 0.4 a60.5 ± 1.0 a, b180.7 b
2018Pre-monsoon31.3 ± 0.2 b20.1 ± 0.3 b87.5 ± 0.6 b53.3 ± 1.3 b411.8 b
Monsoon33.8 ± 0.1 a27.0 ± 0.1 a89.9 ± 0.3 a71.1 ± 0.8 a740.1 a
Post-Monsoon27.7 ± 0.3 c16.2 ± 0.4 c88.2 ± 0.5 b51 ± 0.8 b79.8 c
2019Pre-monsoon32 ± 0.3 b20.2 ± 0.4 a,b86.8 ± 0.6 b51.1 ± 1.3 c261.7 b
Monsoon33.9 ± 0.2 a26.9 ± 0.1 a90.8 ± 0.3 a72.1 ± 0.9 a918 a
Post-Monsoon26.9 ± 0.4 c16.9 ± 0.4 c91.3 ± 0.3 a65.4 ± 1.1 b157.5 b
Table 2. Variations in Water-Soluble Inorganic Ion (WSII) concentration in PM1 during the pre-monsoon (February to May), monsoon (June to September), and post-monsoon (October to January) seasons over the overall study period. Values represent mean ± SE. Different letters indicate variation according to Duncan’s test at p < 0.05.
Total IonsPre-MonsoonMonsoonPost Monsoon
Concentration
(µg m−3)
Concentration
(µg m−3)
Concentration
(µg m−3)
Na+0.9 ± 0.9 a0.36 ± 0.2 b1.3 ± 1.0 a
NH4+2.4 ± 0.8 a, b3.6 ± 0.4 a2.1±1.1 b
K+0.8 ± 0.4 a0.33 ± 0.2 a1.3 ± 0.8 a
Mg2+0.1 ± 1.0 a0.03 ± 0.0 b0.15 ± 0.04 a
Ca2+0.9 ± 0.5 b0.18 ± 0.1 b2.6 ± 0.5 a
Cl0.8 ± 1.0 b0.69 ± 0.6 b1.5 ± 0.8 a
NO32.8 ± 1.2 a0.86 ± 0.4 b2.4 ± 0.9 a
SO42−6.3 ± 1.7 a2.6 ± 1.3 b3.4 ± 1.8 b
Total Anions (R)9.94.19.6
Total Cations (r)5.14.510.4
Ionic ratio (r/R)0.51.11.1
Disclaimer/Publisher’s Note: The statements, opinions and data contained in all publications are solely those of the individual author(s) and contributor(s) and not of MDPI and/or the editor(s). MDPI and/or the editor(s) disclaim responsibility for any injury to people or property resulting from any ideas, methods, instructions or products referred to in the content.

