Abstract
In this paper, the groundwater environment in the farmland area around a traditional industrial park in Shifang City, southwest China, was taken as the research object. Geostatistical methods with GIS technology were adopted to analyze the spatial distribution of conventional pollutants and heavy metals in groundwater and to evaluate potential ecological risks. Chemical oxygen demand (CODMn) and ammonia nitrogen (NH3-N) distributions showed poor continuity and apparent spatial differentiation, which were primarily attributed to intensive anthropogenic activities (e.g., industrial discharges). The total relative hardness of (TH), SO42−, and Cl− were uniformly affected by external factors, with little spatial differentiation. Concentrations of total phosphorus (TP), TH, SO42−, and Cl− followed an approximately normal distribution; the peak values of detected concentrations appeared in the frequency distribution range, while CODMn and NH3-N did not. Groundwater showed enrichment for various heavy metals, mainly Zn and Cu, with apparent spatial differentiation in Cr and Cu, consistent with external interference. The correlation coefficients of Cr–Cu and Cu–Pb were 0.693 and 0.629 (p < 0.01), respectively, indicating similar pollution sources. The single-factor pollution index for groundwater was Ni > Pb > Mn > Zn > Cu > Cr. Cu had a moderate potential ecological risk. The six heavy metals’ average integrated potential ecological risk index (RI) revealed that mild pollution accounted for 96.2% of the investigation area. Overall, the traditional industrial park poses a mild ecological risk to the shallow groundwater in the surrounding farmland.
1. Introduction
Groundwater is a vital water resource essential in supporting economic and social development in China. Groundwater resources account for nearly 20% of the total water supply in China, and 60% of the country’s population uses groundwater as a source of drinking water, making it an essential strategic resource for supporting sustainable development [1]. Groundwater pollution due to inappropriate development and utilization can harm human health and activities and seriously impact the ecological environment and industrial and agricultural production [2,3,4]. There are various types of enterprises in traditional industrial parks; however, industrial correlation is not high. It is challenging to recycle resources among enterprises, and the problem of “high input, low output, and high pollution” is prominent. In traditional industrial parks, wastewater leakage can lead to the deterioration of groundwater quality. The complexity, stealthiness, and latency of groundwater-bearing zones make it difficult to determine the extent of groundwater contamination it spreads to the area surrounding the industrial park [5,6,7].
Extensive research has focused on the characterization, measurement, and remediation techniques of heavy metal pollution in groundwater. Moreover, the evaluation model of groundwater pollution was also developed to address the problem [8,9,10]. Sadeghi et al. [11] studied a groundwater site around the Morgan Energy Company in Ardabil, Iran, and determined the metal content using inductively coupled plasma mass spectrometry (ICP-MS). Long et al. [12] evaluated the shallow groundwater of Dongting Lake Plain using ICP-MS to detect arsenic and 12 other heavy metals (such as aluminum, nickel, manganese, cobalt, barium, iron, zinc, and copper). Hepburn et al. [13] developed a groundwater heavy metal source separation method based on the statistical classification of data and XRF sediment analysis, which identifies the primary sources of heavy metals in groundwater and assists in the local assessment and management of groundwater contamination. Kaur et al. [14] studied heavy metals in groundwater from the Solan and Shimla districts of Himachal Pradesh, India, using atomic absorption spectrophotometry and compared the results with the guideline values recommended by the World Health Organization. These studies indicate that high-precision heavy metal concentration measurement technology has been widely adopted as the basis for heavy metal assessment.
Groundwater pollution risk evaluation combining GIS and specialized models is significant and widely used in environmental protection, resource protection, and disaster prediction [15,16]. Due to groundwater’s wide distribution, many scholars have adopted geostatistical methods for related research [17,18]. Based on a variable correlation analysis and R-cluster analysis, Cao et al. [19] applied multivariate and geostatistical analyses to compare the spatial distribution of heavy metals, such as As, Cd, Cr, Cu, and Pb. They determined the sources of contamination in the groundwater of Wuzhong City. Tabandeh et al. [20] evaluated the spatial distribution of total dissolved solids in the shallow aquifers in Lenjanat and Babol-Amol with different hydrogeological characteristics using the geostatistical interpolation method, lognormal ordinary kriging method, inverse distance weighting method, ordinary kriging method, pan-kriging method, and the disjunctive kriging method. Wang et al. [21] analyzed the spatial distribution of groundwater quality in Longkou City, Shandong Province, using a semivariable function and kriging interpolation. They concluded that agricultural and residential land use substantially affects the spatial heterogeneity of local groundwater quality. Since traditional statistical methods neglect samples’ spatial location and direction, it is difficult to distinguish between different spatial patterns. Pashahkha et al. [22] used GS+ software and ArcGIS to statistically analyze agricultural groundwater quality in the Miandoab Plain. Pollutant ion concentration and pH were measured, and based on the analysis of indicators such as effective salinity, potential salinity, sodium adsorption rate, and conductivity, a salinity hazard zoning map was obtained. Wu et al. [23] used a combination of correlation analysis, principal component analysis (PCA), hierarchical cluster analysis (HCA), and multivariate linear regression (MLR) to explore the sources and influencing factors of shallow groundwater pollution in Yan’an City. They pointed out that mineral dissolution/precipitation and human input are the primary sources of groundwater physicochemical indicators and trace elements. It can be seen that the combination of GIS with geostatistical analysis and other pollution assessment methods has been widely applied in various regions. However, how to adopt different combination methods according to local conditions still requires targeted research based on the unique characteristics of different regions.
Evaluation indices are often combined with the latest GIS technology to draw evaluation zoning maps and obtain more intuitive results. Arslan et al. [24] studied the groundwater of the northern Develi Closed Basin for the determination of lead, zinc, chromium, copper, cadmium, arsenic, and boron by using the heavy metal pollution index (HPI), and results showed that the groundwater interacted with highly altered volcanic rocks, leading in a more severe level of pollution. Faisal et al. [25] applied permeable reactive barriers to remediate contaminated groundwater and theoretically modeled the PRBs technology to characterize the migration of pollutants through the barriers in time and space. In addition, spatial interpolation in GIS technology has been successfully used in groundwater pollution assessment and prediction analysis. Aryafar et al. [26] used sequential Gaussian simulations to assess the qualitative characteristics of groundwater in the Birjand Plain, fit the optimal theoretical model to experimental variograms, and plotted geostatistical estimates for each groundwater variable. Ma et al. [27] utilized a GIS-based methodology coupled with raster reclassification, spatial interpolation, spatial joint superposition, and other procedures to successfully differentiate the shallow groundwater hydrochemical facies of the shallow aquifer near Fuyang City, Anhui Province. Chaturvedi et al. [28] obtained a good correlation between the HI (US EPA Hazard Index) and m-HPI using universal multivariate non-linear regression modeling, which has been successfully used to predict the HI for water samples. In general, the appropriate selection of difference values and the visual display of distribution maps are crucial for presenting the results of groundwater pollution assessment.
In the context of ecological environment protection as a prerequisite for economic development, how to renovate the existing old industrial parks is an urgent problem which needs to be solved. Assessing the groundwater environment of the existing traditional industrial park and its surrounding areas within the scope of administrative divisions can provide a decision-making basis for government departments’ next planning work. A specific industrial park in Shifang City, located in southwestern China, has been established for a long time without reasonable environmental planning. It belongs to an unplanned traditional industrial park. This article takes the groundwater environment in the surrounding farmland of the park as the research object. Through on-site exploration and water quality sampling analysis, geological statistical analysis is combined with potential ecological risk assessment to visually present the results of groundwater pollution and heavy metal spatial distribution in the area. On the basis of reviewing and analyzing existing relevant research, this study combines statistical analysis to comprehensively evaluate potential ecological risks and presents the results through GIS technology and intuitive evaluation maps. This not only provides a decision-making basis for the renovation of traditional industrial parks in this region, but it also provides reference methods for the planning and design of other similar traditional industrial park renovations. Therefore, this study has strong technical theoretical support and practical significance.
2. Materials and Methods
2.1. Study Area
The study area (Figure 1) is located in Shuangsheng Town, 6 km north of Shifang City, and lies at 104°09′ east longitude and 31°10′ north latitude. The area’s elevation is 545.598 m, with a northwest-to-southeast trend, an average elevation of 507 m, and an area of 28 km2. The study area is classified as a plain with green coverage in agricultural or forest areas accounting for most of the area. As a typical agroecological environment, the ecological environment is dominated by agricultural farming, mainly wheat, rice, and legume crops. The Shuangsheng Town Industrial Park is located in the center of the research area, with 31 chemical enterprises. Due to its early establishment and lack of scientific planning and guidance, its development is relatively extensive. In addition, there have been many environmental issues, such as unreasonable industrial structure, low resource utilization rate, and a fragile regional ecological environment.
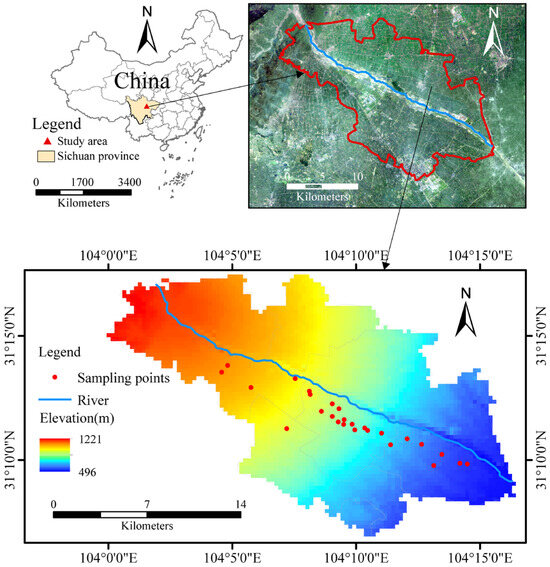
Figure 1.
Location of the study area.
2.2. Groundwater Sample Collection and Analysis
The sampling points in this study area were distributed in a band (Figure 1). The industrial park is located in the north-central part of the study area, adjacent to the Shiting River in the north, with farmland in the southern part of the industrial park. Three groundwater samples were obtained from the northwestern part of the study area, which is an agricultural area and does not contain production enterprise sites. The Economic and Technological Development Zone between the northern farmland and industrial parks, covering a large area, is composed of high-tech enterprises. There are no production enterprise sites. Three groundwater samples were collected at the edge of the development zone. The adjacent Shiting River includes many longstanding chemical enterprises. A total of 15 groundwater samples were taken along the periphery of the industrial park. In addition, five groundwater samples were taken from the farmland area to investigate groundwater contamination in farmland around the industrial park and in the downstream river.
The groundwater samples used in this study were taken from the lower micro-pressurized aquifer, with well depths ranging from about 20 to 40 m. A total of 26 groundwater samples were collected, and the distribution of sampling sites is shown in Figure 1. GPS determined the location of each sampling site. The shallow groundwater was mainly taken from agricultural irrigation wells and industrial wells in the area, and the water samples were filtered on a 0.45 μm mixed-fiber filter membrane within 24 h and stored in a refrigerator at 4 °C until testing. Cl− and SO42− were determined using ion chromatography (HJ 84-2016) [29], and ammonia nitrogen (NH3-N) was determined using Nessler’s reagent spectrophotometry (HJ 535-2009) [30]. In addition, the chemical oxygen demand (CODMn) was determined using the dichromate method (GB/T 11914-1989) [31], while the total phosphorus (TP) and total hardness (TH) were determined by alkaline potassium persulfate digestion ultraviolet spectrophotometry (GB/T 11894-1989) [32]. The traditional industrial park contains chemical enterprises, and electroplating wastewater contains a large amount of heavy metal ions such as Zn, Ni, Cr, Cu, Mn, Pb, etc. Therefore, these heavy metal ions were determined by ICP-MS (Varian) with a test precision better than 0.5%.
2.3. Methods of Risk Assessment
Single-factor index evaluation, also known as single index evaluation, compares the representative value of the concentration of each pollution factor with the standards, item by item. The index with the worst single evaluation result was used to define the category of water quality. The evaluation results can intuitively reflect the water quality for the class or categories of factors exceeding the standard. It can determine the main pollution factors and areas [33,34,35]. The formula is as follows:
where Pi is the water quality index of the single factor i. Ci is the measured pollutant concentration in water (mg/L). Coi is the evaluation criterion for pollutant i. Pi ≤ 1 indicates that this water quality factor meets the water quality standards; 1 < Pi ≤ 2 indicates that the water is mildly polluted; 2 < Pi ≤ 3 indicates moderate water pollution; and Pi > 3 indicates severe water contamination. Although this index is easy to calculate, it evaluates individual pollution factors independently, and the evaluation results may not reflect the overall quality of the water environment, which may lead to large deviations. To fully reflect the quality of a water body, it is also necessary to calculate an integrated evaluation index.
The potential ecological risk index (RI) method, defined by Hakanson [36], is a method for evaluating the properties and environmental behavior of heavy metal contaminants from a sedimentological perspective and is calculated using the following formula:
where RI is the integrated potential ecological risk index for multiple heavy metals. is the potential ecological pollution index of individual heavy metals. Ti is the toxic response factor for a single heavy metal (i), which is an indispensable parameter for RI value calculation. This index was first proposed by Hakanson, and after years of development, the number of toxic response factors available for calculation has gradually increased. The values of toxic response factors in this study were calculated by Xu et al. [37], including Zn = Mn = 1, Cu = Pb = Ni = 5, and Cr = 2. is the pollution index of heavy metals, where and are the detection concentration and the evaluation standard concentration (mg/L) of the heavy metal (i), respectively. The potential risk classification criteria for heavy metals in groundwater are listed in Table 1.

Table 1.
Classification standard of potential ecological risk of heavy metals in groundwater (mg/L).
2.4. Statistics and Analyses
Descriptive statistical analyses, such as the mean, coefficient of variation, and tests for a normal distribution of heavy metals in groundwater, were performed using SPSS 25.0. Groundwater heavy metal element contents were interpolated using ArcGIS 10.5 to obtain the spatial distributions.
3. Results and Discussion
3.1. Descriptive Statistics of Contaminants
Contaminant indicator contents in the 26 groundwater samples collected from the study area are shown in Table 2. The average contents of six conventional pollutants, CODMn, NH3-N, TP, TH, SO42−, and Cl−, in the groundwater samples were 5.225, 0.785, 0.065, 487.405, 92.969, and 43.523 mg/L, respectively. By comparisons against standards of class 3 groundwater quality, the average contents of CODMn, NH3-N, and TH exceeded the standard requirements for all 26 sampling sites. The coefficient of variation can reflect the average degree of difference between sampling points [38,39]. As shown in Table 2, the mean coefficient of variation for the six conventional pollutants, in descending order, was NH3-N, CODMn, TP, Cl−, SO42−, and TH. The coefficients of variation for CODMn and NH3-N were 0.413 and 0.459, respectively, indicating moderate variation with large fluctuations, poor continuity, and large spatial variation. This variation is mainly due to intensive anthropogenic activities, such as industrial discharges. The coefficients of variation for TH, SO42−, and Cl− were 0.18, 0.219, and 0.278, respectively. These results indicated that these three pollutants are consistently affected by external influences, with little spatial differentiation and shared sources in the study area [40]. As determined by the Kolmogorov–Smirnov (K-S) test, which compares the cumulative frequency distribution of the sample data with a theoretical distribution, TP, TH, SO42−, and Cl− were normally distributed (p = 0.200, 0.065, 0.200, and 0.200, respectively) [41]. The p-values for the K-S tests for NH3-N and CODMn were both 0.019, indicating deviations from normality, showing spikes and skewness.
The average contents of the six heavy metals Zn, Ni, Cr, Cu, Mn, and Pb in the groundwater samples were 0.620, 0.047, 0.024, 0.511, 0.067, and 0.007 mg/L, respectively. By comparisons with the groundwater quality class 3 standards, only the Ni content in samples from 26 sampling points exceeded the standard with an exceedance rate of 46.2%. As shown in Table 2, the average degree of variation in the six heavy metals, in descending order, was Ni, Cr, Cu, Zn, Pb, and Mn. The coefficients of variation of Ni, Cr, and Cu were all greater than 0.4, and the coefficient of variation of Ni reached 1.124, indicating substantial variation. The fluctuation in the Ni content was significant, and continuity was low. This differed from the continuous distributions of heavy metals in shallow groundwater under natural soil, indicating significant external interference. The natural sources of heavy metals in groundwater include rock weathering, soil leaching, and atmospheric precipitation [42]. The Mn content is highest in the upper crust, with higher Cu, Mn, and Zn contents in gabbro and basalt, while Cr and Ni are usually higher in peridotite and serpentinite [43]. The coefficients of variation for Cr and Cu were 0.461 and 0.445, respectively, which is consistent with moderate variation with large fluctuations, poor continuity, and significant spatial variation. Intensive anthropogenic activities, such as industrial discharges, primarily induced changes. The coefficients of variation of Zn, Pb, and Mn in shallow groundwater were small at 0.265, 0.212, and 0.250, respectively. These three elements were more consistently affected by external influences with relatively little spatial differentiation, indicating that they may come from the same source in the study area. Groundwater in the study area generally showed enrichment for various heavy metals, mainly Zn and Cu. Pesticides, fertilizers, etc., may all be essential input sources of heavy metals in farmland, among which organic fertilizers contribute significantly to soil Zn and Cu, which is also a potential reason for the consistent distribution of Cu and Zn content in the sample sites [44,45]. In addition, the electroplating wastewater from industrial parks contains many heavy metal ions such as Cr, Zn, Cu, Ni, etc., which are directly or indirectly connected to the groundwater environment with the discharge of the three electroplating wastes [46]. The K-S test showed that Zn, Cr, Cu, and Mn were normally distributed, while Ni and Pb did not conform to normality and showed spikes and skewness.
Table 2.
Descriptive statistics of conventional contaminants and heavy metals.
Table 2.
Descriptive statistics of conventional contaminants and heavy metals.
| CODMn | NH3-N | TP | TH | SO42− | Cl− | Zn | Ni | Cr | Cu | Mn | Pb | |
|---|---|---|---|---|---|---|---|---|---|---|---|---|
| Minimum (mg/L) | 2.378 | 0.360 | 0.033 | 320.95 | 59.8 | 25.80 | 0.371 | 0.004 | 0.007 | 0.143 | 0.042 | 0.004 |
| Maximum (mg/L) | 8.890 | 1.550 | 0.120 | 617.68 | 137.0 | 67.60 | 0.959 | 0.182 | 0.048 | 0.988 | 0.091 | 0.01 |
| Mean (mg/L) | 5.225 | 0.785 | 0.065 | 487.405 | 92.969 | 43.523 | 0.62 | 0.047 | 0.024 | 0.511 | 0.067 | 0.007 |
| Standard deviation | 2.158 | 0.360 | 0.023 | 87.671 | 20.331 | 12.109 | 0.164 | 0.053 | 0.011 | 0.227 | 0.014 | 0.002 |
| Coefficient of variation | 0.413 | 0.459 | 0.360 | 0.18 | 0.219 | 0.278 | 0.265 | 1.124 | 0.461 | 0.445 | 0.212 | 0.25 |
| Skewness | 0.372 | 0.799 | 0.551 | −0.153 | 0.323 | 0.423 | 0.371 | 1.376 | 0.635 | 0.251 | 0.26 | −0.366 |
| Kurtosis | −1.341 | −0.496 | −0.447 | −1.238 | −0.411 | −0.836 | −0.867 | 0.733 | −0.22 | −0.799 | −0.919 | −1.246 |
| K-S test | 0.019 | 0.019 | 0.200 | 0.065 | 0.200 | 0.200 | 0.2 | 0 | 0.2 | 0.2 | 0.2 | 0.045 |
| Background values (mg/L) | 3.0 | 0.02 | 0.156 | 263.0 | 45.0 | 25.0 | 0.05 | 0.02 | 0.004 | 0.05 | 0.01 | 0.01 |
| Groundwater quality standards [47] (mg/L) | 3.0 | 0.50 | 0.200 | 450.0 | 250.0 | 250.0 | 1 | 0.02 | 0.05 | 1 | 0.1 | 0.01 |
3.2. Frequency Distribution of Contaminants
The frequency distributions of the contents of CODMn, NH3-N, TP, TH, SO42−, and Cl− in the groundwater samples are shown in Figure 2. The frequency distributions of TP, TH, SO42−, and Cl− showed approximately normal distributions, while CODMn and NH3-N did not conform to a normal distribution. This result was consistent with the K-S test results presented in Table 2. The frequency distribution of the TH concentration did not follow a clear normal distribution, and its K-S test value was 0.065, indicating a marginally normal distribution. The mass concentrations of TP, TH, SO42−, and Cl− were mainly 0.04–0.09 mg/L, 400–600 mg/L, 70–110 mg/L, and 30–55 mg/L, respectively, and accounted for 77.5%, 79.0%, 83.5%, and 82.5% of the total sampling sites, respectively. The mass concentrations of CODMn were mainly concentrated within 2.5–3.5 mg/L and 6.5–8.5 mg/L, accounting for 85% of the sample sites. The mass concentrations of NH3-N ranged from 0.45 to 1.0 mg/L, with a proportion of 61.5% among the total sampling sites.
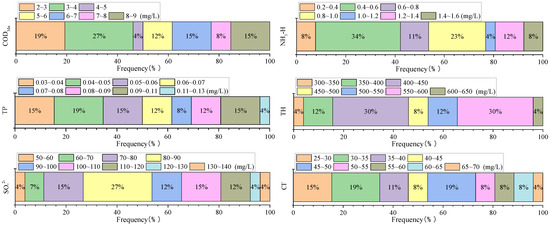
Figure 2.
Frequencies of conventional contaminants.
The frequency distributions of the contents of heavy metals Zn, Ni, Cr, Cu, Mn, and Pb in the groundwater samples are shown in Figure 3. Zn, Cr, Cu, and Mn followed normal distributions, while Ni and Pb did not conform to a normal distribution, consistent with the results of the K-S test presented in Table 2. The mass concentrations of Zn, Cr, Cu, and Mn were concentrated in the intervals of 0.4–0.9 mg/L, 0.01–0.04 mg/L, 0.2–0.8 mg/L, and 0.05–0.09 mg/L, respectively, and the proportions in the total number of sampling sites were 88.5%, 76.9%, 88.5%, and 88.5%, respectively. The mass concentration of Ni was mainly concentrated in the range of 0.005–0.02 mg/L, with a proportion of 60%, and the mass concentration of Pb was 0.004–0.009 mg/L, with a relatively uniform distribution.
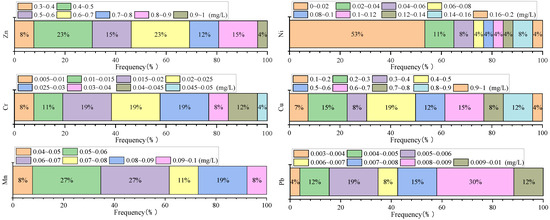
Figure 3.
Frequencies of heavy metals.
3.3. Correlation Analysis of Pollutants in Groundwater
A correlation analysis of the 12 pollutants is shown in Table 3. Among the conventional pollutants, the correlations between NH3-N and TP, NH3-N and SO42−, and SO42− and Cl− were significant, with correlation coefficients of 0.553, 0.627, and 0.557, respectively. These results show that the distributions of these pollutants in groundwater are similar, often due to the diffusion of similar pollutants. For example, NH3-N and TP pollution are likely to be caused by the leakage of organics from chemical enterprises or the cumulative migration of agricultural fertilizers, whereas SO42− and Cl− are likely to be induced by the leakage or accumulation of sulfate and chloride [48,49]. Among the heavy metal pollutants, the correlations were significant among Zn, Ni, Cu, and Pb; between Pb, Zn, Ni, Cr, Cu, Mn, and Mn; and between Ni and Cu. The correlation coefficients for four groups of elements, Zn-Cu, Cr-Cu, Zn-Pb, and Cu-Pb, reached 0.587, 0.640, 0.592, and 0.631 (p < 0.01), respectively. These results show that the sources of these heavy metals may be the same, with accumulation in shallow groundwater through co-precipitation or adsorption, resulting in relatively similar chemical characteristics [50]. The correlations among heavy metals are related to the nature of the element, adsorption characteristics, and deposition environment [51]. In addition, the correlations between Zn and Cr, Zn and Mn, Ni and Cr, Ni and Cu, and Cr and Mn were not significant (correlation coefficients less than 0.4), suggesting that there is less co-precipitation or adsorption of these metal elements by the oxides or hydroxides of Cr, consistent with external sources of pollution. The correlation coefficients between other heavy metals, including Zn–Ni, Ni–Mn, Ni–Pb, Cr–Pb, Cu–Mn, and Mn–Pb, were not high but were significant at the 0.05 level, indicating that they have partially similar origins.
Table 3.
Correlation analysis of pollutants in groundwater.
3.4. Spatial Distribution Characteristics of Groundwater Contaminants
3.4.1. Spatial Distribution of Pollutant Concentrations
The concentration distributions of 6 conventional pollutants, including CODMn, NH3-N, TP, TH, SO42−, and Cl−, in 26 groundwater samples are shown in Figure 4. The concentration of CODMn was high in the western areas of the industrial park, while the concentration of NH3-N was high in the southern areas of the industrial park and the farmland, which might be explained by applying fertilizers [52,53]. The concentration distributions of TP, TH, and SO42− were relatively similar, with higher concentrations near the industrial park and in farmland areas along the lower reaches of the river and lower concentrations in the river’s upper reaches.
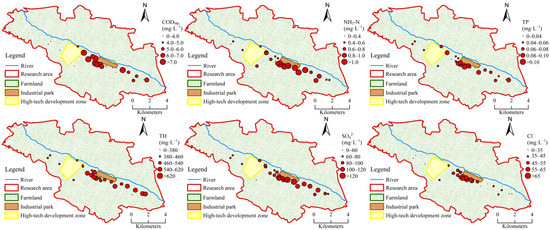
Figure 4.
Concentration distribution of conventional pollutants.
The concentration distributions of Zn, Ni, Cr, Cu, Mn, and Pb in the 26 groundwater samples are shown in Figure 5. Higher concentrations of these heavy metals were detected at sampling sites close to the industrial park, with gradual decreases along the Shiting River toward the downstream area. Heavy metal concentrations were deficient in upstream farmland areas farther from the industrial park. The concentration distribution map shows that pollutant discharges from the industrial park significantly impacted the distribution of heavy metals in the vicinity, which needs to be further analyzed through groundwater quality assessment.
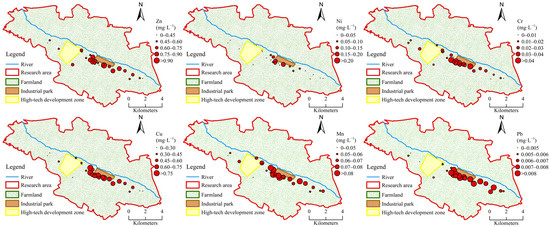
Figure 5.
Concentration distribution of heavy metal contaminants.
3.4.2. Kriging Interpolation Distribution of Contaminants
The pan-kriging interpolation method provides a better estimation and fitting of strong variability and anomalous conditions of groundwater contaminants by using fitted semi-variance functions (exponential and linear models) as computational models [54,55]. In this study, the spatial distribution of groundwater contaminants in the study area was mapped by optimal interpolation using the pan-kriging method (Figure 6). For conventional pollutants, the interpolation distributions differed substantially. NH3-N, SO42−, and Cl− were concentrated in the industrial park area and the southern farmland area, consistent with the distribution of sampling sites. However, CODMn, TP, and TH distributions were more variable. High concentrations of TP and TH were detected in the farmland area far from the industrial park, inconsistent with the concentration distribution of the actual sampling sites, indicating poor accuracy. The spatial distribution of areas with higher concentrations of the six heavy metals was similar. All were detected around the industrial park, and the distributions of Zn and Cr were relatively similar, with high concentrations mainly concentrated around the industrial park and lower concentrations in other areas. Concentrations of Ni were more evenly distributed throughout the study area. Areas with high concentrations of Cu, Mn, and Pb were mainly located in the southern farmland of the industrial park. Due to groundwater recharge from the Shiting River in the north, heavy metals in the industrial park area migrate to the southern part after infiltration, resulting in low concentrations in other areas [56,57].
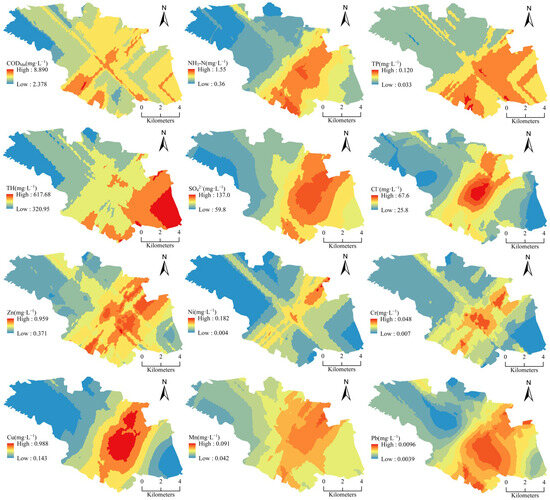
Figure 6.
Distributions of conventional contaminants and heavy metals as estimated by kriging interpolation.
3.5. Evaluation of Comprehensive Potential Ecological Risks of Heavy Metals
Based on the measured concentrations of heavy metals in groundwater, the groundwater quality evaluation standards, and the single-factor index formula (Equation (1)), a statistical table of single-factor pollution indices of groundwater pollutants in 26 sampling sites was generated (Table 4). Among conventional pollutants, CODMn, NH3-N, and TH pollutions were low, and TP, SO42−, and Cl− concentrations were at a non-pollution level. Among the six heavy metals, only Ni had a single-factor index higher than 1, with a mean value of 2.334, indicating moderate pollution. The other five heavy metals had a single-factor index of less than 1, indicating a lack of pollution. According to the single-factor pollution index, the degree of pollution for each heavy metal in the groundwater was Ni > Pb > Mn > Zn > Cu > Cr. The single-factor index method is simple; however, since it evaluates individual pollution factors independently, the evaluation results may not comprehensively reflect the overall quality of the water environment, which may lead to a significant bias. To fully reflect the quality of a water body, it is also necessary to calculate an integrated evaluation index.
Table 4.
Single-factor pollution index of heavy metals in groundwater.
The potential ecological risk indices of the six individual heavy metals and the integrated potential ecological risk indices (RI) of multiple heavy metals in the groundwater at the 26 sample points were calculated using Equations (2) to (4), and the results are shown in a statistical framework in Table 5. By comparing the average values of the potential ecological risk coefficients of the six heavy metals, only Cu had a moderate risk (40–80) with an index of 51.058. The other five heavy metals had a low potential ecological risk in the order of Cu > Zn > Cr > Ni > Mn > Pb. Statistical analyses of the single-factor index of Cu for potential ecological pollution showed that moderate ecological risk accounted for 49.8% of the total sampling sites, and a high risk accounted for 15.4% of the total sampling sites. In addition, Ni posed a moderate ecological risk to 3.8% of the total sites. This is mainly due to the larger ecological risk of Cu and Ni [58,59].
Table 5.
Descriptive statistics of potential risk coefficients and integrated potential ecological risk.
As shown in Table 5, the integrated potential ecological RI of the six heavy metals is 39.4–151.20, with a mean value of 97.27. Areas with a moderate integrated RI accounted for only 3.8% of the total surveyed area, while those with a low integrated RI accounted for 96.2%. A risk coefficient of less than 100 covered the largest area, 50.0% of the total surveyed area. The integrated potential ecological risk evaluation map of the six heavy metals (Figure 7) shows a high correlation with the spatial distribution of the heavy metal contents in shallow groundwater, especially the distributions of Cu and Pb. The above analysis indicates that the traditional industrial park poses a slight ecological risk to shallow groundwater in agricultural fields.
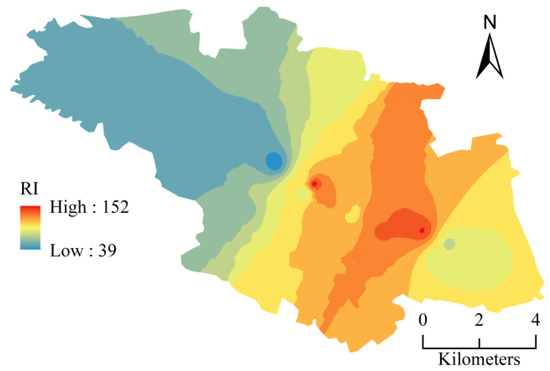
Figure 7.
Evaluation map of potential risk for heavy metals in groundwater.
3.6. Discussion on Applicability
This study takes traditional industrial parks as the core area and administrative divisions as the boundary to conduct a regional groundwater environment assessment. It can provide support for the government on how to rebuild traditional industrial parks. In addition, specific pollution factors are selected for potential ecological risk assessment based on different assessment objects and can be intuitively expressed. This is crucial for decision makers to refer to in actual planning. The purpose of this study was to conduct a comprehensive evaluation of potential ecological risks through combined statistical analysis, and to present the results through GIS technology and intuitive evaluation charts. However, the limitations and referential value of this study are also very obvious. The goal of this study is to provide decision-making support for the renovation and upgrading of traditional industrial parks. Therefore, the selected pollutant factors are unique to industrial parks, and the background and standard values of pollutants also have specificity. It only has reference value for groundwater assessment in other industrial parks with similar situations.
4. Conclusions
In this paper, the groundwater environment in the farmland area around a traditional industrial park in Shifang City, southwest China, was taken as the research object. Geostatistical methods combined with GIS technology were adopted to analyze the spatial distribution of conventional pollutants and heavy metals in groundwater in the area and to evaluate the integrated potential ecological risk of heavy metals. The following conclusions were drawn:
- The distributions of CODMn and NH3-N in the study area showed poor continuity of variation and high spatial differentiation, mainly due to intensive anthropogenic activities, such as industrial discharges. TH, SO42−, and Cl− were more or less uniformly affected by external factors, had relatively insignificant spatial differentiation, and may have similar sources within the study area. Co-precipitation or adsorption of these metal elements by oxides or hydroxides of Cr is less frequent and may be explained by external sources of pollution.
- A spatial distribution variation map of six heavy metals in groundwater obtained by ordinary kriging interpolation showed that the high concentrations of Cu, Mn, and Pb are mainly concentrated in the farmland area south of the industrial park. Due to the groundwater recharge from the Shiting River in the north, the heavy metals in the industrial park area migrate to the southern part after infiltration, explaining the low concentrations in other areas.
- Based on the potential ecological pollution index, the degree of heavy metal pollution decreased in the following order: Cu > Zn > Cr > Ni > Mn > Pb. Only Cu had a moderate potential ecological risk, mainly due to its larger ecological risk coefficient. The average value of the integrated potential ecological RI of the six heavy metals was 97.27. Overall, the traditional industrial park poses a slight ecological risk to the shallow groundwater of agricultural areas.
Author Contributions
Conceptualization, Y.Z.; methodology, Y.Z., Y.Y. and G.A.; validation, Y.Y.; formal analysis, Y.Y., G.A. and J.H.; investigation, Y.Z. and J.H.; resources, Y.Z.; data curation, Y.Y. and G.A.; writing—original draft preparation, Y.Z. and Y.Y.; writing—review and editing, Y.Z., J.H. and T.H.; visualization, G.A.; supervision, Y.Z.; project administration, T.H.; funding acquisition, Y.Z. All authors have read and agreed to the published version of the manuscript.
Funding
This research is funded by the Natural Science Foundation of Sichuan, China, grant number 2022NSFSC0240, and the Natural Science Foundation of Xihua University, grant number Z201046.
Institutional Review Board Statement
Not applicable.
Informed Consent Statement
Not applicable.
Data Availability Statement
The data are available upon reasonable request from the corresponding author.
Conflicts of Interest
The authors declare no conflict of interest.
References
- Zhai, Y.; Lei, Y.; Wu, J.; Teng, Y.; Wang, J.; Zhao, X.; Pan, X. Does the groundwater nitrate pollution in China pose a risk to human health? A critical review of published data. Environ. Sci. Pollut. Res. 2017, 24, 3640–3653. [Google Scholar] [CrossRef] [PubMed]
- Karunanidhi, D.; Subramani, T.; Srinivasamoorthy, K.; Yang, Q. Environmental chemistry, toxicity and health risk assessment of groundwater: Environmental persistence and management strategies. Environ. Res. 2022, 214, 113884. [Google Scholar] [CrossRef] [PubMed]
- Zhang, H.; Bian, J.; Wan, H. Hydrochemical appraisal of groundwater quality and pollution source analysis of oil field area: A case study in Daqing City, China. Environ. Sci. Pollut. Res. 2021, 28, 18667–18685. [Google Scholar] [CrossRef] [PubMed]
- Li, D.; Pan, B.; Han, X.; Li, G.; Feng, Z.; Wang, X. Human activities affect the concentrations and distributions of trace metals in the heavily sediment-laden Yellow River. J. Environ. Chem. Eng. 2023, 11, 109714. [Google Scholar] [CrossRef]
- Zeng, J.; Tabelin, C.B.; Gao, W.; Tang, L.; Luo, X.; Ke, W.; Jiang, J.; Xue, S. Heterogeneous distributions of heavy metals in the soil-groundwater system empowers the knowledge of the pollution migration at a smelting site. Chem. Eng. J. 2023, 454, 140307. [Google Scholar] [CrossRef]
- Hussain, R.; Khattak, S.A.; Ali, L.; Sattar, S.; Zeb, M.; Hussain, M.L. Impacts of the linear flowing industrial wastewater on the groundwater quality and human health in Swabi, Pakistan. Environ. Sci. Pollut. Res. 2021, 28, 56741–56757. [Google Scholar] [CrossRef]
- Ozaki, H.; Ichise, H.; Kitaura, E.; Yaginuma, Y.; Yoda, M.; Kuno, K.; Watanabe, I. Immutable heavy metal pollution before and after change in industrial waste treatment procedure. Sci. Rep. 2019, 9, 4499. [Google Scholar] [CrossRef]
- Tyagi, S.; Sharma, B.; Singh, P.; Dobhal, R. Water quality assessment in terms of water quality index. Am. J. Water Resour. 2013, 1, 34–38. [Google Scholar] [CrossRef]
- Al-Hashimi, O.; Hashim, K.; Loffill, E.; Marolt Čebašek, T.; Nakouti, I.; Faisal, A.A.H.; Al-Ansari, N. A Comprehensive Review for Groundwater Contamination and Remediation: Occurrence, Migration and Adsorption Modelling. Molecules 2021, 26, 5913. [Google Scholar] [CrossRef]
- Liu, Y.; Yang, L.; Chun, Y.; Yang, J.; Wang, C. VFS-based OFSP model for groundwater pollution study of domestic waste landfill. Environ. Sci. Pollut. Res. 2021, 28, 30783–30806. [Google Scholar] [CrossRef]
- Sadeghi, H.; Fazlzadeh, M.; Zarei, A.; Mahvi, A.H.; Nazmara, S. Spatial distribution and contamination of heavy metals in surface water, groundwater and topsoil surrounding Moghan’s tannery site in Ardabil, Iran. Int. J. Environ. Anal. Chem. 2022, 102, 1049–1059. [Google Scholar] [CrossRef]
- Long, X.; Liu, F.; Zhou, X.; Pi, J.; Yin, W.; Li, F.; Huang, S.; Ma, F. Estimation of spatial distribution and health risk by arsenic and heavy metals in shallow groundwater around Dongting Lake plain using GIS mapping. Chemosphere 2021, 269, 128698. [Google Scholar] [CrossRef] [PubMed]
- Hepburn, E.; Northway, A.; Bekele, D.; Liu, G.J.; Currell, M. A method for separation of heavy metal sources in urban groundwater using multiple lines of evidence. Environ. Pollut. 2018, 241, 787–799. [Google Scholar] [CrossRef]
- Kaur, S.; Mehra, R.; Kumar, M.R. Quantification of health risks and spatial distribution of heavy metals in groundwater of Lower Himalayas, India. Int. J. Environ. Sci. Technol. 2022, 19, 3201–3218. [Google Scholar] [CrossRef]
- Galvão, P.; Hirata, R.; Conicelli, B. Estimating groundwater recharge using GIS-based distributed water balance model in an environmental protection area in the city of Sete Lagoas (MG), Brazil. Environ. Earth Sci. 2018, 77, 398. [Google Scholar] [CrossRef]
- Xu, H.; Yang, X.; Wang, D.; Hu, Y.; Cheng, Z.; Shi, Y.; Zheng, P.; Shi, L. Multivariate and spatio-temporal groundwater pollution risk assessment: A new long-time serial groundwater environmental impact assessment system. Environ. Pollut. 2023, 317, 120621. [Google Scholar] [CrossRef]
- Norouzi, H.; Moghaddam, A.A. Determining the origin of arsenic anomalies in groundwater using multivariate statistical methods (case study: Miandoab plain aquifer, NW of Iran). Environ. Earth Sci. 2022, 81, 301. [Google Scholar] [CrossRef]
- Wang, Q.; Dong, S.; Wang, H.; Yang, J.; Huang, H.; Dong, X.; Yu, B. Hydrogeochemical processes and groundwater quality assessment for different aquifers in the Caojiatan coal mine of Ordos Basin, northwestern China. Environ. Earth Sci. 2020, 79, 199. [Google Scholar] [CrossRef]
- Cao, Y.; Teng, Y.; Wang, W.; Wang, J. Investigation of heavy metals in Jinji groundwater source of Wuzhong City: Spatial distribution and source apportionment. Environ. Sci. Technol. 2013, 36, 163–167. [Google Scholar]
- Tabandeh, S.M.; Kholghi, M.; Hosseini, S.A. Groundwater quality assessment in two shallow aquifers with different hydrogeological characteristics (case study: Lenjanat and Babol–Amol aquifers in Iran). Environ. Earth Sci. 2021, 80, 427. [Google Scholar] [CrossRef]
- Wang, Z.; Li, F.; Xia, Y.; Chen, H.; Wang, K.; Fu, S.; Wang, G. Spatial distribution of groundwater q uality in the coastal plain and its relationship with land use and seawater intrusion. Environ. Earth Sci. 2021, 80, 465. [Google Scholar] [CrossRef]
- Pashahkha, P.; Babazadeh, H.; Shahmohammadi-Kalalagh, S.; Sarai-Tabrizi, M. Salinity-based spatial evaluation of groundwater quality for agricultural use. Int. J. Environ. Sci. Technol. 2022, 19, 6833–6844. [Google Scholar] [CrossRef]
- Wu, J.; Li, P.; Wang, D.; Ren, X.; Wei, M. Statistical and multivariate statistical techniques to trace the sources and affecting factors of groundwater pollution in a rapidly growing city on the Chinese Loess Plateau. Hum. Ecol. Risk Assess. Int. J. 2020, 26, 1603–1621. [Google Scholar] [CrossRef]
- Arslan, S.; Yucel, C.; Calli, S.S.; Celik, M. Assessment of heavy metal pollution in the groundwater of the northern Develi Closed Basin, Kayseri, Turkey. Bull. Environ. Contam. Toxicol. 2017, 99, 244–252. [Google Scholar] [CrossRef] [PubMed]
- Faisal, A.; Sulaymon, A.; Khaliefa, Q. Technology. A review of permeable reactive barrier as passive sustainable technology for groundwater remediation. Int. J. Environ. Sci. Technol. 2018, 15, 1123–1138. [Google Scholar] [CrossRef]
- Aryafar, A.; Khosravi, V.; Karami, S. Groundwater quality assessment of Birjand plain aquifer using kriging estimation and sequential Gaussian simulation methods. Environ. Earth Sci. 2020, 79, 210. [Google Scholar] [CrossRef]
- Ma, L.; Qian, J.; Yan, X.; Luo, Q.; Chen, L.; Zhao, W. Using GIS methods for determining the spatial distribution of groundwater hydrochemical facies: A case study for a shallow aquifer in Fuyang, China. Environ. Earth Sci. 2019, 78, 335. [Google Scholar] [CrossRef]
- Chaturvedi, A.; Bhattacharjee, S.; Kumar, V.; Singh, A.K. A study on the interdependence of heavy metals while contributing to groundwater pollution index. Environ. Sci. Pollut. Res. 2021, 28, 25798–25807. [Google Scholar] [CrossRef]
- Water Quality-Determination of Inorganic Anions (F−, Cl−, NO2−, Br−, NO3−, PO43−, SO32−, SO42−)-Ion Chromatography. Available online: https://www.mee.gov.cn/ywgz/fgbz/bz/bzwb/jcffbz/201608/t20160803_361818.shtml (accessed on 1 October 2016).
- Water Quality—Determination of Ammonia Nitrogen—Nessler’s Reagent Spectrophotometry. Available online: https://www.mee.gov.cn/ywgz/fgbz/bz/bzwb/jcffbz/201001/t20100112_184155.shtml (accessed on 1 January 2010).
- Water quality—Determination of the Chemical Oxygen Demand—Dichromate Method. Available online: https://openstd.samr.gov.cn/bzgk/gb/newGbInfo?hcno=76DD23125EA4F70F483F92C350E90945 (accessed on 1 July 1990).
- Water Quality—Determination of Total Nitrogen—Alkaline Potassium Persulfate Digestion-UV Spectrophotometric Method. Available online: https://openstd.samr.gov.cn/bzgk/gb/newGbInfo?hcno=2D198187FBDBB503CE2BA33EB0EFC7D5 (accessed on 1 July 1990).
- Su, K.; Wang, Q.; Li, L.; Cao, R.; Xi, Y.; Li, G. Water quality assessment based on Nemerow pollution index method: A case study of Heilongtan reservoir in central Sichuan province, China. PLoS ONE 2022, 17, e0273305. [Google Scholar] [CrossRef]
- Su, K.; Wang, Q.; Li, L.; Cao, R.; Xi, Y. Water quality assessment of Lugu Lake based on Nemerow pollution index method. Sci. Rep. 2022, 12, 13613. [Google Scholar] [CrossRef]
- Xue, Y.; Ma, Y.; Long, G.; He, H.; Li, Z.; Yan, Z.; Wan, J.; Zhang, S.; Zhu, B. Evaluation of water quality pollution and analysis of vertical distribution characteristics of typical Rivers in the Pearl River Delta, South China. J. Sea Res. 2023, 193, 102380. [Google Scholar] [CrossRef]
- Håkanson, L. An Ecological Risk Index for Aquatic Pollution Control—A Sedimentological Approach. Water Res. 1980, 14, 975–1001. [Google Scholar] [CrossRef]
- Wang, D.; Formica, M.; Liu, S. Nonparametric Interval Estimators for the Coefficient of Variation. Int. J. Biostat. 2018, 14, 20170041. [Google Scholar] [CrossRef]
- Xu, Z.Q.; Ni, S.J.; Tuo, X.G.; Zhang, C.J. Calculation of heavy metals’ toxicity coefficient in the evaluation of potential ecological risk index. Environ. Sci. Technol. 2008, 31, 112–115. [Google Scholar]
- García-Comendador, J.; Martínez-Carreras, N.; Fortesa, J.; Company, J.; Borràs, A.; Palacio, E.; Estrany, J. In-channel alterations of soil properties used as tracers in sediment fingerprinting studies. Catena 2023, 225, 107036. [Google Scholar] [CrossRef]
- Jia, Y.; Jiang, Y.; Zhou, X.; Zhou, Q. Organic pollutants characteristics of shallow groundwater in jiangsu province. Ground Water 2013, 35, 87–89. (In Chinese) [Google Scholar]
- Vahid, B.; Sayyed-Hassan, T.; Reza, M.; Hossein, M.; Rasoul, M. Multivariate spatial analysis of groundwater quality using copulas. Acta Geophys. 2023, 1–13. [Google Scholar]
- He, Z.; Shentu, J.; Yang, X.; Baligar, V.; Zang, T.; Stoffella, P. Heavy Metal Contamination of Soils: Sources, Indicators, and Assessment. J. Environ. Indic. 2015, 9, 17–18. [Google Scholar]
- Alloway, B.J. Sources of heavy metals and metalloids in soils. In Heavy Metals in Soils; Alloway, B., Ed.; Springer: Dordrecht, The Netherlands, 2013; Volume 22, pp. 11–50. [Google Scholar]
- Zhang, H.; Yuan, X.; Xiong, T.; Wang, H.; Jiang, L. Bioremediation of co-contaminated soil with heavy metals and pesticides: Influence factors, mechanisms and evaluation methods. Chem. Eng. J. 2020, 398, 125657. [Google Scholar] [CrossRef]
- Atafar, Z.; Mesdaghinia, A.; Nouri, J.; Homaee, M.; Yunesian, M.; Ahmadimoghaddam, M.; Mahvi, A.H. Effect of fertilizer application on soil heavy metal concentration. Environ. Monit. Assess. 2010, 160, 83–89. [Google Scholar] [CrossRef]
- Liu, J.; Zhang, X.H.; Tran, H.; Wang, D.Q.; Zhu, Y.N. Heavy metal contamination and risk assessment in water, paddy soil, and rice around an electroplating plant. Environ. Sci. Pollut. Res. 2011, 18, 1623–1632. [Google Scholar] [CrossRef]
- Standard for Groundwater Quality. Available online: https://openstd.samr.gov.cn/bzgk/gb/newGbInfo?hcno=F745E3023BD5B10B9FB5314E0FFB5523 (accessed on 1 May 2018).
- Tian, R.; Wu, J. Groundwater quality appraisal by improved set pair analysis with game theory weightage and health risk estimation of contaminants for Xuecha drinking water source in a loess area in Northwest China. Hum. Ecol. Risk Assess. 2019, 25, 132–157. [Google Scholar] [CrossRef]
- Fang, Z.B. Comprehensive evaluation of water environment under “zero direct discharge of sewage” project. IOP Conf. Ser. Earth Environ. Sci. 2021, 643, 012131. [Google Scholar]
- Liu, Y.; Ye, Y.; Li, Y. Experimental and numerical study on Zn and Pb migration in the farmland soil under wastewater irrigation conditions. Environ. Geochem. Health 2023, 45, 6371–6386. [Google Scholar] [CrossRef] [PubMed]
- Deng, Y.; Jiang, L.; Xu, L.; Hao, X.; Zhang, S.; Xu, M.; Zhu, P.; Fu, S.; Liang, Y.; Yin, H.; et al. Spatial distribution and risk assessment of heavy metals in contaminated paddy fields—A case study in Xiangtan City, southern China. Ecotoxicol. Environ. Saf. 2019, 171, 281–289. [Google Scholar] [CrossRef] [PubMed]
- Ah, T.; Mohd, K.Y.; Nik, M.M.; Joo, G.; Huang, G. Effect of N and K fertilizers on nutrient leaching and groundwater quality under mature oil palm in Sabah during the monsoon period. Am. J. Appl. Sci. 2009, 6, 1788–1799. [Google Scholar]
- Khan, M.N.; Mobin, M.; Abbas, Z.K.; Alamri, S.A. Fertilizers and their contaminants in soils, surface and groundwater. Encycl. Anthr. 2018, 5, 225–240. [Google Scholar]
- Souid, F.; Hamdi, M.; Moussa, M. Groundwater pollution risk assessment using a calculated contamination index and geostatistical analysis: Jerba Island case study (southeast of Tunisia). Arab. J. Geosci. 2022, 15, 1576. [Google Scholar] [CrossRef]
- Jia, Z.; Zhou, S.; Su, Q.; Yi, H.; Wang, J. Comparison study on the estimation of the spatial distribution of regional soil metal (loid) s pollution based on kriging interpolation and BP neural network. Int. J. Environ. Res. Public Health 2018, 15, 34. [Google Scholar] [CrossRef]
- Wang, Y.; Dong, R.; Zhou, Y.; Luo, X. Characteristics of groundwater discharge to river and related heavy metal transportation in a mountain mining area of Dabaoshan, Southern China. Sci. Total Environ. 2019, 679, 346–358. [Google Scholar] [CrossRef]
- Umar, M.; Waseem, A.; Sabir, M.A.; Kassi, A.M.; Khan, A.S. The impact of geology of recharge areas on groundwater quality: A case study of Zhob River Basin, Pakistan. Clean–Soil Air Water 2013, 41, 119–127. [Google Scholar] [CrossRef]
- Islam, S.; Ahmed, K.; Masunaga, S. Potential ecological risk of hazardous elements in different land-use urban soils of Bangladesh. Sci. Total Environ. 2015, 512, 94–102. [Google Scholar] [CrossRef] [PubMed]
- Aendo, P.; Netvichian, R.; Thiendedsakul, P.; Khaodhiar, S.; Tulayakul, P. Carcinogenic risk of Pb, Cd, Ni, and Cr and critical ecological risk of Cd and Cu in soil and groundwater around the municipal solid waste open dump in central Thailand. J. Environ. Public Health 2022, 2022, 3062215. [Google Scholar] [CrossRef]
Disclaimer/Publisher’s Note: The statements, opinions and data contained in all publications are solely those of the individual author(s) and contributor(s) and not of MDPI and/or the editor(s). MDPI and/or the editor(s) disclaim responsibility for any injury to people or property resulting from any ideas, methods, instructions or products referred to in the content. |
© 2023 by the authors. Licensee MDPI, Basel, Switzerland. This article is an open access article distributed under the terms and conditions of the Creative Commons Attribution (CC BY) license (https://creativecommons.org/licenses/by/4.0/).