Article

A Sustainable Wind–Biogas Hybrid System for Remote Areas in Jordan: A Case Study of Mobile Hospital for a Zaatari Syrian Refugee Camp

1
Department of Mechanical Engineering, School of Engineering, University of Jordan, Amman 11942, Jordan
2
Department of Mechanical and Maintenance Engineering, School of Applied Technical Sciences, German Jordanian University, Amman 11180, Jordan
3
Energy Systems and Infrastructure Analysis Division, Argonne National Laboratory, Lemont, IL 60439, USA
4
Mechatronics Engineering Technology Department of Engineering Technology, Purdue University Northwest, 2200 169th Street, Hammond, IN 46323, USA
5
Department of Mechanical Engineering, Tuskegee University, Tuskegee, AL 36088, USA
6
Department of Mechanical Engineering, Faculty of Engineering, Tafila Technical University, Tafila 66110, Jordan
*
Authors to whom correspondence should be addressed.
Sustainability 2023, 15(20), 14935; https://doi.org/10.3390/su152014935
Submission received: 15 September 2023 / Revised: 9 October 2023 / Accepted: 12 October 2023 / Published: 16 October 2023
(This article belongs to the Section Energy Sustainability)

Abstract

:
Access to reliable and sustainable energy in remote areas remains a pressing global challenge, significantly affecting economic development and the quality of life. This study focuses on the implementation of fully off-grid wind–biogas hybrid power systems to address this issue, with a focus on remote healthcare camp facilities. This paper investigates the performance of a hybrid renewable energy system within the context of one of Jordan’s northern remote areas, the Zaatari Syrian Refugee Camp, assessing its efficiency and environmental impact by taking the Zaatari hospital as the case study. Simulations were conducted to evaluate system components, including wind turbines, biogas generators, and diesel generators. A comprehensive evaluation was conducted, encompassing both the operational efficiency of the system and its impact on the environment. This study also considered various scenarios (SC#), including grid availability and autonomy levels, to optimize system configurations. The techno-economic assessment employed the levelized cost of energy (LCOE) as a key performance indicator, and sensitivity analyses explored the impact of diesel costs and wind power fluctuations on the system. Additionally, environmental assessment was conducted to evaluate the environmental effects of hybrid systems, with a specific focus on reducing greenhouse gas emissions. This investigation involved an examination of emissions in three different scenarios. The results indicate that the lowest LCOE that could be achieved was 0.0734 USD/kWh in SC#1 with 72.42% autonomy, whereas achieving 100% autonomy increased the LCOE to 0.1756 USD/kWh. Additionally, the results reveal that in scenarios SC#2 and SC#3, which have a higher proportion of diesel generator usage, there were elevated levels of NOx and CO2 emissions. Conversely, in SC#1, which lacks diesel generators, emissions were notably lower. The proposed hybrid system demonstrates its potential to provide a reliable energy supply to healthcare facilities in remote regions, emphasizing both economic feasibility and environmental benefits. These findings contribute to informed decision making for sustainable energy solutions in similar contexts, promoting healthcare accessibility and environmental sustainability.

1. Introduction

Energy supply in remote areas presents a formidable challenge for numerous developing nations on a global scale. These remote regions often grapple with the stark reality of lacking access to a reliable and affordable energy source, resulting in stifled economic growth and a diminished quality of life for their inhabitants [1]. Moreover, this dearth of energy access has far-reaching consequences, profoundly impacting vital services such as healthcare, education, and communication, thereby impeding the holistic development and prosperity of these marginalized areas [2,3]. Fortunately, innovative off-grid solutions, such as microgrids and mini-grids, offer a glimmer of hope for these underserved regions. These self-contained systems can be strategically deployed to provide a dependable and cost-effective energy supply, breaking free from the constraints of traditional grid infrastructure [4,5]. Bolstering this energy autonomy are cutting-edge energy storage technologies, prominently including advanced battery systems. These technologies ensure a continuous energy supply, effectively mitigating the adverse effects of intermittent energy generation, a common challenge in remote areas [4,6,7].
Among the most promising solutions are fully off-grid power systems, which are entirely self-reliant and adept at generating and storing energy from renewable sources. These encompass solar energy, wind energy, and bioenergy, collectively forming a trifecta of sustainable energy sources. The adoption of off-grid power systems not only offers a clean and eco-friendly energy supply but also serves as a potent instrument in the global battle against climate change. By significantly reducing dependence on fossil fuels, these systems align with the imperative to reduce greenhouse gas emissions and foster a more sustainable energy landscape [8,9,10,11]. Wind–biogas hybrid systems exemplify off-grid power solutions, harnessing wind, and biogas synergies. Wind turbines capture wind energy, while biogas plants convert organic waste into electricity [12]. These systems offer a continuous 24 h power, predictable production matching demand cycles, and efficiency levels up to 30 40 % , making them favourable for remote regions, particularly those with abundant wind and organic resources [13].
Wind energy systems are often considered more reliable than photovoltaic (PV) systems when it comes to area utilization and consistent power production. Wind turbines can be installed vertically in close proximity to one another, making efficient use of land while minimizing the impact on agriculture or other land uses [14]. Additionally, wind turbines generate power around the clock, as long as there is sufficient wind, providing a more consistent power output compared to solar panels, which are dependent on daylight hours and weather conditions. This reliability and efficient land use make wind systems an attractive option for consistent and sustainable power generation [15,16].
Numerous studies have explored the integration of wind and biogas for energy generation. One noteworthy study by Yimen et al. [17] investigated a hybrid energy system, combining photovoltaic (PV), wind, biogas, and hydro sources using The Hybrid Optimization of Multiple Energy Resources (HOMER) software. Their findings demonstrated cost-effectiveness and environmental benefits, particularly in comparison to existing systems in Africa. Sarkar et al. [18] also utilized HOMER to model a unique hybrid microgrid, integrating solar PV, wind, biomass, and vanadium redox flow battery (VRFB) storage. Their results highlighted that intelligent scheduling and control systems can eliminate power loss, adapting to the unpredictable nature of renewable energy. Additionally, Anwar et al. [19] proposed an integrated renewable energy system (IRES) incorporating PV, wind, and biogas sources, and assessed its levelized cost of energy (LCOE) and net present cost (NPC), also using HOMER software. Their analysis revealed that the NPC was particularly sensitive to load variations and less affected by changes in wind speed.
In rural and remote regions, the viability of hybrid power systems has been extensively explored. For instance, Vendoti et al. [12] conducted a study that encompassed the integration of PV, wind, biomass, biogas, and fuel cells within a single system. Their research underscored the system’s reliability, with a potential cost of energy (COE) as low as 0.214 USD/kWh under optimal conditions. In another context, Li et al. [20] investigated an off-grid hybrid renewable energy system tailored for remote rural electrification in a West Chinese village (Leopard Beach). Employing simulations, optimization techniques, and sensitivity analyses, the researchers evaluated various combinations of PV panels, wind turbines, and biogas generators. Their results unveiled a dependable and cost-effective hybrid power solution, combining solar, wind, and biomass components, which not only facilitated sustainable rural electrification but also yielded environmental benefits. Furthermore, Das et al. [21] conducted a study to assess the feasibility of a self-sufficient hybrid power generation system for a remote community in Bangladesh (Katakhali village). This proposed system seamlessly integrated diverse renewable energy sources, including biogas generators, PV modules, wind turbines, and diesel generators. Notably, the system demonstrated a COE of 0.28 USD/kWh, a total net present cost (NPC) of 612,280 USD, and an impressive renewable fraction of 60 % . Beyond economic advantages, it exhibited the potential to curtail C O 2 emissions by approximately 59.6 % annually compared to diesel-based systems and by 40.5 % relative to grid electricity.
After conducting a comprehensive survey of the existing literature, it became evident that most of the studies centered around hybrid power systems primarily emphasized their feasibility under controlled and uniform conditions. While such analyses provide valuable insights from an economic standpoint, they often fall short in capturing the real-world dynamics and operational intricacies of these systems. To bridge this gap, the present study embarks on a rigorous exploration of the practical performance of a hybrid wind–biogas power system deployed in remote northern areas of Jordan. The main novelty and motivation of the current work can be summarised as follows:
  • The current investigation focuses on using hybrid power systems to supply energy to healthcare facilities situated in refugee camps in remote regions.
  • The current study performs a multifaceted assessment, addressing both the system’s operational efficiency and its environmental footprint.
  • The present study focuses on examining different energy-supplying scenarios for the health facility, which in turn helps in understanding the nature of the types of energy systems suitable for remote areas.
  • The current study also considers the environmental sustainability of hybrid systems employed in remote areas.
The mentioned points will, in turn, enrich the knowledge about dealing with the energy-providing issues in refugee’s camps, especially when they are characterized by high energy demand.
To address the main objectives of the current work, this paper begins with the introduction section, providing an overview of the case study and related studies found in the literature. Then, the methodology section includes a description of the study area, mathematical models for each system with the power plant, and an economic analysis of the applied scenarios. Following this, the results and discussion section is presented to address the main findings of this study and to comment on the results of each scenario. Finally, the conclusion section summarizes the key findings of this study and the results obtained after applying the suggested scenarios.

2. Materials and Methods

2.1. Demographic Profile of the Case Study Area

This research centres its attention on the hospital at the Zaatari Syrian Refugee Camp, a geographic focal point depicted in Figure 1, strategically located just 8 miles from the Syrian border at coordinates (32°17′44.4″ N 36°19′25.5″ E). Distinguished as the largest refugee camp in the Middle East and the world’s second-largest of its kind [22], the camp sprawls across an expansive terrain, spanning approximately 5.5 square kilometers. Its inception dates back to 2012 , conceived as a response to the Syrian internal conflict, and it presently shelters a formidable population of around 80,000 residents. Notably, the Zaatari camp has been strategically positioned within an area that serves as a pivotal groundwater reservoir for Jordan, further underscoring its regional significance [23].
In 2012 , a pivotal development unfolded within Zaatari—the establishment of an electrical grid, undertaken in collaboration with the Irbid District Electricity Company. This visionary undertaking was meticulously designed to extend essential energy services throughout the camp, serving as a lifeline for various stakeholders, including the base camp, non-governmental organizations (NGOs), and the illumination of thoroughfares within the camp’s expanse. In its initial incarnation, electrical connections to individual shelters and enterprises were informally assembled by the resourceful refugees themselves, albeit at a steep cost to both health and security, as documented in [25]. Considering these pressing safety concerns and the mounting electricity expenditures incurred by The United Nations High Commissioner for Refugees (UNHCR), a pivotal juncture occurred in 2015 when the entire network underwent a transformative overhaul. This overhaul resulted in the provision of dedicated electrical connections to each household, significantly enhancing safety and reliability.
Notably, October 2017 stands as a watershed moment in the camp’s energy landscape with the completion of a 12.9   M W solar plant, an epochal achievement that bestowed upon it the distinction of housing the world’s largest renewable energy infrastructure within a refugee camp [26]. Financed through the generous support of the Government of the Czech Republic, this solar marvel not only bestows a bounty of renewable energy upon the entire camp’s populace but also extends its benevolent reach to empower over 50 organizations and essential operational facilities through the local grid.
To surmount the escalating water requirements, a substantial number of groundwater wells have been meticulously excavated, both within the confines of the Zaatari camp and its neighbouring environs. Notably, in 2016 , the camp witnessed the inauguration of three water wells, nestled within its bounds, collectively boasting an impressive daily water yield of 3600   m 3 [27]. Furthermore, a state-of-the-art wastewater treatment facility, with a commendable capacity of 3000   m 3 / d a y , was erected to uphold the camp’s commitment to environmental stewardship and sanitation [27]. Complementing these endeavors is an ongoing initiative to establish a piped water distribution system, alongside a piped sewerage network, which will seamlessly link the collection system to the wastewater treatment plant. These ambitious undertakings collectively stand as a testament to the unwavering dedication to addressing the water and sanitation needs of the camp’s burgeoning population [27].
Moreover, recognizing the intensifying energy demands within the camp, a milestone was reached in 2019 with the establishment of a pilot biogas production unit [28]. This innovative unit is poised to harness the latent energy potential residing within the camp’s organic solid waste and the sewage sludge processed by the wastewater treatment plant. Figure 2 offers a compelling visualization of the daily flow rates pertaining to both wastewater and biogas production, underscoring the dual benefits of sustainable waste management and renewable energy generation that this initiative promises to deliver throughout the year.
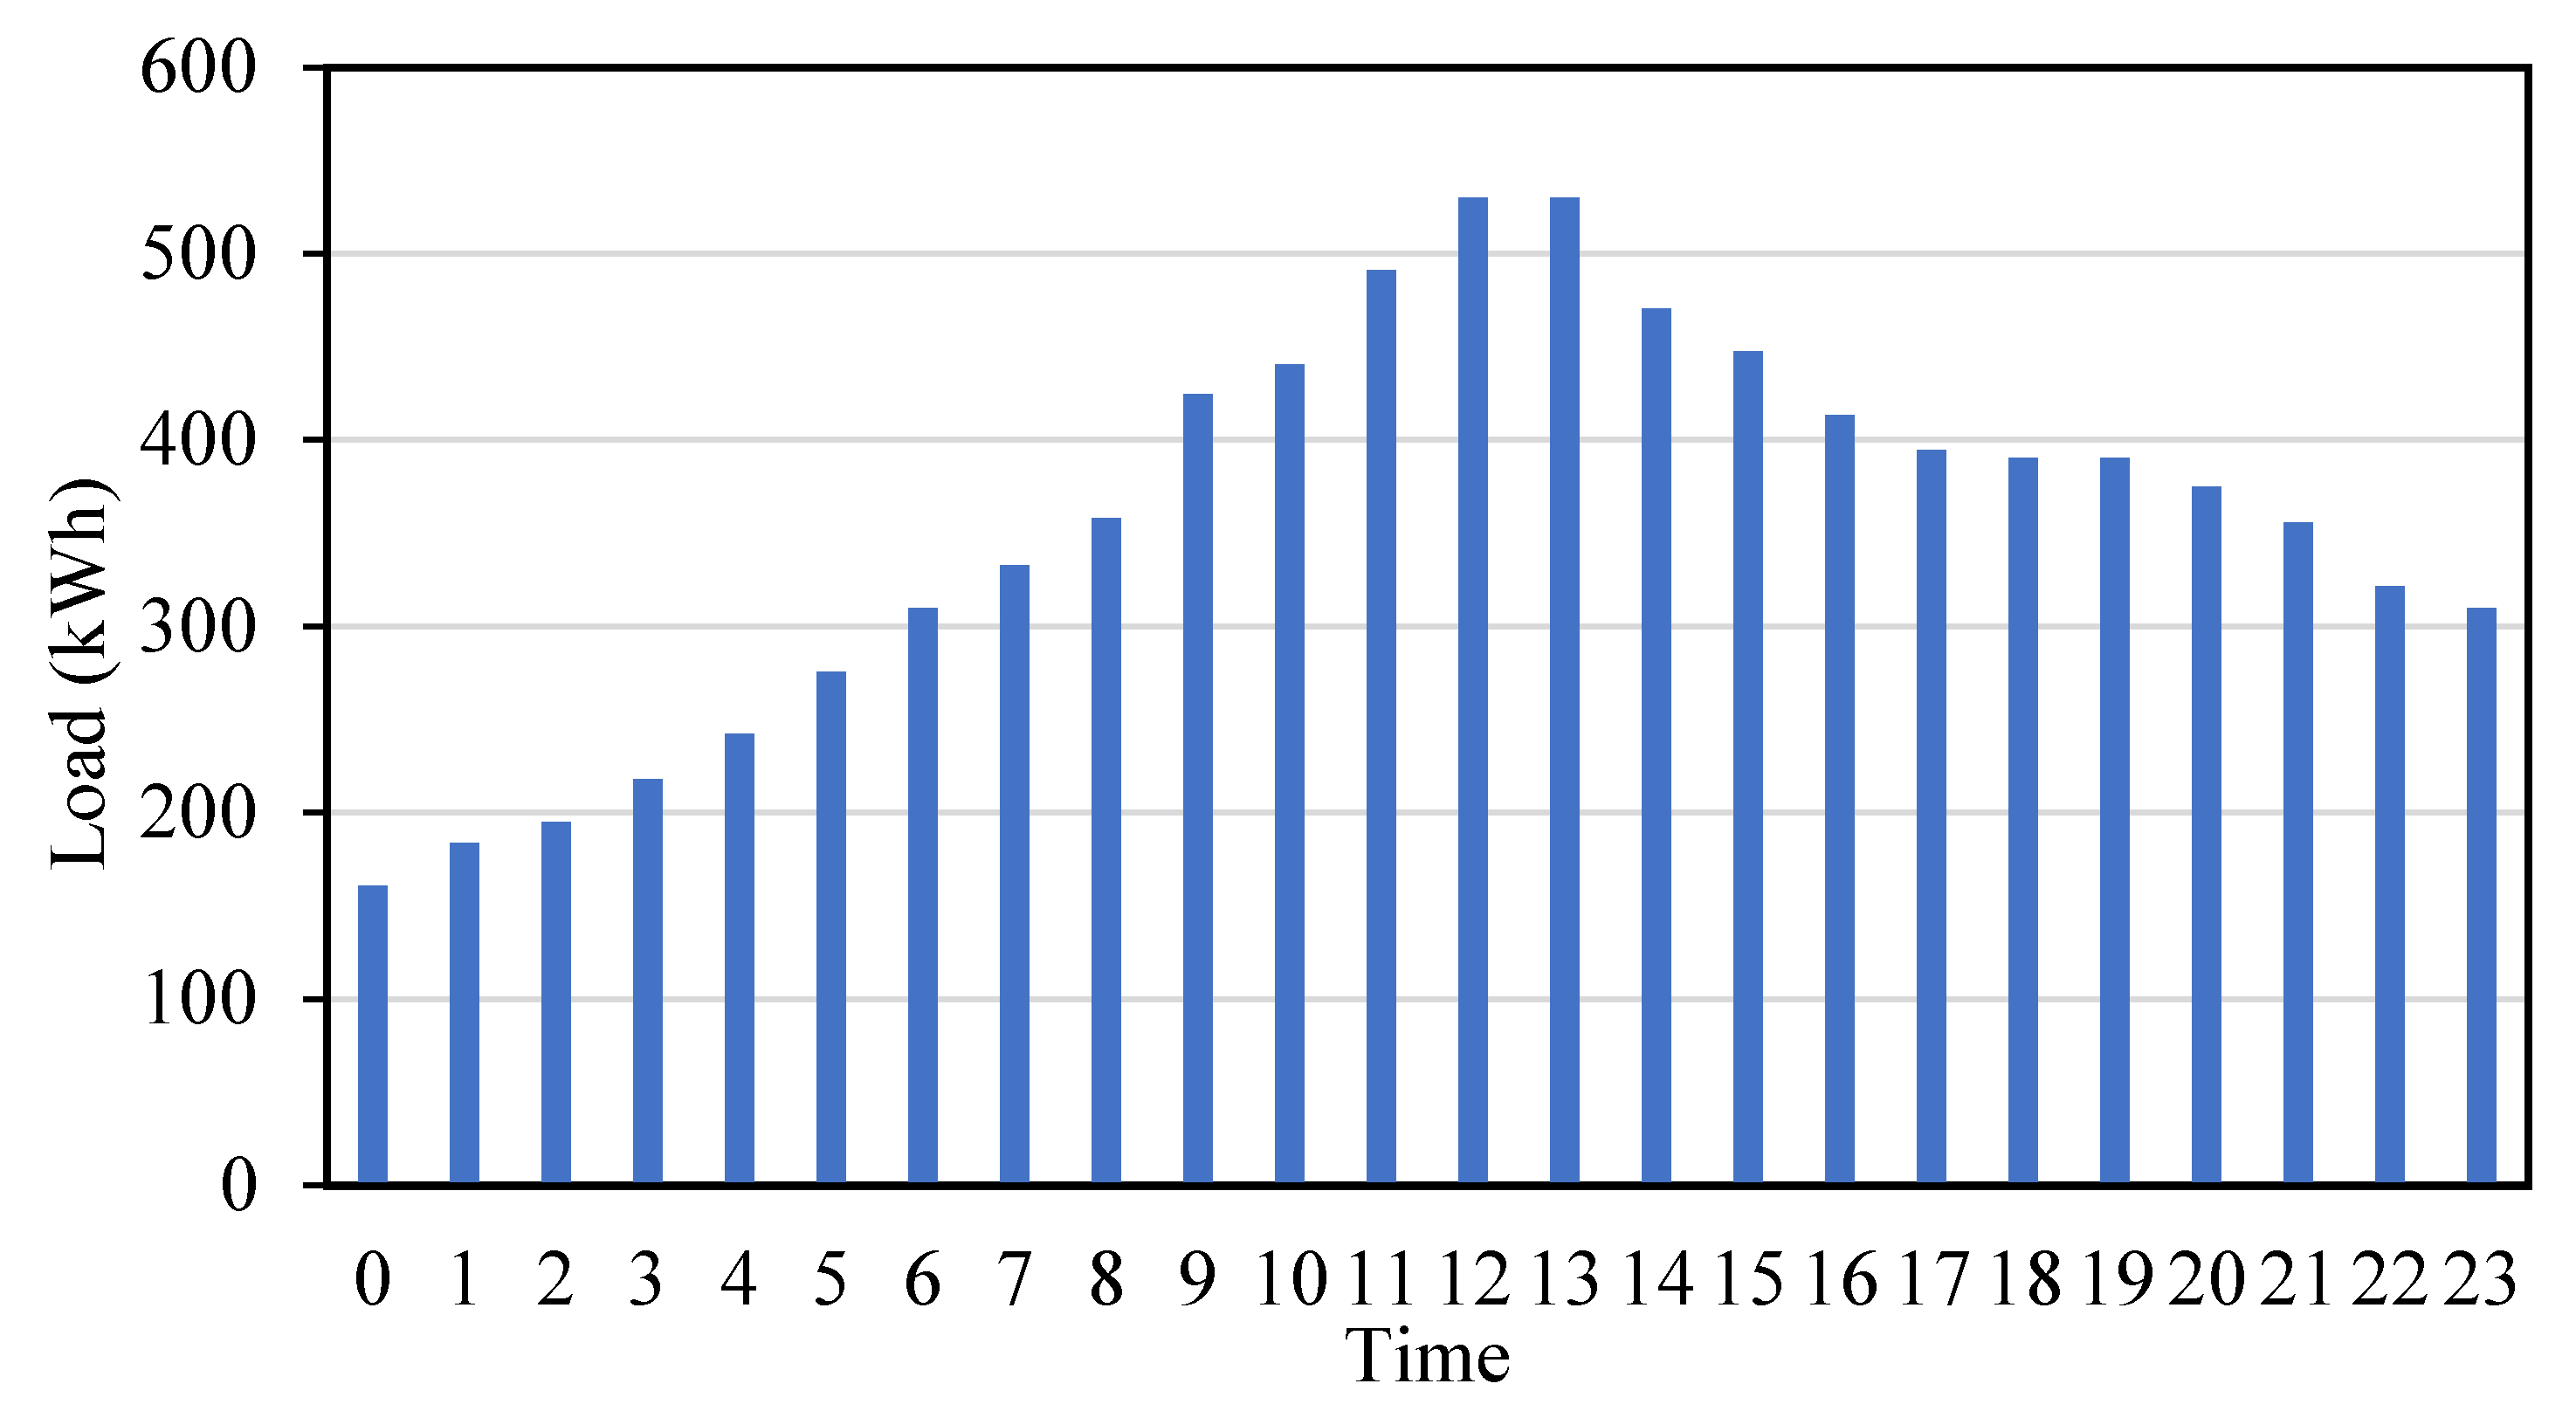
Within the Zaatari camp, eight medical facilities provide a comprehensive range of healthcare services to refugees, including primary care and selective secondary and tertiary healthcare. These services encompass health consultations, antenatal care, community health initiatives, nutrition support programs, screening and treatment, health promotion, and mental health support. However, budget constraints and increasing healthcare demands, particularly for non-communicable disease (NCD) services, have presented significant challenges. In response, mobile hospitals have become a primary focus in refugee camps due to their capacity to offer comprehensive and adaptable healthcare solutions [18]. These mobile medical units are equipped to provide a wide spectrum of healthcare services, including surgical procedures, emergency care, and specialized treatments. However, mobile hospitals require a consistent and reliable energy supply to operate various types of critical medical equipment, such as ventilators, diagnostic devices, surgical tools, and life support systems. Consequently, mobile hospitals have higher energy requirements than small clinics. Table 1 provides a list of the major types of medical and non-medical equipment commonly used in mobile hospitals, along with estimated daily operation hours and energy demands. This information is used to create a typical load profile, as shown in Figure 3, which illustrates the total electrical energy consumption of the mobile hospital. This load profile is instrumental in determining the sizing requirements for the hybrid power plant utilizing wind and biogas energy sources.

2.2. System Description

Figure 4 illustrates the schematic layout of the envisaged hybrid power plant, designed to cater to the energy requirements of the Zaatari camp. This integrated facility comprises an assortment of biogas and diesel generators, a wind turbine, and a sophisticated control unit. The subsequent subsections provide comprehensive descriptions of each constituent within the hybrid power system.

2.2.1. Wind Turbine

For the estimation of wind turbine power generation, the TRNSYS® software V.15 leveraged the T y p e   90 model. This particular model offers a highly accurate prediction of power production by leveraging a meticulously crafted power-to-wind-speed relationship, conveniently stored in an external data file. Additionally, the model accounts for fluctuations in air density and the influence of elevated wind speeds. The underlying equations driving this model are elaborated upon in the subsequent section. Equation (1) below defines the power output of the wind turbine, denoted as P in k i l o w a t t s   ( k W ) [31].
P = 1 2 ρ A R U 0   3 4 a ( 1 a ) 2
In Equation (1), ρ represents the air density ( k g / m 3 ), A R signifies the rotor surface area in s q u a r e   m e t e r s , U 0 corresponds to the wind speed ( m / s ), and the variable a is defined as the axial induction factor.
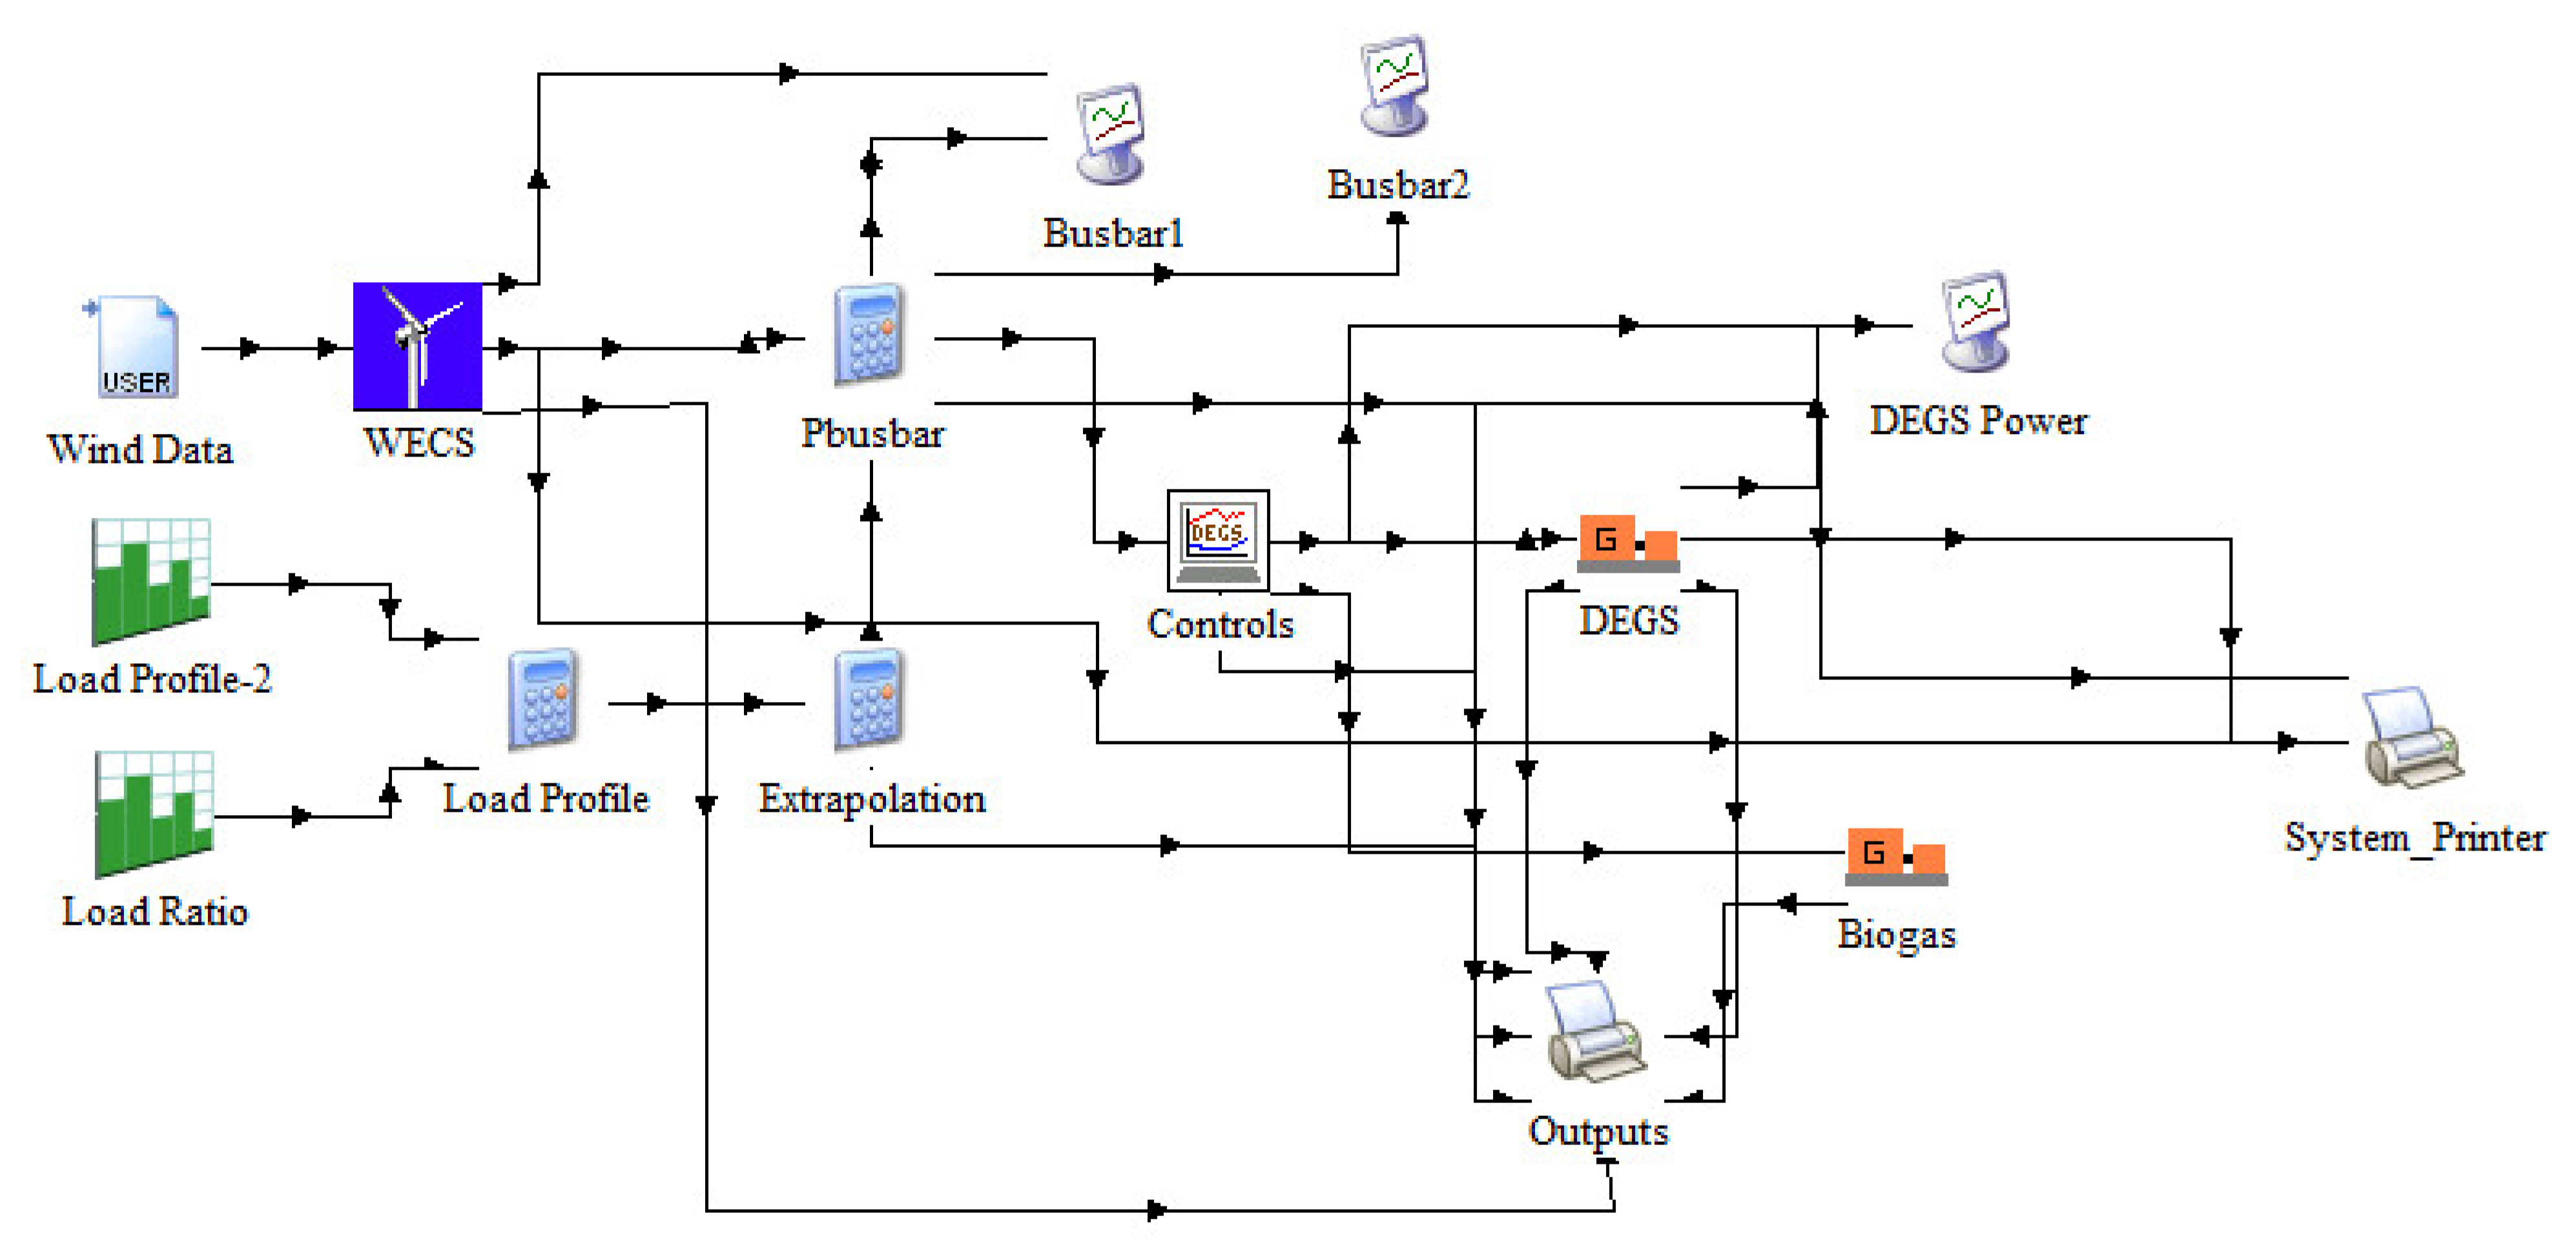
To determine the most suitable wind turbine model for integration into the hybrid power plant, an assessment of four distinct commercial wind turbines was conducted using a TRNSYS® simulation, as outlined in Figure 5 and Table 2. All selected wind turbines have the capacity to generate up to 600   k W of power based on the prevailing wind speeds. It should be noted that TRNSYS® was chosen for this part of the study for several reasons. These include its extensive library of components for wind turbine systems, its robust numerical solver that ensures accurate results, and its ability to integrate with other software tools, enhancing its utility in multidisciplinary system configurations.
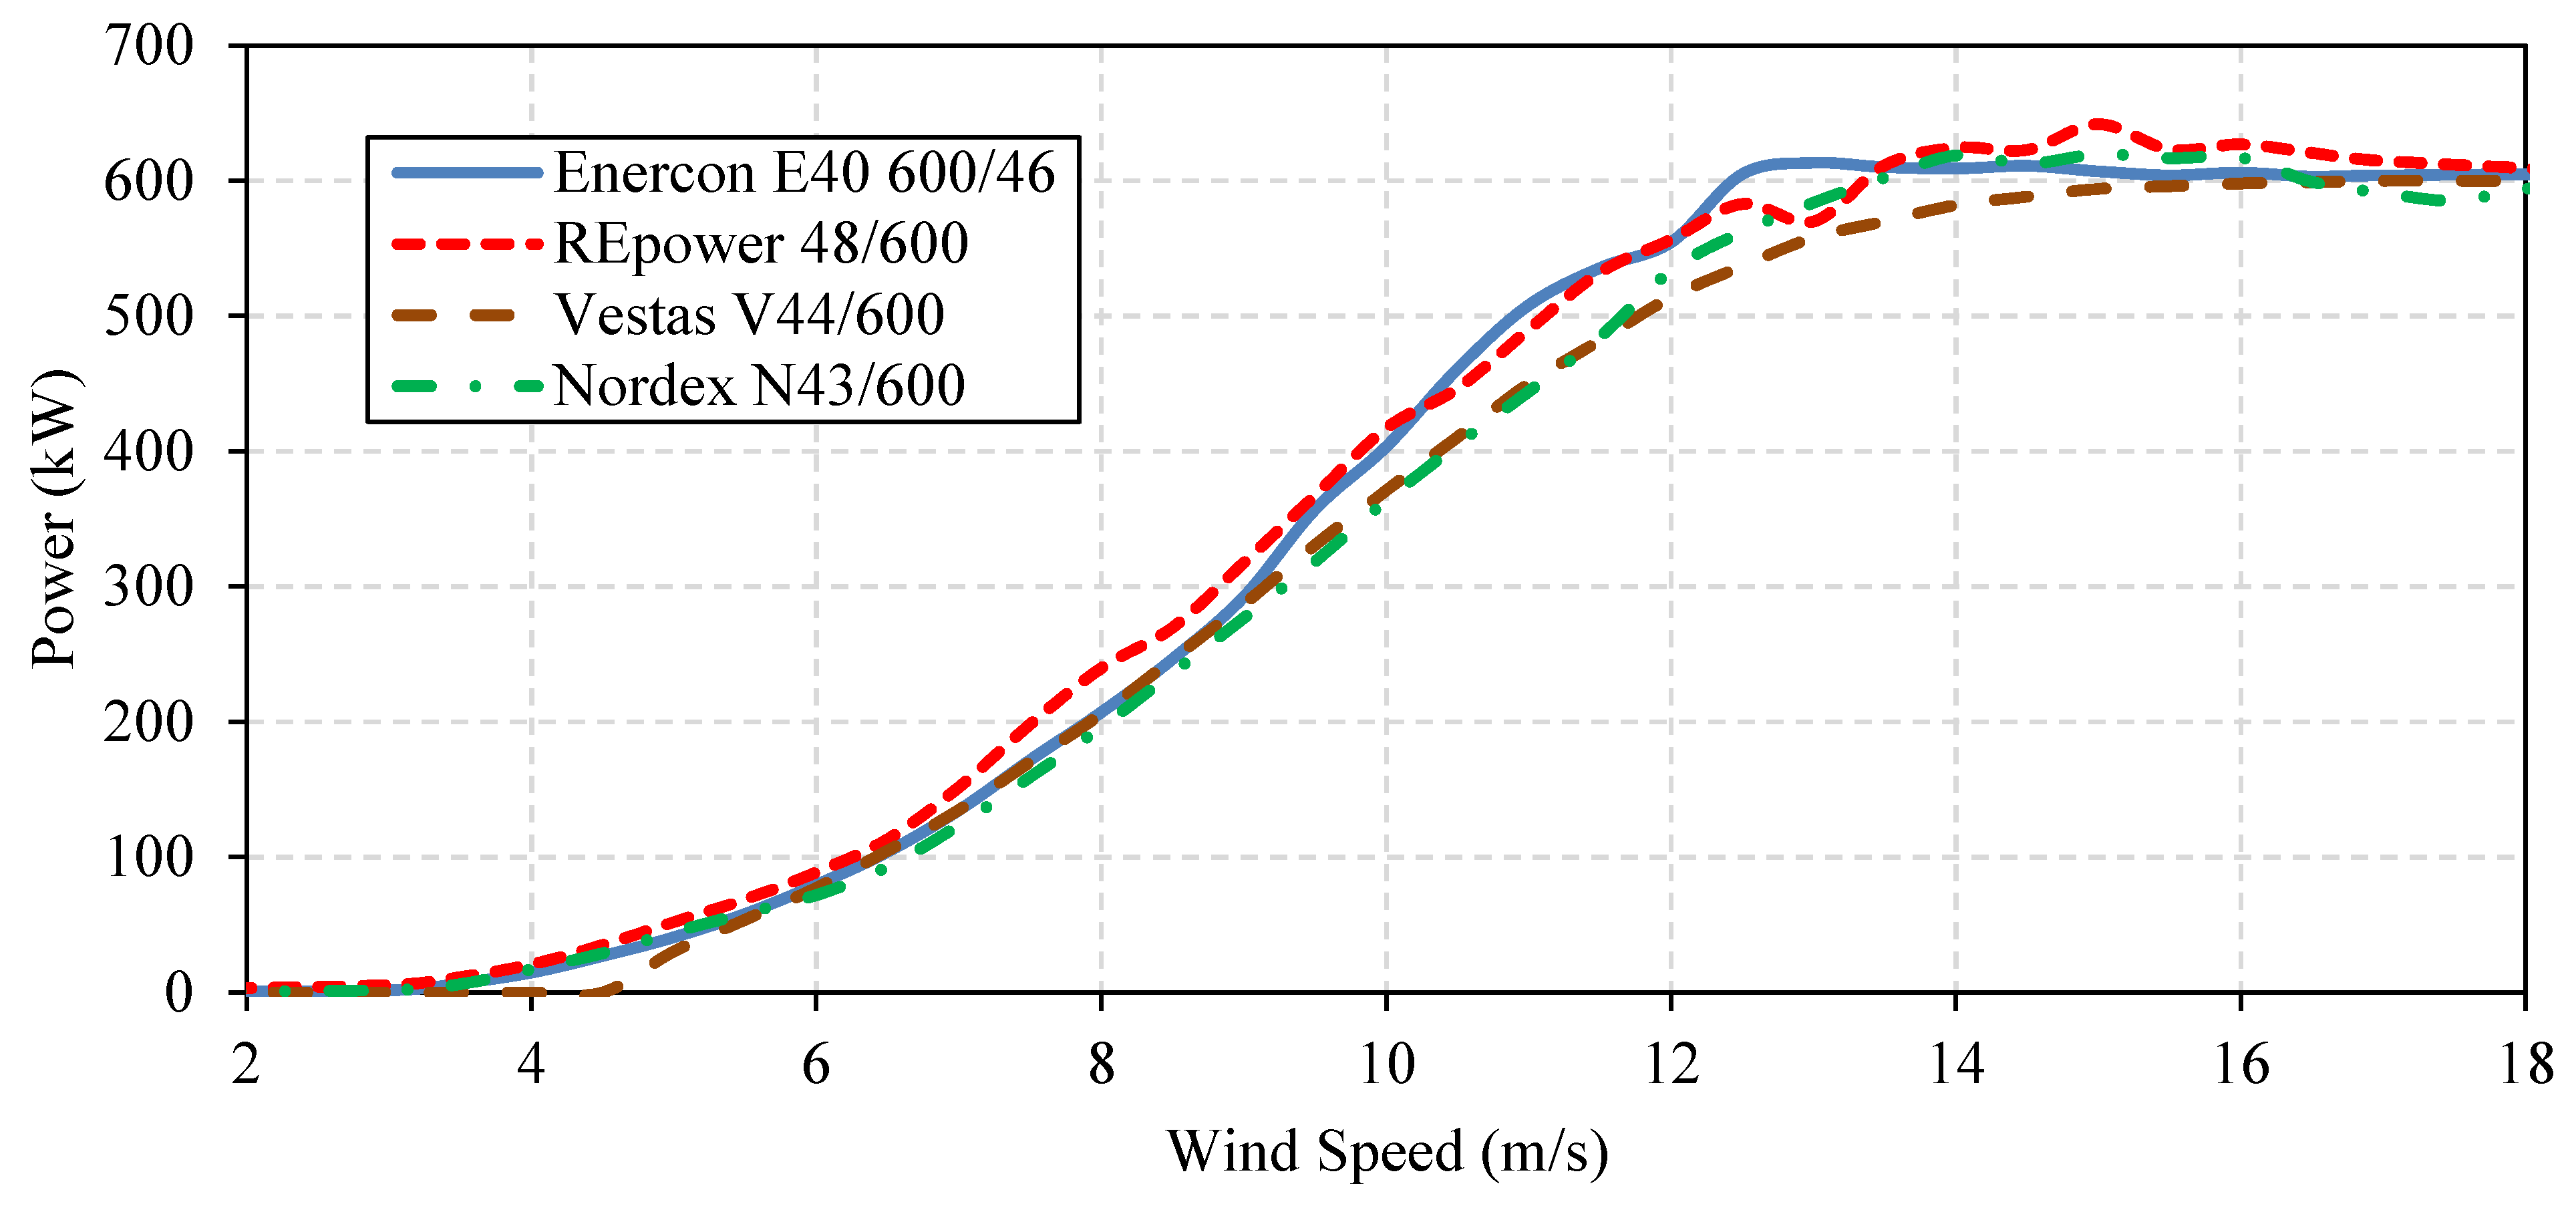
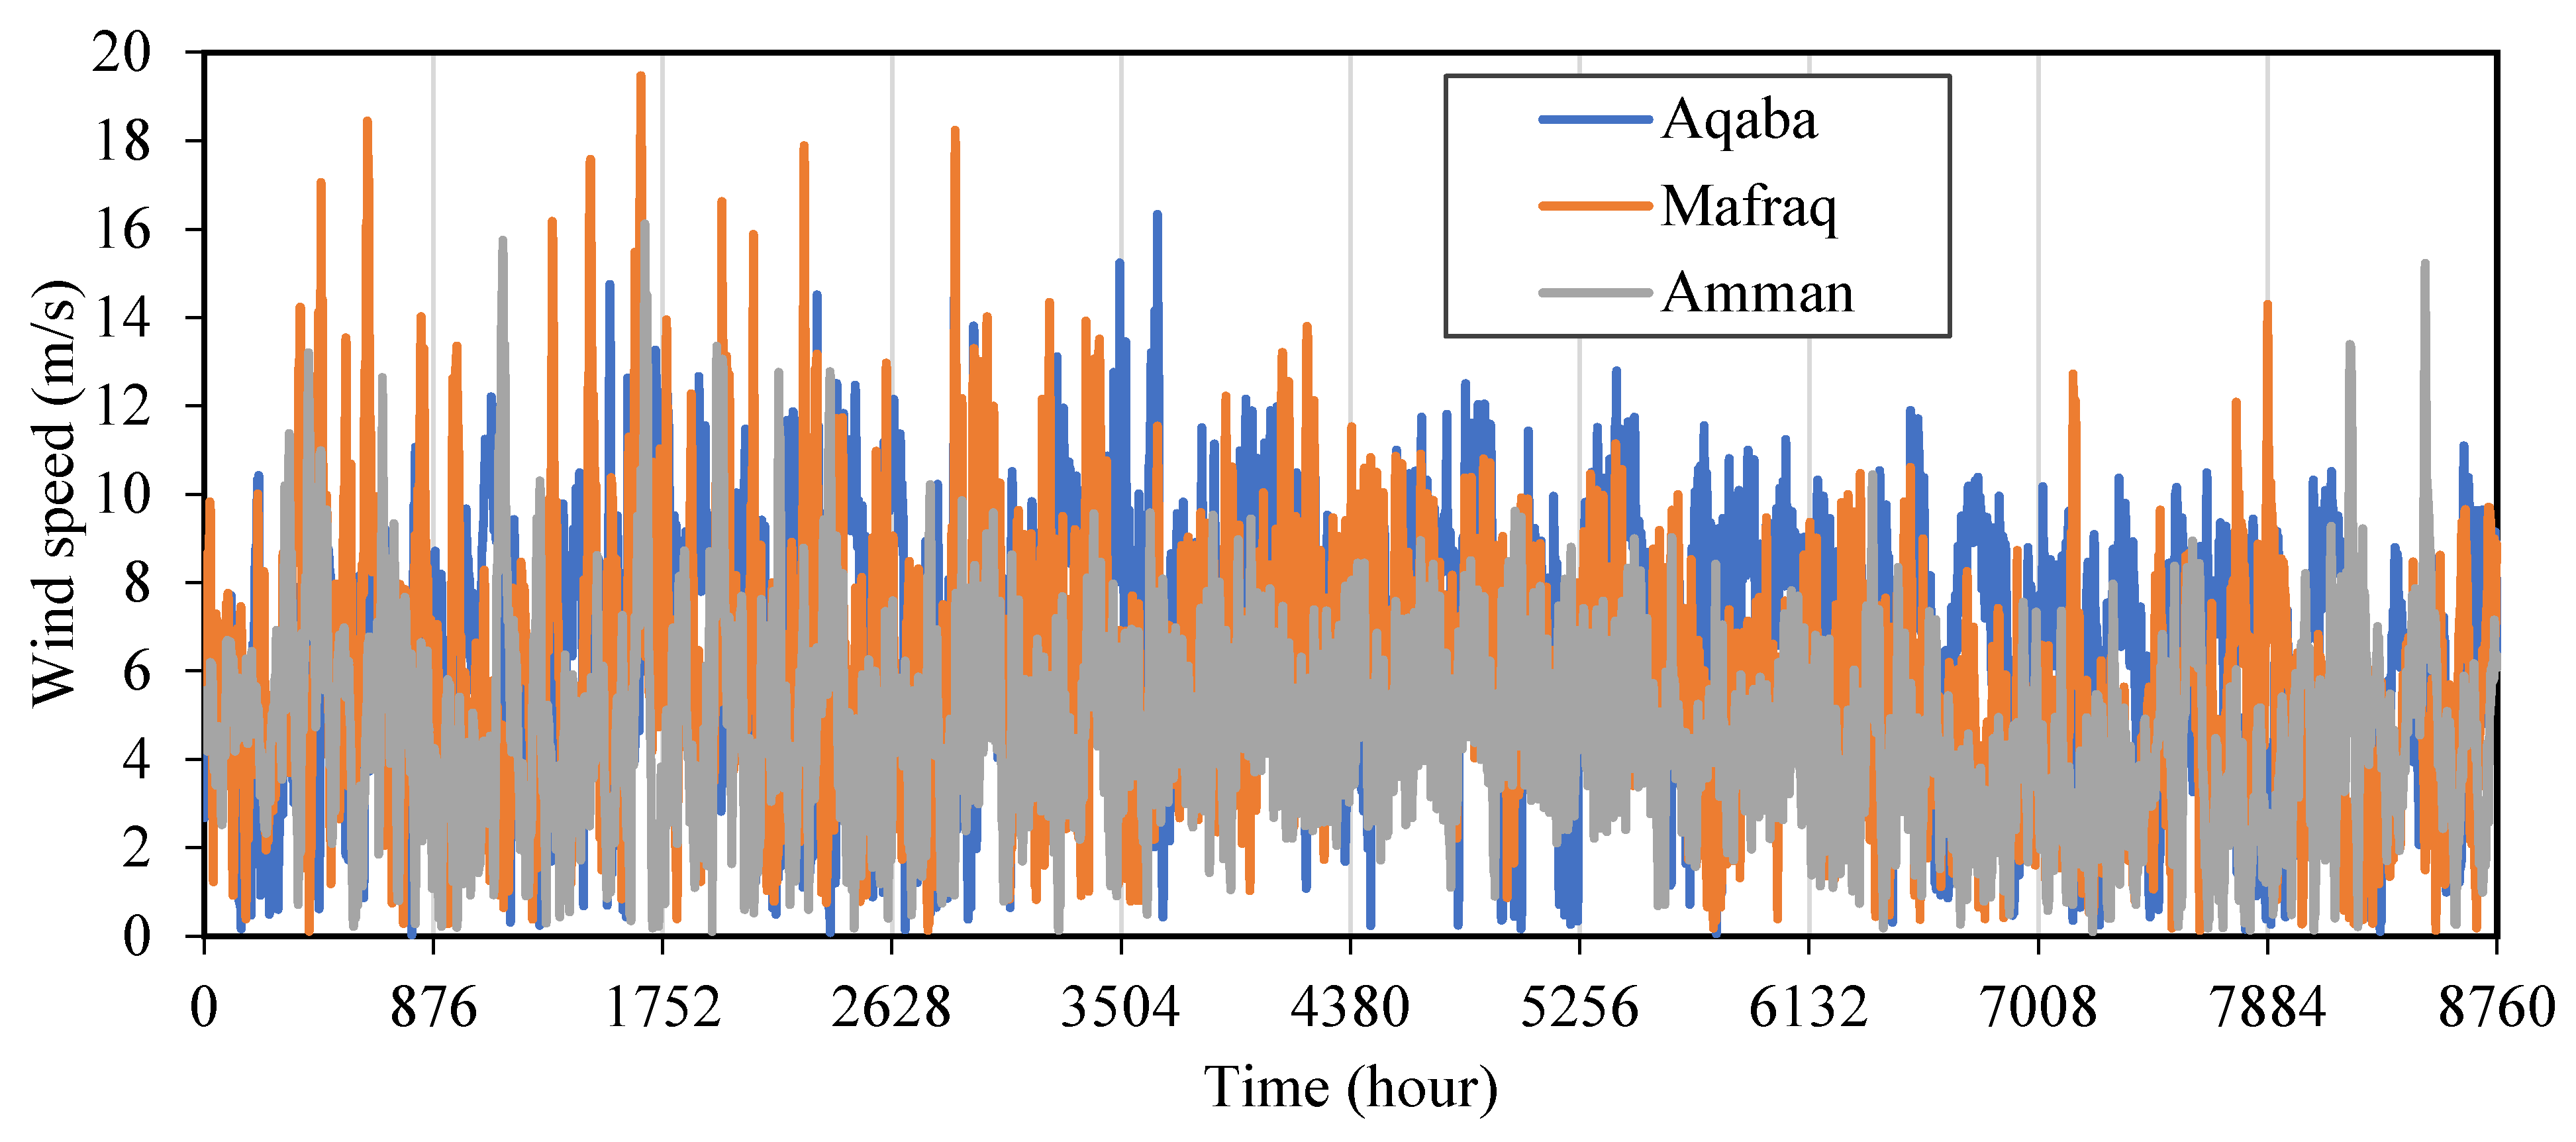
Figure 6 illustrates the power output characteristics of each turbine as a function of wind speed. Notably, it is evident from the figure that all turbines exhibit identical power curves within a wind speed range of 1 12   m / s . However, as wind speeds surpass 12   m / s , discrepancies emerge among the power curves, with certain turbines sustaining a consistent power output, while others exhibit fluctuations. To gauge the available wind energy resources within the Zaatari camp location, the wind speed data for Mafraq city were employed in the TRNSYS® simulations. Figure 7 displays the hourly wind speeds throughout the year for Mafraq, along with data for two additional cities, Amman and Aqaba. The yearly average wind speed for Mafraq city stands at approximately 8.2   m / s , equivalent to an estimated 220   k W of power potential.

2.2.2. Biogas and Diesel Generators

In this study, we utilize the electricity generated by the biogas generator to fulfill the hospital’s essential energy requirements. To achieve this, we estimate the hourly energy output achievable from the biogas generated within the wastewater treatment plant, assuming an average calorific value of 0.22   M J / m 3 [34]. Additionally, we assume a continuous and consistent biogas production rate on an hourly basis throughout each day. Furthermore, we consider the biogas generator to have an efficiency of 35 % [34]. To ensure an uninterrupted power supply, we integrate a diesel generator as a backup system to bridge any energy shortfalls during periods of deficiency. The quantity of diesel ( V d i e s e l ) consumed in ( L i t e r / h o u r ) can be approximated using Equation (2) [35], where E D G is the hourly demand covered by the diesel generator in k W h .
V d i e s e l = 0.244 × E D G + 7

2.3. Energy Dispatch Strategy

As previously mentioned, the biogas generator is designated to meet the base energy demand, while wind energy is harnessed to satisfy additional requirements whenever possible. However, in scenarios where wind energy proves insufficient to fulfill the demand, we have outlined three distinctive approaches:
Scenario 1 (SC#1): In this setup, a reliable grid connection is consistently available and can be utilized to compensate for any energy deficit. The grid serves as a fallback option, ensuring uninterrupted power supply even during periods of low wind energy production.
Scenario 2 (SC#2): In situations where grid access is characterized by occasional unpredictable outages, our system is designed with a 95 % autonomy target. This means that it aims to be self-sufficient for 95 % of the time. Should wind energy fall short and the grid is either unavailable or only covers 5 % of the demand, a diesel generator is deployed to bridge the energy gap.
Scenario 3 (SC#3): In the absence of a grid connection characterized by a fully off-grid ( 100 % autonomy) configuration, the diesel generator becomes the primary means to meet the entire energy demand.
In instances where there is an energy surplus generated by the system, the excess is channeled back into the grid, accumulating as credit for the hospital. This credit can subsequently offset grid usage in SC#1 and SC#2, reducing operational costs. However, in the fully off-grid SC#3 scenario, any surplus energy is dissipated as heat.

2.4. Techno-Economic Model

Energy performance is a crucial factor when examining a renewable energy system (RES). It is important to consider economic factors while analyzing the technical performance to ultimately select the optimal configuration that leads to the highest energy savings for a given investment. The main key performance indicator (KPI) employed in this analysis is the levelized cost of energy (LCOE). This metric is typically used to determine the total cost per unit of energy, considering all cost elements throughout the entire lifespan of the system. This includes expenses such as operation and maintenance, and any other related costs. The LCOE of the RES can be estimated using the following approach [36]:
L C O E = C i + t = 1 L T M t   ( 1 + r ) t + t = 1 L T F c o s t ( 1 + r ) t + t = 1 L T B g r i d ( 1 + r ) t t = 1 L T h = 1 8760 D h ( 1 + r ) t
where C i represents the capital cost of the wind, BG, and DG systems; L T represents the system’s expected lifespan; M t is the system’s annual maintenance cost; and D h is the hospital’s demand. Further, r , F c o s t , and B g r i d represent the annual discount rate, diesel cost, and grid bill, respectively. As mentioned earlier, during periods of deficiency, the utility grid provides the remaining shortfall at a tariff ( G T ) of 0.16 USD/kWh [37].
RES fraction ( F R E S ) is utilized to evaluate the ability of the wind–BG system to meet the energy needs of the hospital. This is determined by computing the percentage of demand fulfilled by the wind–BG system (   D m e t h ), which can be computed using Equation (4) [38]:
F R E S = h = 1 8760   D m e t h h = 1 8760 D h
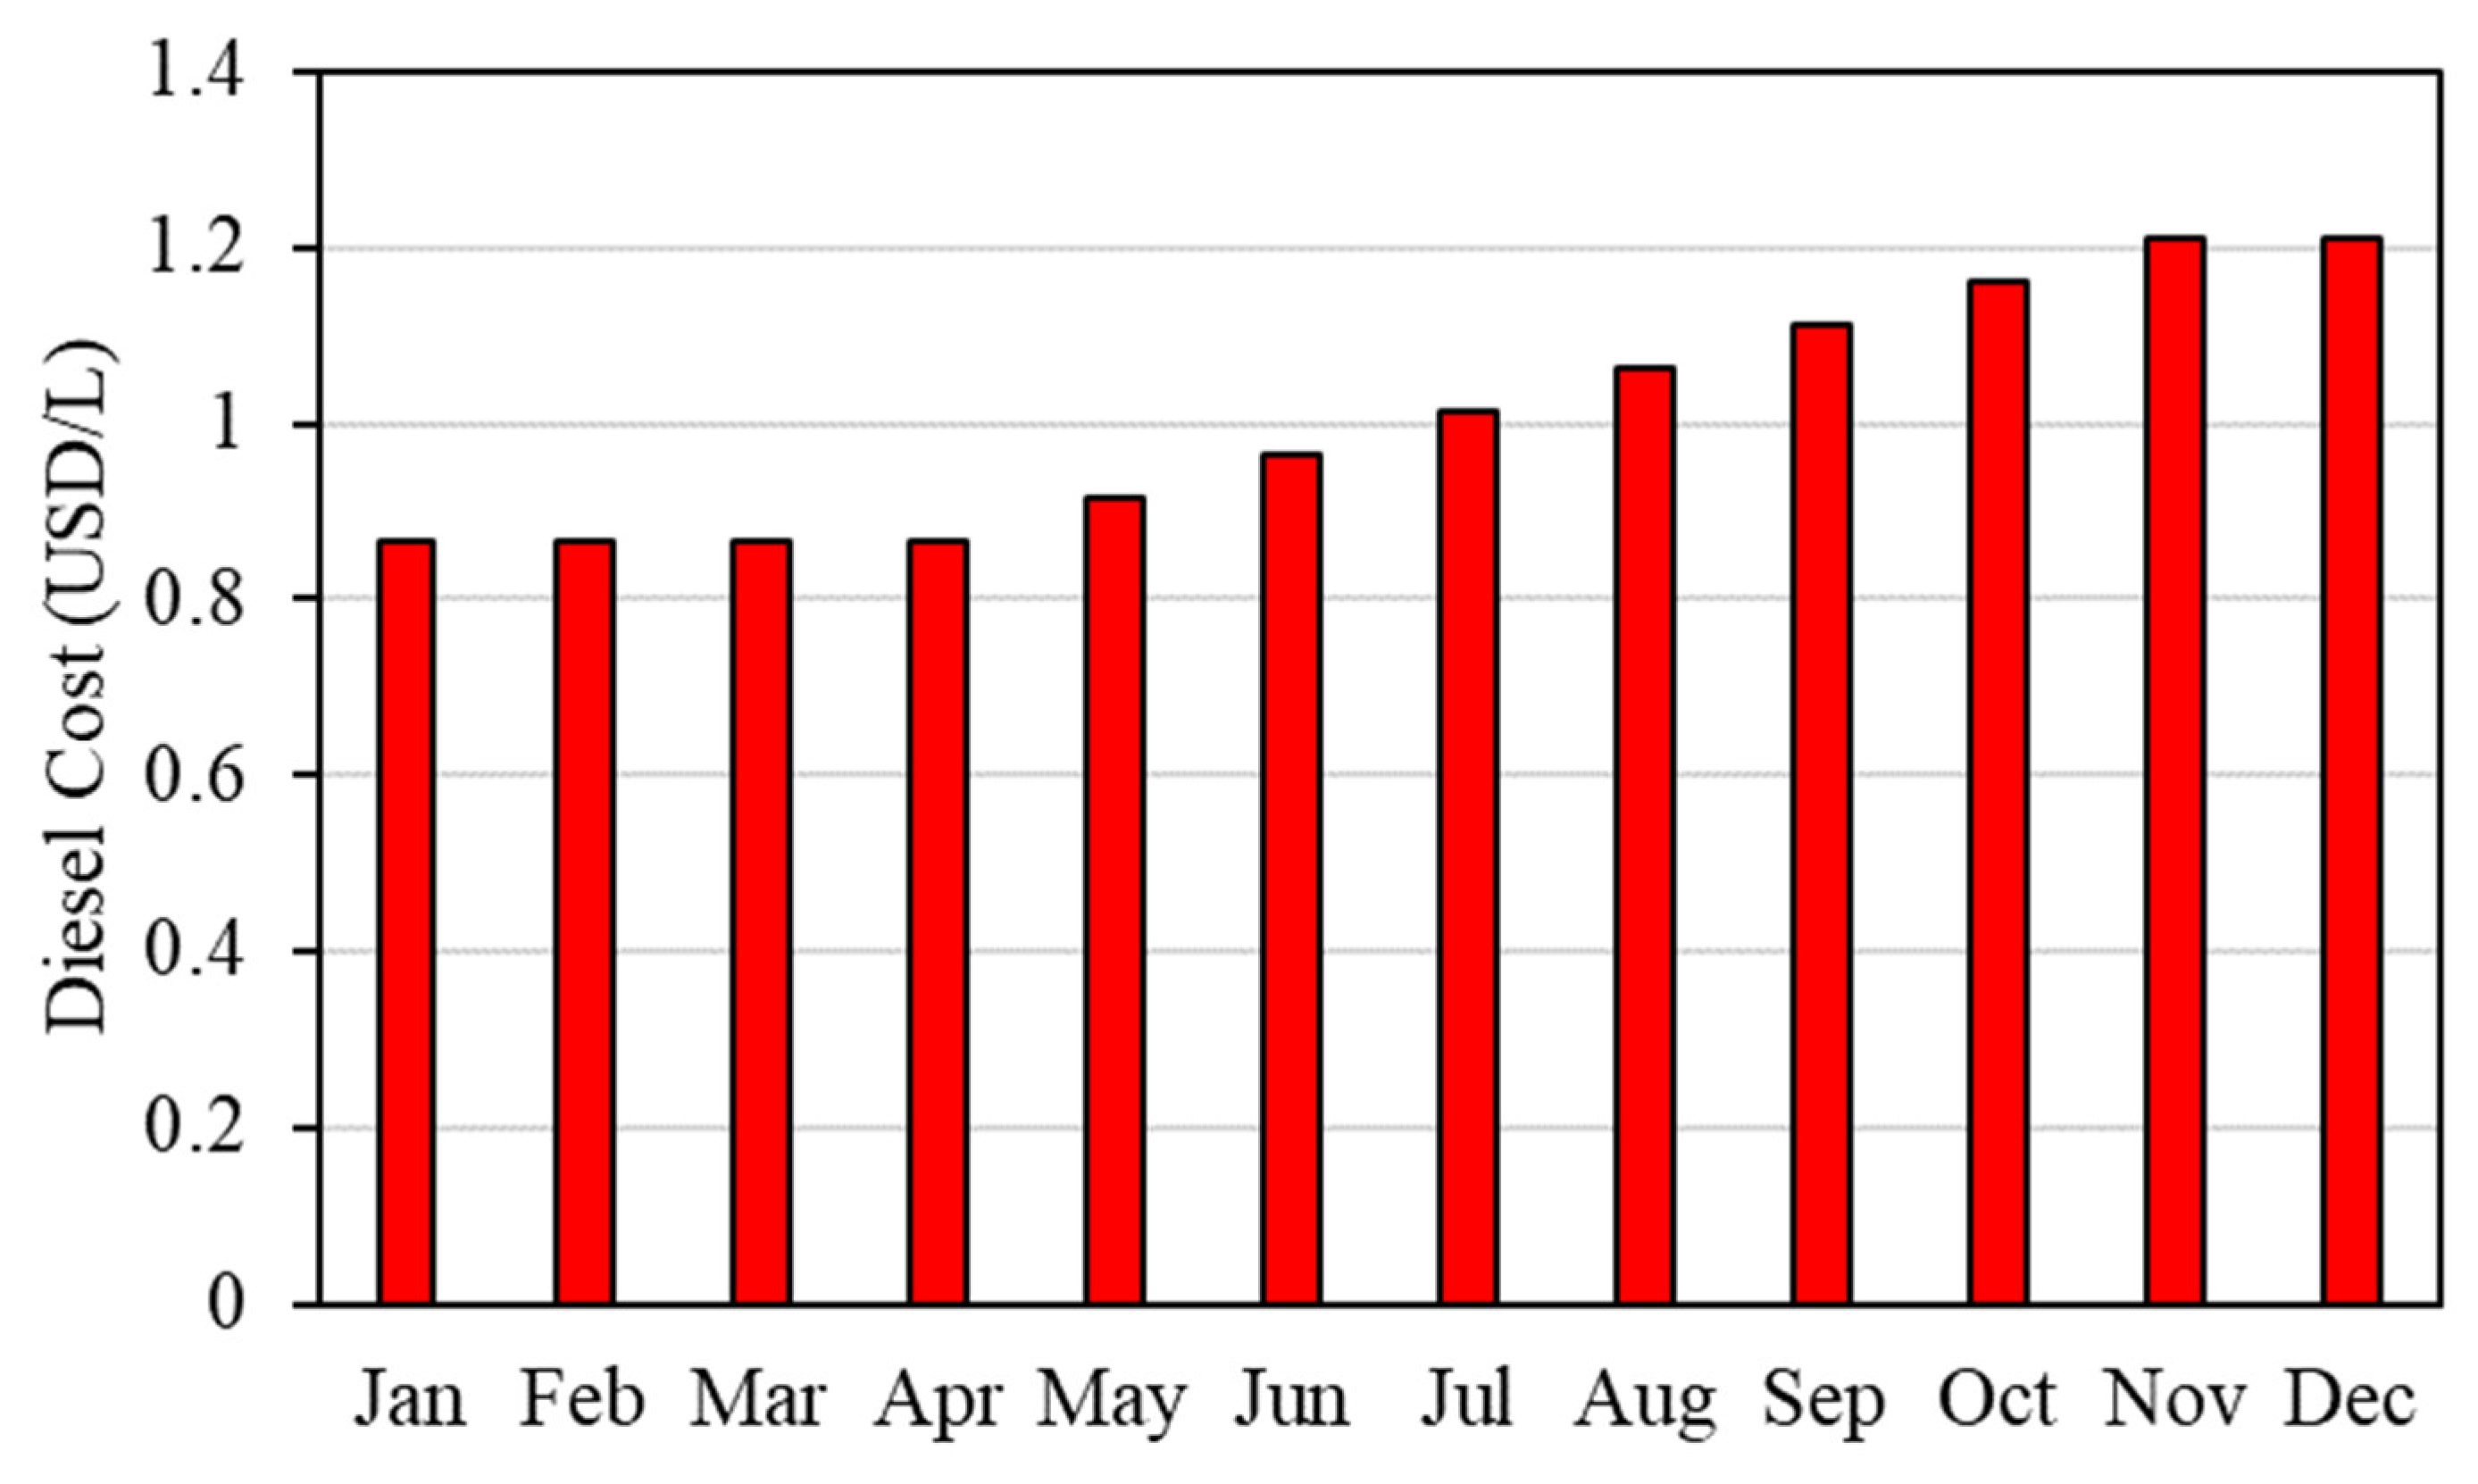
The economic parameters used in this study are displayed in Table 3, which shows the detailed cost of each component within the hybrid power system.
Table 3. The costs of the wind–biogas system, its lifespan, and the economic parameters used in this work.
ItemUnitValueReference
Capital cost of the wind systemUSD/kW 1325 [39]
Capital cost of the DG 200 [39]
Capital cost of the BG 1500 [35]
Yearly maintenance cost of the wind plant 18 [39]
Yearly maintenance cost of the DGUSD/h 0.01 [35]
Yearly maintenance cost of the BG 0.1 [35]
Wind lifespan Year 30 [39]
DG and BG lifespan 10 [39]
Diesel cost U S D / L Figure 8
Discount rate % 8.5 [40]
Figure 8. Monthly diesel costs in Jordan for the year 2022 [41].
Sustainability 15 14935 g008

2.5. Optimization Problem

In order to obtain the best solution, a nonlinear solving algorithm is used in this work. This algorithm considers several variables that control the hybrid system, where the relationship between the capacities of the system’s components is nonlinear. To evaluate the optimal capacities of these components, the generalized reduced gradient (GRG) algorithm is utilized, which can handle nonlinear inequality constraints. A bearing of search is made; for example, the dynamic requirements remain accurate even with small adjustments. If some of the dynamic requirements are not fully met due to the nonlinearity of the limitation functions, the Newton–Raphson technique is adopted to return to the requirement boundary [42]. The RESs are modeled and optimized using Microsoft Excel, validated in [36].
The primary objective of the optimization process is to achieve the lowest LCOE as it is a critical metric used to evaluate the cost-effectiveness of a power generation system over its lifetime. In this optimization, the key variables under consideration are the capacities of the DG and the wind turbine, which play a pivotal role in shaping the system’s performance and economic viability. The specific optimization constraints vary across the three cases:
  • In SC#1, no constraints are imposed;
  • In SC#2, a stringent constraint is introduced, targeting a 95% autonomy rate;
  • SC#3 represents the most self-reliant and off-grid configuration, characterized by a 100% autonomy constraint. In this scenario, the system is required to be fully self-sufficient, with no reliance on the grid. This necessitates careful capacity planning for both the DG and the wind turbine to ensure an uninterrupted energy supply.
In all scenarios, the optimization strives to strike the optimal balance between DG and wind turbine capacities, considering the unique constraints and requirements of each scenario to minimize the LCOE effectively. The estimation of the autonomy of the system takes into account the hourly energy production from wind, biogas, and diesel generator as well as the hourly demand of the hospital. Additionally, for calculating the LCOE, the model accounts for the capital cost of the system components, operation and maintenance costs, diesel cost, and grid electricity bill.

3. Results and Discussion

3.1. Sizing the Wind/BG/DG System for the Refugee Camp Hospital

When designing an energy system to meet the demands of a hospital, two critical factors come to the forefront: reliability and cost-effectiveness. The system must be reliable, ensuring that it can consistently meet the energy demands of the hospital. Simultaneously, it must maintain competitive energy costs to manage the operational expenses efficiently. This becomes particularly paramount when the system relies on renewable energy sources, such as wind energy, which are known for their significant variability and unpredictability.
The sizing of the hybrid system is mainly driven by the LCOE minimization goal with autonomy constraints depending on the analyzed scenario. In the currently developed model, the following points are considered:
  • The match between the supply (hourly energy production from wind, biogas, and diesel generator) and demand.
  • The capital cost of the system components, operation and maintenance costs, diesel cost, and grid electricity bill.
  • The lifespan of the system.
  • The annual discount rates.
So, in SC#1 the only critical factor used to size the system is the LCOE, whereas in SC#2 and SC#3 both LCOE and the autonomy of the system are critical for the sizing.
To mitigate the challenges associated with the variability and unpredictability of wind energy, our approach involves harnessing abundant resources and implementing a robust backup system. As elucidated in the methodology section, the Zaatari refugee camp boasts a wastewater treatment plant that currently, and regrettably, releases biogas into the atmosphere without utilization. This untapped resource not only represents a missed opportunity but also contributes to additional environmental concerns. By incorporating this readily available biogas resource into our energy system, we not only enhance its reliability but also reduce its environmental impact, making our solution even more sustainable.
The biogas generated offers a continuous and reliable power source, capable of supplying approximately 59   k W of power. Given the frequent power outages experienced in the camp, the necessity of a backup system is evident. Diesel generators are a common backup option, but they come with associated costs, prompting us to seek alternative power sources. The camp’s geographical location presents a promising wind energy potential, making it a viable candidate to meet the hospital’s energy needs.
In our analysis, we begin by examining the impact of the diesel generator (DG) capacity and the wind system capacity (utilizing turbine T2) on two critical aspects: the autonomy of the proposed energy system (comprising wind, biogas, diesel generator, and the grid) and the LCOE, as illustrated in Figure 9. Figure 9a reveals that a system equipped with a single turbine ( 0.6   M W capacity) and a 59.1   k W biogas generator (BG) can fulfill nearly 72 % of the demand, achieving the lowest LCOE at approximately 0.07   U S D / k W h , as demonstrated in Figure 9b.
Introducing a 150   k W diesel generator significantly enhances the system’s autonomy, achieving nearly 97 % coverage with only 3 % reliance on the grid. However, this addition nearly doubles the LCOE. Furthermore, incorporating two turbines dramatically extends the system autonomy without the need for a diesel generator. Interestingly, further increases in the number of turbines do not substantially improve the autonomy but, instead, result in a significant rise in the LCOE. The primary reason behind this phenomenon is the mismatch between demand and the wind turbine’s supply. Consequently, sizing the hospital’s energy system necessitates careful consideration of both technical feasibility and economic viability.
Table 4 outlines the optimal wind, biogas, and diesel generator system configurations across three scenarios: the optimal system with the lowest LCOE in S C # 1 , the optimal system with the lowest LCOE and 95 % autonomy in S C # 2 , and, finally, the optimal system with the lowest LCOE and 100 % autonomy in S C # 3 .
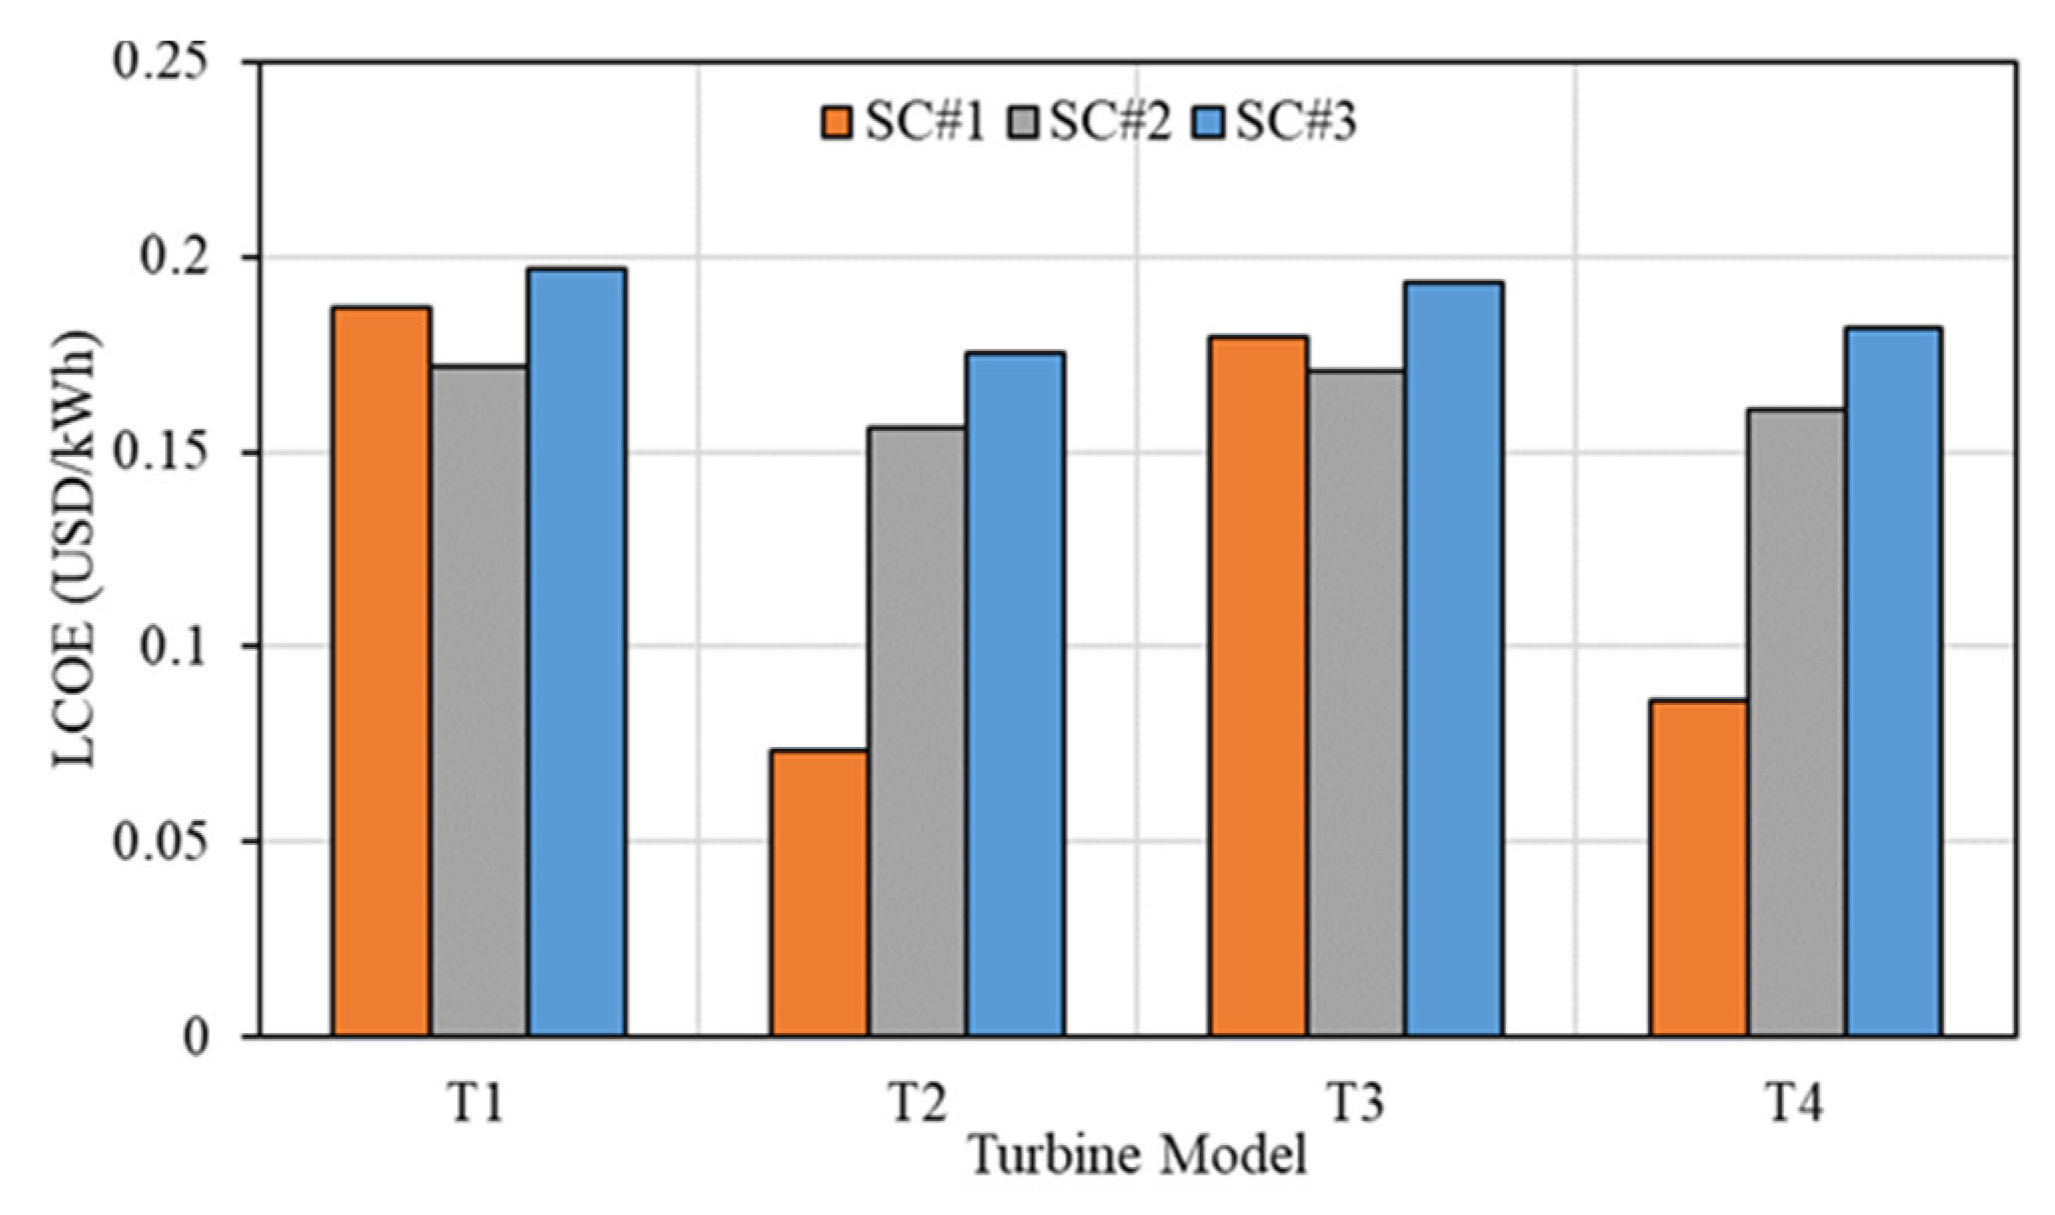
The optimization process identified turbine T2 as the most suitable choice for the specific location under study. This selection was based on technical specifications, including cut-in and rated speeds, that align more favorably with the local wind resources. Consequently, this choice maximizes the utilization of wind energy while simultaneously reducing the LCOE, as illustrated in Figure 10.
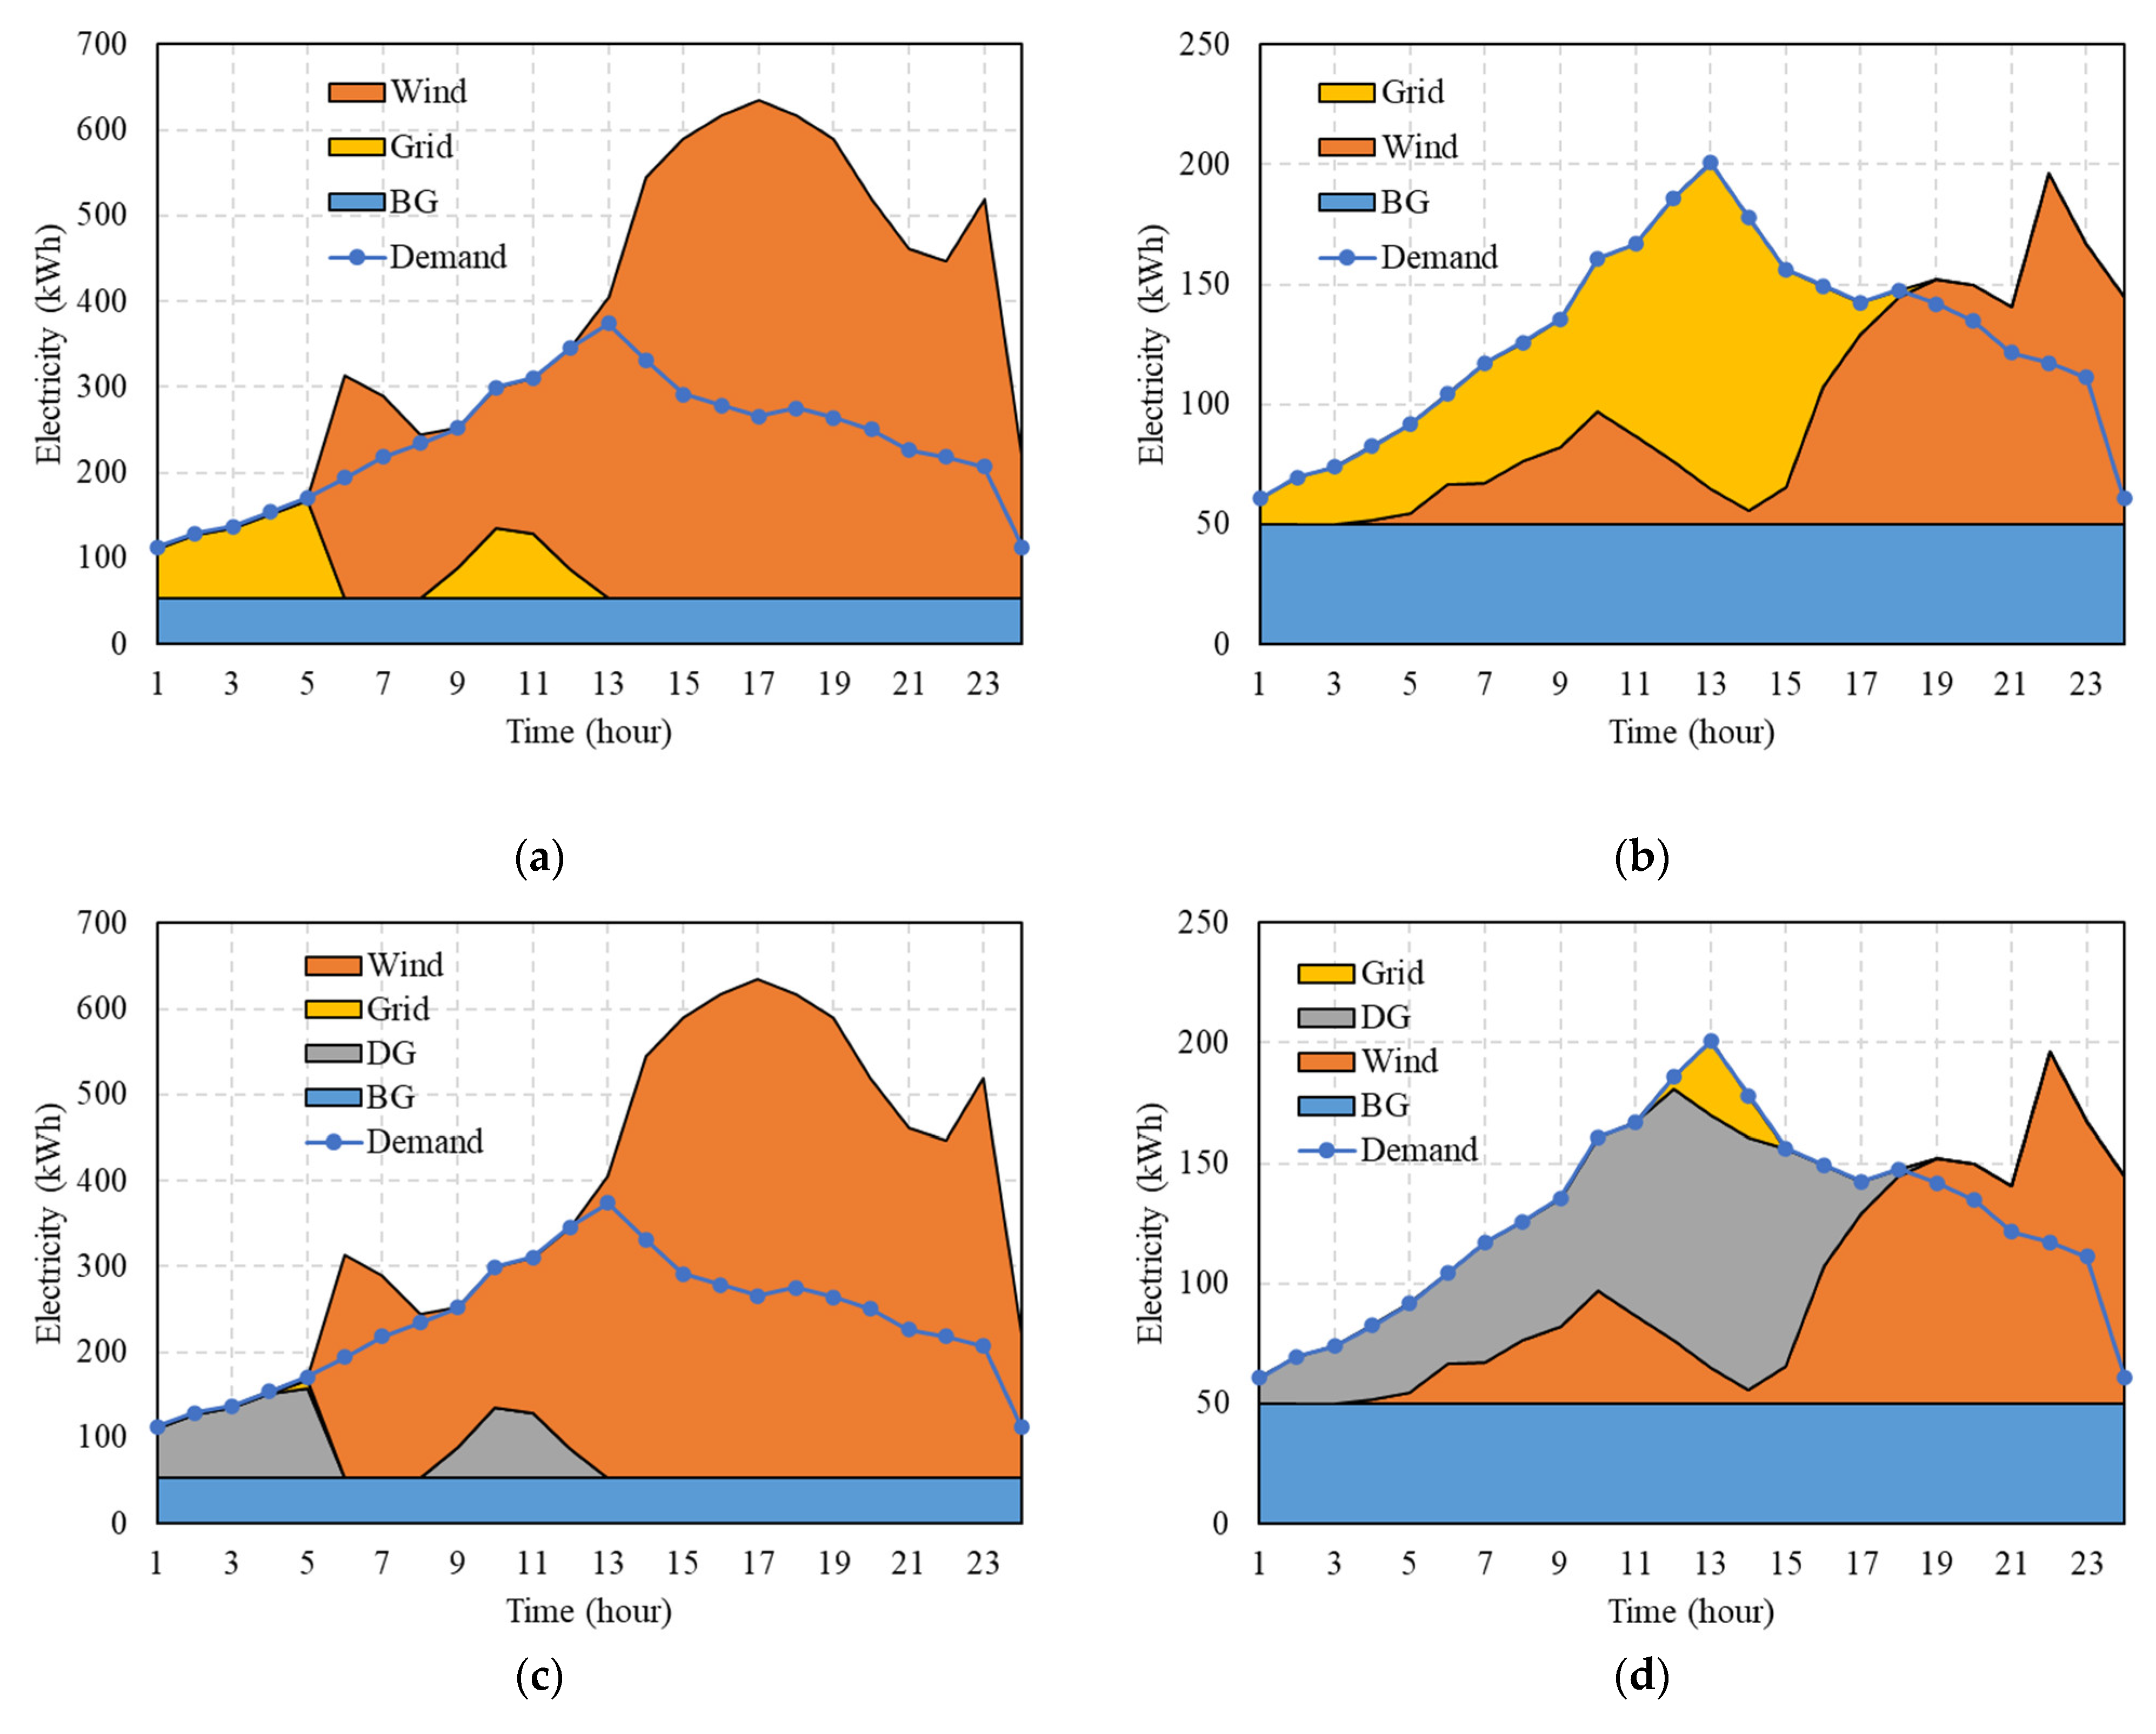
Table 4 provides a comprehensive overview of the LCOE across the three considered scenarios. In SC#1, where the grid tariff is 0.16   U S D / k W h , the LCOE is at its lowest, presenting an appealing option. However, SC#1 also involves a significant reliance on the grid, covering approximately 38 % of the demand. As depicted in Figure 11a,b, this dependency varies among months. This reliance raises concerns due to the camp’s frequent power outages, emphasizing the importance of pursuing a higher autonomy system by introducing an additional backup source. In this case, the diesel generator serves as the backup in both SC#2 and SC#3. This augmentation increases the autonomy but concurrently elevates the electricity costs due to the added capital cost of the DG and the expense of diesel fuel.
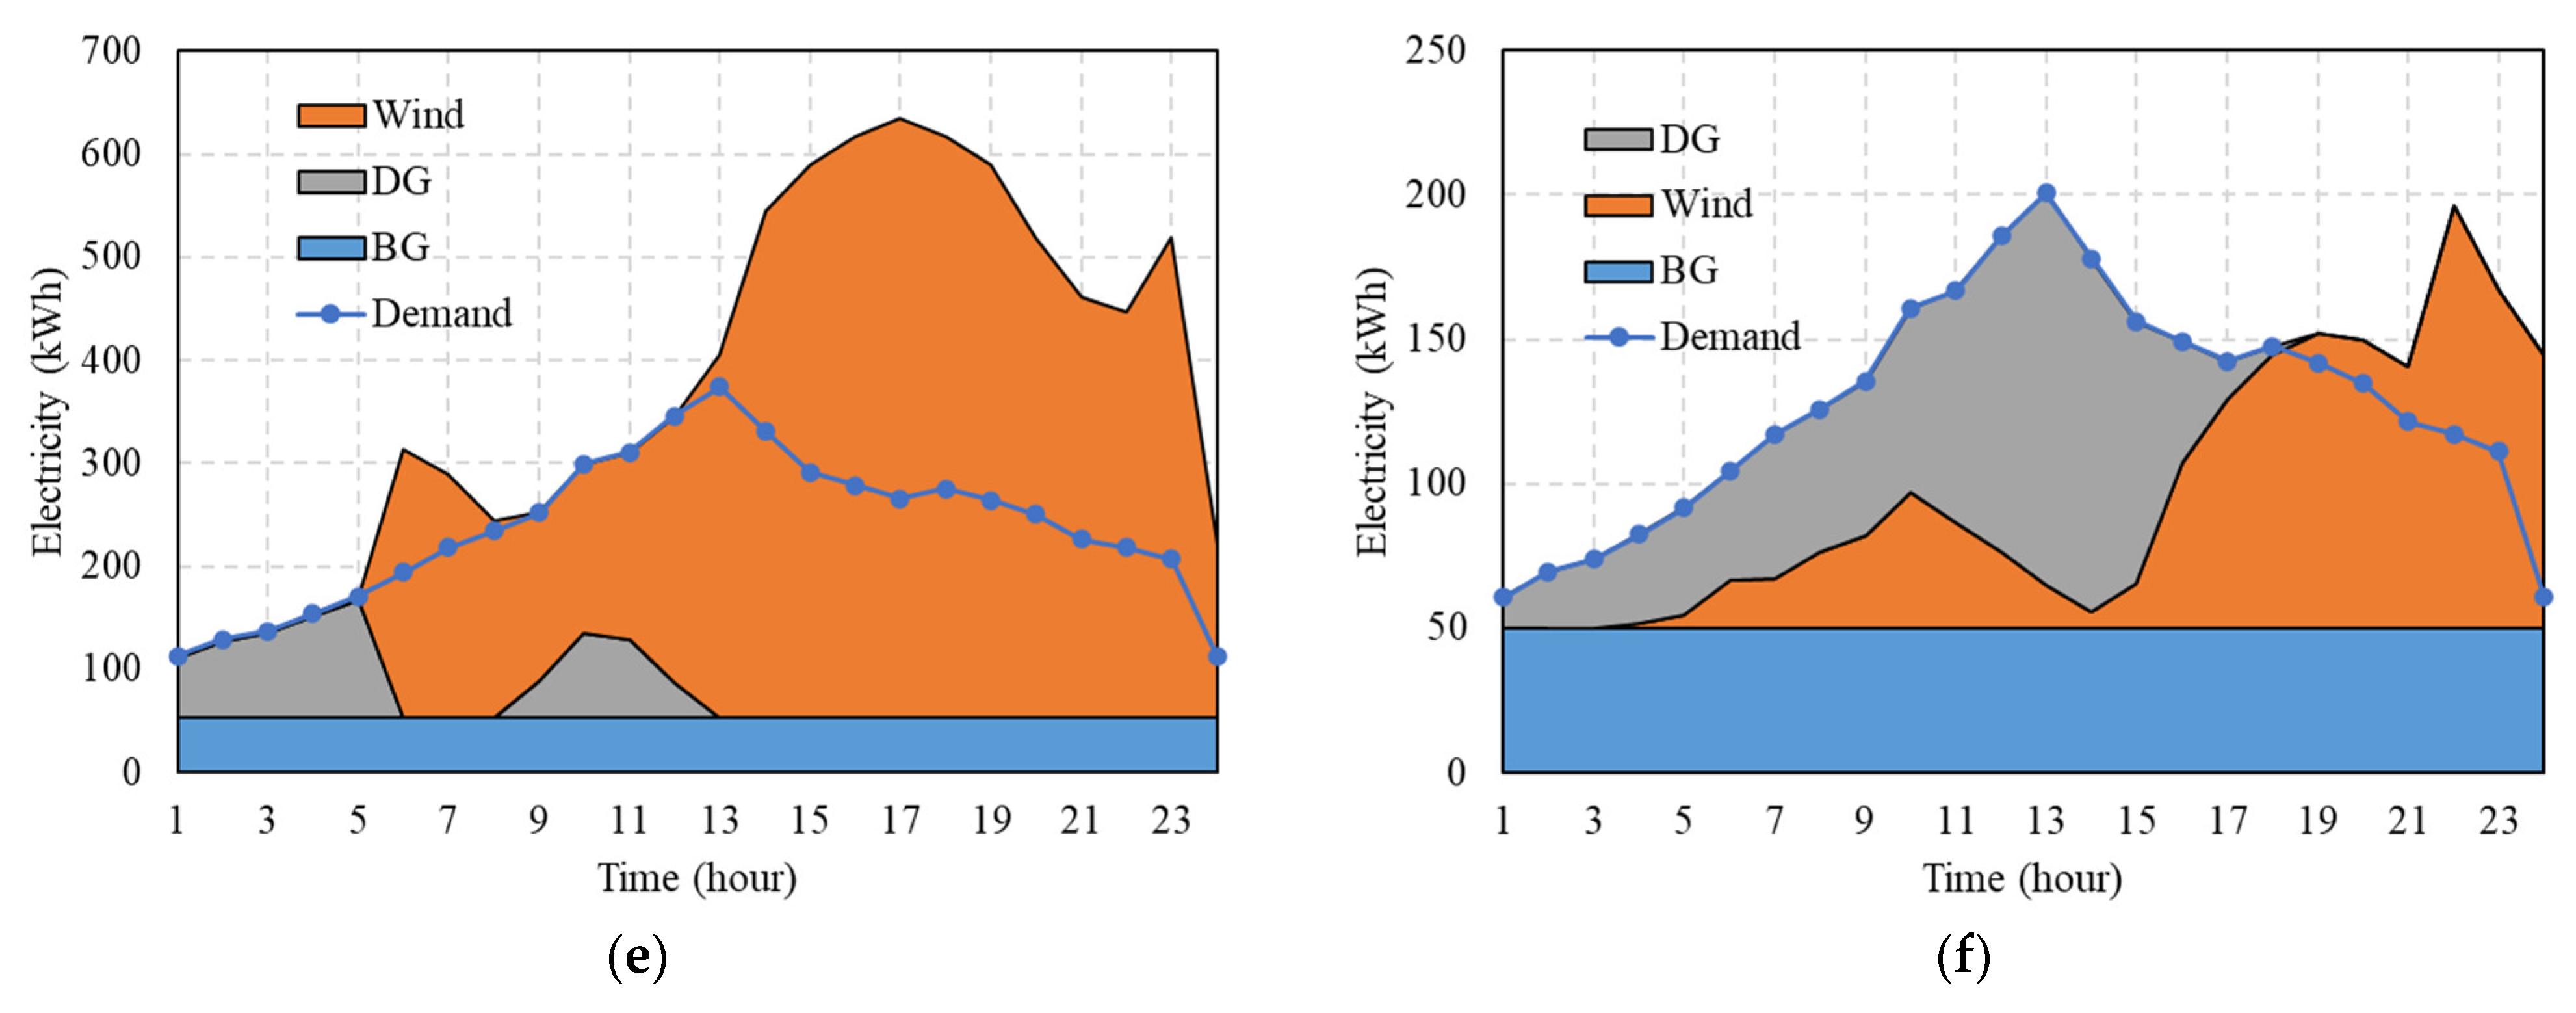
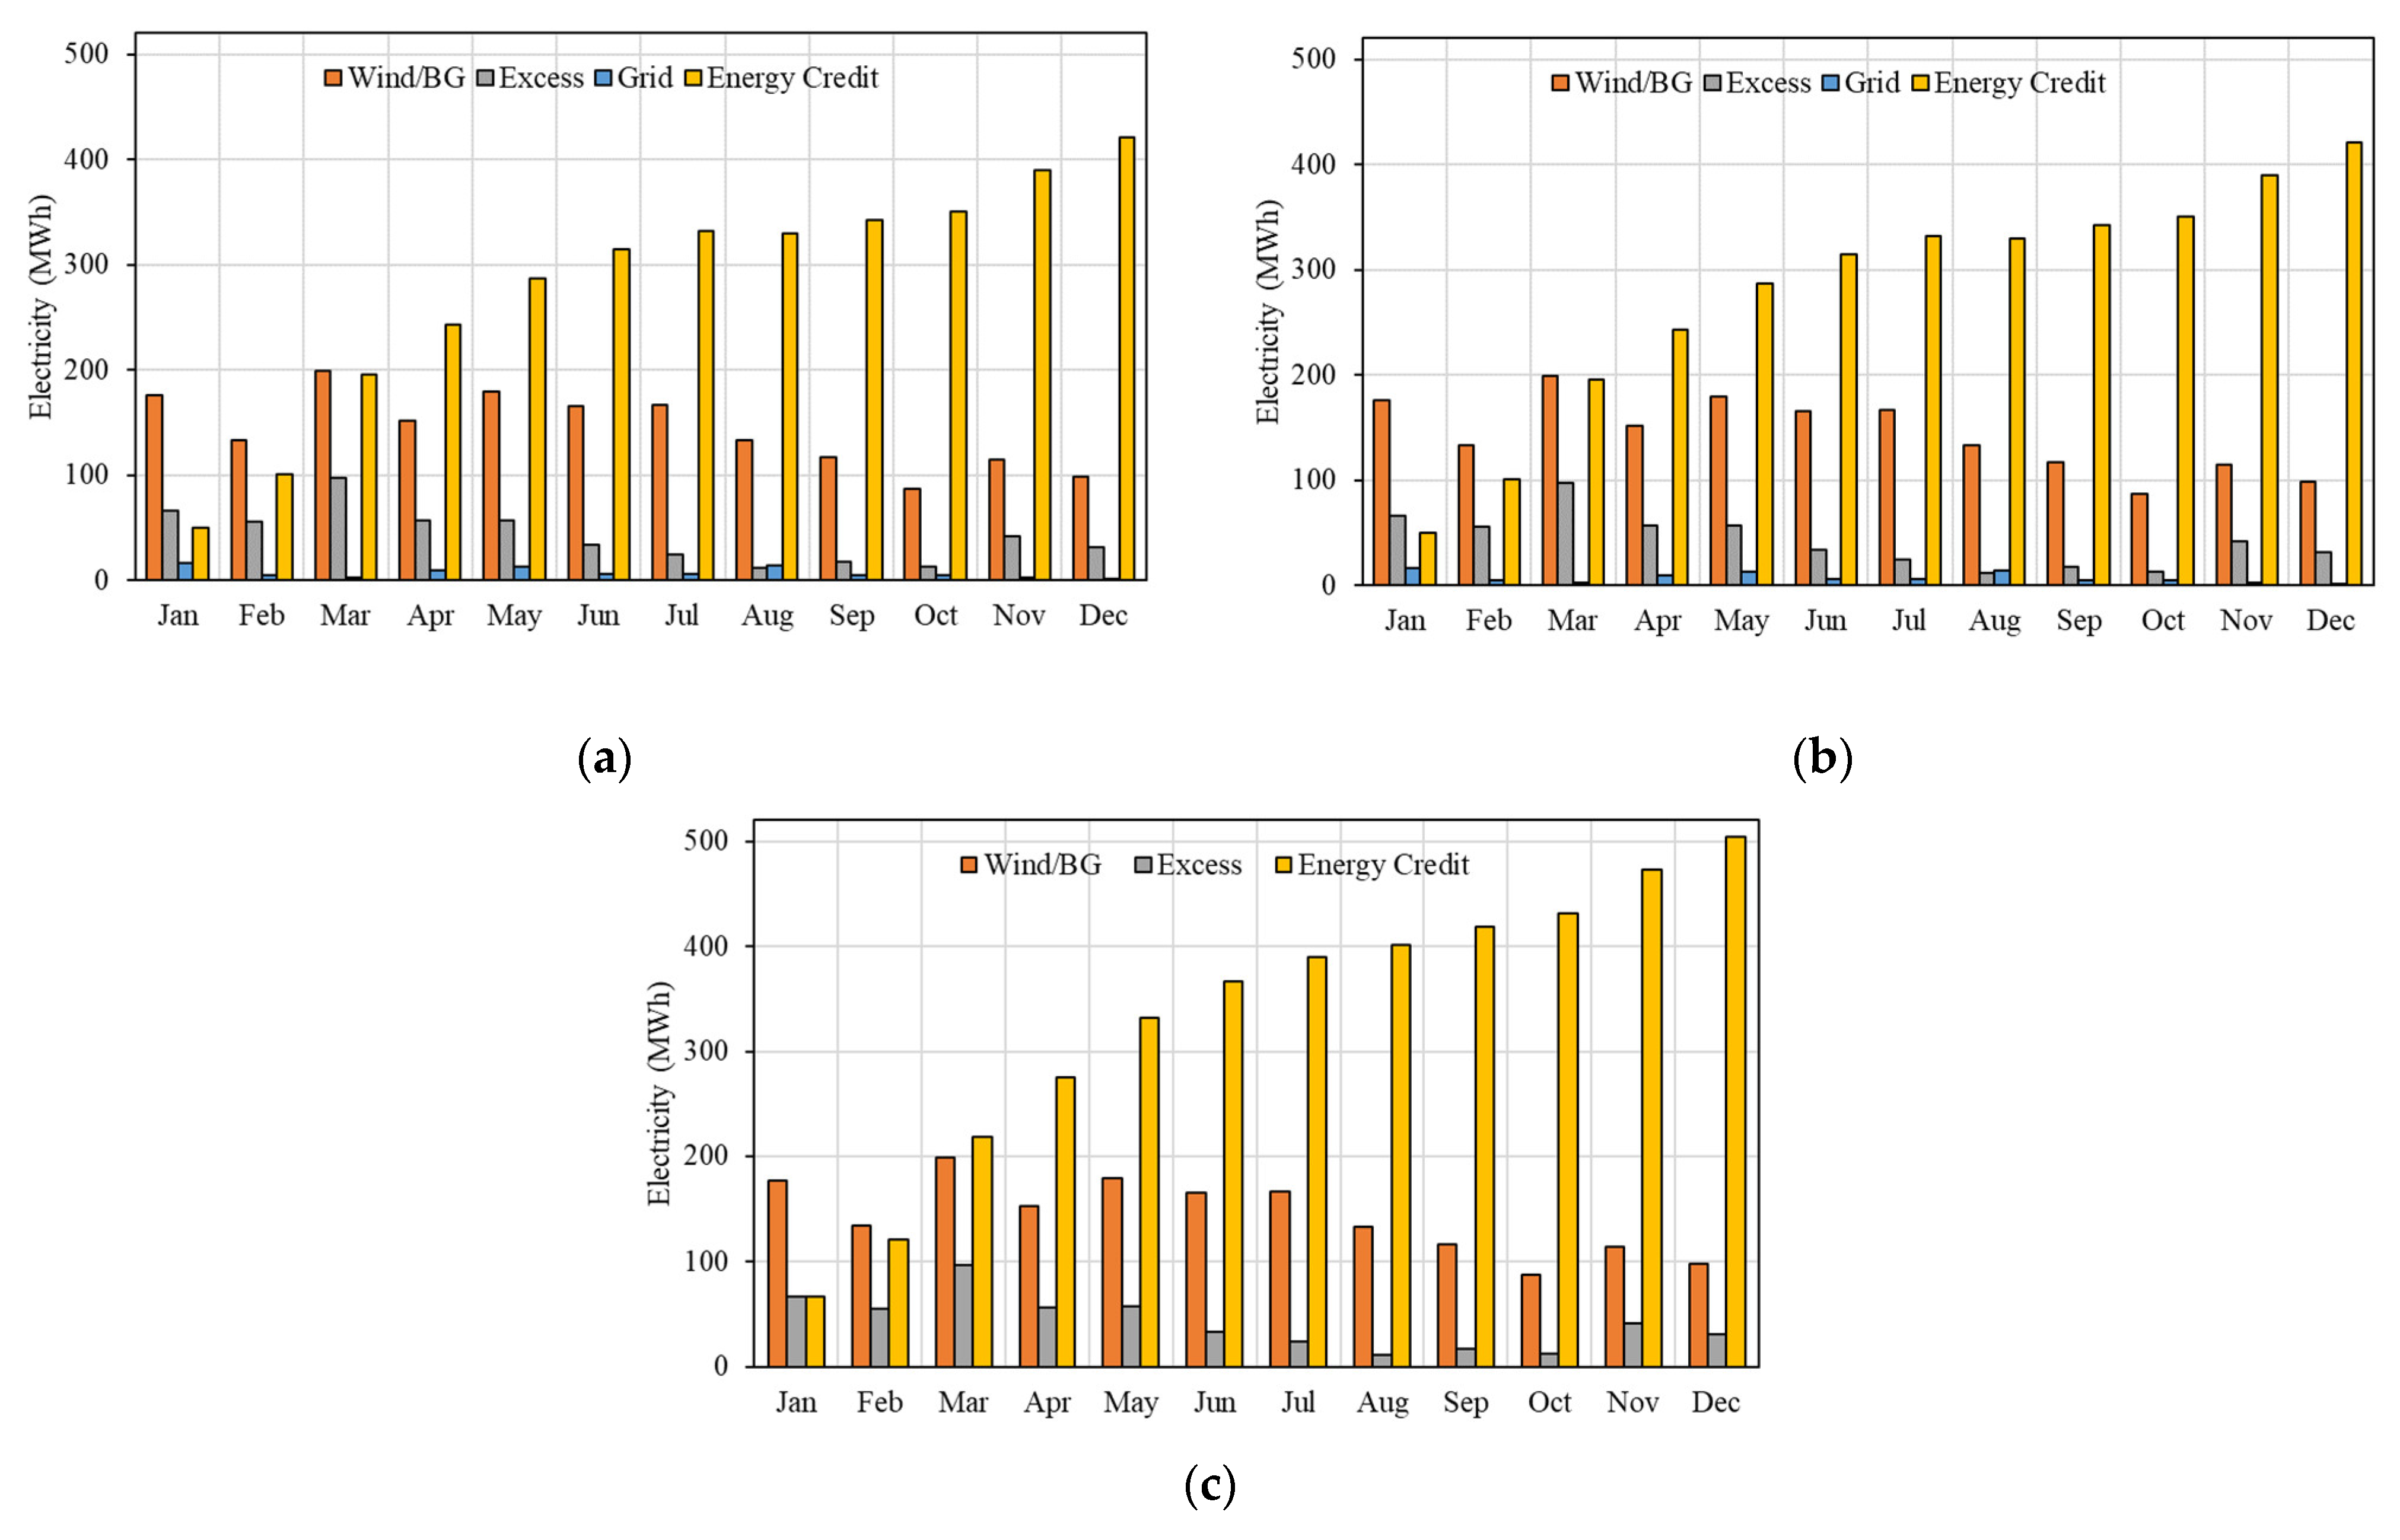
In SC#2, the DG covers approximately 23 % of the demand, with 5 % covered by the grid, where this dependency varies, as demonstrated in Figure 11c,d. Meanwhile, in SC#3, the DG covers 28 % of the demand, which also varies depending on the available wind resources, as depicted in Figure 11e,f. Notably, the system generates a substantial surplus of energy, primarily from the wind turbine, as indicated in Figure 12. This surplus arises from the mismatch between supply and demand, and is considered wasted energy within the current power grid regulations.
Presently, any surplus energy exported to the grid accumulates as a balance for the user, offsetting energy consumption from the grid throughout the year. However, Figure 12 underscores the significant surplus credit, which often exceeds grid energy consumption by a considerable margin. Consequently, this surplus is regarded as waste, as it is essentially given to the utility grid for free. Importantly, this excess energy is consistent across the three scenarios. However, since only 5 % of demand is covered by the grid in S C # 2 , and none in S C # 3 , these scenarios accumulate the largest energy credits, signifying the highest energy waste. This surplus energy credit offers potential for various utilization strategies. For instance, transitioning to an electrical heating system could enhance the techno-economic feasibility of the entire system.

3.2. Sensitivity Analysis

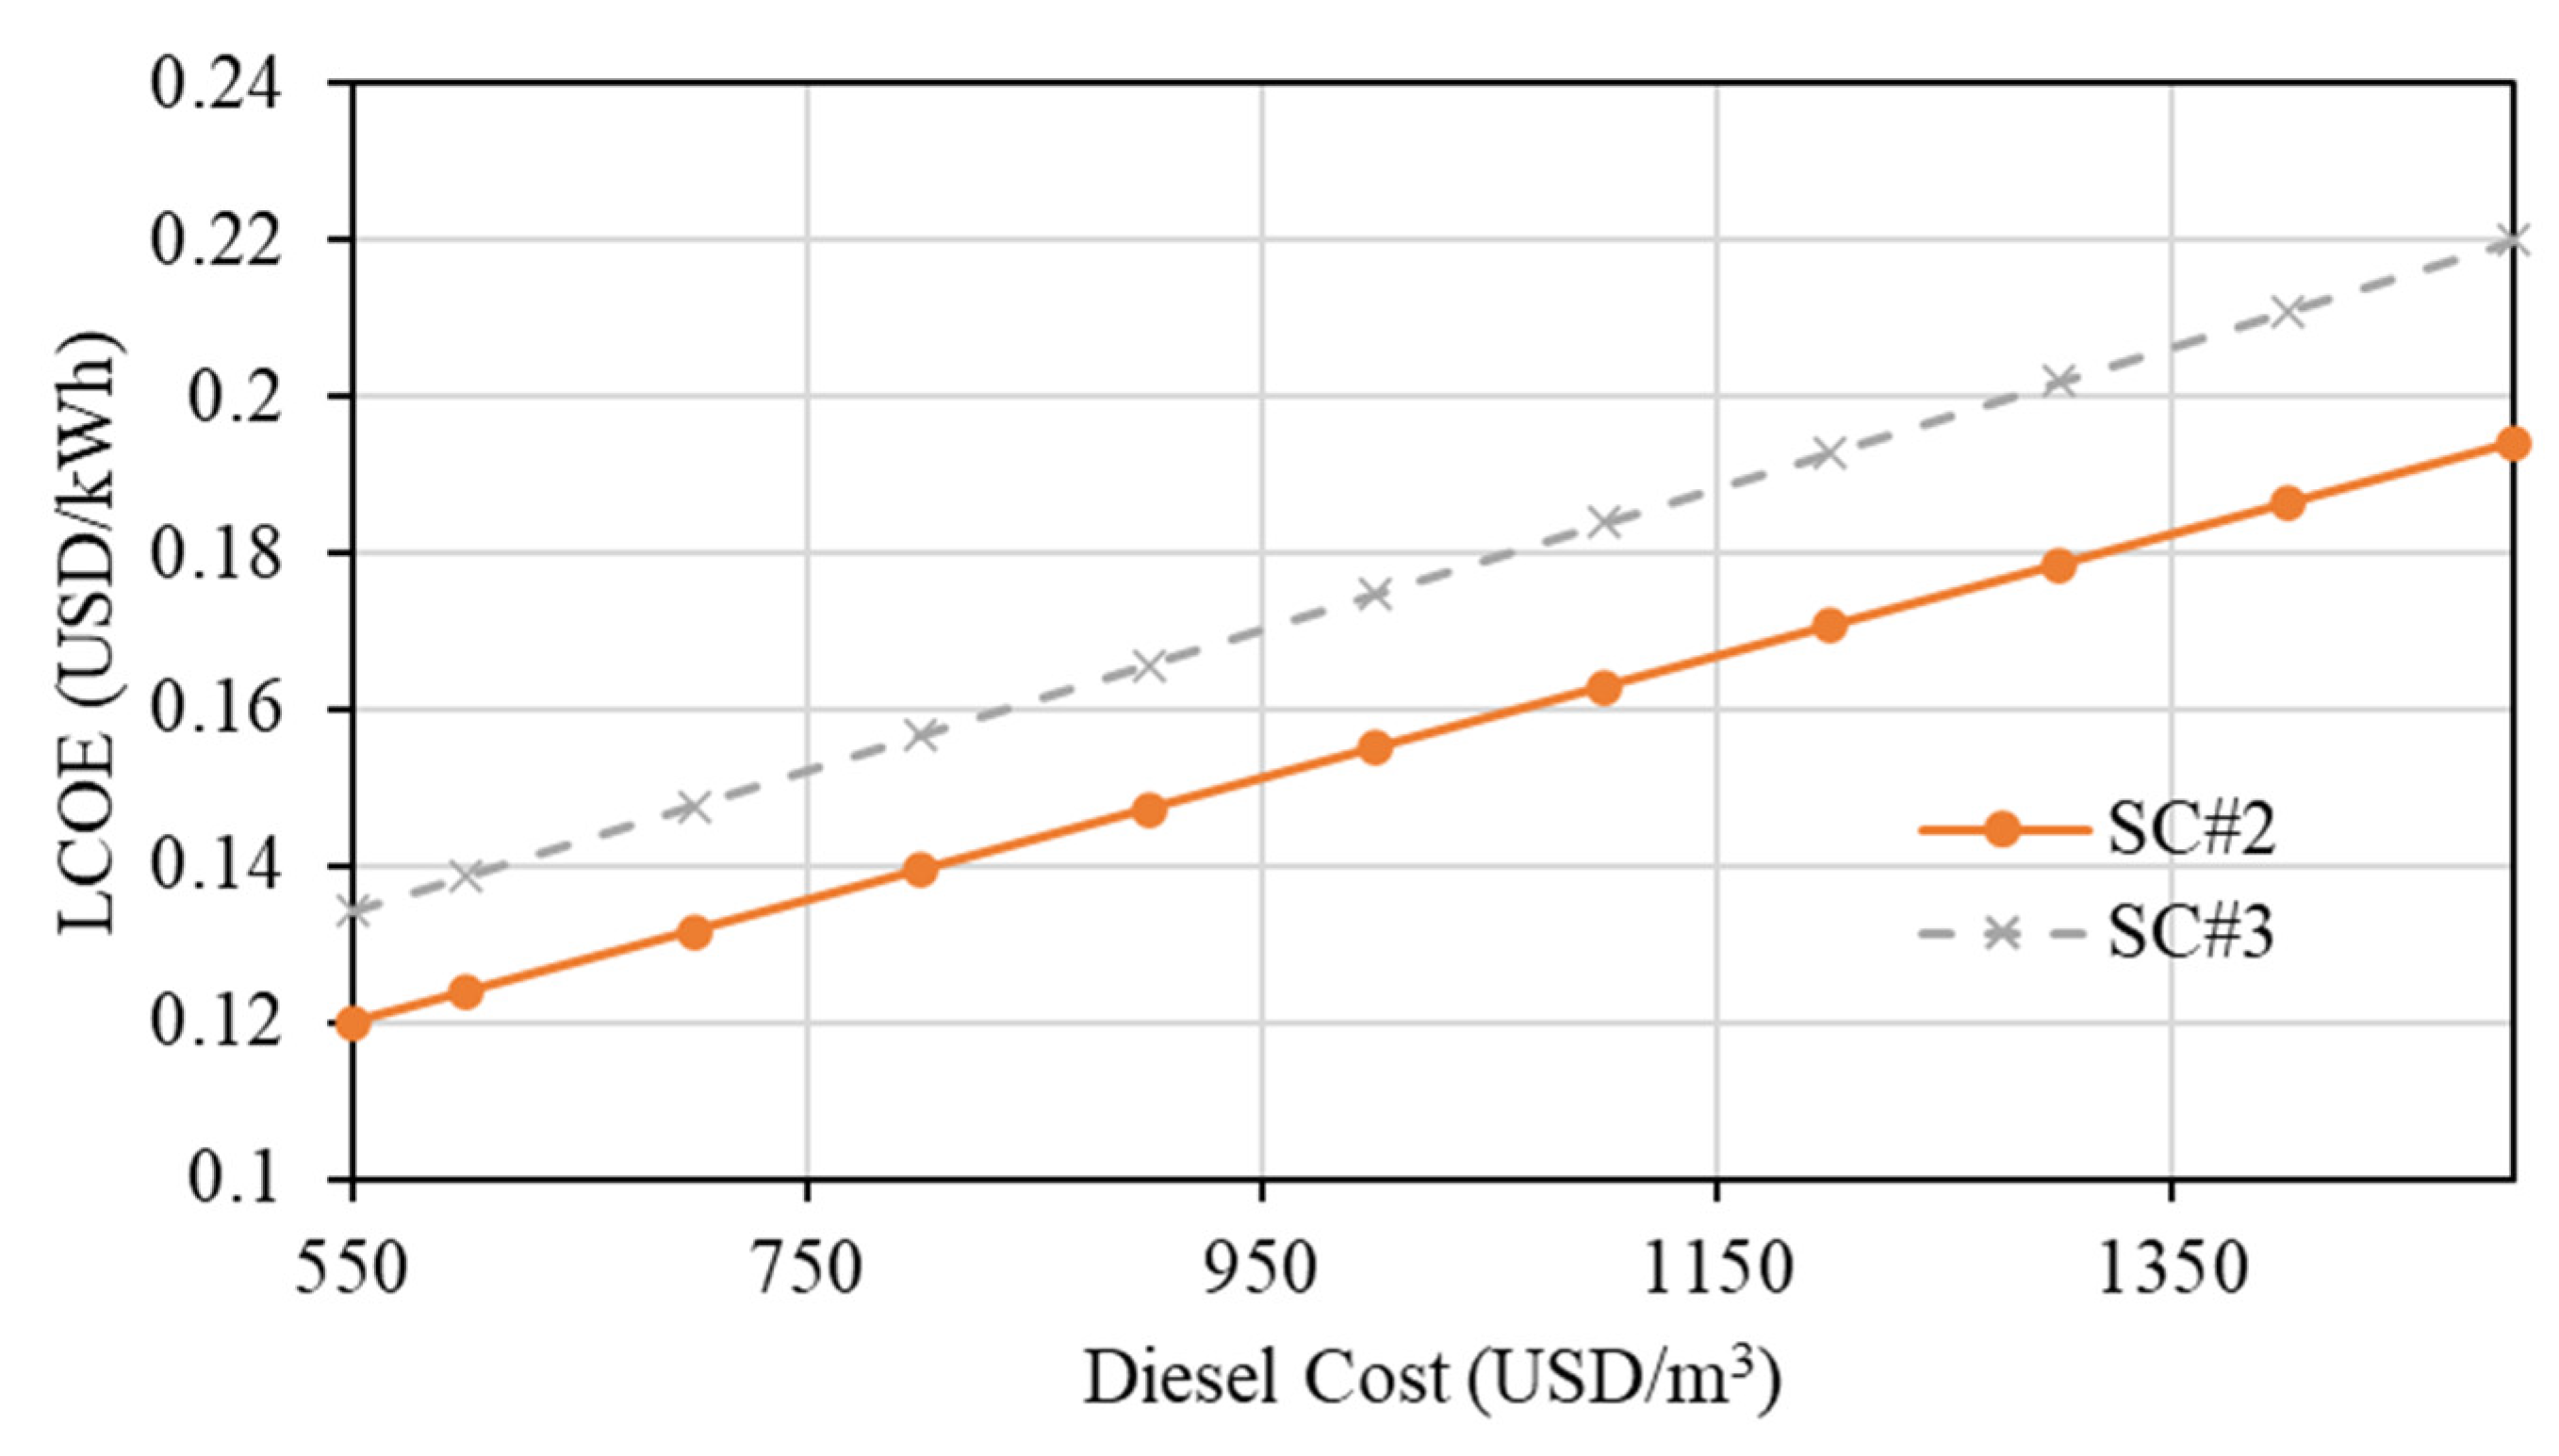
The continuous fluctuation in fossil fuel prices exerts a notable impact on the economic dynamics of the proposed system, particularly in cases where a diesel generator is employed as a backup. It is, therefore, essential to visualize the system’s sensitivity to variations in diesel costs, as depicted in Figure 13. Evidently, an escalation in diesel costs results in a corresponding increase in the LCOE. Notably, SC#2 exhibits a lower sensitivity due to its reduced dependency on the diesel generator in comparison to SC#3.
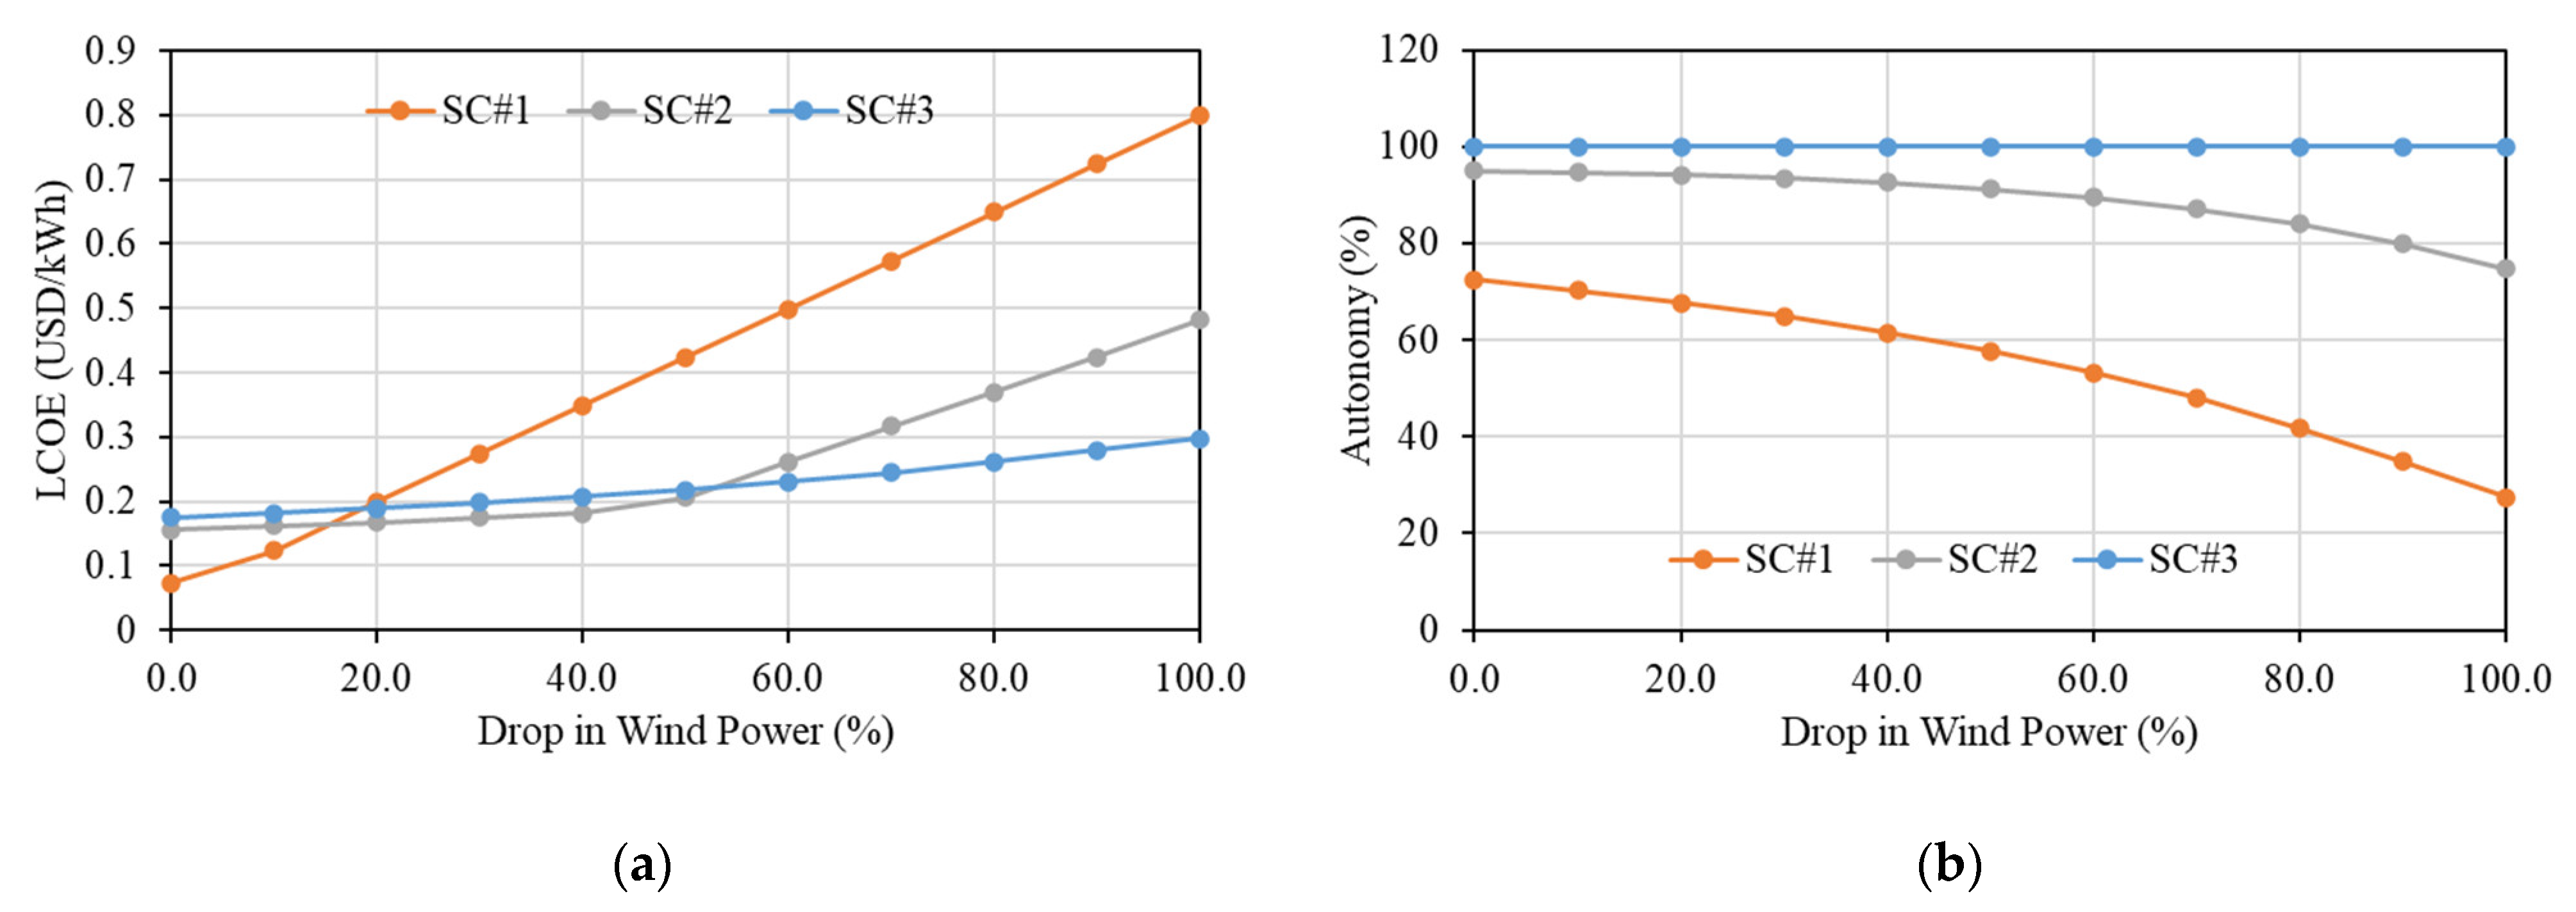
Furthermore, given the inherent unpredictability of wind energy, a thorough examination of the impact of wind power fluctuations on system autonomy and LCOE is imperative, as showcased in Figure 14. It is evident that SC#1 is the most sensitive to changes in wind energy, as it relies solely on wind power to meet demand and lacks a DG backup system. Consequently, any decline in wind energy availability results in a heightened reliance on grid energy and, consequently, increased electricity costs. This is further exacerbated by a reduction in energy credits, primarily driven by decreased wind energy generation. In contrast, SC#3 exhibits the lowest sensitivity, thanks to its backup DG system that can cater to peak demand without grid reliance. In this scenario, the LCOE experiences only a marginal increase, typically below a 60 % drop in wind energy, primarily due to heightened diesel expenses.
Lastly, we delve into the essential diesel generator capacity required to sustain 95 % autonomy (as per SC#2) under varying levels of wind energy production drops, as illustrated in Figure 15. The analysis reveals that, to accommodate a 40 % decline in wind energy production while upholding 95 % autonomy, the DG should be oversized by approximately 24 % . This oversizing results in a subsequent 28 % increase in the LCOE.
In a scenario where wind energy production experiences an 80 % reduction, the DG’s oversizing requirement escalates to approximately 68 % , leading to a corresponding 99 % rise in the LCOE. This underscores the delicate balance between DG capacity and maintaining autonomy levels, with higher oversizing demands significantly impacting the overall economic feasibility of the system.
To provide a better understanding of the reliability of the current system, a brief comparison between it and other systems of similar size is presented in Table 5. It is noticeable from the data that the current system exhibits a competitive LCOE value compared to other systems, particularly those in Turkey and Iran. The cost-effectiveness of biogas production in comparison to the relatively high price of diesel fuel accounts for this difference in LCOE. However, in Nigeria, for example, diesel prices are considered low, and, consequently, this results in a lower LCOE value.

3.3. Environmental Assessment

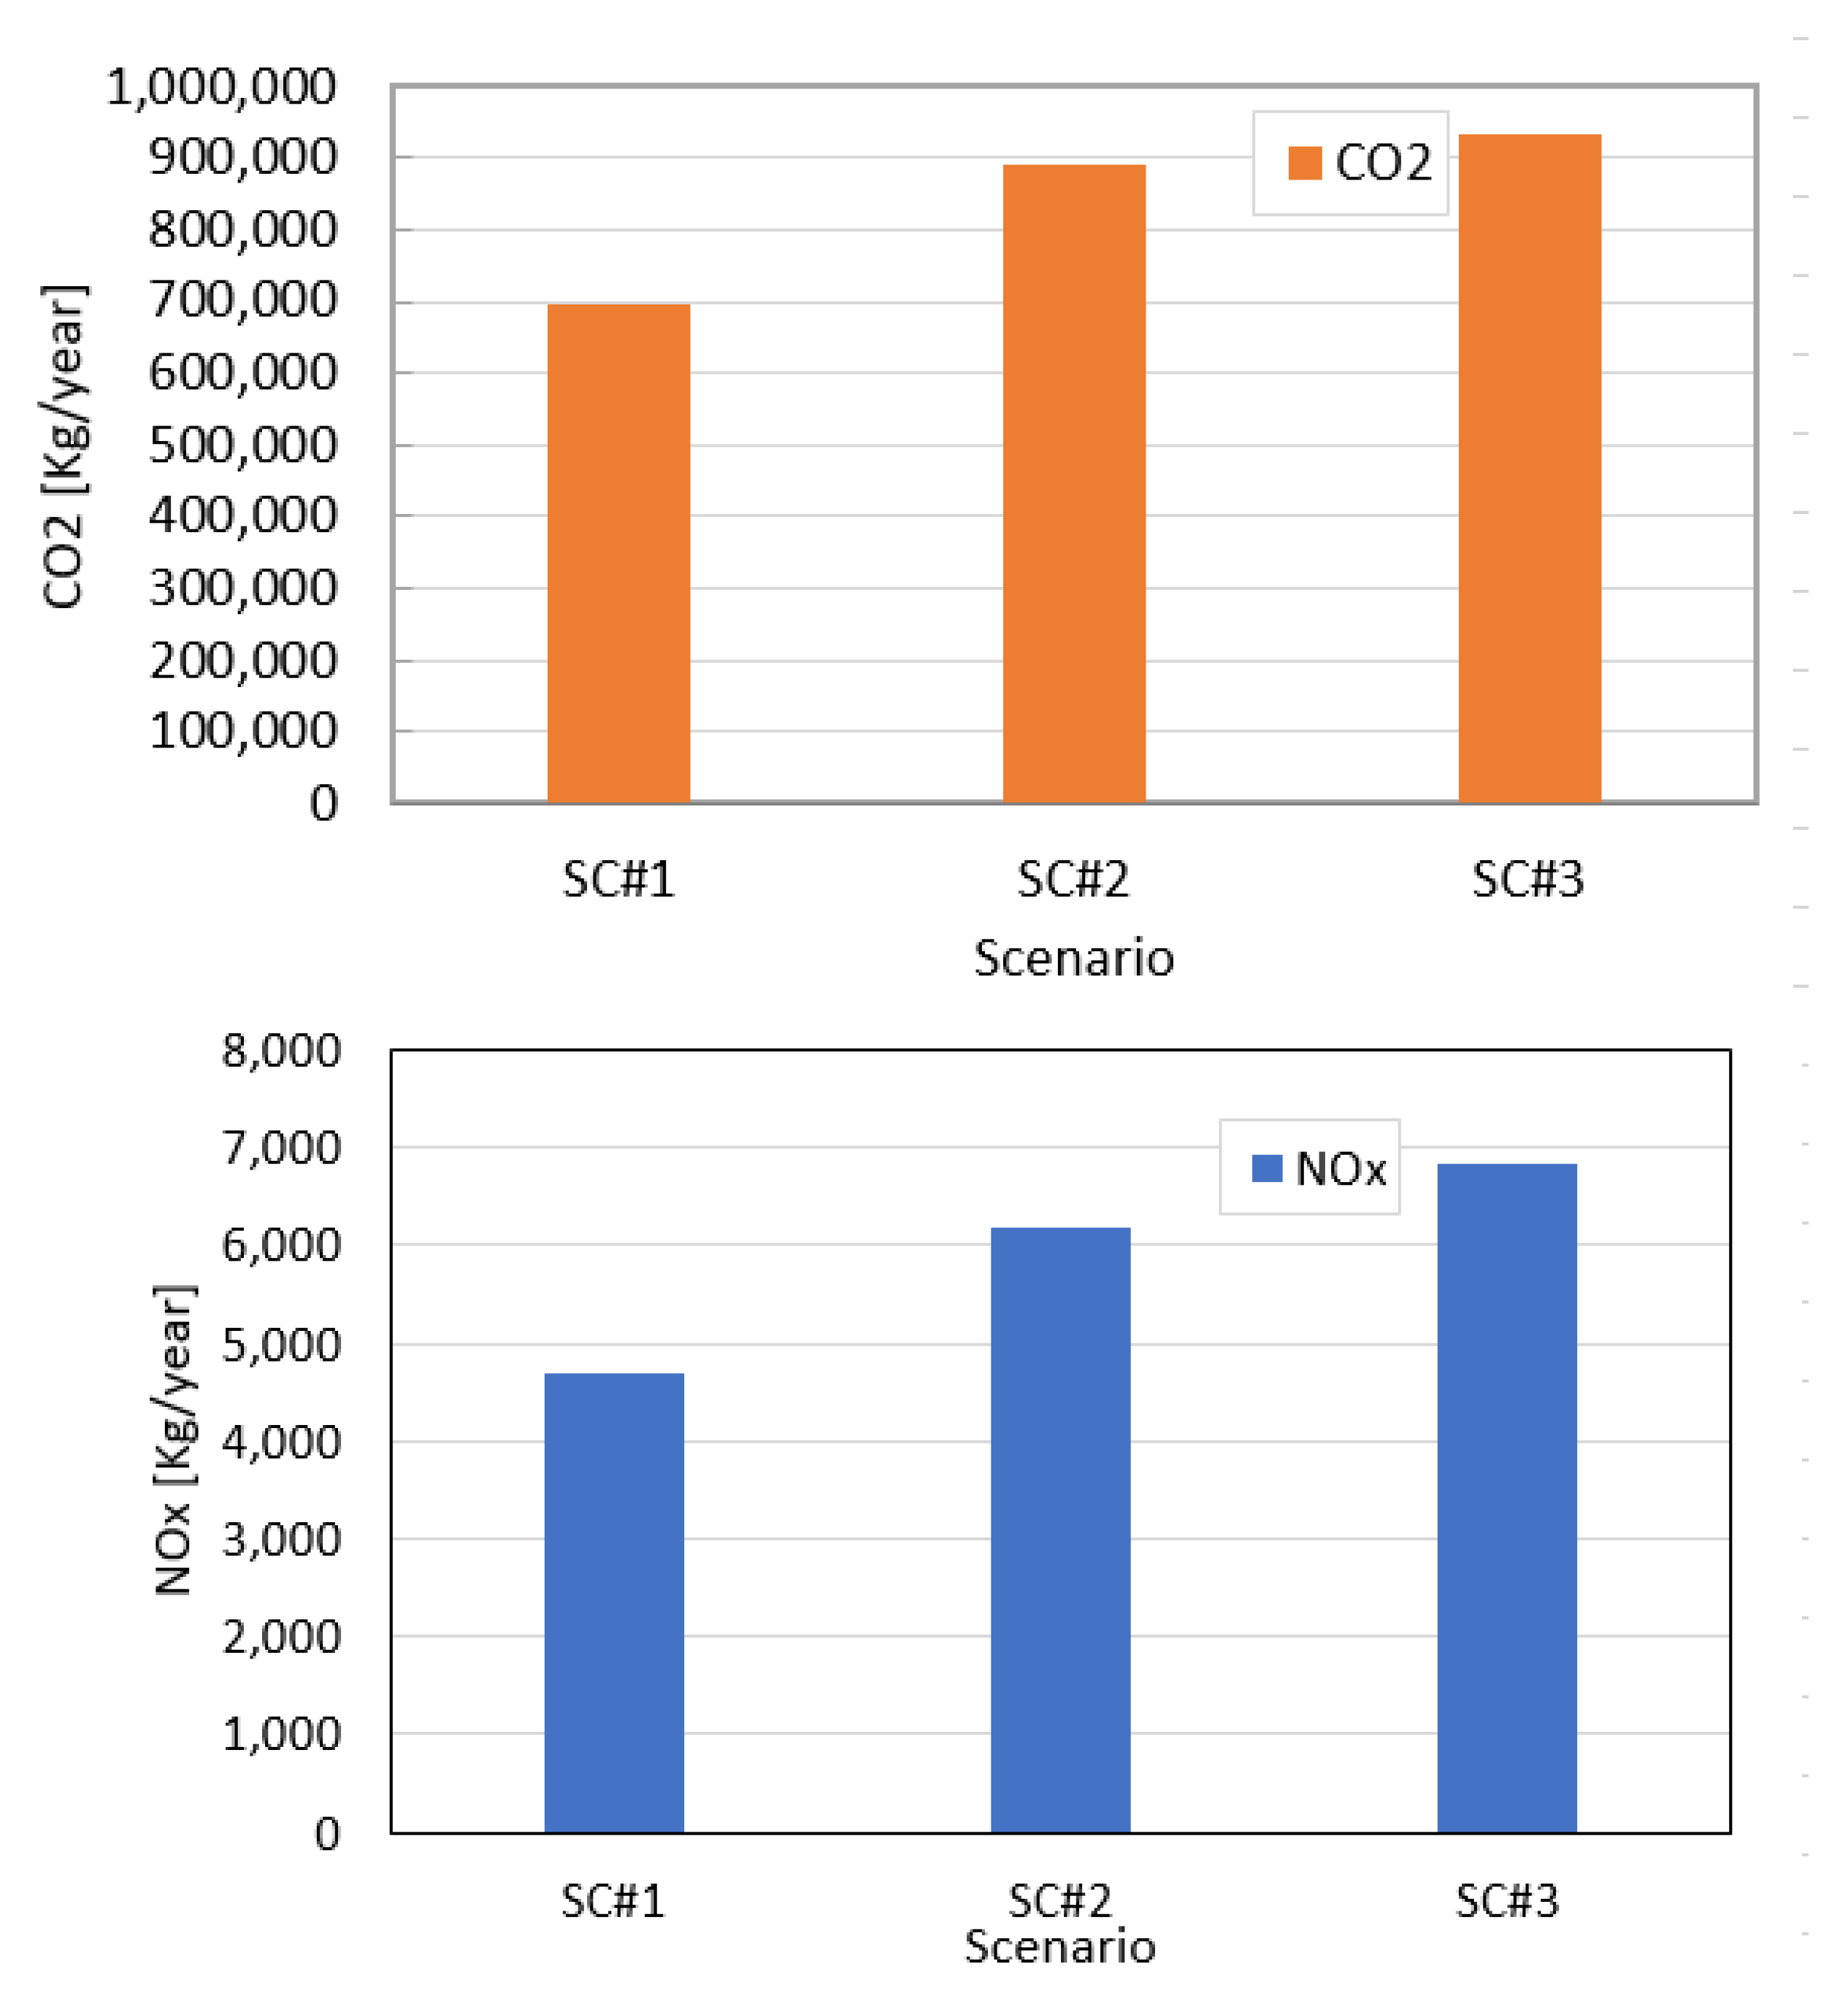
Growing concerns about global warming stemming from the emissions of greenhouse gases from fossil fuel-based energy sources have spurred significant research into cleaner and more sustainable energy alternatives, such as wind energy and biofuels, for various applications. The environmental advantages of incorporating hybrid renewable energy (RE) systems in poultry farming are particularly noteworthy with regard to greenhouse gas emissions. The quantity of pollutant emissions was computed in the current study for each scenario. The amounts of CO2 and NOx were considered, as these two emissions are among the most produced emissions in energy power plants [43]. Figure 16 provides an overview of the annual amount of NOx and CO2 emissions in each scenario. The amount of emissions was calculated based on the number of kilograms per each kWh of produced energy. As grid energy comes from natural gas power plants, the amount of CO2 and NOx emissions is 0.372 kg/kWh and 7.1 g/kWh, respectively [44]. For diesel electricity generation, the CO2 and NOx emissions are 14.4 g/kWh and 1.27 kg/kWh, respectively [45]. For biogas generators, the CO2 and NOx emissions are 6.2 g/kWh and 0.289 kg/kWh, respectively [46]. As depicted in Figure 16, SC#3 includes the highest amount of NOx and CO2 emissions, which, of course, refers to the high share of the diesel generators in the power production process. Diesel generators primarily rely on demand loads, resulting in a substantial fuel consumption and its associated adverse environmental impacts. However, SC#2 has fewer emissions than SC#3 due to the contribution of the grid power. Replacing the diesel-only system with a grid-connected system (SC#1) reduces greenhouse gas emissions by 20% compared to SC#3, but simultaneously creates a low autonomy issue, as discussed earlier. Overall, having wind energy in all scenarios will contribute to a reduction in emissions by an average value of 30–40%. This reduction in emissions, when it is compared to some other systems in [12,15,47], was found to be acceptable, especially for SC#3 which relies on biogas and diesel fuels.

3.4. Future Work and Recommendations

Future work will focus on wind–biogas hybrid power plants in remote areas, addressing critical aspects such as the integration of reliable energy storage systems and enhancing their efficiency and reliability. This is essential to overcome the intermittent nature of wind and biogas energy sources, thereby ensuring a consistent power supply to remote communities, even in the absence of primary sources. Additionally, research and development endeavors should be targeted at reducing the initial installation costs of these hybrid systems, thereby increasing accessibility, particularly in economically disadvantaged regions. The challenge of localized biogas production in remote areas, arising from limited organic waste availability, underscores the need to develop innovative approaches for biogas feedstock generation and transport. Furthermore, comprehensive community engagement and educational programs are necessary to ensure that the local population comprehends the benefits of such systems and actively participates in promoting sustainability. Ultimately, while wind–biogas hybrid power plants offer immense potential for remote areas, it is important to recognize that their success hinges on technological advancements, cost reduction strategies, and robust community involvement, all of which are among the limitations inherent to these systems.

4. Conclusions

This study offers a holistic assessment of fully off-grid wind–biogas hybrid power systems, with a specific focus on their application in remote healthcare facilities. The key findings emphasize the system’s efficacy in meeting the critical energy demands of mobile hospitals, ensuring uninterrupted healthcare services. The integration of wind turbines, biogas generators, and, where needed, diesel generators showcases high efficiency and sustainability, making these systems a robust solution for remote energy challenges. The techno-economic analysis reveals their cost-effectiveness, particularly when considering grid availability and autonomy levels. The sensitivity analyses underscore the significance of diesel costs and wind power variability, highlighting the importance of strategic planning and real-time monitoring.
Three distinct primary scenarios have undergone examination regarding the levelized cost of energy (LCOE) value. In Scenario 1 (SC#1), which is regarded as the most cost-effective option, sole reliance on grid power is assumed. In Scenario 2 (SC#2), the grid’s contribution is reduced to just 5%, with the remaining power requirements being met by the hybrid system. In Scenario 3 (SC#3), the entire load is met by the hybrid power system. Considering the specific context of this case study, which pertains to a mobile hospital, it was determined that SC#3 represents the most sustainable scenario. This is because it ensures a continuous power supply without the risk of disconnection from the grid. In contrast, SC#2 and SC#1 exhibit varying degrees of risk when it comes to potential grid disconnection, with SC#1 having the highest risk and SC#2 having a lower risk.
Environmental analyses have been carried out to assess the hybrid system’s environmental impact, particularly in the reduction of greenhouse gas emissions. By studying the emission outcomes for the three applied scenarios. It was found that SC#2 and SC#3 have the highest NOx and CO2 emission levels, where the diesel generators share is the highest. However, SC#1 has fewer emissions due to the absence of the diesel generators.
Future research in this domain should prioritize the collection of real-time operational data from deployed wind–biogas hybrid systems to validate their performance. Exploring advanced energy storage solutions and smart grid integration can further enhance system resilience and optimize energy distribution. Additionally, assessing the environmental impact, engaging local communities, and shaping supportive policy frameworks are essential steps toward realizing the potential of these systems in improving healthcare services, sustainability, and well-being in remote areas.

Author Contributions

Conceptualization, M.A., S.A.-D., and L.A.-G.; methodology, M.A., S.A.-D., and L.A.-G.; software, M.A., S.A.-D., and L.A.-G.; validation, M.A., S.A.-D., and L.A.-G.; formal analysis, M.A., S.A.-D., and L.A.-G.; investigation, M.A., S.A.-D., and L.A.-G.; resources, M.A., S.A.-D., L.A.-G., H.H., and A.A.; data curation, M.A., S.A.-D., and L.A.-G.; writing—original draft preparation, M.A., S.A.-D., L.A.-G., H.H., and A.A.; writing—review and editing, M.A., S.A.-D., L.A.-G., H.H., and A.A.; visualization, M.A., S.A.-D., L.A.-G., and H.H.; supervision, M.A., S.A.-D., and L.A.-G.; project administration, M.A. and S.A.-D. All authors have read and agreed to the published version of the manuscript.

Funding

This research received no external funding.

Institutional Review Board Statement

Not applicable.

Informed Consent Statement

Not applicable.

Data Availability Statement

The data presented in this study are available on request from the corresponding author.

Conflicts of Interest

The authors declare no conflict of interest.

References

  1. Akella, A.; Sharma, M.; Saini, R. Optimum utilization of renewable energy sources in a remote area. Renew. Sustain. Energy Rev. 2007, 11, 894–908. [Google Scholar] [CrossRef]
  2. Kanase-Patil, A.; Saini, R.; Sharma, M. Integrated renewable energy systems for off grid rural electrification of remote area. Renew. Energy 2010, 35, 1342–1349. [Google Scholar] [CrossRef]
  3. Jiang, J.; Zhang, L.; Wen, X.; Valipour, E.; Nojavan, S. Risk-based performance of power-to-gas storage technology integrated with energy hub system regarding downside risk constrained approach. Int. J. Hydrogen Energy 2022, 47, 39429–39442. [Google Scholar] [CrossRef]
  4. Hemeida, A.; El-Ahmar, M.; El-Sayed, A.; Hasanien, H.M.; Alkhalaf, S.; Esmail, M.; Senjyu, T. Optimum design of hybrid wind/PV energy system for remote area. Ain Shams Eng. J. 2020, 11, 11–23. [Google Scholar] [CrossRef]
  5. Liu, Z.; Li, H.; Hou, K.; Xu, X.; Jia, H.; Zhu, L.; Mu, Y. Risk assessment and alleviation of regional integrated energy system considering cross-system failures. Appl. Energy 2023, 350, 121714. [Google Scholar] [CrossRef]
  6. Cai, T.; Dong, M.; Chen, K.; Gong, T. Methods of participating power spot market bidding and settlement for renewable energy systems. Energy Rep. 2022, 8, 7764–7772. [Google Scholar] [CrossRef]
  7. Chen, H.; Wu, H.; Kan, T.; Zhang, J.; Li, H. Low-carbon economic dispatch of integrated energy system containing electric hydrogen production based on VMD-GRU short-term wind power prediction. Int. J. Electr. Power Energy Syst. 2023, 154, 109420. [Google Scholar] [CrossRef]
  8. Suresh, V.; Muralidhar, M.; Kiranmayi, R. Modelling and optimization of an off-grid hybrid renewable energy system for electrification in a rural areas. Energy Rep. 2020, 6, 594–604. [Google Scholar] [CrossRef]
  9. Tian, H.; Li, R.; Salah, B.; Thinh, P.-H. Bi-objective optimization and environmental assessment of SOFC-based cogeneration system: Performance evaluation with various organic fluids. Process Saf. Environ. Prot. 2023, 178, 311–330. [Google Scholar] [CrossRef]
  10. Li, X.; Wang, F.; Al-Razgan, M.; Awwad, E.M.; Abduvaxitovna, S.Z.; Li, Z.; Li, J. Race to environmental sustainability: Can structural change, economic expansion and natural resource consumption effect environmental sustainability? A novel dynamic ARDL simulations approach. Resour. Policy 2023, 86, 104044. [Google Scholar] [CrossRef]
  11. Min, C.; Pan, Y.; Dai, W.; Kawsar, I.; Li, Z.; Wang, G. Trajectory optimization of an electric vehicle with minimum energy consumption using inverse dynamics model and servo constraints. Mech. Mach. Theory 2023, 181, 105185. [Google Scholar] [CrossRef]
  12. Vendoti, S.; Muralidhar, M.; Kiranmayi, R. Techno-economic analysis of off-grid solar/wind/biogas/biomass/fuel cell/battery system for electrification in a cluster of villages by HOMER software. Environ. Dev. Sustain. 2021, 23, 351–372. [Google Scholar] [CrossRef]
  13. Weimer, M.A.; Paing, T.S.; Zane, R.A. Remote area wind energy harvesting for low-power autonomous sensors. In Proceedings of the 2006 37th IEEE Power Electronics Specialists Conference, Jeju, Republic of Korea, 18–22 June 2006; pp. 1–5. [Google Scholar]
  14. Salisu, S.; Mustafa, M.W.; Olatomiwa, L.; Mohammed, O.O. Assessment of technical and economic feasibility for a hybrid PV-wind-diesel-battery energy system in a remote community of north central Nigeria. Alex. Eng. J. 2019, 58, 1103–1118. [Google Scholar] [CrossRef]
  15. Altun, A.F.; Kilic, M. Design and performance evaluation based on economics and environmental impact of a PV-wind-diesel and battery standalone power system for various climates in Turkey. Renew. Energy 2020, 157, 424–443. [Google Scholar] [CrossRef]
  16. Li, M.; Yang, M.; Yu, Y.; Lee, W.-J. A wind speed correction method based on modified hidden Markov model for enhancing wind power forecast. IEEE Trans. Ind. Appl. 2021, 58, 656–666. [Google Scholar] [CrossRef]
  17. Yimen, N.; Hamandjoda, O.; Meva’a, L.; Ndzana, B.; Nganhou, J. Analyzing of a photovoltaic/wind/biogas/pumped-hydro off-grid hybrid system for rural electrification in Sub-Saharan Africa—Case study of Djoundé in Northern Cameroon. Energies 2018, 11, 2644. [Google Scholar] [CrossRef]
  18. Sarkar, T.; Bhattacharjee, A.; Samanta, H.; Bhattacharya, K.; Saha, H. Optimal design and implementation of solar PV-wind-biogas-VRFB storage integrated smart hybrid microgrid for ensuring zero loss of power supply probability. Energy Convers. Manag. 2019, 191, 102–118. [Google Scholar] [CrossRef]
  19. Anwar, K.; Deshmukh, S.; Mustafa Rizvi, S. Feasibility and sensitivity analysis of a hybrid photovoltaic/wind/biogas/fuel-cell/diesel/battery system for off-grid rural electrification using homer. J. Energy Resour. Technol. 2020, 142, 061307. [Google Scholar] [CrossRef]
  20. Li, J.; Liu, P.; Li, Z. Optimal design and techno-economic analysis of a solar-wind-biomass off-grid hybrid power system for remote rural electrification: A case study of west China. Energy 2020, 208, 118387. [Google Scholar] [CrossRef]
  21. Das, B.K.; Hoque, N.; Mandal, S.; Pal, T.K.; Raihan, M.A. A techno-economic feasibility of a stand-alone hybrid power generation for remote area application in Bangladesh. Energy 2017, 134, 775–788. [Google Scholar] [CrossRef]
  22. Jabbar, S.A.; Zaza, H.I. Impact of conflict in Syria on Syrian children at the Zaatari refugee camp in Jordan. In Abuse and Violence Towards Young Children; Routledge: London, UK, 2017; pp. 225–248. [Google Scholar]
  23. Hammad, A.M.; Al-Qerem, W.; Alasmari, F.; Ling, J.; Qarqaz, R.; Alaqabani, H. Identifying Drug-Therapy Problems among Syrian Refugees in Zaatari Refugee Camp. Int. J. Environ. Res. Public Health 2022, 19, 7199. [Google Scholar] [CrossRef] [PubMed]
  24. Agency, T.U.R. UNHCR Jordan Monthly Update. Available online: https://www.unhcr.org/jo/14835-unhcr-jordan-monthly-update-may-2021.html (accessed on 14 July 2023).
  25. Sukhon, A.; Khmash, M.A. Syrian Refugees Evaluation for the Services Provided By High Commissioner for Refugees (UNHCR) In Zaatari Refugee Camp (A Field Study). Dirasat Hum. Soc. Sci. 2023, 50, 415–438. [Google Scholar] [CrossRef]
  26. UNHCR. Available online: https://www.unhcr.org/news/stories/jordans-zaatari-camp-goes-green-new-solar-plant (accessed on 14 July 2023).
  27. Kaddour, I.Z.; Khattab, R.; Yaghi, A.; Alawneh, L. Instant Cities and Their Impact on the Environment: Al Zaatari Case Study. In Climate Change and Environmental Sustainability; Springer: Berlin/Heidelberg, Germany, 2022; pp. 241–250. [Google Scholar]
  28. Karl, A.A.; Scholz Karl, J. Human rights for refugees: Enhancing sustainable humanitarian supply chain to guarantee a health environment in refugee settlements. J. Humanit. Logist. Supply Chain Manag. 2022, 12, 382–403. [Google Scholar] [CrossRef]
  29. Gbadamosi, S.L.; Nwulu, N.I. Optimal configuration of hybrid energy system for rural electrification of community healthcare facilities. Appl. Sci. 2022, 12, 4262. [Google Scholar] [CrossRef]
  30. Ohl, C.A.; Dodds Ashley, E.S. Antimicrobial stewardship programs in community hospitals: The evidence base and case studies. Clin. Infect. Dis. 2011, 53 (Suppl. S1), S23–S28. [Google Scholar] [CrossRef]
  31. University of Wisconsin—Madison. Solar Energy, L. TRNSYS, a Transient Simulation Program; The Laboratory: Madison, WI, USA, 1975. [Google Scholar]
  32. Wind-Turbine-Models.com. Wind Turbines Manufacturers. Available online: https://en.wind-turbine-models.com/manufacturers (accessed on 14 July 2023).
  33. Jordan Meteorological Department. Wind Speed Data. Available online: http://jmd.gov.jo/en/Climate1 (accessed on 14 July 2023).
  34. Kabeyi, M.J.B.; Olanrewaju, O.A. Technologies for biogas to electricity conversion. Energy Rep. 2022, 8, 774–786. [Google Scholar] [CrossRef]
  35. Li, C.; Zhang, L.; Qiu, F.; Fu, R. Optimization and enviro-economic assessment of hybrid sustainable energy systems: The case study of a photovoltaic/biogas/diesel/battery system in Xuzhou, China. Energy Strategy Rev. 2022, 41, 100852. [Google Scholar] [CrossRef]
  36. Al-Ghussain, L.; Taylan, O.; Fahrioglu, M. Sizing of a photovoltaic-wind-oil shale hybrid system: Case analysis in Jordan. J. Sol. Energy Eng. 2018, 140, 011002. [Google Scholar] [CrossRef]
  37. Abushaikha, I.; Wu, Z.; Khoury, T.A. Towards a theory of informal supply networks: An exploratory case study of the Za’atari refugee camp. J. Oper. Manag. 2021, 67, 853–881. [Google Scholar] [CrossRef]
  38. Ghorbani, N.; Kasaeian, A.; Toopshekan, A.; Bahrami, L.; Maghami, A. Optimizing a hybrid wind-PV-battery system using GA-PSO and MOPSO for reducing cost and increasing reliability. Energy 2018, 154, 581–591. [Google Scholar] [CrossRef]
  39. IRENA. Renewable Power Generation Costs in 2020; IRENA: Abu Dhabi, United Arab Emirates, 2022. [Google Scholar]
  40. Available online: https://www.cbj.gov.jo/Pages/viewpage.aspx?pageID=259 (accessed on 14 July 2023).
  41. Fuel Prices in Jordan. Available online: https://www.thefuelprice.com/Fjo/en/04-01-2022 (accessed on 14 July 2023).
  42. Maia, A.; Ferreira, E.; Oliveira, M.; Menezes, L.; Andrade-Campos, A. Numerical optimization strategies for springback compensation in sheet metal forming. In Computational Methods and Production Engineering; Elsevier: Amsterdam, The Netherlands, 2017; pp. 51–82. [Google Scholar]
  43. Nazari, S.; Shahhoseini, O.; Sohrabi-Kashani, A.; Davari, S.; Paydar, R.; Delavar-Moghadam, Z. Experimental determination and analysis of CO2, SO2 and NOx emission factors in Iran’s thermal power plants. Energy 2010, 35, 2992–2998. [Google Scholar] [CrossRef]
  44. De Gouw, J.A.; Parrish, D.D.; Frost, G.J.; Trainer, M. Reduced emissions of CO2, NOx, and SO2 from US power plants owing to switch from coal to natural gas with combined cycle technology. Earth’s Future 2014, 2, 75–82. [Google Scholar] [CrossRef]
  45. Silveira, J.L.; de Carvalho, J.A., Jr.; de Castro Villela, I.A. Combined cycle versus one thousand diesel power plants: Pollutant emissions, ecological efficiency and economic analysis. Renew. Sustain. Energy Rev. 2007, 11, 524–535. [Google Scholar] [CrossRef]
  46. Huang, J.; Crookes, R. Assessment of simulated biogas as a fuel for the spark ignition engine. Fuel 1998, 77, 1793–1801. [Google Scholar] [CrossRef]
  47. Khan, M.J.; Yadav, A.K.; Mathew, L. Techno economic feasibility analysis of different combinations of PV-Wind-Diesel-Battery hybrid system for telecommunication applications in different cities of Punjab, India. Renew. Sustain. Energy Rev. 2017, 76, 577–607. [Google Scholar] [CrossRef]
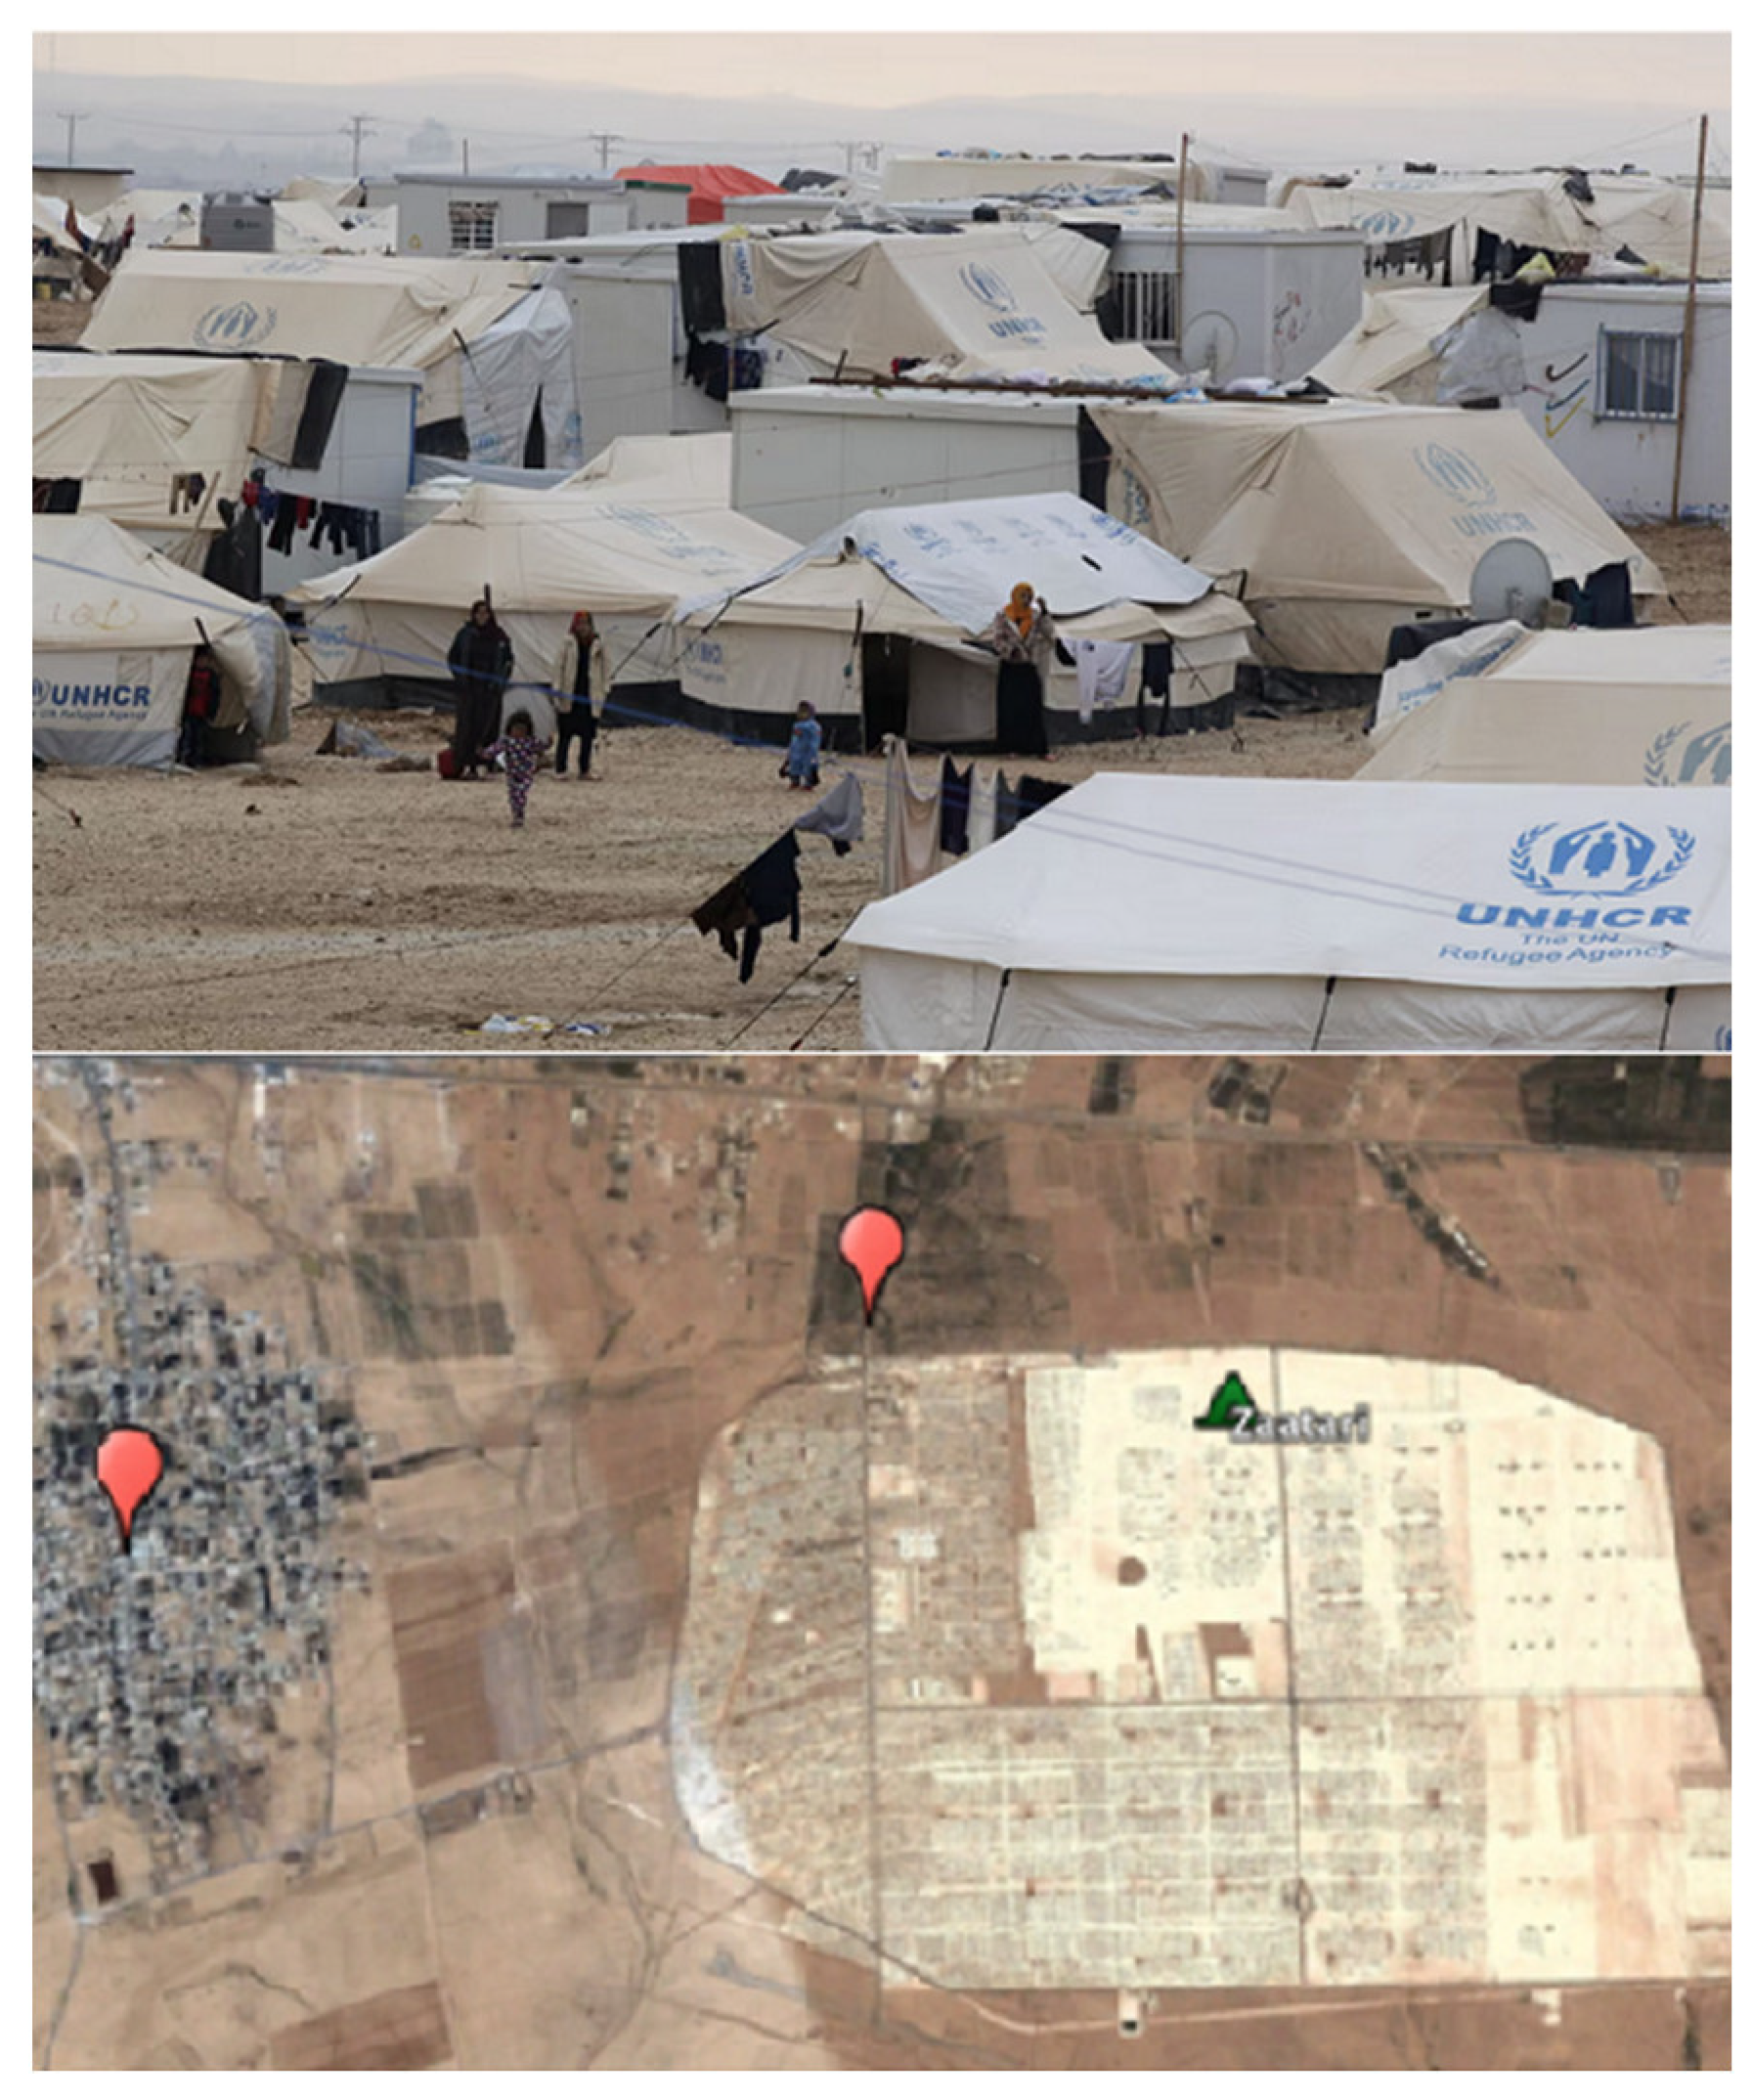
Figure 1. Zaatari Syrian Refugee Camp [24].
Sustainability 15 14935 g001
Figure 2. Seasonal variations in wastewater volume and anticipated biogas generation for the year 2022, Zaatari, Mafraq.
Sustainability 15 14935 g002
Figure 3. Daily electricity load profile for a typical mobile hospital [29].
Sustainability 15 14935 g003
Figure 4. Flow chart of the introduced wind–biogas–diesel power plant.
Sustainability 15 14935 g004
Figure 5. TRNSYS® software V.15 environment.
Sustainability 15 14935 g005
Figure 6. Power curve for different commercial wind turbines [32].
Sustainability 15 14935 g006
Figure 7. Hourly wind speed data for three Jordanian cities throughout the year [33].
Sustainability 15 14935 g007
Figure 9. Impact of DG and wind turbine system capacities on (a) the system autonomy and (b) the LCOE.
Sustainability 15 14935 g009
Figure 10. Influence of wind turbine model on the LCOE for optimal system configurations in each scenario.
Sustainability 15 14935 g010
Figure 11. Average hourly electrical energy profile of the optimal wind/biogas/diesel generator system and electrical demand in SC#1 on (a) 1 June and (b) 1 December; SC#2 on (c) 1 June and (d) 1 December; and SC#3 on (e) 1 June and (f) 1 December.
Sustainability 15 14935 g011aSustainability 15 14935 g011b
Figure 12. Monthly wind/biogas electricity generation, surplus energy, grid-supplied energy, and accumulated surplus energy balance in (a) SC#1, (b) SC#2, and (c) SC#3.
Sustainability 15 14935 g012
Figure 13. Sensitivity analysis of LCOE in response to diesel cost variations for optimal system configurations.
Sustainability 15 14935 g013
Figure 14. Sensitivity analyses of both the LCOE (a) and the system’s autonomy (b) to fluctuations in wind power across each scenario.
Sustainability 15 14935 g014
Figure 15. The impact of wind power fluctuations on the diesel generator’s capacity to sustain a 95 % autonomy rate in S C # 2 , and the consequent alteration in the LCOE.
Sustainability 15 14935 g015
Figure 16. The annual emissions amount of the hybrid power system for each scenario.
Sustainability 15 14935 g016
Table 1. Electricity consumption devices and estimated daily usage in a mobile hospital [29,30].
Equipment Power   ( W ) Hours   Used   per   Day   ( h )Energy Consumption
(Wh/Day)
Lights 11 25 8 12 88 175
Mobile phone charger 5 20 8 12 40 240
Fan (DC, AC) 30 100 8 12 300 1200
Water pump 100 200 6 600 1200
Computer 150 200 8 675 1000
Portable electrical heater 1000 1500 3 2500 3500
Printer (ink, laser) 65 1000 2 130 2000
Small waste autoclave 600 6000 1 2 600 6000
Sterilizer (steam) 500 1560 4 2000 6200
Suction 24 50 10 14 240 700
Pulse Oximetry 24 50 3 72 150
RO water purifier 260 570 7 1820 2590
Magnetic resonance imaging (MRI) 6000 7000 4 24,000 28,000
Computed tomography (CT) 2500 3500 4 10,000 14,000
X-ray machine (dental) 2000 5000 3 5 6000 25,000
X-ray machine 3000 6000 2 6 6000 36,000
Mechanical ventilator 600 700 3 6 1800 4200
Ultrasound scanner 2000 4 6 2000 12,000
Electrocardiogram (ECG) 500 800 3 4 1500 2400
Nebulizer 180 250 3 5 540 1250
Refrigeration unit 400 500 4 8 1600 4000
Microscope 30 2 60
Centrifuge 600 1.5 3 900 1800
Spectrophotometer 63 1 63
Blood chemistry analyzer 45 100 2 90 200
Hematology analyzer 230 500 2 460 1000
Table 2. Symbols corresponding to the studied wind turbine models.
Turbine ModelSymbol
Vestas V44/600T1
Enercon E40 600/46T2
Nordex N43/600T3
REpower 48/600T4
Table 4. Optimal wind/biogas/diesel generator system configurations and corresponding techno-economic parameters in each scenario.
Parameter S C # 1 S C # 2 S C # 3
Turbine modelT2T2T2
Wind capacity ( k W ) 600 600 600
Diesel generator capacity ( k W ) 0.00 104.81 331.84
Biogas generator capacity ( k W ) 59.10 59.10 59.10
LCOE ( U S D / k W h ) 0.0734 0.1563 0.1756
RES fraction ( % ) 72.42 72.42 72.42
Autonomy ( % ) 72.42 95.00 100.00
Table 5. A comparison between the current study results and other studies in the literature.
StudyLocationConfigurationLCOE (USD/kWh)RES Fraction (%)Autonomy (%)
Current studyJordan Wind–Biogas/Diesel 0.17572100
[35]India PV–Wind–Diesel 0.21064100
[8]Turkey PV–Wind–Diesel 0.38355100
[30]Iran PV–Wind–Battery 0.521100100
[7]NigeriaPV–Wind–Diesel0.11784100
Disclaimer/Publisher’s Note: The statements, opinions and data contained in all publications are solely those of the individual author(s) and contributor(s) and not of MDPI and/or the editor(s). MDPI and/or the editor(s) disclaim responsibility for any injury to people or property resulting from any ideas, methods, instructions or products referred to in the content.