Article

Sustainable Silt Management in the Lower Kosi River, North Bihar, India: Demand Assessment, Investment Model and Socio-Economic Development

1
Department of Earth Sciences, Indian Institute of Technology Kanpur, Kanpur 208016, India
2
Department of Geosciences, Faculty of Mathematics and Natural Sciences, University of Tübingen, 72076 Tübingen, Germany
3
TARU Leading Edge, 221 Ground Floor, Okhla Industrial Area, Phase III, New Delhi 110020, India
4
Formerly with Oxford Policy Management Ltd., 4/6, First Floor, Siri Fort Institutional Area, New Delhi 110049, India
*
Authors to whom correspondence should be addressed.
Sustainability 2023, 15(20), 14952; https://doi.org/10.3390/su152014952
Submission received: 1 July 2023 / Revised: 20 September 2023 / Accepted: 3 October 2023 / Published: 17 October 2023

Abstract

:
The Kosi River, draining through Nepal and north Bihar, India, has been known for excessive sediment (commonly called silt) deposition—a primary cause of several hazards. However, there are still no good estimates of the volume of silt accumulated in the Kosi River channel, which makes removal and utilization of silt a major challenge, both technically as well as economically. In this work, we first present a novel method to estimate sediment volume on a reach scale using hydrological and channel planform data mapped from satellite images. We then identify various commercial uses of the Kosi River sediments such as embankment construction, backfilling, land reclamation, landscaping, agricultural applications, industrial applications, and geotextile silt walls. In consultation with various stakeholders, backfilling and embankment construction were identified as potentially the best solutions shortlisted for the development of a business case and investment model. Therefore, we prepared an investment model based on economic viability, cost-to-benefit ratio, and stakeholder consultations for two districts. We performed a SWOT analysis by breaking down the opportunities and risks into political, economic, social, technological, environmental, and legal (PEST-EL) factors to identify the pros and cons within the sector and of the ecosystem in which the stakeholders operate.

Graphical Abstract

1. Introduction

Over the past several decades, anthropogenic pressures associated with population growth, urban sprawl, and economic development have resulted in an unprecedented increase in demand for natural resources provided by the river systems [1,2,3]. In particular, the demand for riverine sediments has seen exponential growth since the 1970s, which is now surpassing the global supply [4,5,6,7]. As per the current estimates, a minimum of 32–50 × 103 million tonnes (Mt) of aggregates are extracted annually on a global scale [8]. These extracted aggregates account for up to 85% of the weight of minerals mined globally [9].
Riverine sediments form the most important aggregate materials used in a wide range of industries and products [10] such as water filters, electronic products, mortar, tiles, bricks, glass, adhesives, ceramics, and construction materials for houses, roads, and dams [10,11,12]. Large quantities of sand are used in the fracking industries for oil abstraction from shale [9,11]. Looking at this trend, the United Nations Environment Programme (UNEP) has stipulated that riverine sand represents the second most consumed natural resource next to water on planet Earth [8]. The exponential increase in demand has made these aggregates a valuable commodity that plays an important role in the global economy [12]. The commercial extraction of riverine sediments is now a global phenomenon due to its low cost-to-benefit ratio, which makes this resource much more profitable in comparison to other alternatives such as dry terrace mines, quarries, reservoirs, and deltas [13,14,15]. Therefore, most tropical and subtropical countries still rely on river sources to meet their aggregate requirements, especially sand, in various industrial activities as well as to boost their economy.
Despite its commercial significance, both an excess as well as a dearth of riverine sediments have severe environmental consequences. Extraction of a large volume of riverine sediment without proper assessment alters the hydraulic properties of the flow and the morphodynamic evolution of the riverbed. Numerous studies have shown that riverine sand extraction alters geomorphic processes and channel bed morphology [6,13,14,15], manifested as bank instability [2], altered riverine biodiversity [15], increased tidal intrusion [16], and saline intrusion in deltaic environments [17]. On the other hand, if not appropriately managed, excessive sedimentation also poses serious environmental problems such as increased risk of flooding and poor navigability. The case study of the Mississippi River basin [18] is a classic example, where the river lost 30–100% of its capacity due to sedimentation and posed a severe risk of flooding in several backwater lakes along the Illinois River. Excessive sedimentation rate (20.5–53.3 mm/yr) over the entire Mississippi River valley [18] makes it unsuitable for navigation without regular dredging work, which is a costly affair. Excessive sedimentation also impacts primary producers and invertebrates, resulting in a change in the aquatic food web, nutrient cycle, and biogenic processes that modify and segregate pollutants [6]. From a socio-economic perspective, areas associated with excessive sediment include regions where the sediment concentration is too high (e.g., the intakes of turbines at hydro-electric power plants) or where large volumes of sediments are deposited (e.g., canals, upstream of dams and impoundments, embanked rivers and streams, ports, and harbors) [19].
Sediment extraction from river systems through dredging, flushing, or relocation are common solutions to mitigate excessive sedimentation [20,21]. Dredging and subsequent treatment and disposal of sediments are the preferable solutions in many instances, particularly for managing canals, ports, and harbors [21]. Dredging is a good option for reservoirs in a few circumstances; however, sediment removal via hydraulic flushing and by-passing or settling ponds is more cost-effective and sustainable in the long term [22]. Most past measures involve end-of-pipe solutions that deal with the problem as and when it appears, without looking into the root cause [19]. Thus, from ecological, economic, and environmental perspectives, controlling the initial mobilization and supply of sediments from various sources (i.e., source control) is one of the primary needs of sediment management.
Therefore, a comprehensive assessment of the sources, pathways, fluxes, volume, type, and timing of sediment fluxes (i.e., not too much at ecologically sensitive times of the year) is needed in river basins for their sustainable geomorphological and ecological functioning [19]. At a global scale, large rivers make a major sediment contribution to the global ocean [23,24]. High sediment yields are typically associated with tropical environments and high mountain belts such as the Andean and Himalayan belts [23]. In particular, Himalayan rivers have substantially higher sediment contributions compared to all other mountain-fed rivers of the world [23]. Among the Himalayan rivers, the Kosi River, a major tributary of the main Ganga, is one of the most dynamic rivers in India, which is characterized by exceptionally high discharge and sediment flux [25]. Hinterland characteristics impact the downstream reaches of the Kosi River in terms of excessive sediment flux manifested as in-channel siltation that triggers a flood risk by reducing its channel capacity to convey flood waters and weakening the flood protection structures due to erosion and scouring [26]. It also creates a gradient advantage that leads to channel avulsion and extensive flooding at several reaches [26].
Considering that excessive sediment flux is the central problem in the alluvial regions of the Kosi River, this paper aims to (1) map the hotspots of siltation and provide the best possible estimates of sediment volume in different reaches of the lower Kosi River, North Bihar; (2) design resource-use practices with a major emphasis on managing the desiltation process (i.e., where, how much, and when to desilt), and (3) propose a sustainable sediment management policy framework with key recommendations. It is worth mentioning that this is the first-ever study on demand assessment and on an investment model for sediment utilization in this region that combines the hydrogeomorphic approach and economic analysis. This paper first presents a detailed account of the hydrogeomorphic setting of the study area and the methods applied for the estimation of sediment volume and for developing the investment model. We then present the results and analysis of the data which primarily include the identification of hotspots of siltation and investment models for two solutions—backfilling and embankment. We have also identified the other potential opportunities for sediment utilization as well as the key risks of the investment model and possible mitigation strategies.

2. Study Area

We have studied the alluvial part of the Kosi River in the Ganga plain extending from Chatara, where it enters the Terai region, Nepal to its confluence point with Ganga at Baltara, India where it meets the Ganga (Figure 1a). The Kosi River is one of the most dynamic rivers in the Eastern Gangetic plain, characterized by large discharge and sediment supply from the hinterland [25]. It is fed by the combined flow of seven tributaries from Tibet, Nepal draining from an area of ~52,731 km2, and then it debouches into the Ganga plains [25]. A detailed study on the morphometric characteristics (e.g., slope, shape, relief, and elevation), channel characteristics (e.g., slope, stream network density, valley confinement), and the combined effects of vegetation (e.g., land use) of hinterland has highlighted the planform and sediment dynamics of the Kosi River basin [27].
The variability of the rainfall gradually decreases from the Himalayan part of Nepal towards the alluvial reaches of Bihar [25]. It has been estimated that out of the total annual sediment flux of ~100 Mt at Chatara, the western, central (Arun, Dudh Kosi), and eastern (Tamor) tributaries contribute ~40%, 44%, and ~16%, respectively (Figure 1b) [25,27]. The Kosi River behaves as a transport-limited system, as a large part of the sediment getting deposited in the alluvial reaches as manifested in a much-reduced sediment load of 80 Mt/yr and 43 Mt/yr at Birpur and Baltara, respectively [25]. Further, the construction of embankments and barrages in the 1950–1960s reduced the area of sediment accumulation, thereby raising the bed level leading to several breaches and flooding events in recent decades [26,28,29]. One of the most disastrous flood events of August 2008, at Kusaha, 12 km upstream of the Kosi barrage, was the outcome of the bed level rise (~4–5 m) caused by excessive sedimentation [29]. This event was marked by a lateral channel shift of ~120 km and a large flood, impacting more than three million people residing in the proximal plains of Nepal and northern Bihar [29].
Flood management in the Kosi River basin has primarily been focused on structural interventions such as constructing, raising, and strengthening the embankments (levees), river training, and riverbank and town/village protection measures with limited dredging of the sediments. Sediment management has not been considered an effective way to find long-term solutions to the recurring problems of floods and channel morphodynamics. There is much less emphasis on the utilization of the dredged sediments both commercially and socially for economic and social growth and development of the affected areas. It might be useful to consider alternative options and design a business plan including input costs and benefits to rolling out a policy for sediment management. In this context, this paper offers some viable solutions based on scientific understanding and economic analysis.

3. Data and Methods

3.1. Sediment Volume Estimation and Criteria for Potential Solutions for Sediment Management

We first estimated the volume of sediments accumulated in the Kosi River channel using a combination of hydrological and planform data using temporal satellite images covering the period 1972–2016 (see Table S1 for the list of datasets used for this study) following the methodology developed in our previous work [30] and shown in Figure 2a. Using the pre-monsoon satellite images, we mapped the planform features such as mid-channel bars, point bars, and lateral bars and computed their areas (BA) at the reach scale (~5 km length) [30]. We also mapped the channel area (CA) for each reach. We then used the ratio BA/CA as an index to map the aggradational hotspots. Based on the statistical distribution of the reach-wise BA/CA, we identified five classes of aggradation values using Jenks natural breaks classification method [31,32]. To estimate the first-order sediment thickness and rate of deposition in the Kosi main channel for the post-embankment period, a short-term sediment budget was calculated from sediment data collected from stream gauging stations, i.e., from Chatara, Birpur, and Baltara (for different water years, see Sinha et al., 2019) [25]. The estimated cumulative vertical thickness calculated on the channel belt area of deposition was derived from geomorphic maps. Detailed procedures of planform mapping and hydrological data analysis are available in the Supplementary Materials.
We then compiled several potential solutions for sediment management based on the literature survey, sediment volume and composition data, and consultations with the stakeholders (Table S2). A major part of this work has involved the development of criteria for shortlisting the solutions based on economic viability, cost-to-benefit ratio, and stakeholder consultations. Six major criteria were identified along with their relative importance for shortlisting the potential solutions for sediment management (Table 1). Further, looking at the scope and availability of the current data in the study area, backfilling and embankment construction were selected as the two potentially best solutions for developing a business case and investment model focused on hotspot reaches of siltation in two districts, namely Saharsa and Supaul in the Kosi River basin.

3.2. Investment Model and Business Plan

Based on the priority zones, the investment plan is mainly focused on the utilization of the extractable sediments accumulated along the Kosi River confined to the reaches of Saharsa and Supaul. To make the best utilization of the dredged silt, two types of mining plans and investment models (Figure 2b,c) are proposed in consultation with the Water Resources Department, the government of Bihar, and various stakeholders. It was estimated that the government of Bihar (GoB) currently undertakes dredging to manage sediments amounting to 2.5 million m3 which accounts for a very small proportion of annual sediment accumulation (discussed later) with an approximate expenditure of Rs 500 million at an interval of every year or two. Our detailed assessment is based on the current sediment volume extraction done by the GoB, complemented by commercial as well as expenditure plans for utilizing the dredged sediments. Further, for developing the commercial plans, a detailed financial analysis was done for the industries over a period of 10 years and for two value chain models were proposed above.
To manage silt, it is important to assess the institutional current resources and capabilities (internal strengths, weaknesses) and external market situation (opportunities and threats), which was done using the SWOT framework [33,34]. To complement the SWOT, it was necessary to map and analyze the impact of the external marketing environment [35,36] by breaking down the opportunities and risks into (a) Political, (b) Economic, (c) Social, (d) Technological, (e) Environmental and (f) Legal—the so-called PEST-EL factors [35,36,37]. It helped to identify the pros and cons within the sector and of the ecosystem that the stakeholders operate.

4. Results and Analysis

4.1. Hydrogeomorphic Analysis for ‘Hotspot’ Identification and Sediment Volume Estimation

Figure 3 shows the planform maps of the Kosi River channel between 1972 and 2016 (modified after Sinha et al. 2023b) [38] and Figure 4a shows the plot of channel area and bar area calculated from these maps during the study period (also see Table S3). The bar area shows significant contrast at both spatial and temporal scales. Since the channel belt area has also varied through time at the reach scale, the bar area alone cannot be used to identify the hotspots of siltation. Therefore, we have used the ratio of bar area to channel area (BA/CA) as a better proxy for mapping aggradational reaches in the channel (Figure 4b). We propose that the reaches with values more than 2 be considered as aggrading reaches. We note that the year-to-year variability in BA/CA values is quite large; however, the average value of this ratio for the entire period reflects aggradation or degradation in a given reach. It is observed that the BA/CA values for most of the reaches between Chatara–Birpur (upstream of the barrage) vary between 2 and 3. Immediately downstream of the barrage (reaches 9–11 and 14–16), the values of BA/CA are as high as 6. Downstream of reach 17, the BA/CA ratio varies considerably from year to year, and the average value decreases continuously and becomes close to 1 around reach 27.
Using the BA/CA ratio [38], the entire stretch between Chatara (upstream) to Baltara (downstream) has been classified into five major zones using Jenks natural breaks classification method [31,32], i.e., (I) Very low aggradation (BA/CA < 1.11), (II) Low aggradation (BA/CA 1.11–1.56), (III) Moderate aggradation (BA/CA 1.56–3.29), (IV) High aggradation (BA/CA 3.29–4.84), and (V) Very high aggradation (BA/CA 4.84–6.09) (Figure 4c). Upstream of the Kosi barrage, most of the reaches fall in Zone I (reach 3) or Zone III (1, 4–8) except for one reach that falls in Zone II (reach 2) (Figure 4d). The reaches falling in Zone IV (2, 12–13, 17, 19–21) and V (9–11, 14–16, 18) are considered as the major hotspots of siltation, and almost all of them are downstream of the barrage falling in the Supaul district. Farther downstream, a large number of reaches falling in the Saharsa district are classified as Zone I (25, 28–37) and Zone II (25), whereas a few are in Zone III (reaches 22–24) (Figure 4d).
For sediment volume estimation, we have used the sediment thickness calculated from the first-order hydrological sediment budgeting [25] based on historical sediment load data at different gauging stations (Figure 1b). The cumulative sediment thickness was calculated from the hydrological budgeting to be 2.87 m between Chatara and Birpur and 2.13 m between Birpur and Baltara in 54 years of the study period (Table 2). Considering the respective thickness, we computed reach-scale sediment volume accumulated within the active channel belt using the planform data (bar area) (Figure 5; also see Tables S3 and S4). We considered this volume as the extractable sediment from the active channel belt. Based on this, the total extractable sediment volume between the two stretches of Chatara–Birpur and Birpur–Baltara was computed as ~279 million m3 and ~835 million m3, respectively (Table 2). Further, a first-order estimate of the sediment volume available from the major hotspots, i.e., Zone IV and V, lying in one of the districts (Supaul) is 755 million m3. Several moderate zones of aggradation (Zone III) fall in another district (Saharsa) representing 59 million m3 of average sediment volume in the last 54 years.
Looking at the large volume of the sediments accumulated within the stretch, a model for sustainable sediment management is proposed for the Saharsa and Supaul regions in the present study. As noted above, most reaches falling in Supaul are characterized as major hotspots (Zone IV and V), whereas a few reaches falling in the Saharsa district correspond to moderate hotspots (Zone III).

4.2. Investment Model: Demand Assessment, Cost-Benefit Ratio, and Financial Analysis

Based on the demand and assessment, economic viability, cost-to-benefit ratio, two selected solutions are (a) backfilling and (b) embankment, which can consume a major proportion of the dredged silt from the Kosi River.

4.2.1. Solution 1: Backfilling

Backfilling is the process of putting soil back into the trench or foundation after excavation. The potential areas for financial modelling and building the investment model for sediment management considered here are (a) backfilling of roads and houses, (b) creation of habitat islands, and (c) large infra projects. We present the results of the analysis for these options next.
(a)
Backfilling of roads and houses (up to the plinth level and in the compound)
A demand assessment for backfilling of roads has been done for the initial 5 years in three basic types of road construction categories, namely (a) national highways, (b) state highways and major district roads, and (c) rural roads and minor district roads. It is estimated that an amount of 1,304,085 m3 of silt will be utilized in a span of 5 years with an annual silt utilization of 260,817 m3 (Table 3). Similarly, the demand assessment of the silt utilization in building houses for the next 5 years was assessed (Table 3). Considering the two districts, Saharsa and Supaul, with an average population growth of 2.33% and 2.55%, a total of 3,803,037 m3 of silt is needed in the real estate business with an annual demand of 760,607 m3.
Based on the local factors, the average cost of silt for the solution was assessed to be Rs 299.59/m3. Depending upon the chosen model of operations, the profits of various stakeholders will be added to this cost at different points of the value chain. Adding a profit margin of the entire industry of approx. 5% to the estimated price of silt, it will be Rs 314/m3 for road construction as well as house backfilling. Using this cost figuring, the total capital expenditure needed for both the solutions (backfilling of roads and houses) for stocking the dredged silt is also summarized in Table 3. It is estimated that Rs 6.1 million and Rs 17.9 million will be the direct costs for the 1-month silt production required for road backfilling and building houses. The corresponding maximum capacity required to store the dredged silt is Rs 9.8 million and Rs 28.5 million, respectively (Table 3).
Further, the financial analysis of the project of road backfilling and house backfilling is summarized in Table 4. Based on the analysis, it is concluded that backfilling of road construction and houses is a major activity involving private players and needs to be executed in the Value Chain B model. The demand assessment can be materialized only if there is some policy support for the mandatory utilization of silt for backfilling of road construction and backfilling in constructing houses. If executed successfully, the market value added from the commercial use of the silt to the economy of Supaul and Saharsa districts could be approximately Rs 81.9 million and Rs 238.8 million per annum. This will provide an annual income of Rs 3.66 million and Rs 10.68 million to Supaul and Saharsa districts, respectively.
(b)
Backfilling for the creation of habitat islands
Dredged silt can also be used for the construction of terrestrial habitats on islands, floodplains, and shore areas. The proper placement of dredged sediments on the islands’ floodplain areas is done to restore habitat diversity. To utilize the silt for habitat creation, a demand assessment for the next 5 years was calculated and summarized in Table 3. Based on the assessment, it is estimated that backfilling for habitat creation can utilize up to 748,033.5 m3 of silt in 5 years with an annual estimate of 149,606.7 m3. Based on the local cost of dredging (Rs 200/m3) and construction (Rs 390/m3), the total cost of habitat island filling works out to be Rs 590/m3 and the annual cost of operations is estimated to be Rs 88.3 million.
Since this is a purely government expenditure, no capital investment financial metrics like internal rate of return (IRR) and net present value (NPV), etc. are required. Therefore, from the above analysis, it is concluded that the backfilling of habitat island is an expenditure that can be executed by the government entirely with the Value Chain A model. The demand assessment can be materialized only if there is a conscious effort for the utilization of silt to fill the habitat island. From the execution of the solution, a yearly value of approx. Rs 88.3 million can be added to the economy of the Supaul and Saharsa districts.
(c)
Backfilling for large infra projects
In addition to the major solutions discussed above, there seems to be huge scope for utilizing silt in various large infrastructure projects for backfilling for several potential initiatives to be taken up by the central government soon. As per the National Waterways Bill of 2015, five national waterways and 101 inland waterways spread among 24 States are being taken up by the Inland Waterways Authority of India (IWAI). Similarly, the National Waterways Act of 2016 considered the Kosi River as the National Waterways number 58. Seven rivers of Bihar, namely Ganga, Gandak, Ghaghra, Kosi, Karamnasa, Sone, and Punpun, have been declared as the national waterways of India. In particular, the waterways planned on Ganga, Gandak, and Kosi Rivers in Bihar are strategically important and have been prioritized for development. These initiatives should encourage the consumption of dredged silt to maintain, manage, and regulate these inland waterways.

4.2.2. Solution 2: Embankment

The embankments are often constructed for the purpose of raising the grade of a river or roadway (or railway) above the level of the existing surrounding ground surface. The construction of an embankment typically involves the use of soil, aggregate, rock, or crushed sand, which are compacted to make a fill. Normally, a firm foundation is made at the base of the embankment and provisions are made to facilitate drainage and prevent saturation. The top portion of an embankment usually is made of high-quality, well-compacted subgrade material that can support the overlying roads and vehicular movement without any deformation. In view of the large implication of the embankment in the Kosi River basin, two major options are considered in this study: (a) raising the height of the embankment to prevent flood, and (b) for road construction on the embankment.
(a)
Raising the height of the embankment
Dredged silt can be used as the fill material for building embankments or raising its height. To estimate the quantum of silt utilization in the next 10 years, a demand assessment has been done (Table 5). Considering the length, width, and height of the embankment, it is estimated that the volume of silt utilization for the next 10 years will be 637,392 m3, which accounts for 63,739 m3 of silt volume annually (Table 5). Based on the local costs of dredging and construction, the total cost of silt utilized in the next 10 years is estimated to be Rs 267.06 million, which accounts for Rs 26.71 million annually (Table 5). Since this is purely an expenditure for the government, there is no capital expenditure. Also, financial metrics like IRR, NPV, etc. are not required.
Based on the demand and assessment, it is concluded that raising the height of the embankment is an expenditure activity that can be executed entirely by the government. Hence, it favors the Value Chain A model. The demand assessment can be materialized only if there is a conscious effort of the utilization of silt for filling or raising the height of the embankment. Further, the successful implication can add a yearly value of approx. Rs 26.71 million to the economy of Supaul and Saharsa districts (Table 5).
(b)
Building road on embankment
Similarly, the dredged silt has further use in constructing roads on embankments, thereby improving transport and connectivity of the city/state. We assessed the demand for silt utilization in road construction for the next 10 years based on the length of the Kosi River (260 km) and the volume required for the construction (Table 5). It is estimated that total silt utilization for the next 10 years would be 643,500 m3 with an annual utilization of 64,350 m3.
Based on the cost factor, it is estimated that the average cost of silt per cubic meter would be approx. Rs 225.67/m3. Depending upon the model of operations, the profits of various stakeholders can be added to this cost at different points of the value chain. Adding a profit margin of approximately 10% for the entire industry would give us an estimated price of silt of Rs 248.24/m3 for road construction on the embankment.
Further, a financial analysis of the project was calculated based on the analysis, it is concluded that backfilling of road construction on embankments can be executed by the government entirely as there are minimal storage requirements. Hence, the Value Chain A model is appropriate in this scenario. The demand assessment can be materialized only if there is policy support for the mandatory utilization of silt for backfilling of road construction. The successful implication can add a revenue of approx. Rs 15.2 million to the economy of Supaul and Saharsa districts (Table 4).

4.3. Other Potential Opportunities

The dredged silt can prove to be a very useful resource for filling low-lying agricultural areas or waterlogged areas. As per the data available from the Department of Agriculture, GoB, the gross cultivable land of Bihar is about 7.946 million hectares with Saharsa and Supaul having 0.107 million hectares and 0.074 million hectares, respectively. About 76% of the population in North Bihar is estimated to be living under the threat of recurrent floods [39,40,41]. With an average of 1 m of filling requirements and assuming 67% of the agricultural fields to be low-lying, the potential volume of silt consumption in filling low-lying agriculture fields in the districts of Saharsa and Supaul itself could be close to 1200 million m3, which is more than accumulated silt in last 54 years (Table 2). Filling of low-lying agricultural fields will not only consume silt but will also increase the phosphorous content of the soil and most importantly, crops could be grown multiple times during the year (due to avoidance of flood), leading to a substantial increase in farmer’s income and savings from avoidance of floods. Similarly, silt can be used for filling low-lying public areas that can be used for building public infrastructure facilities like education institutes, hospitals, roads, railway stations, etc. These activities can also be integrated with the MNREGA (Mahatma Gandhi National Rural Employment Act) scheme to boost employment of rural area population. These activities may prove to be a costly exercise for the GoB, and hence, require detailed study on identifying low-lying areas, assessment of various costs involved, and collaboration with farmers to execute on a large scale.
Further, the Kosi region is known to be flood-prone [39,40,41] and large amounts of compensation and rehabilitation costs are incurred by the government every year. For example, the valuation of houses damaged in the massive Kosi River floods of August 2008 stood at around Rs 8800 million. Enormous quantities of goods were lost, including food grains and domestic items estimated to be worth Rs 4000 million and Rs 1550 million, respectively. The cost per house estimated was Rs 55,000 with an additional cost of Rs 2300 for a toilet and Rs 5000 for solar-powered lighting. In cases where beneficiaries did not own land, the GoB provided additional assistance of Rs 5000 for the people to buy the land. This loss of lives and property can be avoided with the implementation of the proposed investment models.
There are also opportunities for both small-scale self-employment as well as large-scale industries in using silt for making ceramic products, earthenware, bricks, and cement. Various research/education institutes have done successful studies showing the usage of silt for making such products. However, the quantity of silt utilized is very minimal and, in some cases, the product becomes too costly. Therefore, further research and development along with pilot studies are required for attracting entrepreneurs.

4.4. Key Risks of the Investment Model and Possible Mitigation Strategies

Every investment model has some risk factors that should be considered and analyzed while planning sediment management strategies. Some of the key risks analyzed in the present study in Kosi River are:
  • Mandatory usage of silt for construction purposes may result in delay of the projects. There is a need for streamlined processes, clearly laid down policies, and adequate storage of silt.
  • The strength of silt is generally poor as compared to other alternatives. To mitigate this, binding material may be added.
  • Non-viability/infeasibility of silt utilization in detailed technical studies has been noted. To achieve this, there is a need for further testing of silt to make it feasible with mixture/subsidising silt by GoB.
  • Non-availability of land for storage is a major problem and, therefore, it is proposed to sell directly from the embankment or place where dredged silt is kept.
  • Land acquisition issues for the construction of habitat islands should be taken up on priority by GoB.
  • The poor quality of the storage system needs to be resolved by building high-quality storage facilities to ensure safety in poor weather conditions/floods, etc.
  • Non-acceptance of environmental studies and approvals from various government departments for road construction on embankments needs to be resolved. Additionally, the use of silt for other established activities should be promoted.
In addition to the business models, the SWOT analysis provided an insight into the internal and external environment for the ministry, decision-makers, and stakeholders. The four aspects of the present analysis, i.e., Strength, Weakness, Opportunity, and Threats, are documented in Table 6.
Further, a multifaceted PEST-EL approach has helped to assess the big picture and to better understand the strategic orientation of an organization as summarized in Table 7. It has helped us to understand the macro-environmental factors that a company or an organization needs to consider in its decision-making. It will encourage firms to consider long-term goals and to choose sustainable business innovation and investment strategies specific to silt management.
These managerial implications and suggestions will help the government and private sector regarding the need for policy changes, the application of the public–private partnership mode and efficient project operation. It will also pave the way for private investors to finance such projects [37].

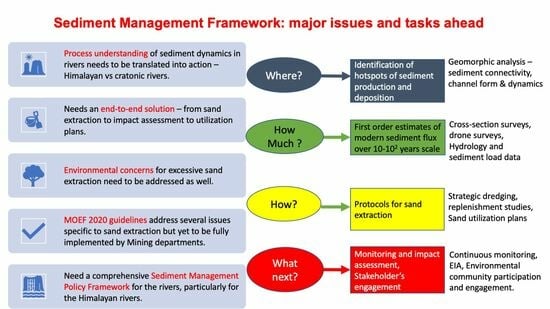
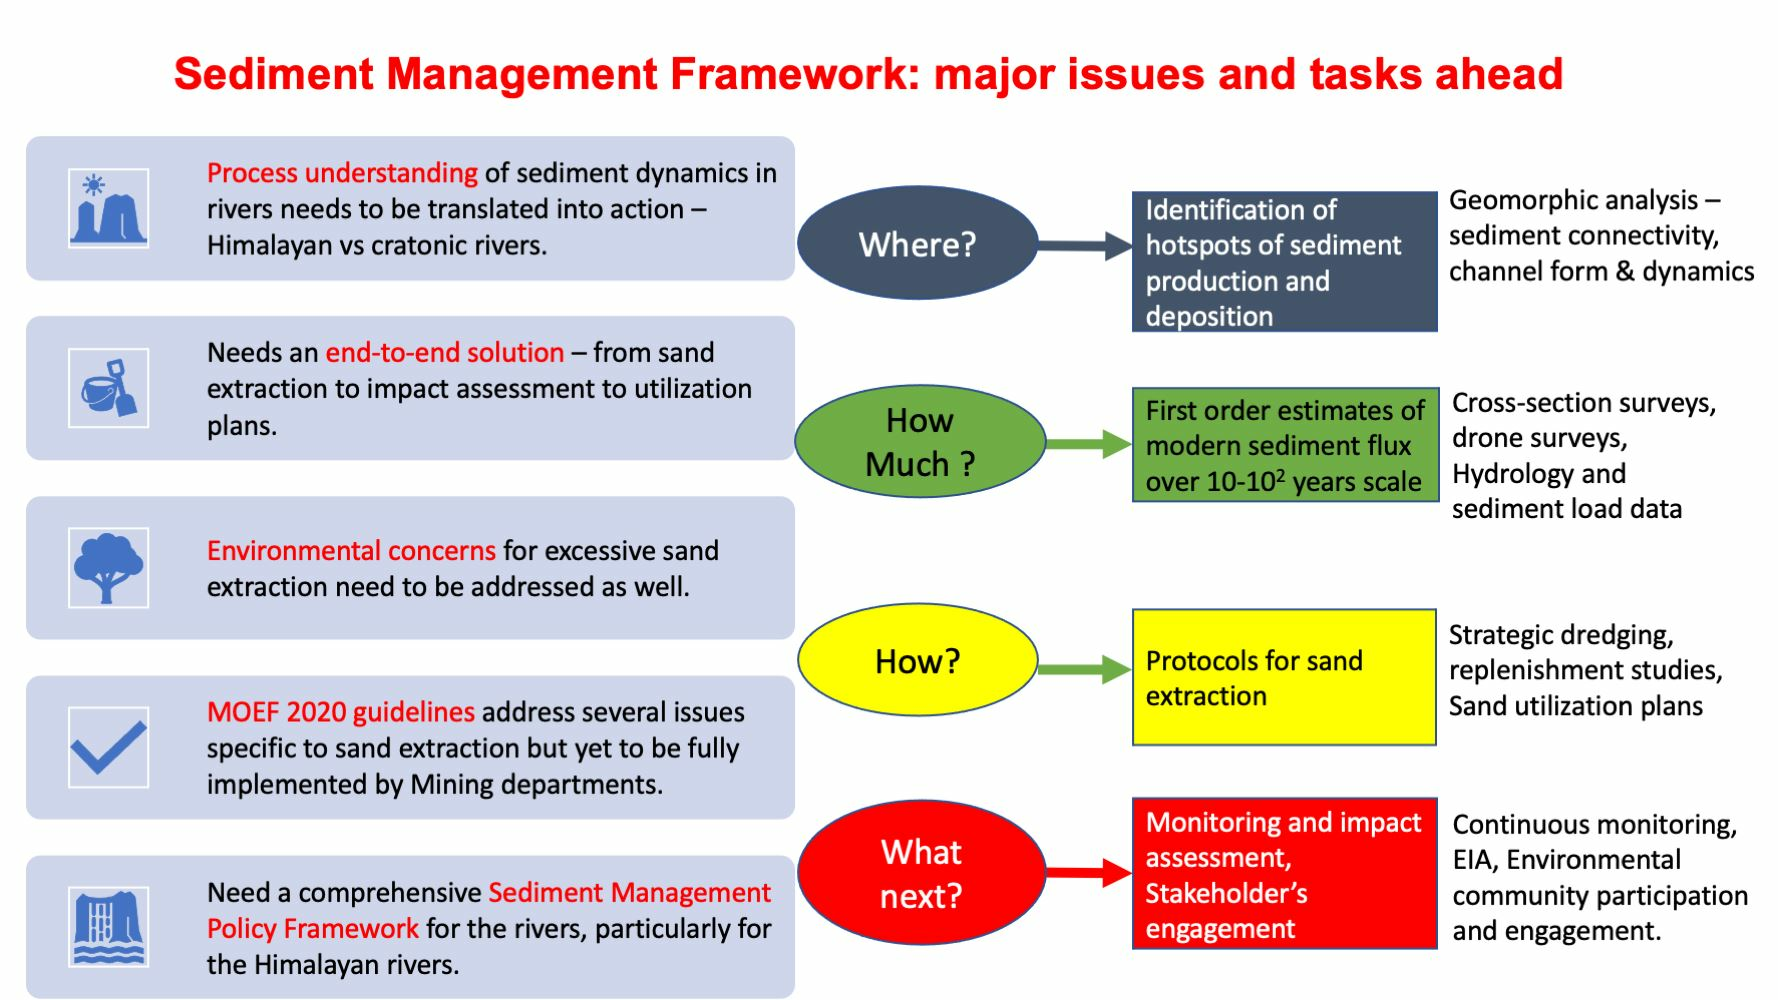
4.5. Proposed Sediment Management Framework

Excessive sedimentation in the Kosi River channel has been identified as a central problem and this has been attributed to high rainfall, steep topography, unstable channels, and high sediment connectivity [25,27]. Despite several decades of research, there has been a lack of reliable data in terms of understanding the processes related to sediment dynamics in this basin as well as estimates of sediment accumulated in the channel belt. This study has provided a quick assessment of sediment volume based on channel planform analysis and hydrological data. Based on our comprehensive study of the Kosi River basin, we propose a comprehensive sediment management framework. The infographics presented in Figure 6 shows the different steps required for developing a sediment management framework and silt utilization plan for the Kosi River basin.
Figure 7 presents the detailed sediment management framework, which is applicable to most sediment-charged rivers across the world. This framework consists of four major parts, namely (a) problem identification, (b) measurements, (c) silt management, and (d) silt utilization plans. The problem identification stage should primarily involve the identification of hotspots of siltation using a hydrogeomorphic study. We also need reliable measurements of sediment load data at multiple stations along the river as well as river morphological parameters to understand the sediment dynamics and contributions from different tributaries. For long-term sediment management, catchment-scale strategies are necessary which should include reduction of sediment production using catchment area treatment, check dams, and contour bounding. In the downstream reaches, sediment management using sediment bypass structures may be useful. Finally, strategic dredging following scientific principles may be necessary for selective reaches of excessive sedimentation. The dredging of silt must be economically feasible, and its utilization plan must be developed. In addition to a scientific plan, it is equally important to have a strategic road map for financial and administrative management for silt utilization and Table 8 presents the key recommendations for short-, medium-, and long-term strategies.
It is important to note that this study does not encourage or support the dredging of rivers without proper scientific study. It is aimed at providing a silt utilization plan where excessive sedimentation is posing a serious problem. Given the large volumes of silt accumulated within the Kosi River channel, systematic desilting/dredging must be done to bring the river to a stable condition. However, dredging the silt has proven to be a costly burden to the government. The commercial usage of silt and its investment model identified in this study makes a value proposition to dredge silt with benefits flowing to the nearby districts as well as to the government. As discussed before, the investment model has been prepared on a small scale along the Kosi River in Saharsa and Supaul districts. If successful, it can be replicated and extrapolated at the state as well as national /international level.

5. Conclusions

  • The Kosi River is a highly sediment-charged river, and we estimate a total of 1114 million m3 of extractable sediments accumulated in the channel belt since the construction of the embankment (1972–2016). In the reaches falling in two prominent districts, Supaul and Saharsa, the total sediment volume is estimated to be 755 million m3 and 59 million m3, respectively.
  • Given such large volumes of sediments, strategic dredging of sediments may be necessary from several reaches (hotspots of siltation) to stabilize the river and reduce the associated hazards. However, such dredging must be done following international practices and more importantly, must be commercially viable.
  • Our study shows that with an initial investment of Rs 62.3 million (initial capital expenditure funding of the project), the annual benefit can be Rs 14.1 million from the different solutions.
  • Our study suggests that various subfactors associated with two major solutions, backfilling and road construction, can consume up to 1.3 million m3 of silt dredged from Kosi River from Saharsa and Supaul districts, which can be worth Rs 335.8 million that can be utilized commercially on a yearly scale.
  • Some of the solutions are entirely based on government expenditure, i.e., habitat island filling and raising embankment filling, which can cost up to Rs 114.3 million forecasted for a period of 10 years. Thus, based on the present analysis, it is evident that with low investment, a high revenue return distribution model can be set up. Also, if successful, it can be replicated and extrapolated at the state as well as national level.
  • Apart from the sediment management framework, a strategic roadmap and implementation plans have also been proposed for short-term (1–2 years), medium-term (3–5 years), and long-term (6–10 years) approaches, for which specific recommendations have been provided based on the investment models presented in this work.

6. Limitations and Future Scope

This study is based on the first-order estimate of silt accumulated in the Kosi River using satellite data. Although the planform maps prepared from the satellite images provided a good estimate of the bar areas at reach scale, the estimates of their thicknesses were based on long-term hydrological data from three stations located several tens of kilometers apart. This might have underestimated the volume of sediments accumulated within the channel belt. This study can be improved by obtaining ground measurements of bar thicknesses at a few locations during low flow periods. However, the main purpose of this study is to emphasize the enormity of the problem of sediment accumulation in the Kosi River and to suggest possible solutions for sediment management that are economically feasible.

Supplementary Materials

The following supporting information can be downloaded at: https://www.mdpi.com/article/10.3390/su152014952/s1, Table S1. Data used for geomorphic mapping and planform dynamics. Table S2. Potential solutions for silt management. Table S3. Reach-wise calculation of bar area (BA), channel area (CA) and channel belt area (CB) of the Kosi River from Chatara to Baltara during 1972–2016 in Lower Kosi basin. Table S4. Reach-wise silt volume computed from the bar area of the Kosi River (in the last 54 years).

Author Contributions

Conceptualization, R.S., P.S. and V.S.; Methodology, R.S. and P.S.; Formal analysis, P.S.; Resources, V.S.; Data curation, Kanchan Mishra; Writing—original draft, K.M.; Writing—review & editing, R.S.; Project administration, R.S. and V.S.; Funding acquisition, R.S. and P.S. All authors have read and agreed to the published version of the manuscript.

Funding

This research was funded by Oxford Policy Management Limited (OPML)—grant number [OPML/ES/2016387] and the APC was waived by the journal editor.

Institutional Review Board Statement

Not applicable.

Informed Consent Statement

Not applicable.

Data Availability Statement

All data related to this publication have been provided in the Supplementary Section.

Acknowledgments

The officials and staff of the Water Resource Department, Government of Bihar provided all logistic support for carrying out this study. The IIT Kanpur is thanked for extending the laboratory facilities for carrying out sedimentological analysis of silt samples.

Conflicts of Interest

The authors declare no conflict of interest.

References

  1. Best, J. Anthropogenic Stresses on the World’s Big Rivers. Nat. Geosci. 2019, 12, 7–21. [Google Scholar] [CrossRef]
  2. Hackney, C.R.; Darby, S.E.; Parsons, D.R.; Leyland, J.; Best, J.L.; Aalto, R.; Nicholas, A.P.; Houseago, R.C. River Bank Instability from Unsustainable Sand Mining in the Lower Mekong River. Nat. Sustain. 2020, 3, 217–225. [Google Scholar] [CrossRef]
  3. Kondolf, G.M. River Restoration and Meanders. Ecol. Soc. 2006, 11, 42. [Google Scholar] [CrossRef]
  4. Torres, A.; Brandt, J.; Lear, K.; Liu, J. A Looming Tragedy of the Sand Commons. Science 2017, 357, 970–971. [Google Scholar] [CrossRef] [PubMed]
  5. Bendixen, M.; Best, J.; Hackney, C.; Iversen, L.L. Time Is Running out for Sand. Nature 2019, 571, 29–31. [Google Scholar] [CrossRef] [PubMed]
  6. Koehnken, L.; Rintoul, M.S.; Goichot, M.; Tickner, D.; Loftus, A.C.; Acreman, M.C. Impacts of Riverine Sand Mining on Freshwater Ecosystems: A Review of the Scientific Evidence and Guidance for Future Research. River Res. Appl. 2020, 36, 362–370. [Google Scholar] [CrossRef]
  7. UNEP-GEAS. Sand, Rarer than One Thinks. Environ. Dev. 2014, 11, 208–218. [Google Scholar] [CrossRef]
  8. Gavriletea, M.D. Environmental Impacts of Sand Exploitation. Analysis of Sand Market. Sustainability 2017, 9, 1118. [Google Scholar] [CrossRef]
  9. USGS Sand and Gravel (Industrial). Silica Statistics and Information; USGS: Reston, VA, USA, 2011; Volume 1. [Google Scholar]
  10. Bendixen, M.; Iversen, L.L.; Best, J.; Franks, D.M.; Hackney, C.R.; Latrubesse, E.M.; Tusting, L.S. Sand, Gravel, and UN Sustainable Development Goals: Conflicts, Synergies, and Pathways Forward. One Earth 2021, 4, 1095–1111. [Google Scholar] [CrossRef]
  11. National Industrial Sand Association (NISA). What Is Industrial Sand? Available online: https://wisconsinsand.org/industrial-sand/ (accessed on 30 June 2023).
  12. Filho, W.L.; Hunt, J.; Lingos, A.; Platje, J.; Vieira, L.W.; Will, M.; Gavriletea, M.D. The Unsustainable Use of Sand: Reporting on a Global Problem. Sustainability 2021, 13, 3356. [Google Scholar] [CrossRef]
  13. Kondolf, G.M. Hungry Water: Effects of Dams and Gravel Mining on River Channels. Environ. Manag. 1997, 21, 533–551. [Google Scholar] [CrossRef] [PubMed]
  14. Kim, T.T.; Huong, N.T.M.; Huy, N.D.Q.; Tai, P.A.; Hong, S.; Quan, T.M.; Bay, N.T.; Jeong, W.K.; Phung, N.K. Assessment of the Impact of Sand Mining on Bottom Morphology in the Mekong River in an Giang Province, Vietnam, Using a Hydro-Morphological Model with Gpu Computing. Water 2020, 12, 2912. [Google Scholar] [CrossRef]
  15. Bhattacharya, R.; Dolui, G.; Das Chatterjee, N. Effect of Instream Sand Mining on Hydraulic Variables of Bedload Transport and Channel Planform: An Alluvial Stream in South Bengal Basin, India. Environ. Earth Sci. 2019, 78, 303. [Google Scholar] [CrossRef]
  16. Vasilopoulos, G.; Quan, Q.L.; Parsons, D.R.; Darby, S.E.; Tri, V.P.D.; Hung, N.N.; Haigh, I.D.; Voepel, H.E.; Nicholas, A.P.; Aalto, R. Establishing Sustainable Sediment Budgets Is Critical for Climate-Resilient Mega-Deltas. Environ. Res. Lett. 2021, 16, 064089. [Google Scholar] [CrossRef]
  17. Eslami, S.; Hoekstra, P.; Nguyen Trung, N.; Ahmed Kantoush, S.; Van Binh, D.; Duc Dung, D.; Tran Quang, T.; van der Vegt, M. Tidal Amplification and Salt Intrusion in the Mekong Delta Driven by Anthropogenic Sediment Starvation. Sci. Rep. 2019, 9, 18746. [Google Scholar] [CrossRef]
  18. Julien, P.Y.; Vensel, C.W. Review of Sedimentation Issues on the Mississippi River. 2005. Available online: https://www.engr.colostate.edu/~pierre/ce_old/Projects/Rising%20Stars%20Website/Vensel-Mississippi-05.pdf (accessed on 30 June 2023).
  19. Förstner, U.; Owens, P.N. Sediment Quantity and Quality Issues in River Basins. In Sediment Dynamics and Pollutant Mobility in Rivers; Westrich, B., Förstner, U., Eds.; Springer: Berlin/Heidelberg, Germany, 2007; pp. 1–34. [Google Scholar]
  20. Bailey, S.E.; Estes, T.J.; Schroeder, P.R.; Myers, T.E.; Rosati, J.D.; Welp, T.L.; Lee, L.T.; Gwin, W.V.; Averett, D.E. Sustainable Confined Disposal Facilities for Long-Term Management of Dredged Material; Engineer Research and Development Center: Vicksburg, MS, USA, 2010; 23p. [Google Scholar]
  21. Vogt, C.; Hartman, G. Dredging Practices and Environmental Considerations BT—Encyclopedia of Sustainability Science and Technology; Meyers, R.A., Ed.; Springer: New York, NY, USA, 2017; pp. 1–28. ISBN 978-1-4939-2493-6. [Google Scholar]
  22. Owens, P.N. Conceptual Models and Budgets for Sediment Management at the River Basin Scale. J. Soils Sediments 2005, 5, 201–212. [Google Scholar] [CrossRef]
  23. Milliman, J.D.; Syvitski, J.P.M. Geomorphic/Tectonic Control of Sediment Discharge to the Ocean: The Importance of Small Mountainous Rivers. J. Geol. 1992, 100, 525–544. [Google Scholar] [CrossRef]
  24. Higgitt, D.L. Large Rivers and Sediment Cascades: Connectivity and Discontinuity. Int. J. Eros. Control Eng. 2012, 5, 9–15. [Google Scholar] [CrossRef]
  25. Sinha, R.; Gupta, A.; Mishra, K.; Tripathi, S.; Nepal, S.; Wahid, S.M.; Swarnkar, S. Basin-Scale Hydrology and Sediment Dynamics of the Kosi River in the Himalayan Foreland. J. Hydrol. 2019, 570, 156–166. [Google Scholar] [CrossRef]
  26. Sinha, R.; Sripriyanka, K.; Jain, V.; Mukul, M. Avulsion Threshold and Planform Dynamics of the Kosi River in North Bihar (India) and Nepal: A GIS Framework. Geomorphology 2014, 216, 157–170. [Google Scholar] [CrossRef]
  27. Mishra, K.; Sinha, R.; Jain, V.; Nepal, S.; Uddin, K. Towards the Assessment of Sediment Connectivity in a Large Himalayan River Basin. Sci. Total Environ. 2019, 661, 251–265. [Google Scholar] [CrossRef] [PubMed]
  28. Mishra, D.K. The Kosi and the Embankment Story. Econ. Polit. Wkly. 2008, 43, 47–52. [Google Scholar]
  29. Sinha, R. The Great Avulsion of Kosi on 18 August 2008. Curr. Sci. 2009, 97, 429–433. [Google Scholar]
  30. Sinha, R.; Singh, S.; Mishra, K.; Swarnkar, S. Channel Morphodynamics and Sediment Budget of the Lower Ganga River Using a Hydrogeomorphological Approach. Earth Surf. Process. Landf. 2023, 48, 14–33. [Google Scholar] [CrossRef]
  31. Jenks, G.F.; Caspall, F.C. Error on Choroplethic Maps: Definition, Measurement, Reduction. Ann. Assoc. Am. Geogr. 1971, 61, 217–244. [Google Scholar] [CrossRef]
  32. Coulson, M.R.C. In the Matter of Class Intervals for Choropleth Maps: With Particular Reference to The Work of George F Jenks. Cartogr. Int. J. Geogr. Inf. Geovisualization 1987, 24, 16–39. [Google Scholar] [CrossRef]
  33. Weihrich, H. The TOWS Matrix A Tool for Situational Analysis. Long Range Plan. 1982, 15, 54–66. [Google Scholar] [CrossRef]
  34. Lynch, R. Strategic Management; Pearson Education Limited: Harlow, UK, 2009. [Google Scholar]
  35. Yüksel, I. Developing a Multi-Criteria Decision Making Model for PESTEL Analysis. Int. J. Bus. Manag. 2012, 7, 52–66. [Google Scholar] [CrossRef]
  36. Issa, T.; Chang, A.P.V.; Issa, T. Sustainable Business Strategies and PESTEL Framework. GSTF Int. J. Comput. 2010, 1, 73–80. [Google Scholar] [CrossRef]
  37. Song, J.; Sun, Y.; Jin, L. PESTEL Analysis of the Development of the Waste-to-Energy Incineration Industry in China. Renew. Sustain. Energy Rev. 2017, 80, 276–289. [Google Scholar] [CrossRef]
  38. Sinha, R.; Gaurav, K.; Mishra, K.; Gupta, S. The Kosi Megafan, India. In Fluvial Megafans on Earth and Mars; Cambridge University Press: Cambridge, UK, 2023; pp. 202–218. [Google Scholar]
  39. Sinha, R.; Jain, V. Flood Hazards of North Bihar Rivers. Indo-Gangetic Plains. Mem. Geol. Soc. India 1998, 41, 27–52. [Google Scholar]
  40. Bhatt, C.M.; Gupta, A.; Roy, A.; Dalal, P.; Chauhan, P. Geospatial Analysis of September, 2019 Floods in the Lower Gangetic Plains of Bihar Using Multi-Temporal Satellites and River Gauge Data. Geomat. Nat. Hazards Risk 2021, 12, 84–102. [Google Scholar] [CrossRef]
  41. Mishra, K.; Sinha, R. Flood Risk Assessment in the Kosi Megafan Using Multi-Criteria Decision Analysis: A Hydro-Geomorphic Approach. Geomorphology 2020, 350, 106861. [Google Scholar] [CrossRef]
Figure 1. (a) Study area of the Kosi River between Chatara and its final confluence with the Ganga River at Dumariaghat using satellite images. (b) Average sediment load of the Kosi River at different hydrological stations along with the contributions from tributaries. The hydrological stations along the Kosi are marked as asterisks (*). The river was divided into 37 reaches for computing silt volume.
Sustainability 15 14952 g001
Figure 2. Value chain models for monetizing silt: (a) Flow chart showing the methodology followed for computing sediment budget; (b) Value Chain—Model A (major activities of dredging and storing to be done by the government and then the silt/sand to be sold/auctioned to private players); (c) Value Chain—Model B (directly licensing the entire process of model A to a private player).
Sustainability 15 14952 g002
Figure 3. Planform mapping of the Kosi River between Chatara and its final confluence with the Ganga River at Dumariaghat using satellite images covering the period 1972–2016.
Sustainability 15 14952 g003
Figure 4. (a) Reach-wise plot of channel area and bar area for different years during the period 1972–2016 (note the sharp rise in the bar area downstream of the barrage), (b) reach-wise plot of BA/CA ratio for different years, highlighting the hotpots of siltation (shown as rectangles), (c) histogram showing the natural Jenks method applied to the BA/CA values for hotspot classification, (d) hotspots of siltation along the Kosi River. The recent breaches in the embankment have also been plotted and marked as asterisks (*). Location and years of the breaches are marked by roman numerals. (i) Dalwa 1963, (ii) Kunauli 1967, (iii) Jamalpur 1968, (iv) Bhatania 1972, (v) Bahurawa 1980, (vi) Navhatta 1984, (vii) Ghoghepur 1987, (viii) Joginia 1991, (ix) Kusaha 2008. Several of them coincide with the location of moderate to high hotspots of siltation.
Sustainability 15 14952 g004
Figure 5. (a) Representative planform map of the Lower Kosi reach (Year 2016), showing the spatial distribution of the active bars and alluvial islands, used for the calculation of the reach-wise sediment accumulation during the period 1972–2016, (b) reach-wise plot of extractable sediment volume computed from planform analysis. We estimate that a total of 279 × 103 m3 and 835 × 103 m3 of sediments have accumulated in Chatara–Birpur and Birpur–Baltara stretch, respectively, during 1974–2016.
Sustainability 15 14952 g005
Figure 6. Infographics showing the steps involved in developing a sediment management framework and silt utilization plan for the Kosi River basin.
Sustainability 15 14952 g006
Figure 7. Proposed sediment management framework for the Kosi River basin.
Sustainability 15 14952 g007
Table 1. Criteria for shortlisting the necessary solutions needed for large-scale study.
CriteriaDescriptionRelative
Importance
Scale of silt that can be utilizedThis is perhaps the most important factor to determine the best solution due to the alarming problem of rising sedimentation levels. This involves the quantity of silt that can be used in the solution.Very High
Social impact/non-financial benefitsThis analysis involves the social and economic impact of the use of silt. Since the aim of the government is social well-being, this has been given high priority. High
Non-requirement of further technical studiesSolutions, which have a proven research/case study available, can be executed on a large scale faster and in a more organized manner Medium
Ease of land identificationIdentification and availability of land is an important aspect in executing any solution since the quantum of silt to be managed is quite high. The ease in which land can be identified or the solution where much land space is not necessary, the execution of the solution becomes easier and faster.Medium
Whether recurring or one timeA recurring activity ensures utilization of silt that gets added every year. A one-time solution may give only temporary relief, but the problem will persist after a few years.Medium
Potential cost savingsActivities that involve a lower cost or saves cost on dredging/utilizing/alternate material are preferredLow
Table 2. Sediment budgeting in the Kosi River between Chatara, Birpur, and Baltara.
ParametersChatara BirpurBirpur–Baltara
Hydrological budgeting
Av sediment load accommodated between stations (Mt/year)2053
Total sediment deposited in 54 years (Mt)10802862
Channel belt area/depositional area (km)142507
Sediment thickness (m)2.872.13
Total sediment volume accumulated in 54 years (106 m3)4081080
Planform approach
Total bar area (km2)97.2392.0
Average bar height (m)2.872.13
Total extractable sediment volume (106 m3)279835
Annual extractable sediment volume (106 m3)5.1615.46
Table 3. Demand assessment of silt for Solution 1 (for 5 years).
Road Backfilling
ParticularsNational
Highways
State Highways and
Major District Roads
Rural Roads and Minor District Roads
Expected new constructions (A)9040.21312.09
Volume of silt per km (B)4500 m33150 m32475 m3
Total volume of silt utilization (A) × (B)405,000 m3126,662 m3772,423 m3
Total volume of silt1,304,085 m3 (5 Years)
260,817 m3 (Annual)
Quantum of investment requiredTotal working capital investment of the industry = Direct cost value of 1-month silt productionRs 282.67 × 21,735 m3
=Rs 6,143,832 (Rs 6.1 million)
Total project cost of the industry
= Storage requirements (in m3) × Storage-project cost/m3
=65,204 × 150
=Rs 9,780,600 (Rs 9.8 million)
Backfilling for Building Houses
ParticularsSaharsaSupaul
No. of households (A)368,979443,073
Average population growth rate (B)2.33%2.55%
Silt usage for filling 1 house of
approx. 500 sq. ft. (C)
38.23 m338.23 m3
Volume of silt utilization for 5 years
(A) × (B) × (C) × 5
16,43,356 m321,59,681 m3
Total volume of silt 3,803,037 m3 (5 Years)
760,607 m3 (Annual)
Quantum of investment requiredTotal working capital investment of the industry = Direct cost value of 1-month silt production=Rs 282.67 × 63,384 m3
=Rs 179,16,755 (Rs. 17.9 million)
Total project cost of the industry = Storage requirements (in m3) × Storage-project cost / m3=190,152 × 1353
=Rs 28,522,800 (Rs. 28.5 million)
Habitat Island Filling (for 5 Years)
ParticularsFigures
Population inside embankment (A)52,115
Area required by 1 person in rural area in sq. ft (B)103
Total area of island in sq. ft (C) = (A) × (B)5,367,845
Total area of island in sq. meter (D)498,689
Height of silt utilized in island in meters (E)1.5
Total volume of silt utilization in cubic meters (D) × (E)748,033.50
Table 4. General financial analysis of the projects.
ParticularsRoad BackfillingBackfilling for Building of HousesBuilding Road on EmbankmentImplication
Initial investment~Rs 15.92 million~Rs 46.35 millionNilInitial CAPEX funding of the project
Annual volume of silt utilized2,60,817 m37,60,607 m364,350 m3Shows the quantity of silt dredged and utilized p.a.
Annual value of silt utilized commercially~Rs 81.9 million~Rs 238.8 million~Rs 15.2 millionShows the market value of silt used for commercial purpose p.a.
Annual net benefits~Rs 3.66 million~Rs 10.68 million~Rs 1.003 millionYearly revenue plus savings minus cost of the industry
Period of forecasting10 years10 years10 yearsDuration of the estimation
Residual value at the end of the period~Rs 6.14 million~Rs 17.92 million Working capital released plus terminal value of the project
IRR of the project24.44%24.44% Internal rate of return generated by the industry
NPV of the project~Rs 6.2 million~Rs 18.1 million Net present value of the industry
Payback period of the project4.05 years4.05 years No. of years to recover the initial investment
Investment modelModel BModel BModel AModel of implementation (Model A or B)
Table 5. Demand assessment for silt for Solution 2 (embankments).
ParticularsFigures
Raising height of embankment (for 10 years)
Length of Kosi River in red hotspots in meters (A)75,880
Width of embankment in meters (B)6
Height of embankment in meters (C)2
Total volume of raised embankment m3 (D) = (A) × (B) × (C)910,560
% Silt usage in embankment (E)70
Total volume of silt utilization in m3 (D) × (E) for 10 years 637,392
Annual volume of silt utilization in m363,739
Grand total cost of silt to be utilized in next 10 years (using dredging cost of Rs 200/m3 and construction cost of Rs 219/m3)Rs 267.06 million
Annual Grand Total cost of silt to be utilizedRs 26.71 million
Building road on embankment (for 10 years)
Length of Kosi River in Bihar (A)260 km
Volume of silt per km (village road) (B)2475 m3
Total volume of silt utilization for next 10 years (A) × (B) 643,500 m3
Annual grand total volume of silt utilization64,350 m3
Table 6. Major findings of SWOT analysis.
StrengthWeaknessOpportunitiesThreats
  • Abundance of silt can be considered a valuable resource for several solutions.
  • Annual addition of silt every year can also be utilized as a free natural resource.
  • The quality of the silt is suitable for direct use in backfilling purposes.
  • Due to the multipurpose use of silt, its use can be regularized.
  • The regular use of silt will lead to desiltation effort, leading to automatic river augmentation for the maintenance of river flow preventing flood.
  • Kosi silt is a weak base material; it needs other material for providing additional strength.
  • Until now, it has not been accepted or used by any industry and considerable efforts are needed from the government to propagate the usage of silt.
  • The extraction of silt is an expensive process, hence making transport or delivery over long distances or use in long-distance works unviable.
  • Stocking/stacking or availability of land for storing the extracted silt is a huge concern.
  • Efficient transportation options through waterways will provide more financial feasibility/viability.
  • Building all-weather roads on the embankment can enhance economic development and reduce time for reaching health facilities, schools, markets, etc. and by linking villages near the embankment with main towns. This will in general improve the livelihood of the community.
  • Use of silt in infrastructure development can prove to be a huge potential for economic development.
  • National Green Tribunal (NGT)/Government of Bihar (GoB) show their willingness towards silt management and solving the issues of flooding.
  • Silt utilization will assist in environmental protection and can be used as a cost-effective alternative in several activities.
  • Threats include relevant permissions and policy changes towards implementation of specific solutions as above not being granted by the govt. or a considerable time delay in the implementation of policy changes.
  • Since the solutions involve coordination between various government agencies and departments, the lack of harmonization between them could result in no responsibility and accountability.
  • Availability of low-cost conventional materials could render the use of Kosi silt unviable.
  • Many solutions are quite new and untested on a large scale; the technical feasibility of some is still unproven.
  • Many locals consider the silt to be used free-of-cost and the pricing of the silt might prove to be a prohibitive cost and result in resistance to acceptance by the locals and their willingness to pay for silt as a resource.
Table 7. Major findings of PEST-EL analysis.
Political AspectsEconomic Aspects
  • The relevant demand for silt can be created only if there are suitable policy changes by the government or a policy framework around silt management can be put in place to ensure uptake of silt.
  • To execute these projects successfully, continuous involvement and collaboration amongst all the relevant government departments are necessary.
  • Implementation of the plan will need separate allocation of funds.
  • A change in government and/or government policies may affect the implementation of the plan. Hence, relevant mechanisms should be put in place beforehand to ensure that implementation does not get hindered due to these changes.
  • The river Kosi, known as the river of sorrow, can become the river of opportunity by implementing integrated silt management techniques.
  • With a better flow of rivers and more inland ports, there will be better waterways transportation and connectivity, hence leading to economic growth.
  • There is also a potential for an increase in tourism, fisheries, and local transportation.
  • There could be economic growth and development of society as a result of government spending in the area towards the implementation of solutions and protection from floods.
  • Effective flood management and protection, resulting in savings.
  • An increase in industrialization can improve the standard of living, employment, etc.
  • Potential cost savings on the usage of silt as a free resource may allow the govt. funds to be used effectively in other high-priority areas
Social aspectsTechnological aspects
  • Implementation of relevant solutions can result in a decrease in loss of life with proper flood management in place.
  • Increase in standard of living due to fewer damages and increase in economic development.
  • Decline in migration will reduce the burden on developed cities within Bihar.
  • There will be an increase in livelihood opportunities.
  • There could be challenges faced by the local population in implementing new technologies.
  • Indirect benefits to communities in availing services by reducing time in reaching health facilities, schools, markets etc.
  • Unproven technology, i.e., the requirement of further technical studies and laboratory testing required.
  • Technical challenges around the usage of silt due to its weak strength.
  • Detailed mineral mapping study is required for analyzing silt mineral properties.
  • Testing of silt quality at various zones along the river is required for proper utilization of the silt.
  • Natural flushing to be revived as a long-term solution.
  • Early warning systems and flood forecasting systems to be put in place and required to avoid losses in extreme weather conditions.
Environmental aspectsLegal aspects
  • There is potential for environmental protection by saving loss of life, agricultural lands etc.
  • EIA/ESIA studies & clearances are required for various implementing various solutions.
  • Afforestation activities are required.
  • Biodiversity protection is a major concern.
  • Various permissions are required for smoother implementation of the projects from different departments such as Water Resources, Public Works, Community/GP, Mines and Minerals, and Forest.
  • Coordination with various departments and stakeholders is required.
  • Environment plan and sediment policy plan need to be framed and implemented.
  • Different central and state committees need to be involved.
  • Legal negotiations with Nepal to set up new agreements for managing river flow issues could be a challenge.
  • Separate team/steering committee to be formed to undertake Kosi Silt Management.
Table 8. Strategic roadmap and key recommendations.
PhaseTime PeriodFactors
Short-term Recommendations1–2 years
  • Need to set up a steering committee comprising representations from (a) the government of India, and (b) various department heads of the government of Bihar.
  • Need to change policy to incorporate mandatory use of silt for construction purposes.
  • Co-ordination with Nepal to set up a committee (Kosi River Basin Authority)
  • Need to allocate funds for rolling out the proposed solutions.
Medium-term Recommendations3–5 years
  • Engage with industry associations to submit detailed project reports of the various proposed solutions.
  • Conduct environmental feasibility study of construction of roads on embankment.
  • Identify land spots for creating warehouses for silt.
  • Identify land spots and other low-lying areas for creating habitat islands and filling.
  • Identify areas of Kosi River embankment which needs fencing.
Long-term Recommendations6–10 years
  • Design implementation model and perform detailed assessment of various costs for filling low-lying areas agriculture fields and other public areas.
  • Mineral mapping should be done on the entire stretch of Kosi embankment to identify mineral value of different areas of silt.
  • Perform detailed lab studies and pilot studies on use of Silt for industrial purposes like bricks, ceramics, and cement.
  • Identify areas for landscaping and tourism.
  • Developing inland waterways system in line with the National Waterways Act, 2016,
Disclaimer/Publisher’s Note: The statements, opinions and data contained in all publications are solely those of the individual author(s) and contributor(s) and not of MDPI and/or the editor(s). MDPI and/or the editor(s) disclaim responsibility for any injury to people or property resulting from any ideas, methods, instructions or products referred to in the content.

