1. Introduction
The Republic of Sudan is one of the largest countries in Africa, boasting diverse natural resources but grappling with an electricity supply shortage. Sudan covers a vast area of 1.9 million km
2 and experiences an average population growth rate of 2.53% per year [
1]. The country possesses abundant surface and groundwater resources, complemented by fertile arable lands, which has led to a heavy reliance on agriculture as the cornerstone of its economy [
2]. However, despite these bountiful natural resources, Sudan faces a significant deficit in power generation, with approximately 70% of its population lacking access to electricity [
3]. The imperative for sustainable power generation in Sudan is paramount, marked by formidable economic, environmental, and social challenges. A combination of a low electricity tariff and persistent domestic inflation has had a detrimental impact on revenues. At the same time, thermal power generation, which is reliant on imported fuel oil, exerts adverse pressure on operational costs and greenhouse gas (GHG) emissions. The secession of South Sudan in 2011 further exacerbated the power supply predicament, resulting in the loss of 75% of oil reserves, 60% of biomass resources, and 25% of hydroelectricity potential [
4]. Moreover, subsidized electricity benefits only a limited, affluent sector of the urban population, leaving less fortunate yet productive rural communities underserved [
5].
Thermal and hydroelectric power generation currently meet Sudan’s electricity demand. As of 2018, the total installed capacity in Sudan stood at 3500 MW, with 52% coming from thermal sources and 48% from hydroelectric resources [
5]. Sudan has significant potential for developing renewable energy pathways, which could gradually replace conventional energy sources [
6]. The country has abundant renewable energy resources such as solar, wind, hydropower, biomass, and geothermal, which could be harnessed to facilitate more sustainable power generation [
7]. Notably, studies have explored the industrial applications of solar thermal systems in Sudan, revealing their reliability and economic viability [
8]. Solar–photovoltaic and wind energy systems are increasingly becoming part of the power generation mix in response to global pressure to reduce GHG emissions [
9]. In certain northern and western regions of Sudan, wind speeds are sufficient for power generation [
10], although they pose challenges related to wind power fluctuations [
11]. Sudan, primarily an agricultural country, relies on biomass, including wood fuel, agricultural residues, and animal waste, to meet over 80% of its energy needs [
12]. The construction of new dams for hydroelectric power plants in Sudan is challenging due to several hurdles, including political conflicts, the search for suitable locations, and social resistance due to the adverse impact on land, such as the submergence of villages and loss of property [
13]. Attempting to resolve these social conflicts by insisting on building new dams would increase the cost of power generation through this pathway. Renewably based power generation pathways in Sudan, aside from hydroelectricity, have the potential to mitigate GHG emissions but come with varying impacts on water, land, and generation costs. Sudan faces a significant challenge in sustainably bridging the substantial gap between power demand and supply. Given the trade-offs between its different facets, achieving sustainability in power generation is intricate. Evaluating sustainability via supportive tools, such as developing sustainability indicators and life cycle assessments (LCAs), can address this complexity and provide more precise and indicative results for policy-makers and decision-makers. The availability of resources plays a central role in assessing the sustainability of power generation [
14].
An integrated LCA study conducted in Turkey concluded that hydropower, geothermal, and wind are the most sustainable power generation pathways [
15]. Similarly, an LCA scenario-based sustainability assessment of electricity generation in the UK, covering the time horizon up to 2070, found that nuclear and renewable energy are the best pathways to meet demand [
16]. In the case of Pakistan’s off-grid communities, the solar–photovoltaic pathway is considered the most sustainable, followed by biomass, solar thermal, and wind energy, as determined via environmental, social, technical, and economic indicators [
17]. Despite the dominance of fossil fuel-based power generation, the research community continues to emphasize the high potential of renewable energy sources in bridging the supply–demand gap and mitigating GHG emissions [
18]. The integration of renewable energy into the power generation mix should be accompanied by the minimization of generation costs to enhance sustainability and competitiveness with low-cost fossil fuel-based power generation [
19,
20,
21]. In conclusion, transitioning to renewable energy pathways is essential for achieving sustainable power generation [
22].
According to the Regulatory Indicators for Sustainable Energy (RISE), Sudan is ranked 120th out of 148 countries, scoring 30, while the world average is 48 [
23]. Achieving sustainability in power generation in Sudan requires a diverse generation mix that combines conventional and clean energy pathways. Advanced and efficient fossil fuel-based power generation pathways are evolving to compete for feasibility and GHG mitigation. Among these technologies, natural gas combined cycle (NGCC) and ultra-supercritical pulverized coal power plants are considered advanced pathways that offer lower costs and improved GHG emissions, making them strong contenders alongside renewable energy pathways [
24]. A comprehensive assessment of a sustainable generation mix, composed of conventional and clean energy pathways, should consider sustainability indicators that reflect the impacts on water, air, land, and generation costs [
25]. This holistic approach is essential for making informed decisions about Sudan’s most sustainable and economically viable energy generation options.
Most earlier studies on power generation in Sudan have primarily focused on the technical aspects and evaluating the availability of resources. For instance, Alvi and Elagib [
26] developed models correlating global solar radiation and bright sunshine duration in Sudan. Elagib and Mansell [
27] estimated monthly global solar radiation levels across the country. Omer [
28] evaluated Sudan’s wind speed, horizontal solar radiation, and sunshine duration. Some studies have even compared actual measured data with estimated values for global horizontal and diffuse solar radiations in Sudan, revealing an accuracy of less than 8% [
29]. In another study, empirical horizontal diffuse solar radiation in Shambat, Sudan was compared with developed correlations, achieving an accuracy range of 9% to 17% [
30]. However, comprehensive sustainability studies integrating quantitative analyses of environmental, economic, and social impacts have been relatively scarce. The notable contribution of the current research to the field lies in its integration of quantitative assessments of power generation’s effects on natural resources (water and land), greenhouse gas emissions, and the levelized cost of electricity (LCOE). The outcome of this integration is the rational scenario, which serves as a blueprint for managing Sudan’s natural resources to achieve sustainable power generation. The primary goal of this paper is to guide the management of natural resources towards more sustainable power generation, effectively meeting Sudan’s electricity demand. This study uses an optimization model to identify sustainable pathways and provide the exact generation from each pathway in the optimum zone through predetermined constraints.
The key objectives of the current study are to:
Determine the most sustainable power generation pathways to meet the electricity demand in Sudan in different scenarios and cases, considering the integrated quantitative impacts on water, land, air, and LCOE.
Identify the most cost-effective (CEF) scenario pathways based on the lowest LCOE, abundant natural resources, and uncontrolled GHG emissions.
Identify the pathways for the most resource- and GHG emission-effective (RGEF) scenario based on the minimum possible use of natural resources, the lowest possible GHG emissions, and the lowest possible LCOE.
Identify the pathways for the stringent (STR) scenario based on the abundant availability of natural resources and a constant value of GHG emissions not to exceed a certain level throughout different values of electricity demand.
Investigate and optimize the sustainability of the pathways selected for the government and lowest-cost proposals, which serve as business-as-usual cases.
Conduct sensitivity analysis to assess the potential contribution of each clean energy pathway to total power generation in Sudan when LCOE is minimized under the same constraints as the STR scenario.
Develop a rational (RAT) scenario based on the existing operating pathways for power generation in Sudan, aiming to enhance reliability and address any shortcomings observed in the conducted scenarios and cases.
2. Methods
In this study, specific power generation pathways are formulated for Sudan, with each pathway being associated with a set of quantitative sustainability indicators.
Figure 1 illustrates the methodology flow of the present study. These sustainability indicators have been compiled from the existing literature and encompass the impacts per functional unit of power generation, which is one megawatt–hour (MWh). The indicators are designed to assess the effects of power generation on water, generation cost, greenhouse gas (GHG) emissions, and land. The sustainability framework in this study encompasses five key indicators, each serving as a critical assessment factor for evaluating the impact of power generation on natural resources (water and land), GHG emissions, generation cost, and electricity demand. These assigned sustainability indicators include water consumption (m
3/MWh), water withdrawals (m
3/MWh), LCOE (USD/MWh), GHG emissions (kg of CO
2 eq./MWh), and land use (m
2/MWh). To address these sustainability considerations, an optimization model based on linear programming was adopted from a previous study conducted by the author [
25]. This model was initially designed and executed to assess the sustainability of power generation in Alberta, Canada. The model has been adapted for the current study focusing on Sudan’s power generation. It operates under constraints related to the availability of natural resources (water and land), GHG emissions, and total electricity demand. The objective function of the model is to minimize the total cost of electricity generation. The model’s output is intended to determine the optimal generation mix for Sudan within the sustainable range. The optimization model is governed by six equations to be solved simultaneously for the power generation (X
i) from each pathway in the optimum zone. The objective function is the minimum possible value of the total generation cost (TC) resulting from the summation of each pathway (i):
(n) is the total number of the considered pathways.
(TP) is the total power generation.
(C
i) is the water consumption indicator, and (TWAC) is the total water consumption.
(W
i) is the water withdrawals indicator, and (TWAW) is the total water withdrawals.
(E
i) is the emission indicator, and (TCOE) is the total amount of equivalent carbon dioxide emitted.
(Li) is the land use indicator, and (TLAA) is the total land area available.
Three scenarios, namely the CEF (cost-effective), RGEF (resource and GHG emission-effective), and STR (stringent), are considered in this study, each with distinct constraints and assumptions. The CEF scenario primarily focuses on identifying power generation pathways with the lowest cost. It emphasizes pathways with abundant natural resource availability and does not impose strict controls on GHG emissions. The RGEF scenario is designed to achieve multiple objectives. It aims to minimize the use of natural resources, reduce GHG emissions to the lowest feasible levels, and maintain a reasonable level of generation cost. It seeks to strike a balance between these factors. The STR scenario is conducted with the stringent constraint of maintaining GHG emissions at a constant level, regardless of variations in electricity demand. This scenario operates under the assumption of abundant natural resource availability but places a strict cap on GHG emissions to ensure environmental sustainability. A business-as-usual case is investigated in this study via the governmental (GPL) and the least cost (LPL) plans [
5]. In the current study, these two plans were optimized for sustainability through the model, resulting in the two new governmental optimized plan (GPLO) and the least-cost optimized plan (LPLO) cases, respectively. The concept is to cover the same electricity demand with the same constraints of natural resources used, GHG emitted, and the lowest possible LCOE.
Sensitivity analysis examines the effect of LCOE for each clean energy pathway on its contribution to Sudan’s total required power generation. A higher level of participation in this analysis suggests that each respective pathway is more sensitive to changes in generation costs. Clean energy pathways were chosen for this analysis due to their adaptability to fluctuations in LCOE, particularly since many of these technologies continually evolve via research and development efforts. Finally, a concluded RAT scenario was developed in the present study by logically refining the outcomes of all the previously conducted scenarios and cases, aiming to create a more sustainable generation mix for Sudan.
3. Input Data and Assumptions
In this paper, thirteen power generation pathways have been selected (as detailed in
Table 1) following careful sorting and refining, considering their availability and suitability for the conditions in Sudan. It is worth noting that the production of natural gas and coal in Sudan remains very limited, so the assumption that these fossil fuels would be imported has been made for this study. Cogeneration technology utilizing natural gas, which is not commonly used in Sudan, has been excluded from the list of power generation pathways. Sudan currently operates NGCC, coke, and fuel oil-fired power plants, which are assumed to utilize once-through cooling systems due to the country’s abundant water resources. For new coal power plants in Sudan, ultra-supercritical technology with cooling towers is considered due to its efficiency, environmental cleanliness, and reasonable LCOE compared to other fossil fuel pathways [
31]. It is also worth mentioning that the government of Sudan has expressed its commitment to developing nuclear energy and has reviewed the necessary infrastructure for incorporating this power generation pathway [
32].
In this study, the electricity demand side is assumed to encompass transmission and distribution losses. To provide context, the total electricity generation within Sudan in 2014 amounted to 11,380 gigawatt–hours (GWh), with an additional 469 GWh imported from external sources [
33]. Subsequently, the demand profile was 10,581 GWh in 2015, 11,798 GWh in 2016, and 12,987 GWh in 2017, reflecting an annual growth rate of 11% between 2013 and 2017 [
5]. To account for future electricity demand in Sudan, this study considers a range spanning 10,000 to 150,000 GWh annually. With an assumed annual growth rate of 10%, this range is projected to cover Sudan’s electricity demand up to 2040.
Table 1.
Sustainability indicators for power generation pathways in Sudan.
Table 1.
Sustainability indicators for power generation pathways in Sudan.
| No. | Pathway | Water Consumption (m3/MWh) | Water Withdrawals (m3/MWh) | LCOE (USD/MWh) | GHG Emissions (kg of CO2 eq. /MWh) | Land Use (m2/MWh) |
|---|
| 1 | NGCC—once-through cooling a | 0.36 | 40.79 | 52.43 | 313 | 0.006 |
| 2 | Coal—ultra-supercritical; cooling towers a | 1.26 | 1.58 | 47.50 | 796 | 0.016 |
| 3 | Coal—subcritical; once-through cooling a | 1.24 | 116.48 | 51.54 | 1024 | 0.021 |
| 4 | Coke—once-through cooling b | 1.24 | 116.48 | 42.89 | 1024 | 0.021 |
| 5 | Fuel oil—once-through cooling c | 1.24 | 116.48 | 200.00 | 1024 | 0.021 |
| 6 | Hydroelectricity d | 68.18 | 68.18 | 57.90 | 21 | 7.76 |
| 7 | Wind d | 0.005 | 0.1 | 72.38 | 51 | 2.24 |
| 8 | Biomass—direct combustion; steam cycle; once-through cooling d | 673.49 | 799.49 | 57.90 | −410 | 467.49 |
| 9 | Biomass—bio-oil; steam cycle; once-through cooling d | 825.03 | 951.01 | 158.60 | −1452 | 692.35 |
| 10 | Solar–photovoltaic—flat paneled e | 0.02 | 0.02 | 150.61 | 12 | 0.28 |
| 11 | Solar thermal—concentrating dish d | 0.63 | 0.63 | 272.94 | 154 | 0.21 |
| 12 | Nuclear—once-through cooling e | 1.52 | 178.03 | 55.80 | 24 | 0.08 |
| 13 | Import f | 0.00 | 0.00 | 100.00 | 0 | 0.00 |
The power generation mixes for GPL and the LPL are illustrated in
Figure 2a and
Figure 2b, respectively. According to these plans, Sudan’s total generation of 27,965 GWh is forecasted for 2023. In the LPL, there have been slight adjustments to the generation mix compared to the GPL. Specifically, the wind and solar–photovoltaic pathways have seen increases of 3.1% and 1%, respectively. Conversely, the higher-cost pathways involving imports, coal, and fuel oil have been reduced in the LPL by 0.5%, 0.9%, and 2.7%, respectively. As suggested by the World Bank, this shift aims to achieve the lowest possible power generation cost in Sudan [
5].
Table 2 provides a comprehensive overview of the constraints for this study’s various scenarios and cases. The CEF and STR scenarios primarily rely on the assumption of abundant water and land resources in Sudan while considering different GHG emissions levels. In the STR scenario, GHG emissions are held constant at 1.5 million tons of CO
2 equivalent per year (1.5 Mt of CO
2 eq./year) across varying electricity demand levels. On the other hand, the CEF scenario places a stronger emphasis on achieving the lowest generation cost, even if it means accepting higher GHG emissions. The RGEF scenario concerns minimum possible constraints for natural resource uses and GHG emissions. GPLO and LPLO cases are derived from the GPL and LPL cases, respectively, with a fixed demand point of 27,965 GWh/year. These cases utilize the expected natural resource availability and GHG emissions from the GPL and LPL cases as constraints that should not be exceeded. All the conducted scenarios and cases in this study are adjusted to minimize the LCOE to the greatest extent possible.
The LCOE for each examined clean energy pathway has been reduced to a minimum of 42.89 USD/MWh, equivalent to the LCOE of the coke-based power generation pathway (Pathway no. 4 in
Table 1). This sensitivity action helps study the effect of the LCOE variation on the power generation contribution of each clean energy pathway under consideration for Sudan. It is important to note that other constraints related to water, land, and greenhouse gas (GHG) emissions remain constant and consistent with the stringent scenario (as outlined in
Table 2).
Table 3 provides insight into the percentage reduction in LCOE for each clean energy pathway as a result of this sensitivity analysis.
4. Results and Discussion
The results obtained from the various scenarios and cases offer valuable insights into the most sustainable power generation pathways based on predefined quantitative constraints. These findings provide a foundation upon which logical concepts can be applied to inform decision-making toward achieving a more sustainable power generation mix. It is important to note that determining suitable constraints is site-specific, tailored to availability of natural resources and permissible greenhouse gas (GHG) emissions levels. Additionally, the electricity demand plays a pivotal role in determining the contribution of each pathway within the optimal range. This study section represents a scenario-based analysis of power generation sustainability in Sudan, incorporating quantitative evaluations. These results can be integrated with rational concepts to support informed and strategic decision-making for developing the country’s more sustainable and efficient power generation landscape.
4.1. Cost-Effective Scenario
The outcomes from the CEF scenario, as depicted in
Figure 3, are significantly influenced by the abundant availability of natural resources (water and land) and the relatively high permissible levels of GHG emissions. In the CEF scenario, the most sensitive factor driving the results is the LCOE. The optimization model selected coal-fired power generation using ultra-supercritical technology with cooling towers (pathway no. 2) and coke-based power generation utilizing once-through cooling systems (pathway no. 4), as indicated in
Table 1. These two pathways were identified as the optimal choices for meeting Sudan’s total electricity demand. They were selected primarily based on their low LCOE values (i.e., 47.50 and 42.89 USD/MWh, respectively). However, it is worth noting that these pathways exhibit the highest GHG emission indicators among all thirteen studied pathways for power generation in Sudan (i.e., 796 and 1024 kg of CO
2 equivalent per MWh, respectively). This demonstrates the trade-off between cost-effectiveness and GHG emissions, highlighting the challenge of balancing economic feasibility and environmental sustainability in Sudan’s power generation landscape under the CEF scenario.
Pathway no. 2, which involves coal-fired power generation using ultra-supercritical technology with cooling towers, has the fifth-highest water consumption indicator, the ninth-highest water withdrawals indicator, and the eleventh-highest land use indicator (see
Table 1). On the other hand, pathway no. 4, which involves coke-based power generation utilizing once-through cooling systems, exhibits the highest greenhouse gas (GHG) emissions indicator, as previously noted. Additionally, it ranks fourth in terms of water withdrawals, primarily due to the significant amounts of water required by power plants employing once-through cooling systems [
35]. The profile of power generation for the CEF scenario indicates that coke-based power generation using once-through cooling systems emerges as the primary pathway for meeting Sudan’s electricity demand due to its low LCOE. However, this choice comes with the trade-offs of higher GHG emissions and substantial water withdrawals, emphasizing the need to consider the environmental impacts when making power generation decisions carefully. Pathway no. 4 initially covers the entire electricity demand up to the annual demand point of 75 terawatt-hours (TWh). Beyond this point, pathway no. 2, coal-fired power generation with ultra-supercritical technology using cooling towers, starts contributing to the power generation mix. This transition occurs due to constraints on water withdrawals, limited to 8,400 million m
3. After reaching this threshold, the share of pathway no. 4 remains constant at 72 TWh/year, while pathway no. 2 gradually increases its contribution, ranging from 4% to 53% of the total electricity demand. The average LCOE (LCOE
AV) for the CEF scenario is calculated to be 43.64 USD/MWh, representing the cost-effectiveness of this power generation mix under the given constraints. This scenario demonstrates how different pathways are utilized to optimize power generation while adhering to water withdrawal limitations and minimizing costs.
As described, the results of the CEF scenario highlight specific challenges and limitations for Sudan’s power generation. Indeed, the reliance on coke-based power generation, primarily derived as a by-product of petroleum oil, poses a significant challenge, as this source is produced in limited quantities and is subject to uncertainty. Additionally, the constraints related to water withdrawals and GHG emissions further restrict the feasibility of the CEF scenario. Despite these limitations, the results obtained from the CEF scenario can serve as a valuable benchmark for comparisons with other scenarios and cases. They provide a baseline for assessing the trade-offs between cost-effectiveness, resource availability, and environmental impact in Sudan’s power generation landscape. This benchmark can be instrumental in guiding more reliable and sustainable future power generation strategies for the country.
4.2. Resource- and GHG Emission-Effective Scenario
In the RGEF scenario, the primary objective is to minimize the use of natural resources and achieve the lowest possible GHG emissions while still meeting Sudan’s electricity demand. Given these stringent constraints, LCOE may not be the primary focus. The results of the RGEF scenario in this study reveal that imported power generation (pathway no. 13) can fully satisfy Sudan’s total electricity demand under the tightest constraints, with a reasonable LCOEAV of 100 USD/MWh. It is important to note that this LCOEAV value is 2.29 times higher than the LCOEAV of the CEF scenario. This substantial difference in LCOEAV, which amounts to 56.36 USD/MWh, provides a valuable indication of the cost of avoiding using natural resources and GHG emissions in Sudan’s power generation landscape. It illustrates the trade-off between achieving stringent environmental goals and the associated cost implications. Indeed, while the RGEF scenario minimizes natural resource use and lowers GHG emissions, it relies heavily on importing electricity from other countries. This approach involves conducting all upstream power generation unit operations outside Sudan’s geographical boundary. Criticism of the RGEF scenario arises from recognizing that relying on electricity imports cannot reliably replace domestic power generation. Electricity is a sovereign commodity, and Sudan, like any other nation, may face challenges in fully complying with neighbouring countries’ volatile policies and conditions. This makes Sudan vulnerable to potential disruptions in the supply of imported electricity, which could impact the stability and reliability of its power grid. As such, while the RGEF scenario provides valuable insights into the environmental and resource-saving potential of importing electricity, Sudan must consider the practicality and security of relying on foreign sources when developing its long-term power generation strategies. Balancing sustainability with energy security is a complex challenge for many nations.
4.3. Stringent Scenario
Figure 4 shows the power generation pathways covering Sudan’s electricity demand within the STR scenario, where GHG emissions are constant at 1.5 Mt of CO
2 eq./year. Hydroelectricity (pathway no. 6) dominates the power generation mix in the optimum zone of the STR scenario. It covers a range of 0% to 99% of the annual electricity demand. Nuclear energy pathways cover an annual demand range of 30 to 105 TWh, with a share ranging from 0 to 91%. At higher yearly electricity demand levels exceeding 115 TWh, wind energy gradually replaces hydroelectricity, contributing a range of 6% to 37% of the total. This shift is due to water withdrawal scarcity, which represents a critical constraint. Biomass–direct combustion with steam cycle and once-through cooling (pathway no. 8) starts with more than 60% of the total generation as a GHG emission-mitigating pathway. However, this share decreases gradually to less than 1% at the annual demand point of 115 TWh. The availability of water withdrawals needed for biomass’s agricultural stage significantly influences the pathway no. 8 trend. Coke-based power generation using once-through cooling systems (pathway no. 4) contributes to a narrow range of annual electricity demand, from 10 to 25 TWh, with a corresponding share ranging from 39% to 4%. However, this pathway is notably absent from the generation profile of the STR scenario beyond this range. Constraints related to GHG emissions and water withdrawals are the primary reasons for its absence. These findings highlight the intricate relationship between power generation pathways, GHG emissions, and water resource constraints in Sudan’s quest for sustainable power generation. The mix of pathways varies depending on the annual electricity demand and the associated resource limitations.
The optimization model indicates that NGCC with once-through cooling systems (pathway no. 1) is within the optimum zone of the STR scenario at the annual demand point of 25 TWh. It significantly contributes up to 58% at this demand level but decreases to less than 1% when the demand point reaches 65 TWh. This reflects the sensitivity of pathway selection to both electricity demand and resource constraints. Biomass-based power generation using bio-oil with a steam cycle and once-through cooling (pathway no. 9) contributes slightly to the STR scenario generation, accounting for about 1% within the annual demand range of 110 to 150 TWh. The most sensitive constraints for the STR scenario are greenhouse gas (GHG) emissions and water withdrawals. The average levelized cost of electricity (LCOEAV) for the STR scenario is 57.60 USD/MWh. The dominant hydroelectricity pathway primarily influences this LCOEAV and is 32% higher than the corresponding LCOEAV for the CEF scenario. However, it is essential to recognize that the STR scenario faces a reliability challenge due to Sudan’s limited availability of hydroelectricity resources. The potential generation from hydroelectricity in Sudan is expected not to exceed 11.5 TWh in the best cases. At the same time, the STR scenario profile demands more than ten times this potential to be satisfied. This underscores the significant challenge of relying heavily on hydroelectricity to meet stringent sustainability goals in Sudan’s power generation landscape.
4.4. Comparative Assessment of the Scenarios
The LCOE trends of CEF, RGEF, and STR scenarios over the annual electricity demand in Sudan are shown in
Figure 5. The RGEF scenario exhibits the highest LCOE profile due to the dominant role of electricity importation (pathway no. 13) to mitigate GHG emissions and utilize minimum water and land natural resources. In contrast, the STR scenario relies on a mix of power generation pathways within Sudan (excluding the small share of biomass pathways). These pathways generally result in lower LCOEs compared to the importation of electricity, making the LCOE trend of the stringent scenario consistently lower than that of the RGEF scenario. The CEF scenario prioritizes minimizing the cost of power generation while assuming abundant resource availability and uncontrolled GHG emissions. As a result, the LCOE trend for this scenario is the lowest among the three scenarios.
These LCOE trends illustrate the trade-offs between cost-effectiveness, resource utilization, and GHG emission reduction in Sudan’s power generation scenarios. Each scenario represents a different approach to achieving sustainability, with varying implications for the cost of electricity.
Figure 6 provides a comprehensive view of the impacts of the three scenarios (CEF, RGEF, and STR) on the cost of power generation, GHG emissions, and use of natural resources, considering average values over the entire range of annual electricity demand in Sudan. The RGEF scenario excels in terms of GHG emissions reduction, water conservation, and land use efficiency. It achieves these environmental goals for 56.36 USD/MWh compared to the CEF scenario and 42.40 USD/MWh compared to the STR scenario. This indicates that achieving stringent environmental objectives in the RGEF scenario comes at a higher cost than the other scenarios. While performing well in terms of GHG emissions, the STR scenario significantly increases water consumption and withdrawals, as well as total land use. On average, it mitigates GHG emissions compared to the CEF scenario by 98%. However, it also leads to a more than 54-fold increase in water consumption, a more than 1.2-fold increase in water withdrawals, and a more than 1088-fold increase in total land use compared to the CEF scenario. These impacts highlight the challenges of relying heavily on hydroelectricity to achieve sustainability goals. Overall, the choice of scenario in Sudan’s power generation landscape involves complex trade-offs between cost-effectiveness, environmental conservation, and resource utilization. Each scenario reflects a different set of priorities and constraints, and the optimal choice depends on Sudan’s energy policy’s specific goals and considerations.
4.5. Government and Least Cost Cases
Table 4 presents the optimum power generation profiles for the studied cases, as determined by the constraints specified in
Table 2. The GPLO case profile shows more than 65% of generation comes from NGCC (pathway no. 1), more than 23% is from coke-fired (pathway no. 4), more than 9% is from nuclear energy (pathway no. 12), less than 1% is from direct combustion of biomass (pathway no. 8). All the selected pathways are with once-through cooling systems. The optimization model in the GPLO case increased generation via fossil fuel-based pathways while omitting the hydroelectricity portion used in the GPL case. This shift was made to reduce LCOE
AV by 48%, save water consumption by 81%, and simultaneously keep GHG emissions, water withdrawals, and land use within the maximum allowed constraints of 12.5 Mt of CO
2 eq./year, 2173 million m
3/year, and 90 million m
2, respectively (as specified in
Table 2). The same optimum pathways for GPLO are selected for LPLO with a slight increase of nuclear energy share by 4%, an increase of coke pathway share by 28%, and a decrease in NGCC pathway by 8%. This shift is due to the tighter GHG emissions constraints in the LPLO case (11.5 Mt of CO
2 eq./year) compared to the GPLO case (12.5 Mt of CO
2 eq./year).
The GHG emissions constraint for the LPLO is based on the LPL case, where additional renewable energy (solar and wind) and import pathways are introduced to replace a portion of the generation from fossil fuels (oil and coal). As a result, the LCOEAV of the LPLO compared to the LPL case is reduced by 46% (from 95.19 USD/MWh to 51.02 USD/MWh), and the corresponding save in the total water consumption is 81%. The GHG emissions, water withdrawals, and land use are fully utilized in the LPLO case with the maximum allowed constraints of 11.5 Mt of CO2 eq./year, 2054 million m3/year, and 92 million m2, respectively.
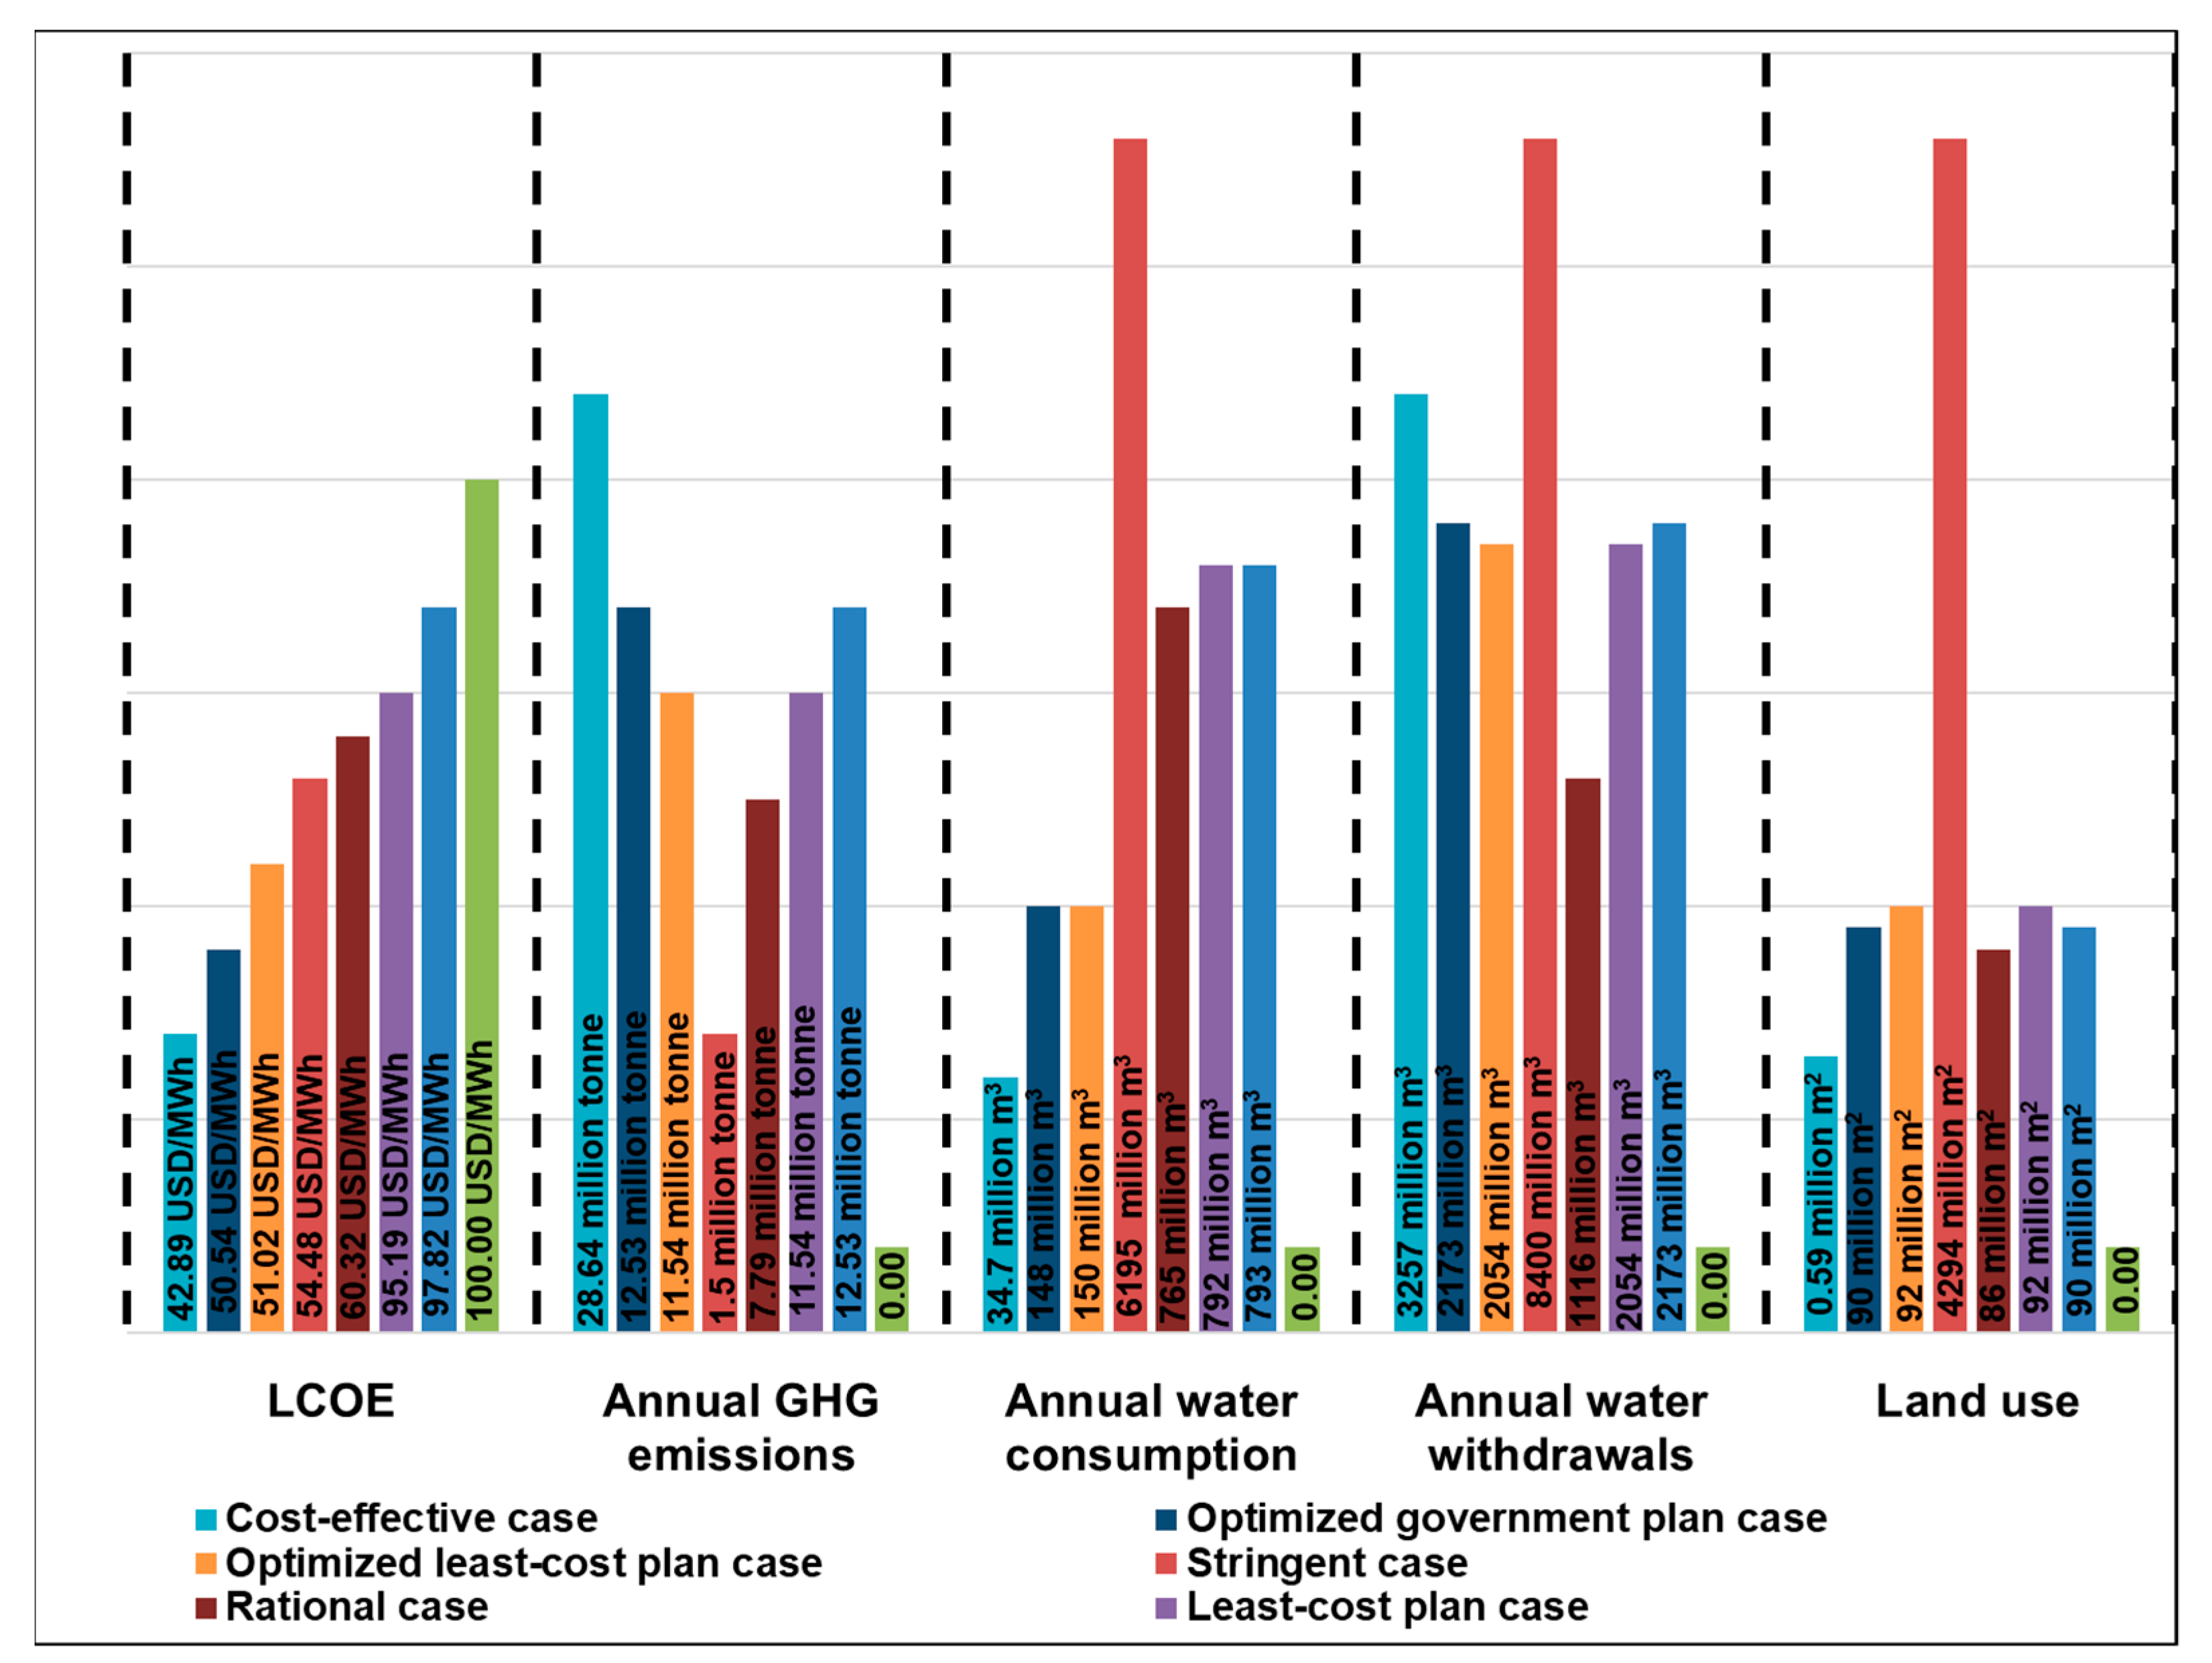
The most cost-effective pathway (CEF case) at the demand point 27,965 GWh is via coke-fired power generation (pathway no. 4). The most resource- and GHG emission-effective pathway (RGEF case) is via electricity importation (pathway no. 13). GHG emissions and water withdrawal constraints are fully utilized for the STR case to result in a generation mix of 60% from NGCC (pathway no. 1), 33% from direct biomass combustion (pathway no. 8), and 7% from nuclear energy (pathway no. 12). The LCOE
AV of the STR case is a moderate at 54.48 USD/MWh, affected by a high-cost-mitigating GHG emissions pathway no. 8 and a controversial low-cost–high GHG emission pathway no. 1. The direct biomass combustion pathway (pathway no. 8) withdraws more than 87% of the total water of the STR case and has a generation share of one third.
Figure 7 compares the cases based on the LCOE, natural resources, and GHG emissions.
6. Rational Scenario
The power generation mix for the RAT scenario is based on the outcomes of various scenarios and cases conducted in this study, aiming to transition toward more sustainable electricity generation in Sudan. Conventional and clean energy pathways are integrated to maintain diversity in the generation mix. The logical combination chosen for the specific RAT case (refer to
Table 4) demonstrates a reasonably competitive performance in terms of LCOE, natural resource utilization, and GHG emissions compared to other scenarios examined (see
Figure 7). This satisfactory performance of the RAT scenario has been achieved by introducing advanced NGCC and efficient coal-based power generation technologies to replace the existing fuel oil and proposed conventional coal pathways.
The hydroelectricity pathway has outperformed the STR scenario and has been selected in the RAT scenario with a constant current generation share. This decision assumes that constructing new dams would lead to complex social and political conflicts. In contrast, the coke and ultra-supercritical coal-based pathways demonstrated excellent performance under CEF scenario conditions; both have been chosen for the RAT scenario with varying contributions to Sudan’s power generation. The share of coke-based power generation remains the same as the current level, assuming domestic resources would remain limited without a significant change. The fuel-oil pathway (pathway no. 5) has been eliminated from all studied scenarios and cases due to its high LCOE, detrimental GHG emissions, and unreliability for power generation in Sudan, which is reflected in its low present capacity factor (CF) of only 22% [
5]. In Sudan, there are power plants that utilize a combined cycle but burn light diesel oil instead of natural gas as the primary fuel [
37]. Therefore, pathway no. 5 has been excluded from the RAT scenario and replaced with other fossil fuel-based power generation pathways, specifically NGCC and ultra-supercritical coal-based pathways. Solar–photovoltaic and wind pathways are susceptible to LCOE and are gradually introduced into Sudan’s generation mix to move toward sustainability and mitigate GHG emissions from fossil fuel-based power plants.
As an agricultural country, Sudan possesses significant biomass utilization potential and considerable water and land resources. The RAT scenario is built on the premise that biomass power generation is technically feasible and should not be disregarded in future power generation planning for Sudan. Biomass pathways are integrated into the generation mix of the RAT scenario in the later stages, specifically at the annual demand point of 50 TWh. The existence of high potential, economic feasibility [
38], and ongoing efficiency improvements [
39] have compelled the inclusion of a solar thermal pathway. The anticipation of technological advancements is the driving factor behind considering the nuclear energy pathway for the generation mix of the RAT scenario [
40], especially as the annual demand range increases to 60 TWh. The government of Sudan has outlined plans to develop nuclear energy-based power generation to meet electricity demand by 2030 in Sudan [
41]. The importation of electricity to Sudan is consistently maintained at a reasonable level to fulfill any unmet demand.
Figure 9 and
Figure 10 depict the contribution of each pathway selected for the RAT scenario in terms of installed capacity and power generation, respectively. Power generation is derived from each pathway’s installed capacity and associated capacity factor (CF). The hydroelectricity pathway’s annual power generation remains constant at 11 TWh to align with its existing contribution in Sudan. The diverse generation mix of the RAT scenario comprises an average share of 44% from clean energy pathways (including hydroelectricity, wind, biomass, solar, and nuclear). Fossil fuel-based pathways (NGCC, ultra-supercritical, and coke) make up an average share of 46% in the power generation of the RAT scenario, with the remaining 10% met by electricity imported from neighbouring countries.
The hydroelectricity pathway maintains its total power capacity of 1913 MW at the demand point of 20 TWh/year and steadily continues up to the maximum demand of 150 TWh/year. Ultra-supercritical coal and NGCC are proposed as new pathways to enter Sudan’s generation mix at the demand points of 20 TWh/year and 15 TWh/year, respectively. Each is incrementally increased to 5000 MW at the maximum demand of 150 TWh/year. The coke-based power generation pathway remains constant at the current capacity of 110 MW until its expected phase-out at the demand of 75 TWh/year. The present power capacity share of 10 MW from the solar–photovoltaic pathway is maintained at low demand up to 20 TWh/year. It is gradually increased to 2300 MW by the expected demand of 150 TWh/year. The wind energy pathway is assumed to begin contributing to the power generation of Sudan in the range of 10–2700 MW within the corresponding annual demand range of 20–150 TWh. Biomass pathways are proposed at a later demand of 50 TWh/year, with 100 MW for direct combustion and 50 MW for bio-oil burning. Each pathway is then increased to 1800 MW at the end of the studied demand range. Solar thermal and nuclear energy pathways are set with increasing ranges of 100–1300 MW and 600–2200 MW, respectively, corresponding to the annual demand range of 60–150 TWh. The importation pathway increases from 181 MW to 2481 MW to meet a portion of the corresponding yearly total demand range of 10–150 TWh, respectively.
The LCOE
AVs for the RAT scenario (68.00 USD/MWh) are higher by 56% and 18% than the corresponding LCOE
AVs for the CEF and STR scenarios, respectively. This higher LCOE trend (see
Figure 5) reflects the cost of avoiding the unreliability of the CEF and STR scenarios. However, the LCOE
AV for the RAT scenario is 32% lower than the LCOE
AV for the RGEF scenario, offering both cost savings and increased reliability. In terms of environmental impacts, the RAT scenario results in higher annual GHG emissions of 11.5 Mt of CO
2 eq., greater water consumption of 9083 million m
3, increased water withdrawals of 12,340 million m
3, and greater land use of 6511 million m
2 (see
Figure 6). Despite these increases, the diversity of the RAT scenario reduces annual GHG emissions compared to the CEF scenario by 86%. However, it also leads to a 91-fold increase in water consumption, a 1.8-fold increase in water withdrawals, and a 4147-fold increase in land use. Compared to the STR scenario, the RAT scenario increases annual GHG emissions eightfold, water demand by more than 1.4-fold, and land use by 3.8-fold. It is worth noting that using biomass and hydroelectricity pathways in the RAT scenario helps mitigate GHG emissions but negatively impacts water demand and land use. Fortunately, Sudan’s abundant availability of water and land resources can help alleviate these negative impacts in the RAT scenario.
Coal and natural gas are not locally produced in Sudan [
33], and the RAT scenario could be vulnerable to the need to import these primary fuels. To enhance the sustainability of the RAT scenario, it is crucial to engage in serious planning for local coal and natural gas production as primary fuels for power generation in Sudan. For example, establishing power generation stations in the main port of Sudan, Port Sudan, can help circumvent the complications of transporting coal and natural gas into Sudan’s cities. Transmitting electricity is generally more convenient and efficient than transporting coal or natural gas.
7. Conclusions
Locally produced coke and efficient coal-based power generation with ultra-supercritical technology represent the most cost-effective pathways to meet Sudan’s electricity demand. Despite their low generation cost, these pathways negatively impact other sustainability indicators, particularly GHG emissions and water usage. The reliability of the cost-effective scenario faces an incredible challenge: Sudan cannot depend solely on pathways with limited resources to meet its entire electricity demand. The sustainability challenge in the resource- and GHG emission-effective scenario is electricity importation and its instability due to political conflicts with neighbouring countries. The stringent scenario incorporates a diverse generation mix of fossil fuel and clean energy-based pathways capable of sustainably meeting Sudan’s base and peak electricity demand. The main challenge for the stringent scenario is its reliance on the uncertain capacity of hydroelectricity generation in Sudan. The average LCOEAV of the cost-effective scenario is the minimum at 43.64 USD/MWh. In contrast, the corresponding LCOEAV of the resource- and GHG emission-effective scenario is more than double the minimum, and the LCOEAV of the stringent scenario is higher by 32% than the minimum.
Solar–photovoltaic and wind pathways have significant potential to contribute to Sudan’s generation mix if their costs can be made competitive with fossil fuel-based pathways. To address this challenge, a rational scenario is developed based on existing power generation to avoid the unreliability of previous scenarios and cases. This approach combines clean and conventional resources to move towards more sustainable power generation in Sudan. The performance of the rational case, built upon the business-as-usual proposal, demonstrates improved sustainability. This improvement results from replacing conventional pathways with advanced NGCC and efficient coal technologies. The abundant availability of natural resources in Sudan has played a crucial role in maintaining the rational scenario at an acceptable level of power generation cost while mitigating GHG emissions.
The method employed in this study has limitations, as it does not address the social impacts of power generation, and the sustainability indicators are defined with specific values within the mathematical models. To ensure the sustainability of power generation in Sudan, it is recommended to utilize the available natural resources by incorporating clean energy pathways such as solar, wind, and hydroelectricity. Detailed future studies are recommended to comprehensively assess the sustainability of each pathway selected for potential implementation in the rational scenario. These future research endeavors should encompass financial analysis and a full life cycle assessment, considering downstream and upstream unit operations.


