Article

Finite Element Analysis-Based Blast Performance Evaluation for Reinforced Concrete Columns with Shear and Flexure Failure Modes

1
Department of Architectural Engineering, Gyeongsang National University (GNU), Jinju-si 52828, Republic of Korea
2
Earthquake Hazards Reduction Center, National Disaster Management Research Institute, Ulsan 44538, Republic of Korea
3
Department of Architectural Engineering, Sejong University, Seoul 05006, Republic of Korea
*
Author to whom correspondence should be addressed.
Sustainability 2023, 15(20), 14967; https://doi.org/10.3390/su152014967
Submission received: 6 September 2023 / Revised: 7 October 2023 / Accepted: 14 October 2023 / Published: 17 October 2023

Abstract

:
Blast loads have significantly damaged non-ductile reinforced concrete building structures with seismically deficient column details, which have lower shear capacity than the building structures with the current code-required details. This paper aims to evaluate the blast performance of non-ductile (shear-governed) and ductile (flexure-governed) RC columns using ductility- and residual capacity-based performance limits. To accomplish this research goal, the shear- and flexure-governed RC column models were developed using a finite element method and validated with previous experimental results. The efficient blast modeling method representing the reflected and incident waves was implemented in the validated column models, and these were simulated under various blast loading scenarios. The blast-induced responses for each column were investigated and utilized to determine the performance levels using the two different performance limits. The flexure-governed column model has higher performance levels than the shear-governed column model because of the lower ductility capacity of the shear-governed column model. The residual capacity-based performance level of the shear-governed column was underestimated compared to the ductility-based limits specified in a current design code.

1. Introduction

1.1. Background

The Oklahoma City terrorist bombing in 1995 caused the collapse of a third of the Alfred P. Murrah federal building [1], a nine-story non-ductile reinforced concrete (RC) building structure (i.e., seismically deficient details in RC columns). The major structural damage and building collapse occurred at the north side of the building, which directly faced the blast effects. The direct effects of the blast abruptly failed three columns in shear mode. The column shear failure triggered the subsequent progressive collapse. The building partially collapsed owing to the shear failure of its columns, causing 153 deaths. In addition, the shock wave caused by the explosion resulted in structural damage to nearby buildings. Because the blast damage caused tremendous losses of life and property, the blast performance prediction of building structures is needed.
Experimental and numerical studies of blast loads on RC structures have been conducted. Hansapinyo et al. [2] investigated the effect of the sequential small impact loads on the residual resistance of the RC beam elements with varying axial load magnitudes and shear reinforcement details. They found that the sequential impact loads decreased the concrete shear capacity of the damaged beam elements, and the more severe diagonal shear cracks were found on the impacted beam elements. To evaluate the blast resistance and protective capacity of bi-directional prestressed concrete (PSC) members, Choi et al. [3] performed blast tests for RC, PSC, and PSC with rebar (PSRC) specimens and measured various structural responses (e.g., deflection, acceleration, and strains of all materials) including blast waves. Additionally, they developed and calibrated the finite element (FE) model based on the measured responses from the blast tests for the blast damage assessment of the panels with various materials and blast parameters. Tang et al. [4] utilized the finite element method (FEM) to detect surface corrosion/rust on steel rods. They successfully detected the damage using the ultrasonic wave propagation created from the FE simulations. Wei et al. [5] investigated the dynamic behavior of axially loaded RC and ultra-high-performance concrete (UHPC) columns under a low-velocity impact loading condition. After testing the column specimens under the impact load, the FE column simulation models were developed and validated with experimental responses. The numerical studies on the main column parameters (reinforcement details, geometric condition, and loading condition) were carried out, and the damage levels were determined using the residual capacity-based performance criteria. However, experimental studies to examine the blast damage on building structures caused by explosions are significantly dangerous and require considerable manpower, time, and cost. To overcome such limitations, numerical studies have been conducted. The FEM simulations have been used in various studies because they have the advantage of enabling safe and fast research compared to the amount of investment [4,5]. Wu et al. [6] conducted a numerical study on the structural dynamic response and failure behavior of RC slab elements with varying slab thickness subjected to various blast loading conditions with TNT mass and stand-off distance. The FE models representing the slab elements are in good agreement with the experimentally measured responses for the structural damage mechanism and deflection.
The P-I diagram can predict the collapse of structural members, the amount of damage through the explosion pressure, and the impulse applied to the members. Fallah and Louca [7] derived the P-I diagram based on the single-degree-of-freedom (SDOF) system for elastic–plastic hardening and elastic–plastic softening under blast loads. Shi et al. [8] mentioned the limited capability of the SDOF system in analyzing structural damages and proposed a new method for evaluating the performance of structures under blast loads based on residual resisting capacity. Bao and Li [9] conducted a parametric study for the transverse reinforcing bar ratio, longitudinal reinforcing bar ratio, and axial loading conditions on RC columns using FE simulations. They observed various blast responses of RC columns and proposed an evaluation methodology considering the influence of each variable on residual resisting capacity. They found that the transverse reinforcing bar ratio significantly impacts the blast response of the column. Shin and Jeon [10] developed an FE simulation-based modeling methodology to accurately predict the dynamic responses of buildings to blast loads and validated its reliability by comparing dynamic responses with an actual experiment in the past. The modeling method implemented the RC column models with various retrofit parameters, and the optimum retrofit scheme of the composite material-based retrofit system was proposed.

1.2. Research Purpose

This study aims to evaluate the blast performance of flexure-governed RC columns and shear-governed RC columns under several blast loads using FE simulations. In particular, flexure-governed and shear-governed column models were developed and validated based on the results of past experiments under cyclic loading conditions, and the blast modeling method validated by a previous numerical study’s blast loads was additionally implemented in the RC column models. FE-based blast simulations were performed under low-to-high blast loading conditions, and the blast responses of the RC columns were utilized to determine the blast performance levels with respect to the displacement ductility and residual resisting capacity limits.

2. Blast Modeling and Evaluation Method

2.1. Blast Modeling Method

LS-DYNA, a FEM-based software program, can accurately predict the responses of members to impact loads that act in a short period, such as blast loads [11]. The blast load modeling methods provided by LS-DYNA include the load blast enhanced (LBE) method, arbitrary Lagrangian–Eulerian (ALE) method [12], and coupling method [13], which combines the LBE and ALE methods. The modeling information for these methods is summarized in Figure 1.
The LBE method (see Figure 1a) is a method of forming only a structure through target modeling. The description of the explosion pressure can be entered through the input of the equivalent mass of TNT (WTNT) and the horizontal distance (RD) between the target and explosive. The blast modeling method is based on a pure Lagrangian formulation. In other words, the blast pressure produced by the LBE method is directly applied to the segments on a given surface of the target structure. This method requires a short analysis time because it forms a small number of elements (explosive and air models are omitted), but it cannot implement reflected waves and vortices observed from real blast loading situations because the fluid–structure interface (FSI) algorithm is not reflected owing to the omission of air modeling [8]. Additionally, the modeling method is limited for the scaled distance of the blast loading scenarios. If the pressure causes a large deformation in the target structure, the surface mesh facing the pressure can be distorted, and thus the numerical results may not be overestimated or underestimated [14].
The ALE method (see Figure 1b) consists of an explosive and a target structure, which are formed using a Lagrangian mesh, as well as the air formed using a Eulerian mesh. This method can accurately represent the interaction between the waves in the air caused by an explosion, such as reflected waves, and the structure because it reflects the FSI algorithm. Thus, the main advantage of the ALE modeling method is that it can reproduce the proper blast wave interactions. Additionally, unlike the LBE method, the ALE approach can predict near contact explosions because the explosive materials are modeled directly in the air [15]. The limitation of the ALE modeling method is that it is computationally more expensive than the LBE modeling method. This is mainly due to large amounts of elements in the air, the small mesh size of the explosive model, and reductions in time step size for the coupling computations [16].
The coupling method (see Figure 1c) is a modeling approach that consists of a target structure formed using a Lagrangian mesh, air formed using a Eulerian mesh, and an ambient layer. The modeling method generates time–explosion pressure histories using the empirical equation of the LBE method without modeling explosive meshes. The ambient air element transfers a blast pressure time history computed by the LBE method to the air model surrounding the target structure. The ALE air model allows the blast wave to travel, and it also allows interaction with the target structure by coupling using the FSI algorithm. As compared with the ALE method, the coupling method eliminates the explosive model and reduces the air model, which results in a significant increase in computational effort. Therefore, this method is more computationally efficient [17].
Shin and Jeon [10] modeled the RC column measured from a previous experimental study for blast loading [18] using the coupling method and compared its dynamic response under a blast load with the response in the experiment to validate the reliability of the coupling method. Figure 2 shows the dynamic response results of the actual experimental column and the FE model column under the same blast loading conditions. For an accurate comparison, the results of previous numerical studies that modeled the same column were compared and evaluated. The column model that used the coupling (coupled LBE–ALE model) method developed in the study showed an error of approximately 3.4% with respect to the result of the actual experiment based on the maximum displacement, thereby exhibiting higher reliability compared to other numerical analysis studies. Therefore, this study utilized the coupling modeling method simulating blast loads.

2.2. Blast Performance Evaluation Methods

Blast performance limits for determining the performance or damage levels of members under blast loads include the ductility-based evaluation method specified in the American Society of Civil Engineers (ASCE) 59–11 [19] and the residual resisting capacity-based evaluation method proposed by Shi et al. [8]. The ductility-based evaluation method is calculated based on the blast-induced displacement on structures as follows.
μ max = δ peak   /   δ y
where δ y is the yielding displacement of the member, and δ p e a k is the maximum displacement of the member under blast loads. Different ductility criteria are applied for blast performance evaluation depending on the member type (e.g., shear-governed columns and flexure-governed columns). Table 1 lists the ductility criteria for the RC columns (flexure- and shear-governed columns) modeled in this study.
Shi et al. [8] evaluated the blast performance of a column member through its residual resisting capacity. The blast damage index (D) used in the study is calculated as follows.
D   = 1 P residual   /   P design
where P r e s i d u a l is the maximum residual force that the member can resist when an additional axial load is gradually applied after the application of a blast load to the member. This is intended to measure the residual capacity under a given axial load. P d e s i g n is the maximum design force value of the column member provided by MacGregor [20] and ACI (American Concrete Institute, Farmington Hills, MI, USA) 318–19 [21]. It can be obtained as follows.
P d e s i g n = 0.85 f c A g A S + f y A s
where f c and f y are the concrete strength (MPa) and yielding stress (MPa) for steel reinforcing bars, respectively. A g is the cross-sectional area of the column ( m m 2 ), and A s is the total area of steel reinforcing bars in the cross-section ( m m 2 ). Table 2 shows the performance of the member according to the damage level (D) with the residual resisting capacity-based limit values specified in Shi et al. [8]. The limit states indicate that if the structural elements have minor damage under the blast load (D < 0.2), the element will be resisted by 80% of the design strength (superficial performance level). However, if the structural elements have significant damage, the element will lose its axial resisting capacity because the residual strength goes to an almost-zero value. These performance limits were identically applied to all column models regardless of the column types.

3. FEA Model Development and Blast Loading Scenarios

3.1. FEA Model Development and Validation

This study considered flexure-governed columns and the shear-governed columns. The flexure-governed column was referred to as “Model-F” and the shear-governed column as “Model-S”. The blast performance of these two column models under various explosion scenarios was evaluated based on the ductility and residual resisting capacity mentioned in Section 2.2. For Model-F, the column modeling details were obtained from a previous experimental study conducted by Mo and Wang [22], which studied failure in a flexure failure mode. Model-S was modeled using one of specimen details described in a previous experimental study, a failure in a shear failure mode [23]. The specimen in an as-built condition has significant strength reduction with the low ductility capacity. Figure 3 and Figure 4 show the modeling information for Model-F and Model-S, respectively. Table 3 shows the material properties used for Model-F and Model-S. The footing was modeled to provide higher fidelity for the column constraints. The footing was restrained in all transitional and rotational directions to represent a fixed condition. The air mesh to transmit the wavelength caused by the explosion was modeled, and the time–explosion pressure function calculated by LBE was applied to the ambient layer to represent blast loads that reflected the FSI algorithm. The blast waves were reflected by the exterior boundary conditions of the air model in XY, XZ, and YZ planes, and the unreasonable reflected waves were superposed with the incident waves in the air model. These unreasonable reflected waves may lead to the overestimation of the blast pressure and impulse. To avoid those reflections, this study applied non-reflecting boundaries on the exterior boundaries of the air model.
The K&C (Karagozian & Case) model was used for the concrete material of the numerical analysis columns [24]. It can reproduce the strain hardening, strain softening, shear dilation, and confinement effect of concrete. Furthermore, it can reflect the strain rate effect of concrete and reinforcing bar members within a short period, such as blast loads, through the dynamic increase factor (DIF). The DIF is calculated based on the ratio between dynamic concrete strength and static concrete strength. The change in the strength ratio was set for the fractured surface of the K&C concrete used in this study to describe its behavior, and the DIF formulas of concrete for compressive strength and tensile strength are as follows:
  D I F = ε ˙ / ε ˙ s c 1.026 α s     γ s ε ˙ / ε ˙ s c 1 / 3               ε s     30   s 1 ε s > 30   s 1 With   log γ s = 6.156 α s 2 α s = 1 / 5 + 0.9 f c
where ε ˙ is the strength ratio per second ( s 1 ; 1/second), and ε ˙ s c is the compressive strength ratio for 30 × 10 6 s 1 . f c is the compressive strength of concrete.
D I F = ε ˙ / ε ˙ s t δ     β ε ˙ / ε ˙ s t 1 / 3               ε s     1.0   s 1 ε s > 1.0   s 1 With   log β =   6 δ 2 δ = 1 / 1 + 0.8 f c
where ε ˙ s t is the tensile strength ratio for 10 6 s 1 .
The plastic kinematic model used for a reinforcing bar material can implement the yield and ultimate stress amplification effects of steel in detail through the DIF setting. The equation below shows the DIF for the reinforcing bar member [25]. It is effective only in the 290   M P a f y 710   M P a range.
D I F = ε ˙ / 10 4 α s where   α s = 0.074 0.04 f y / 414   for   the   yielding   stress   ( f y )   of   the   steel   material . α s = 0.019 0.009 f u / 414   for   the   ultimate   stress   ( f u )   of   the   steel   material .
To practically describe the failure of a column, it is necessary to reflect the bonding performance between the concrete and reinforcing bar members in the column through load transfer. There are three methods to represent the bonding performance in LS-DYNA. The merging node method, which is a commonly used method, induces integrated behavior as the reinforcing bar and concrete members share one node. The method involves a short analysis time but cannot implement the bond failure effects. The 1D-slide line method can describe bond behavior with the defect shear modulus ( G s ), maximum elastic slip ( s m a x ), and damage curve exponential coefficient ( h d m g ), as shown in Equation (7) below. The h d m g decays the bond shear stress with the increment of the plastic slip displacement ( s p ), and D is the damage parameter, the sum of the absolute values of s p ( D n + 1 = D n + s p , where n is an incremental step). As defined in Equation (3), the bond-slip behavior is assumed to be bilinear and the bond stress deterioration is initiated after reaching   τ m a x (= G s · s ). It can implement the bond failure phenomenon in the plastic range as well as in the elastic range with bilinear behavior.
  τ = G s   s   τ m a x   e h d m g D               s m a x > s m a x
The final method implements bond performance by entering the frictional coefficient into the overlapping nodes between the two members using the contact option. It can implement bond slip effects accurately compared to the analysis time. In this study, bond slip was induced by applying friction force through the contact option and reflecting bond performance.
Figure 5 shows the displacement–force relationships of the column models subjected to the same static cyclic loading conditions as in previous experiments [22,23]. The initial stiffness, maximum strength, and strength reduction ratio of the simulated responses were compared to the experimental results as given in Table 4. For Model-F, the strength is slightly decreased after reaching the maximum strength, similar to the test result for the flexure-governed column. However, Model-S shows significant strength reduction after the shear failure. This column behavior represents the shear-governed column. As given in Table 4, the simulation variation in the initial stiffness, maximum strength, and strength reduction ratio between experimental and simulated responses was less than 12% for Model-F and approximately 20% for Model-S. However, because both models exhibited the simulation variation of approximately 10% for the initial stiffness and maximum strength, the simulated responses have good agreements with the experimental results. This variation is attributed to the modeling assumptions. To reduce the computational time of the FE models, the foundation elements (footing) were simply modeled using elastic materials with the effective stiffness. This is because the critical damage on the foundation elements was not found in the previous experimental studies. Additionally, the bond-slip effects between reinforcing bars and surrounding concrete were controlled using the frictional forces.
The results of the required information, including δ y and P d e s i g n , for the blast performance assessment can be found in Table 5 for each respective model.

3.2. Blast Load Scenarios

The blast loading scenarios can be determined according to the Z-scale value provided by UFC 3-340-02 [26]. The Z-scale value sets the maximum reflective pressure, maximum impulse, and load duration that affect blast loads. The Z-scale is obtained using the following equation.
Z s c a l e = R D   /   W T N T 3
where R D is the horizontal distance from the explosive to the target structure, and W T N T is the equivalent mass of the TNT explosive. In this study, the explosion range was set by varying the R D value while having a fixed value of W T N T . Table 6 shows the information on Z-scale and blast parameters according to the blast loading scenarios, where R H is the height of the explosion from the ground level.
Z-scale = 0.4 m/kg1/3 (short distance) was selected based on the minimum value that can be allowed when modeling using the LBE method through LS-DYNA. This study set Z-scale = 1.6 m/kg1/3 as the long-distance scenario because the blast loads produced marginal responses on the structures [27]. Z-scale = 1.0 m/kg1/3 (mid-distance) was calculated as the median value of the two Z-scale reference values above. For W T N T and R H , the maximum explosive mass that can be loaded on vehicles from sedans to vans and the average vehicle height were applied [28,29].

3.3. Blast Load Modeling

To predict the dynamic responses of the columns to blast loads, the coupling method mentioned in Section 2.1 was applied for blast load modeling [10]. Figure 6 shows the process in which the air reaches the target structure through the air mesh and ambient layer. It can be observed that the interaction between the air and target structure (i.e., the action of reflected and shock waves among the ground, structure, and air) was performed as the FSI algorithm was reflected through modeling that used the coupling method.
Figure 7 shows the loading protocol applied to evaluate the residual resisting capacity of the RC columns developed in this study. The load reflected in this study can be divided into dynamic analysis and static analysis sections. The pressure over time that represents the blast loads acting on the dynamic analysis section showed a sharp increase in the blast load and the occurrence of the instantaneous maximum pressure as the load reached the structure. Thereafter, a negative pressure section occurred as the reflected wave generated by the contact between the explosion wave and the structure or ground met the existing explosion wave. After the negative pressure section, the pressure reached zero and there was no change in pressure. Thus, the blast loads acting on the column ceased existing. To examine the residual performance of the column under blast loads, an axial load was applied to the column after the blast load with the displacement-controlled method in the static analysis section. When the axial displacement is consistently increased over a certain period, the failure of the column is determined if the displacement stops increasing or if it decreases.

4. Blast Performance Evaluation

In this study, dynamic responses were derived, and the blast performance levels determined using two different limits (ductility- and residual capacity-based performance limits) were compared and analyzed to examine the condition of two RC columns (Model-F and Model-S) for the blast loading scenarios.
Figure 8 and Figure 9 show the effective plastic strain (EPS) of Model-F and Model-S by blast loads, respectively. The maximum stress that occurs after the arrival of blast loads at the column can be observed at the bottom and rear parts of the column. Therefore, the maximum moment occurred at the bottom of the column, and the maximum tension was detected at the rear part of the column. In the stress–strain relationship of concrete, the section in which the strain is smaller than the strain corresponding to the maximum strength is referred to as the hardening section (0 < EPS < 1.0), while the section in which the strain corresponding to the maximum strength is exceeded is referred to as the softening section (1.0 < EPS < 2.0). If the stress change color of the RC column is closer to red, then the concrete member reaches the softening section and cracks or fractures occur in it. In the case of Model-F, fewer concrete meshes reached the softening section compared to Model-S. Therefore, fewer cracks or fractures occurred in Model-F under the same loading conditions because its ductility is higher than that of Model-S. In particular, it can be observed that fractures occurred in most of Model-S and that cracks occurred in the diagonal direction. This is the typical crack pattern of shear failure.
Figure 10 shows the time–displacement response results of the columns according to the explosion scale for blast performance evaluation through the ductility-based performance limits. It can be observed that the maximum response ( δ p e a k ) decreased as the blast load occurrence distance increased. In particular, because the responses of the columns did not exceed the yielding displacement under the scenarios of Z-scale = 1.0 and 1.6 m/kg1/3 (Model-S for Z-scale = 1.0 m/kg1/3, no residual deformation existed after reaching the maximum displacement when blast loads were applied. In addition, the yielding displacement ( δ y ) was expressed in the time–displacement responses to better understand the blast behavior of the columns. When the maximum response that occurred under each scenario was lower than δ y , the behavior of the column was observed within the elastic range. As can be observed from the figure, the maximum response of Model-F was reached in 55 milliseconds compared to Model-S (33 milliseconds). In particular, under the Z-scale = 1.0 m/kg1/3 scenario, Model-F exhibited elastic behavior, contrary to Model-S. Consequently, the flexure-governed column has a higher blast resistance to blast loads than the shear-governed column.
Figure 11 shows the time–axial force responses of the columns according to the explosion scale for blast performance evaluation through residual axial capacity. For the residual axial capacity, the axial resistance capacity of the columns was calculated by applying axial deformation to the columns after the occurrence of blast loads. In the figure, additional axial deformation was applied to the columns from the occurrence of the explosion, at 60 milliseconds, and the axial force generated at this time was measured and expressed. Therefore, the maximum residual strength ( P r e s i d u a l ) increased as the axial load increased, and the response decreased after the axial column failure. The maximum response lower than P d e s i g n after each blast loading scenario indicates that the residual capacity of the column is low. Therefore, the damage to the member caused by the blast loads is significant. It can be observed that the residual resisting capacity of the columns is correlated with the time–displacement response mentioned above. When the displacement response was low (i.e., displacement response lower than yielding displacement) depending on the load scenario, the axial capacity of the column was higher than P d e s i g n . However, when the displacement exceeded the yielding displacement, the residual axial capacity of the column was lower than P d e s i g n . In particular, the shear-governed column does not have any residual strength after the short-distance blast load (i.e., residual strength is almost zero). For the short-distance loading scenario, Model-F also suffered significant damage. However, the column model still has residual resistance shown in Figure 11a. This is attributed to column details associated with the longitudinal and transverse reinforcing details. In addition, for all scenarios, the maximum response value of Model-F was higher than that of Model-S. Thus, the flexure-governed column has higher residual resisting capacity than the shear-governed column, and it has less damage from the blast loads.
Table 7 and Table 8 show the results of the two performance evaluation methods (ductility- and residual capacity-based performance limits) for Model-F and Model-S under each Z-scale scenario, respectively. It can be observed that the performance levels of Model-S are worse than those of Model-F under all scenarios. Therefore, the performance of column members against blast loads varies depending on the ratio of the transverse reinforcing bar, which affects the confinement effects of the RC columns. To mitigate the blast damage on the RC columns, the retrofit methods maximizing the confinement effect transferring the failure mode from shear to flexure need to be adopted.
As shown in Table 7, both performance limits for Model-F showed safe (superficial and low damage) conditions under the scenarios of Z-scale = 1.0 and 1.6 m/kg1/3. However, Model-F showed the collapse of the column model under the scenario of Z-scale = 0.4 m/kg1/3 in spite of the higher number of transverse reinforcing bars compared to Model-S. Thus, short-distance blast loads have a significant impact on members, and measures to secure the additional retrofit of column members against short-distance blast loads are required. When the performance evaluation results of Model-S in Table 8 were analyzed, the ductility-based performance limits evaluated the collapse level under the scenario of Z-scale = 1.0 m/kg1/3, but the residual evaluation method derived the level of high damage. This is because the residual capacity-based performance criteria are consistently adopted regardless of the column failure modes or column details. Through this investigation, it is necessary to adequately adopt the performance evaluation limits because the blast performance levels for the shear-governed column model were differently determined.

5. Conclusions

This study developed reinforced concrete (RC) columns with shear and flexure failure modes (Model-F and Model-S) and investigated the blast responses of the RC column models under various loading conditions. Based on the numerical simulations, the blast performance levels of each column model were determined and compared through the two blast performance limits (ductility- and residual capacity-based limits). The following conclusions were drawn:
(1)
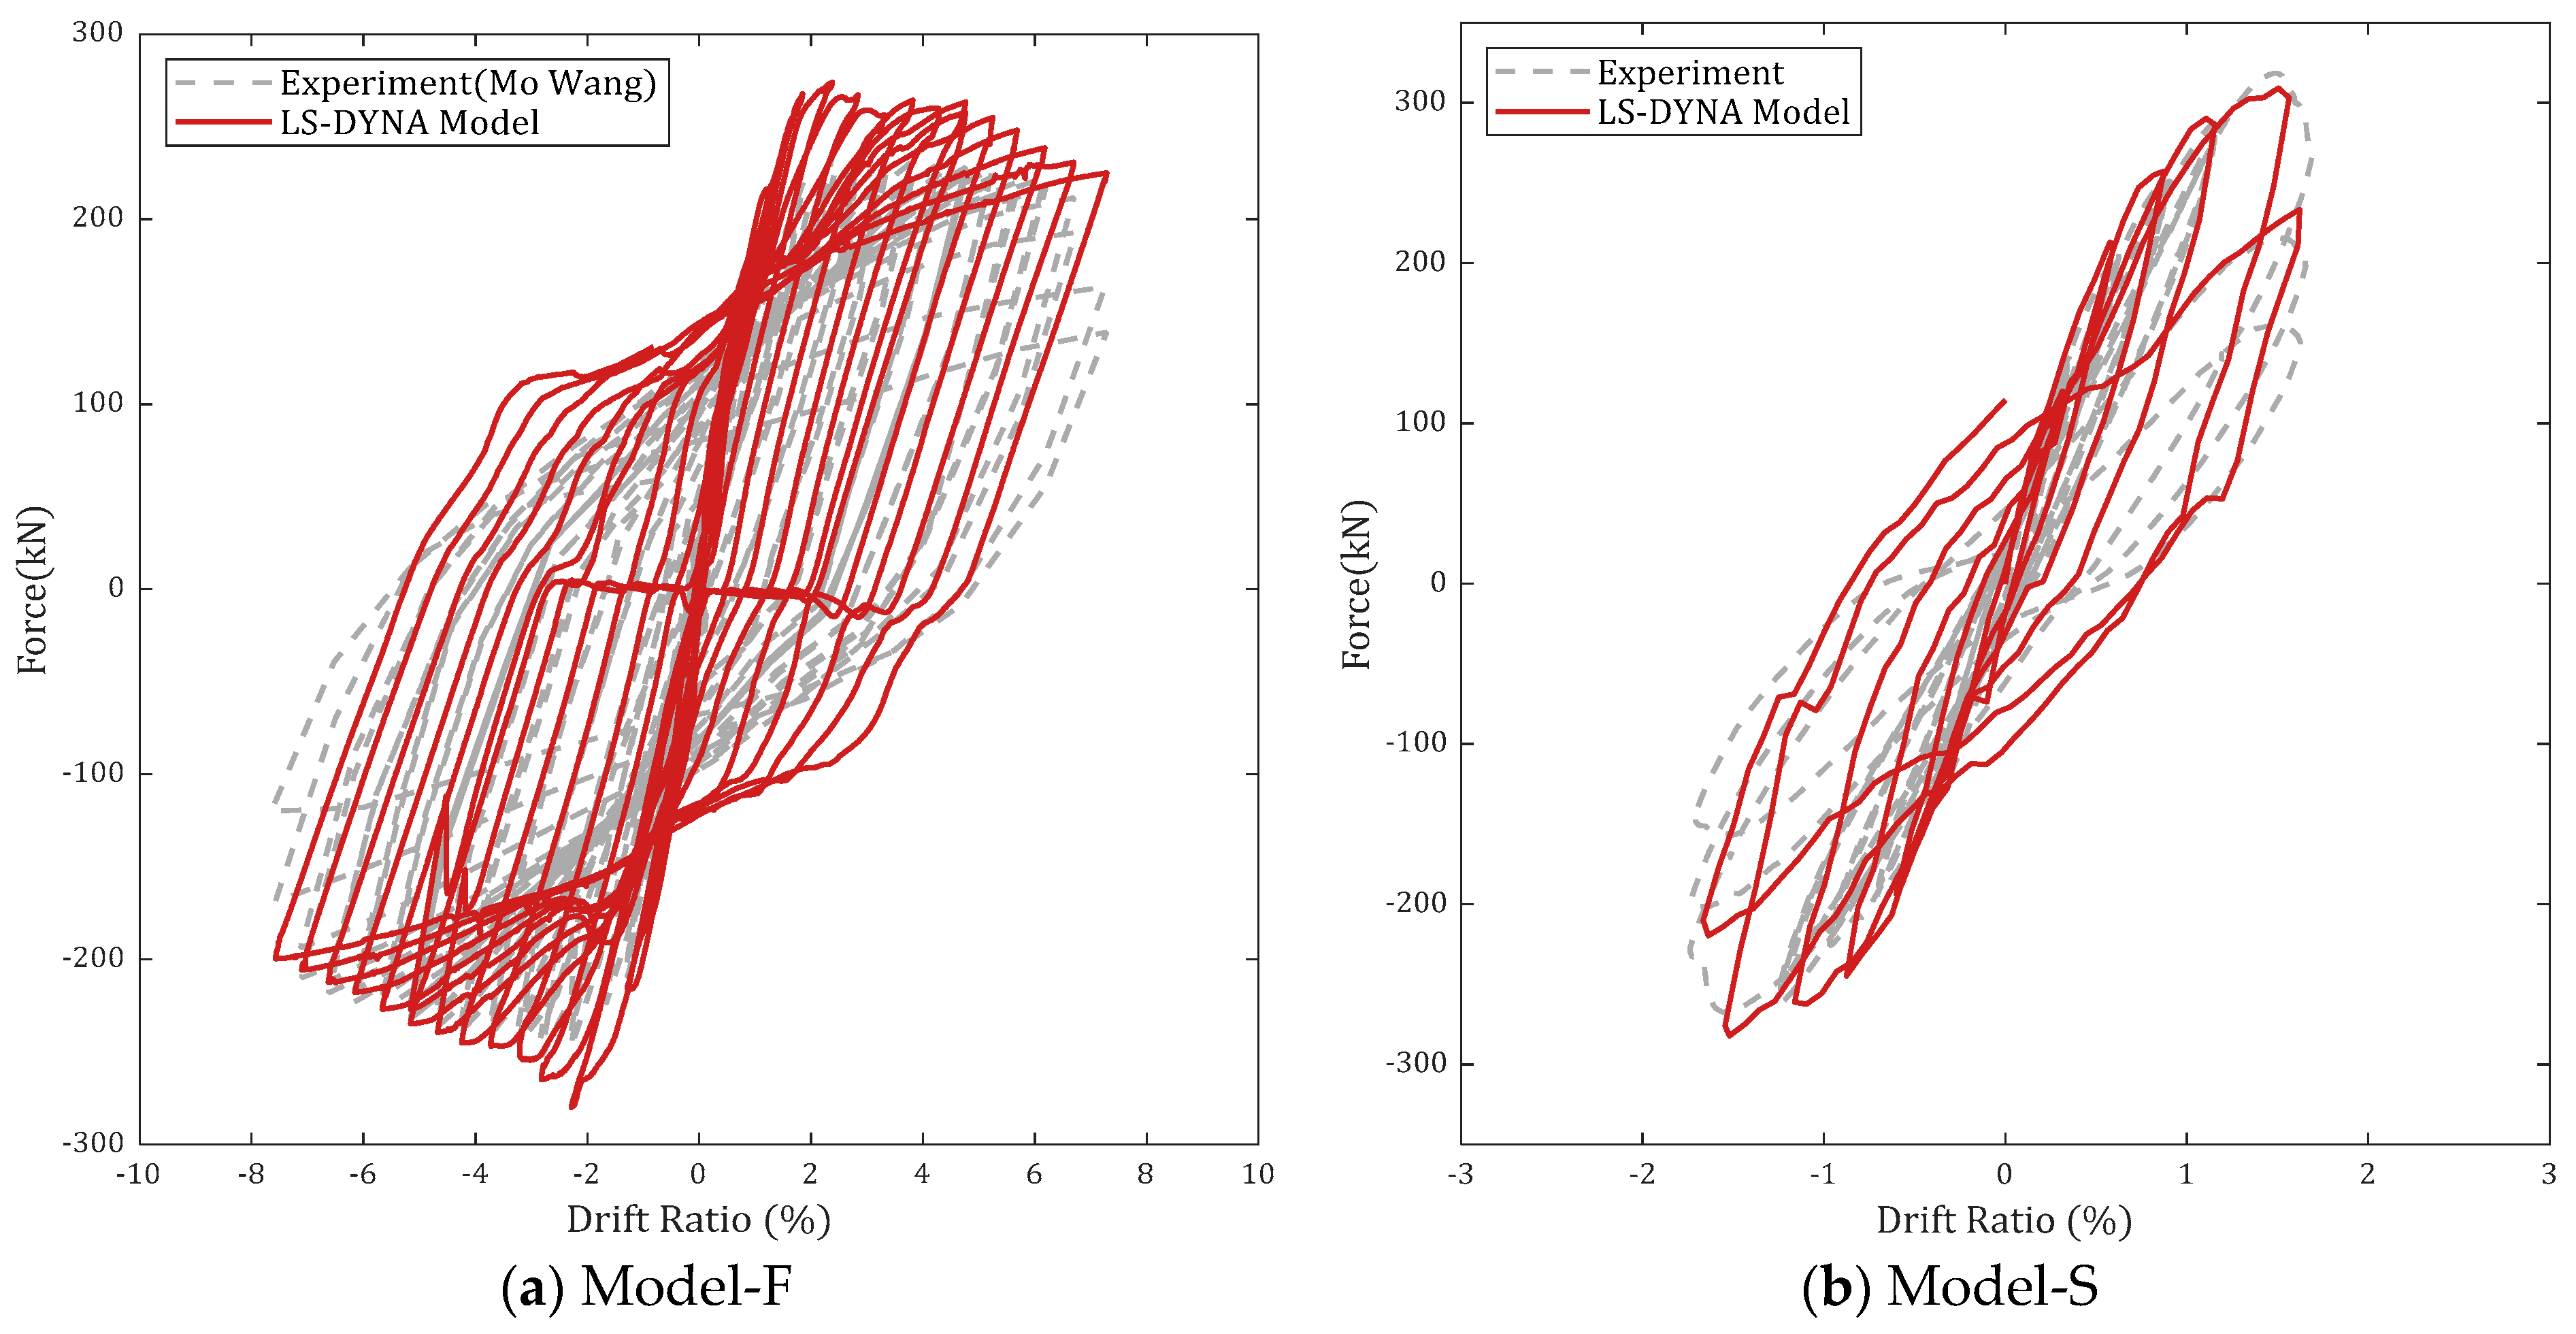
When the simulated results of the flexure- and shear-governed column models were compared to the experimental results (initial stiffness, maximum strength, and strength reduction rate), it was found that the maximum variations between simulated and experimental responses were approximately 12% and 20% for Model-F and Model-S, respectively.
(2)
The flexure-governed column (Model-F) has better performance levels than the shear-governed column (Model-S). This indicates that Model-S has more significant damage than Model-F. Therefore, the reinforcement details (e.g., transverse reinforcing bar ratio) of the flexure-governed column have an impact on reducing the damage caused by blast loads.
(3)
For the flexure- and shear-governed columns (Model-F) analyzed, the collapse of the columns was observed under the short-distance blast load scenario (Z-scale = 0.4 m/kg1/3). Therefore, it is necessary to adopt the additional retrofit of the RC columns against such a large blast load, such as short-distance blast loads.
(4)
When the results derived from the two performance criteria (ductility- and residual capacity-based performance limits) for the shear-governed column (Model-S) were analyzed, the different performance levels between the ductility- and residual capacity-based limits were determined under the scenario of Z-scale = 0.4 m/kg1/3. Based on the investigation, the blast performance measured from the residual capacity-based limits is underestimated compared to the ductility-based performance limits specified in a current design code. Thus, it is needed to adopt adequate performance limits considering the column failure modes to accurately evaluate the blast performance of the shear-governed columns.
(5)
Further research on blast performance evaluation using two different performance criteria will be conducted considering various blast loading scenarios, longitudinal and transverse reinforcing bar details in RC columns, and axial loading conditions using the developed and validated RC column models.

Author Contributions

Conceptualization, K.L. and J.S.; Methodology, J.P. and J.S.; Validation, Y.-E.K. and Q.B.T.; Formal analysis, J.S.; Investigation, Y.-E.K., J.P. and Q.B.T.; Data curation, Y.-E.K., J.P. and Q.B.T.; Writing—original draft, Y.-E.K. and J.S.; Writing—review & editing, K.L. and J.S. All authors have read and agreed to the published version of the manuscript.

Funding

Gyeongsang National University.

Institutional Review Board Statement

Not applicable.

Informed Consent Statement

Not applicable.

Data Availability Statement

The data that has been used is confidential.

Acknowledgments

This work was supported by the research grant of the Gyeongsang National University in 2023.

Conflicts of Interest

The authors declare that they have no known competing financial interests or personal relationships that could have appeared to influence the work reported in this paper.

References

  1. Corley, W.; Sozen, M.; Thornton, C.; Mlakar, P. The Oklahoma City Bombing: Improving Building Performance through Multi-hazard Mitigation (Report No. FEMA-277); Federal Emergency Management Agency (FEMA): Washington, DC, USA, 1996.
  2. Hansapinyo, C.; Limkatanyu, S.; Zhang, H.; Imjai, T. Residual Strength of Reinforced Concrete Beams under Sequential Small Impact Loads. Buildings 2021, 11, 518. [Google Scholar] [CrossRef]
  3. Choi, J.; Choi, S.; Kim, J.; Hong, K. Evaluation of blast resistance and failure behavior of prestressed concrete under blast loading. Constr. Build. Mater. 2018, 173, 550–572. [Google Scholar] [CrossRef]
  4. Tang, Q.; Du, C.; Hu, J.; Wang, X.; Yu, T. Surface rust detection using ultrasonic waves in a cylindrical geometry by finite element simulation. Infrastructures 2018, 3, 29. [Google Scholar] [CrossRef]
  5. Wei, J.; Li, J.; Wu, C. An experimental and numerical study of reinforced conventional concrete and ultra-high performance concrete columns under lateral impact loads. Eng. Struct. 2019, 201, 109822. [Google Scholar] [CrossRef]
  6. Wu, J.; Zhou, Y.; Zhang, R.; Liu, C.; Zhang, Z. Numerical simulation of reinforced concrete slab subjected to blast loading and the structural damage assessment. Eng. Fail. Anal. 2020, 118, 104926. [Google Scholar] [CrossRef]
  7. Fallah, A.; Louca, L. Pressure–impulse diagrams for elastic-plastic-hardening and softening single-degree-of-freedom models subjected to blast loading. Int. J. Impact Eng. 2007, 34, 823–842. [Google Scholar] [CrossRef]
  8. Shi, Y.; Hao, H.; Li, Z. Numerical derivation of pressure–impulse diagrams for prediction of RC column damage to blast loads. Int. J. Impact Eng. 2007, 35, 1213–1227. [Google Scholar] [CrossRef]
  9. Bao, X.; Li, B. Residual strength of blast damaged reinforced concrete columns. Int. J. Impact Eng. 2010, 37, 295–308. [Google Scholar] [CrossRef]
  10. Shin, J.; Jeon, J. Retrofit scheme of FRP jacketing system for blast damage mitigation of non-ductile RC building frames. Compos. Struct. 2019, 288, 111328. [Google Scholar] [CrossRef]
  11. Livermore Software Technology Corporation (LSTC). LS-DYNA Keyword User’s Manual; Version 971/R7.0; LSTC: Livermore, CA, USA, 2013. [Google Scholar]
  12. Olovsson, L.; Souli, M. ALE and fluid-structure interaction capabilities in LS-DYNA. In Proceedings of the 6th International LS-DYNA Users Conference, Dearborn, MI, USA, 9–11 April 2000. [Google Scholar]
  13. Williams, G.D. Analysis and Response Mechanisms of Blast-Loaded Reinforced Concrete Columns. Ph.D. Thesis, University of Texas, Austin, TX, USA, 2009. [Google Scholar]
  14. Børvik, T.; Hanssen, A.G.; Langseth, M.; Olovsson, L. Response of structures to planar blast loads-A finite element engineering approach. Comput. Struct. 2009, 87, 507–520. [Google Scholar] [CrossRef]
  15. Schwer, L.; Teng, H.; Souli, M. LS-DYNA Air blast techniques: Comparisons with experiments for close-in charges. In Proceedings of the 10th European LS-DYNA Conference 2015, Wurzburg, Germany, 15–17 June 2015; pp. 1–20. [Google Scholar]
  16. Slavik, T.P. A Coupling of Empirical Explosive Blast Loads to ALE Air Domains in LS- DYNA. IOP Conf. Ser. Mater. Sci. Eng. 2009, 10, 012146. [Google Scholar] [CrossRef]
  17. Han, Y.; Liu, H. Finite Element Simulation of Medium-Range Blast Loading Using LS- DYNA. Shock. Vib. 2015, 2015, 631493. [Google Scholar] [CrossRef]
  18. Woodson, S.C.; Baylot, J.T. Structural Collapse: Quarter-Scale Model Experiments (Report No. SL-99-8); US Army Engineer Research and Development Center: Vicksburg, MS, USA, 1999. [Google Scholar]
  19. ASCE (American Society of Civil Engineers). Blast Protection of Buildings; ASCE/SEI 59-11; American Society of Civil Engineers: Reston, VA, USA, 2011; pp. 11–59. [Google Scholar]
  20. MacGregor, J.G.G. Reinforced Concrete: Mechanics and Design, Professional Technical Reference; Prentice-Hall: Englewood Cliffs, NJ, USA, 1996. [Google Scholar]
  21. ACI Committee 318. Building Code Requirements for Structural Concrete; American Concrete Institute: Singapore, 2019. [Google Scholar]
  22. Mo, Y.L.; Wang, S.J. Seismic Behavior of RC Columns with Various Tie Configurations. J. Struct. Eng. 2000, 126, 1122–1130. [Google Scholar] [CrossRef]
  23. Lee, G.; Lee, D.; Park, M.; Lee, K. Experimental Study of Ductility and Strength Enhancement for RC Columns Retrofitted with Several Types of Aramid Reinforcements. Earthq. Eng. Soc. Korea 2023, 27, 171–180. [Google Scholar] [CrossRef]
  24. Crawford, J.E.; Wu, Y.; Choi, H.J.; Magallanes, J.M.; Lan, S. Use and Validation of the Release III K&C Concrete Material Model in LS-DYNA (Report No. TR-11-36.6); Karagozian & Case, Glendale: Glendale, CA, USA, 2012. [Google Scholar]
  25. Malvar, L.; Crawford, J. Dynamic increase factors for steel reinforcing bars. In Proceedings of the 28th DDESB Seminar, Orlando, FL, USA, 18–20 August 1998. [Google Scholar]
  26. US Department of Defense (DoD). Structures to Resist the Effects of Accidental Explosions; UFC-3-340-02; US DoD: Washington, DC, USA, 2008.
  27. Crawford, J.E.; Wu, Y.; Choi, H.J.; Magallanes, J.M. The Importance of Shear-Dilatancy Behaviors in RC Columns. Int. J. Prot. Struct. 2013, 4, 341–377. [Google Scholar] [CrossRef]
  28. FEMA-426. Reference Manual to Mitigate Potential Terrorist Attacks against Buildings. s. Rep. No. FEMA-426; Federal Emergency Management Agency (FEMA): Washington, DC, USA, 2003.
  29. Stewart, L.K. Testing and Analysis of Structural Steel Columns Subjected to Blast Loads. Ph.D. Thesis, University of California, San Diego, CA, USA, 2010. [Google Scholar]
Figure 1. Blast Load modeling method.
Sustainability 15 14967 g001
Figure 2. Coupling method validation (simulation vs. experiment [18]).
Sustainability 15 14967 g002
Figure 3. Finite element model of the RC column (Model-F).
Sustainability 15 14967 g003
Figure 4. Finite element model of the RC column (Model-S).
Sustainability 15 14967 g004
Figure 5. RC column modeling validation.
Sustainability 15 14967 g005
Figure 6. Blast wave propagation from coupling modeling method.
Sustainability 15 14967 g006
Figure 7. Simulation process for computing residual capacity after blast load.
Sustainability 15 14967 g007
Figure 8. Effective Plastic Strain of Model-F.
Sustainability 15 14967 g008
Figure 9. Effective plastic strain of Model-S.
Sustainability 15 14967 g009
Figure 10. Time–displacement histories of RC columns.
Sustainability 15 14967 g010
Figure 11. Time–residual strength histories of RC columns.
Sustainability 15 14967 g011
Table 1. Ductility-based performance limits for RC columns.
Expected Damage Maximum   Displacement   Ductility   ( μ m a x )
Flexure Failure (Ductile)Shear Failure (Non-Ductile)
Superficial<0.9<0.7
Moderate0.9 to 10.7 to 0.8
Heavy1 to 20.8 to 0.9
Hazardous2 to 30.9 to 1
Collapse>3>1
Table 2. Residual capacity-based damage limit of RC columns.
Expected DamageResidual Capacity-Based Damage Level (D)
Superficial (=low damage)<0.2
Moderate (=medium damage)0.2 to 0.5
Heavy (=high damage)0.5 to 0.8
Collapse>0.8
Table 3. Material parameters of concrete and steel rebar.
MaterialConcrete
Compressive Strength (MPa)
Steel Yield Strength (MPa)
LongitudinalTransverse
Model-F27.12497459.5
Model-S34.75432.5432.5
Table 4. Summary of output values for RC column modeling validation.
Output
Values
Model-FModel-S
Initial Stiffness
(kN/mm)
Maximum Strength
(kN)
Strength Reduction Rate (%)Initial Stiffness
(kN/mm)
Maximum Strength
(kN)
Strength Reduction Rate (%)
Experiment11.6252.41.2353.5303.081.6
Simulation11.5279.01.1340.7318.564.9
Simulation Variation (%)0.910.512.03.65.120.4
Table 5. Information on FE column for blast evaluation.
Output ValuesModel-FModel-S
δ y (mm)32.122.9
P d e s i g n (kN)5309.33997.7
Table 6. Blast loading scenarios.
Z-Scale0.4 m/kg1/3
(Short Distance)
1.0 m/kg1/3
(Mid-Distance)
1.6 m/kg1/3
(Long Distance)
R H   m 0.9
W T N T   k g 680
R D   m 3.68.814
Table 7. Blast performance level of Model-F.
Z-ScaleDuctilityResidual
μ m a x EvaluationDEvaluation
0.4 m/kg1/3
(Short Distance)
6.88Collapse0.825Collapse
1.0 m/kg1/3
(Mid-Distance)
0.63Superficial0 *Low Damage
1.6 m/kg1/3
(Long Distance)
0.24Superficial0 *Low Damage
* ‘0’ value indicates that a residual capacity is equal to or higher than P r e s i d u a l .
Table 8. Blast performance level of Model-S.
Z-ScaleDuctilityResidual
μ m a x EvaluationDEvaluation
0.4 m/kg1/3
(Short Distance)
17.99Collapse0.874Collapse
1.0 m/kg1/3
(Mid-Distance)
4.41Collapse0.507High Damage
1.6 m/kg1/3
(Long Distance)
0.18Superficial0 *Low Damage
* ‘0’ value indicates that a residual capacity is equal to or higher than P r e s i d u a l .
Disclaimer/Publisher’s Note: The statements, opinions and data contained in all publications are solely those of the individual author(s) and contributor(s) and not of MDPI and/or the editor(s). MDPI and/or the editor(s) disclaim responsibility for any injury to people or property resulting from any ideas, methods, instructions or products referred to in the content.

