Mechanism and Empirical Evidence of Green Taxation Influencing Carbon Emissions in China’s Yangtze River Economic Belt
Abstract
:1. Introduction
2. Literature Review
3. Theoretical Analysis and Research Hypotheses
3.1. The Mechanism of the Direct Effect of Green Taxation on Carbon Emissions
3.2. The Mechanism of the Indirect Effect of Green Taxation on Carbon Emissions
4. Research Design
4.1. Model Settings
4.2. Variable Selection and Description
4.2.1. Explained (Dependent) Variables
4.2.2. Core Explanatory Variable
4.2.3. Mediating Variable
4.2.4. Threshold Variable
4.2.5. Control Variables
4.3. Data Sources and Descriptive Statistics
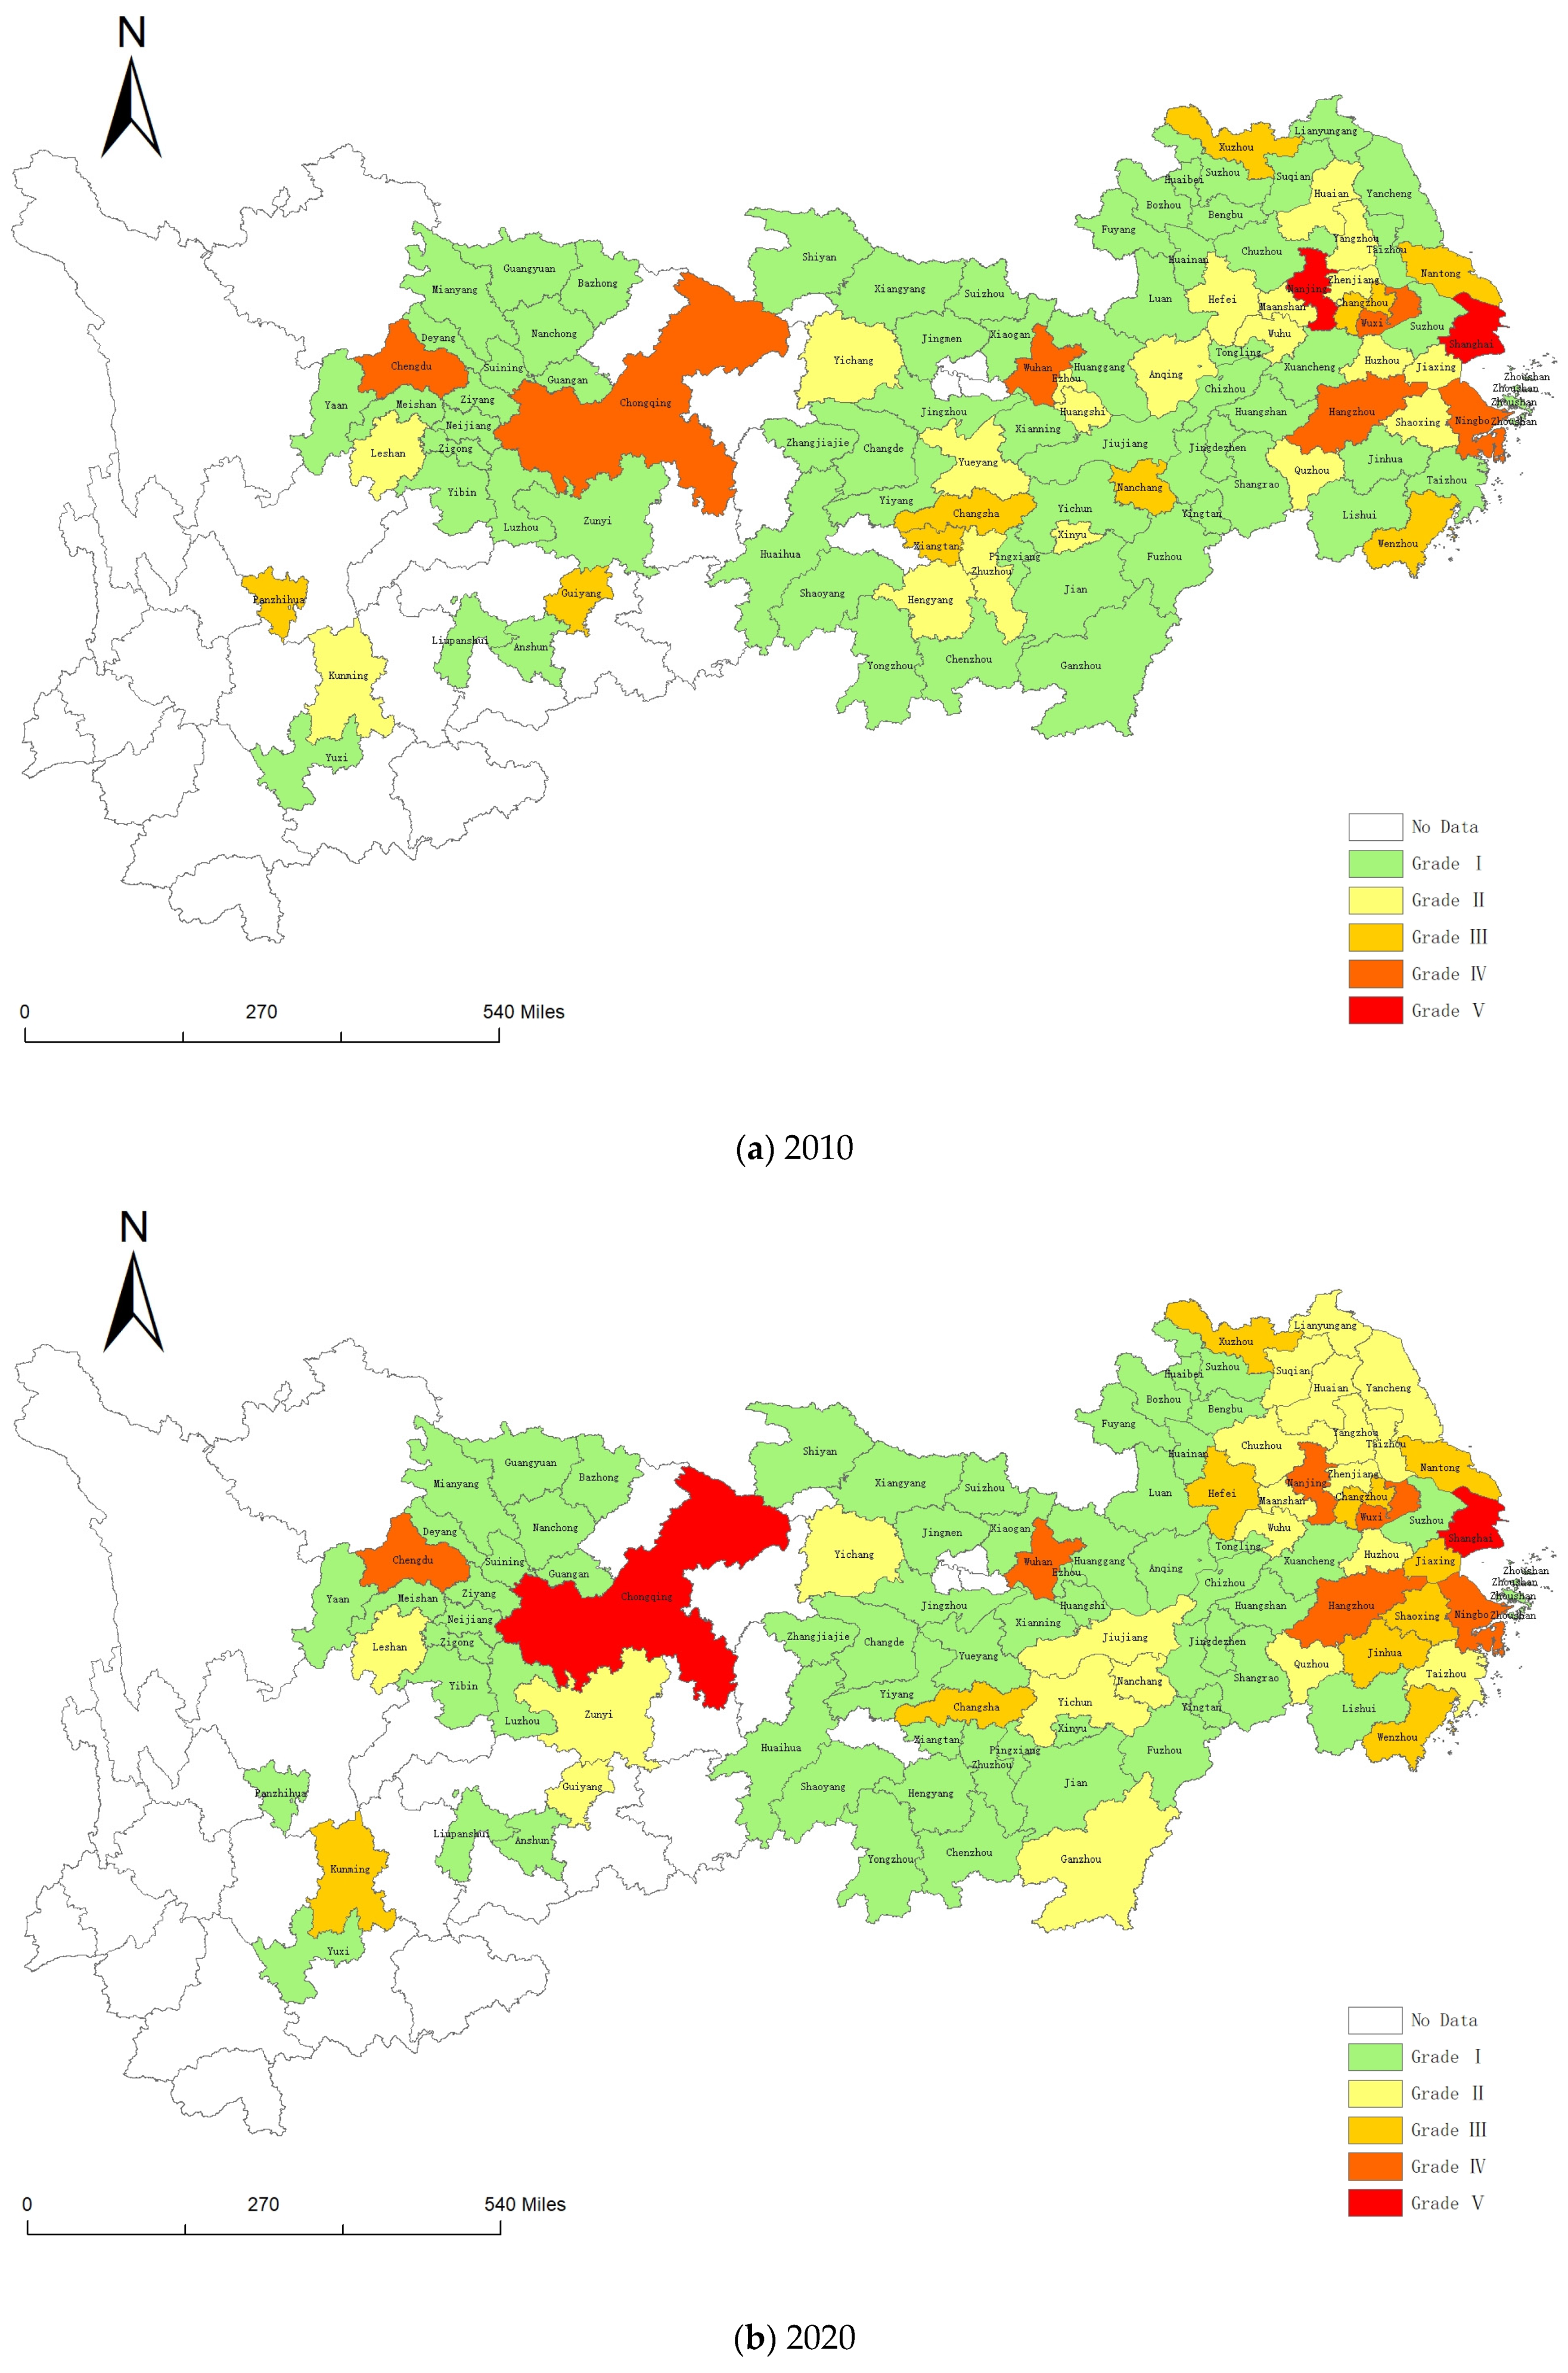
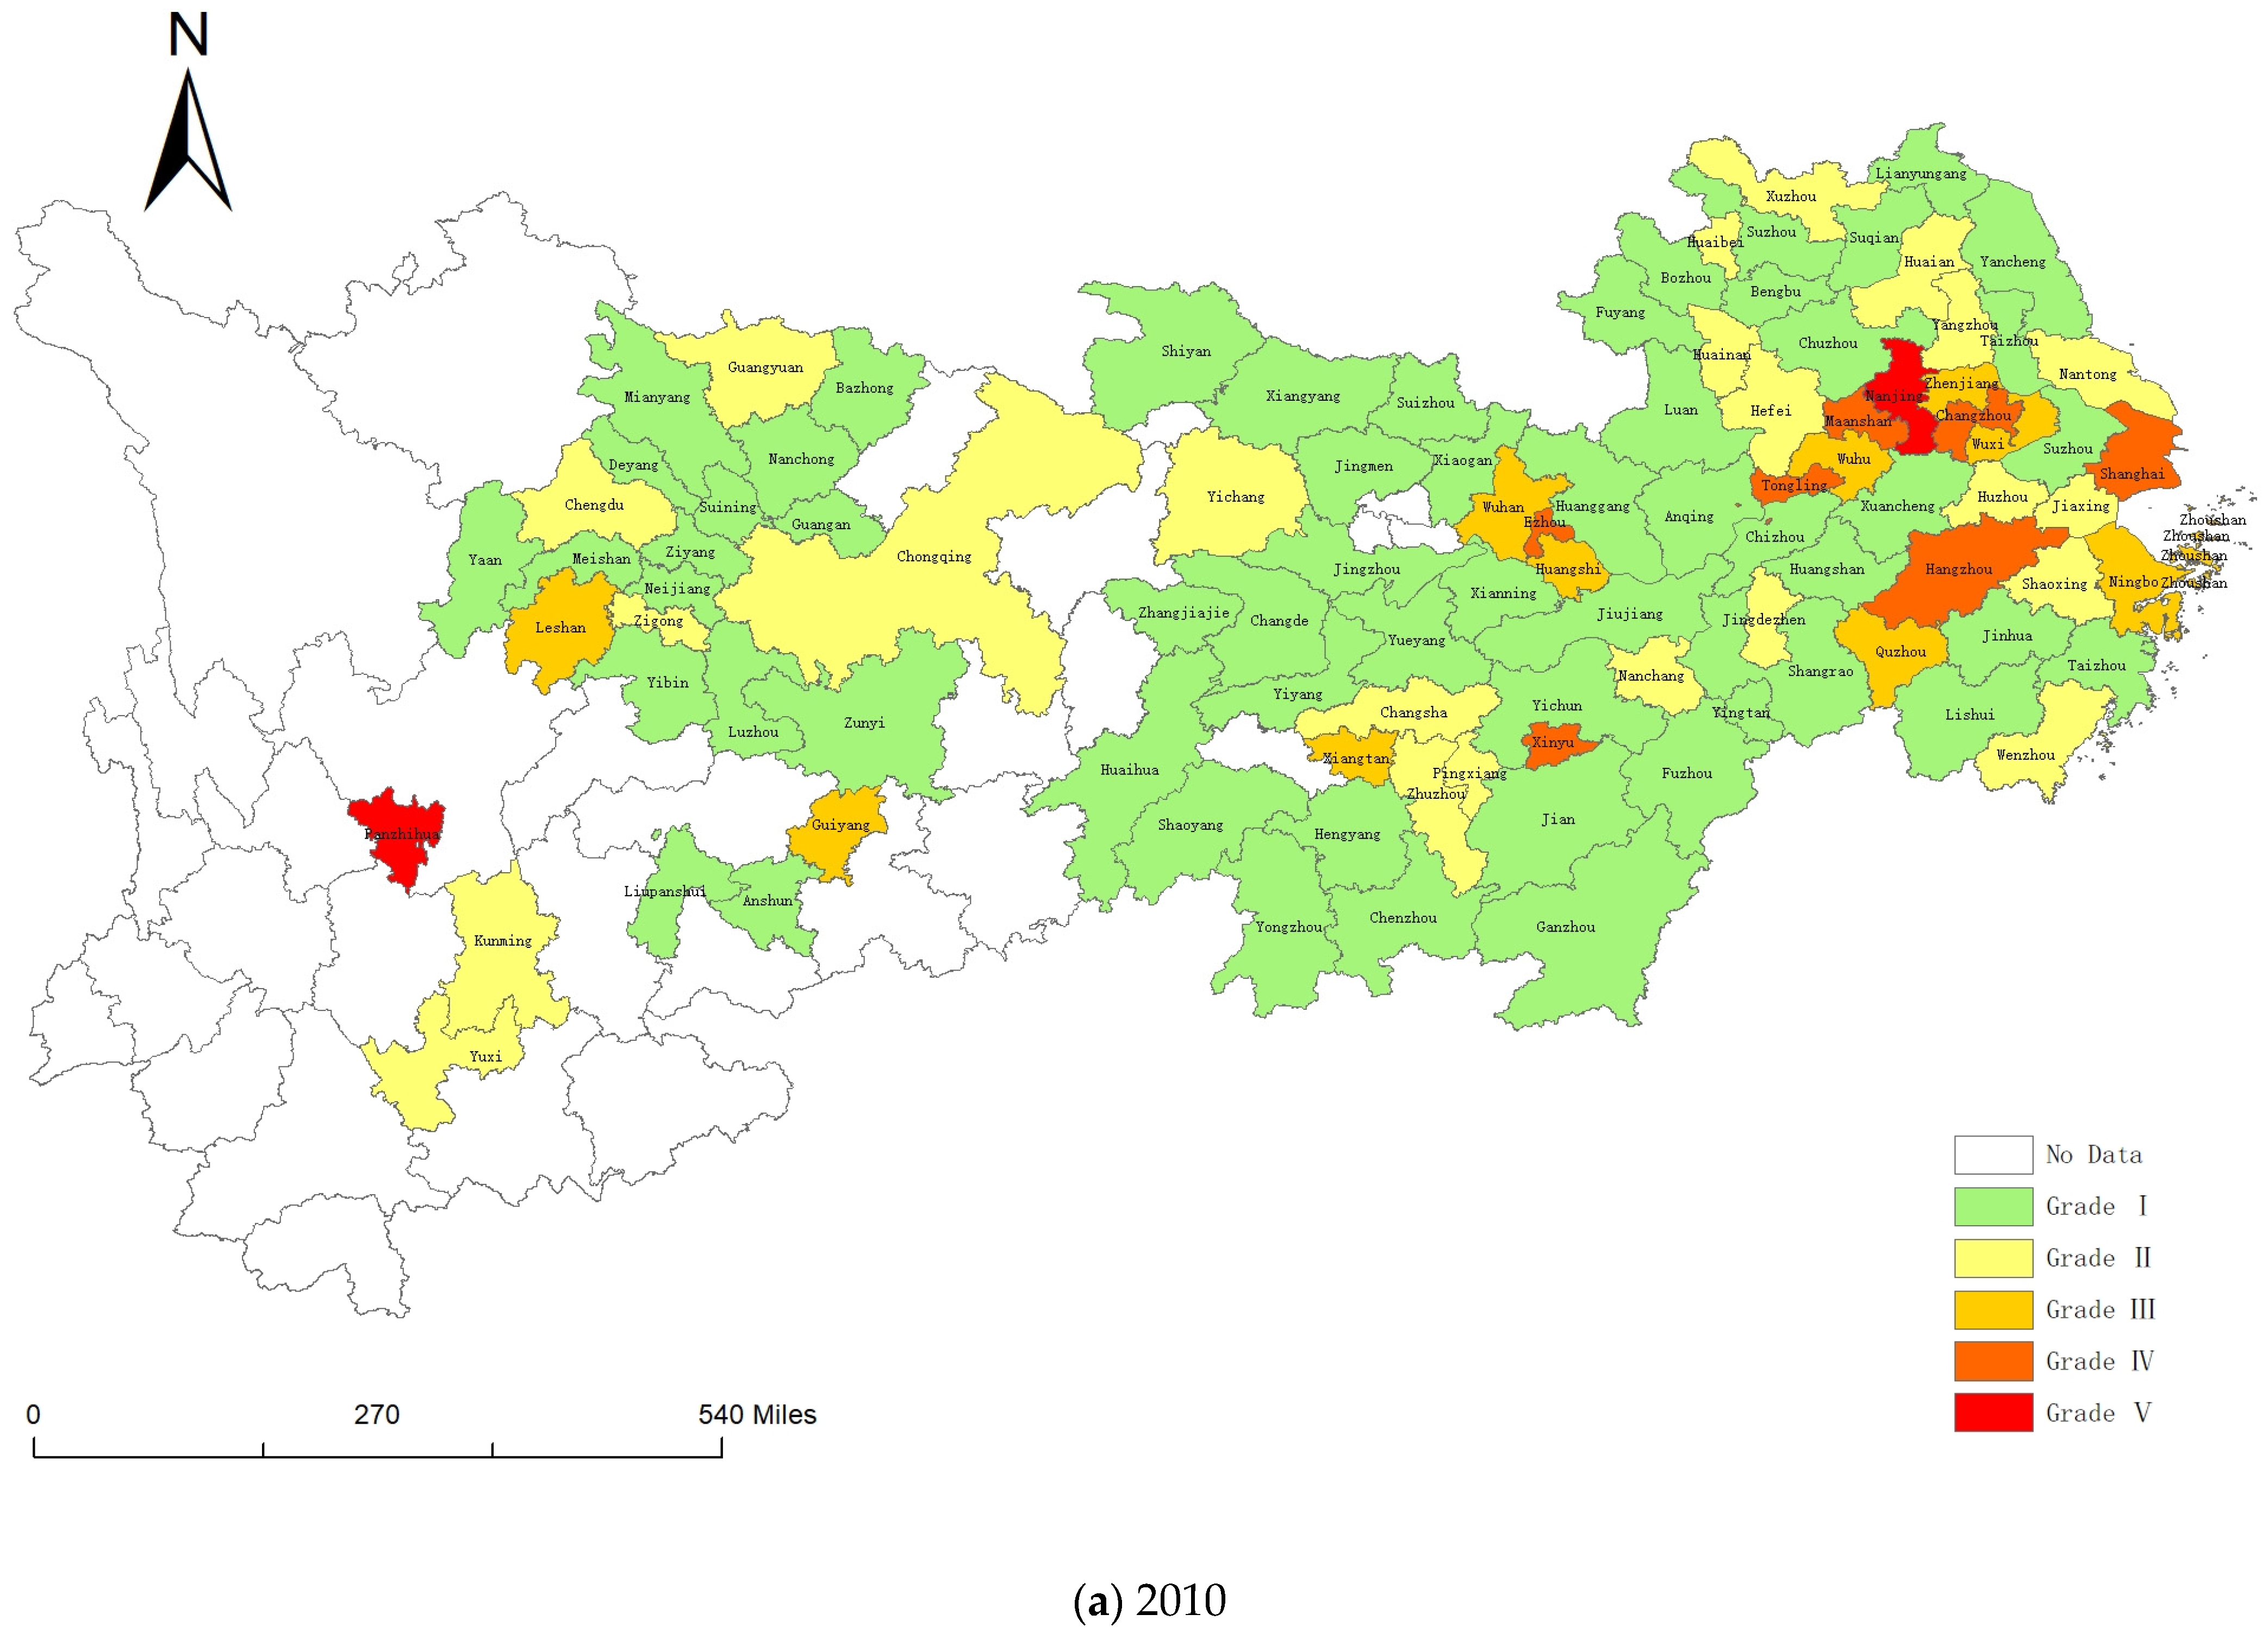
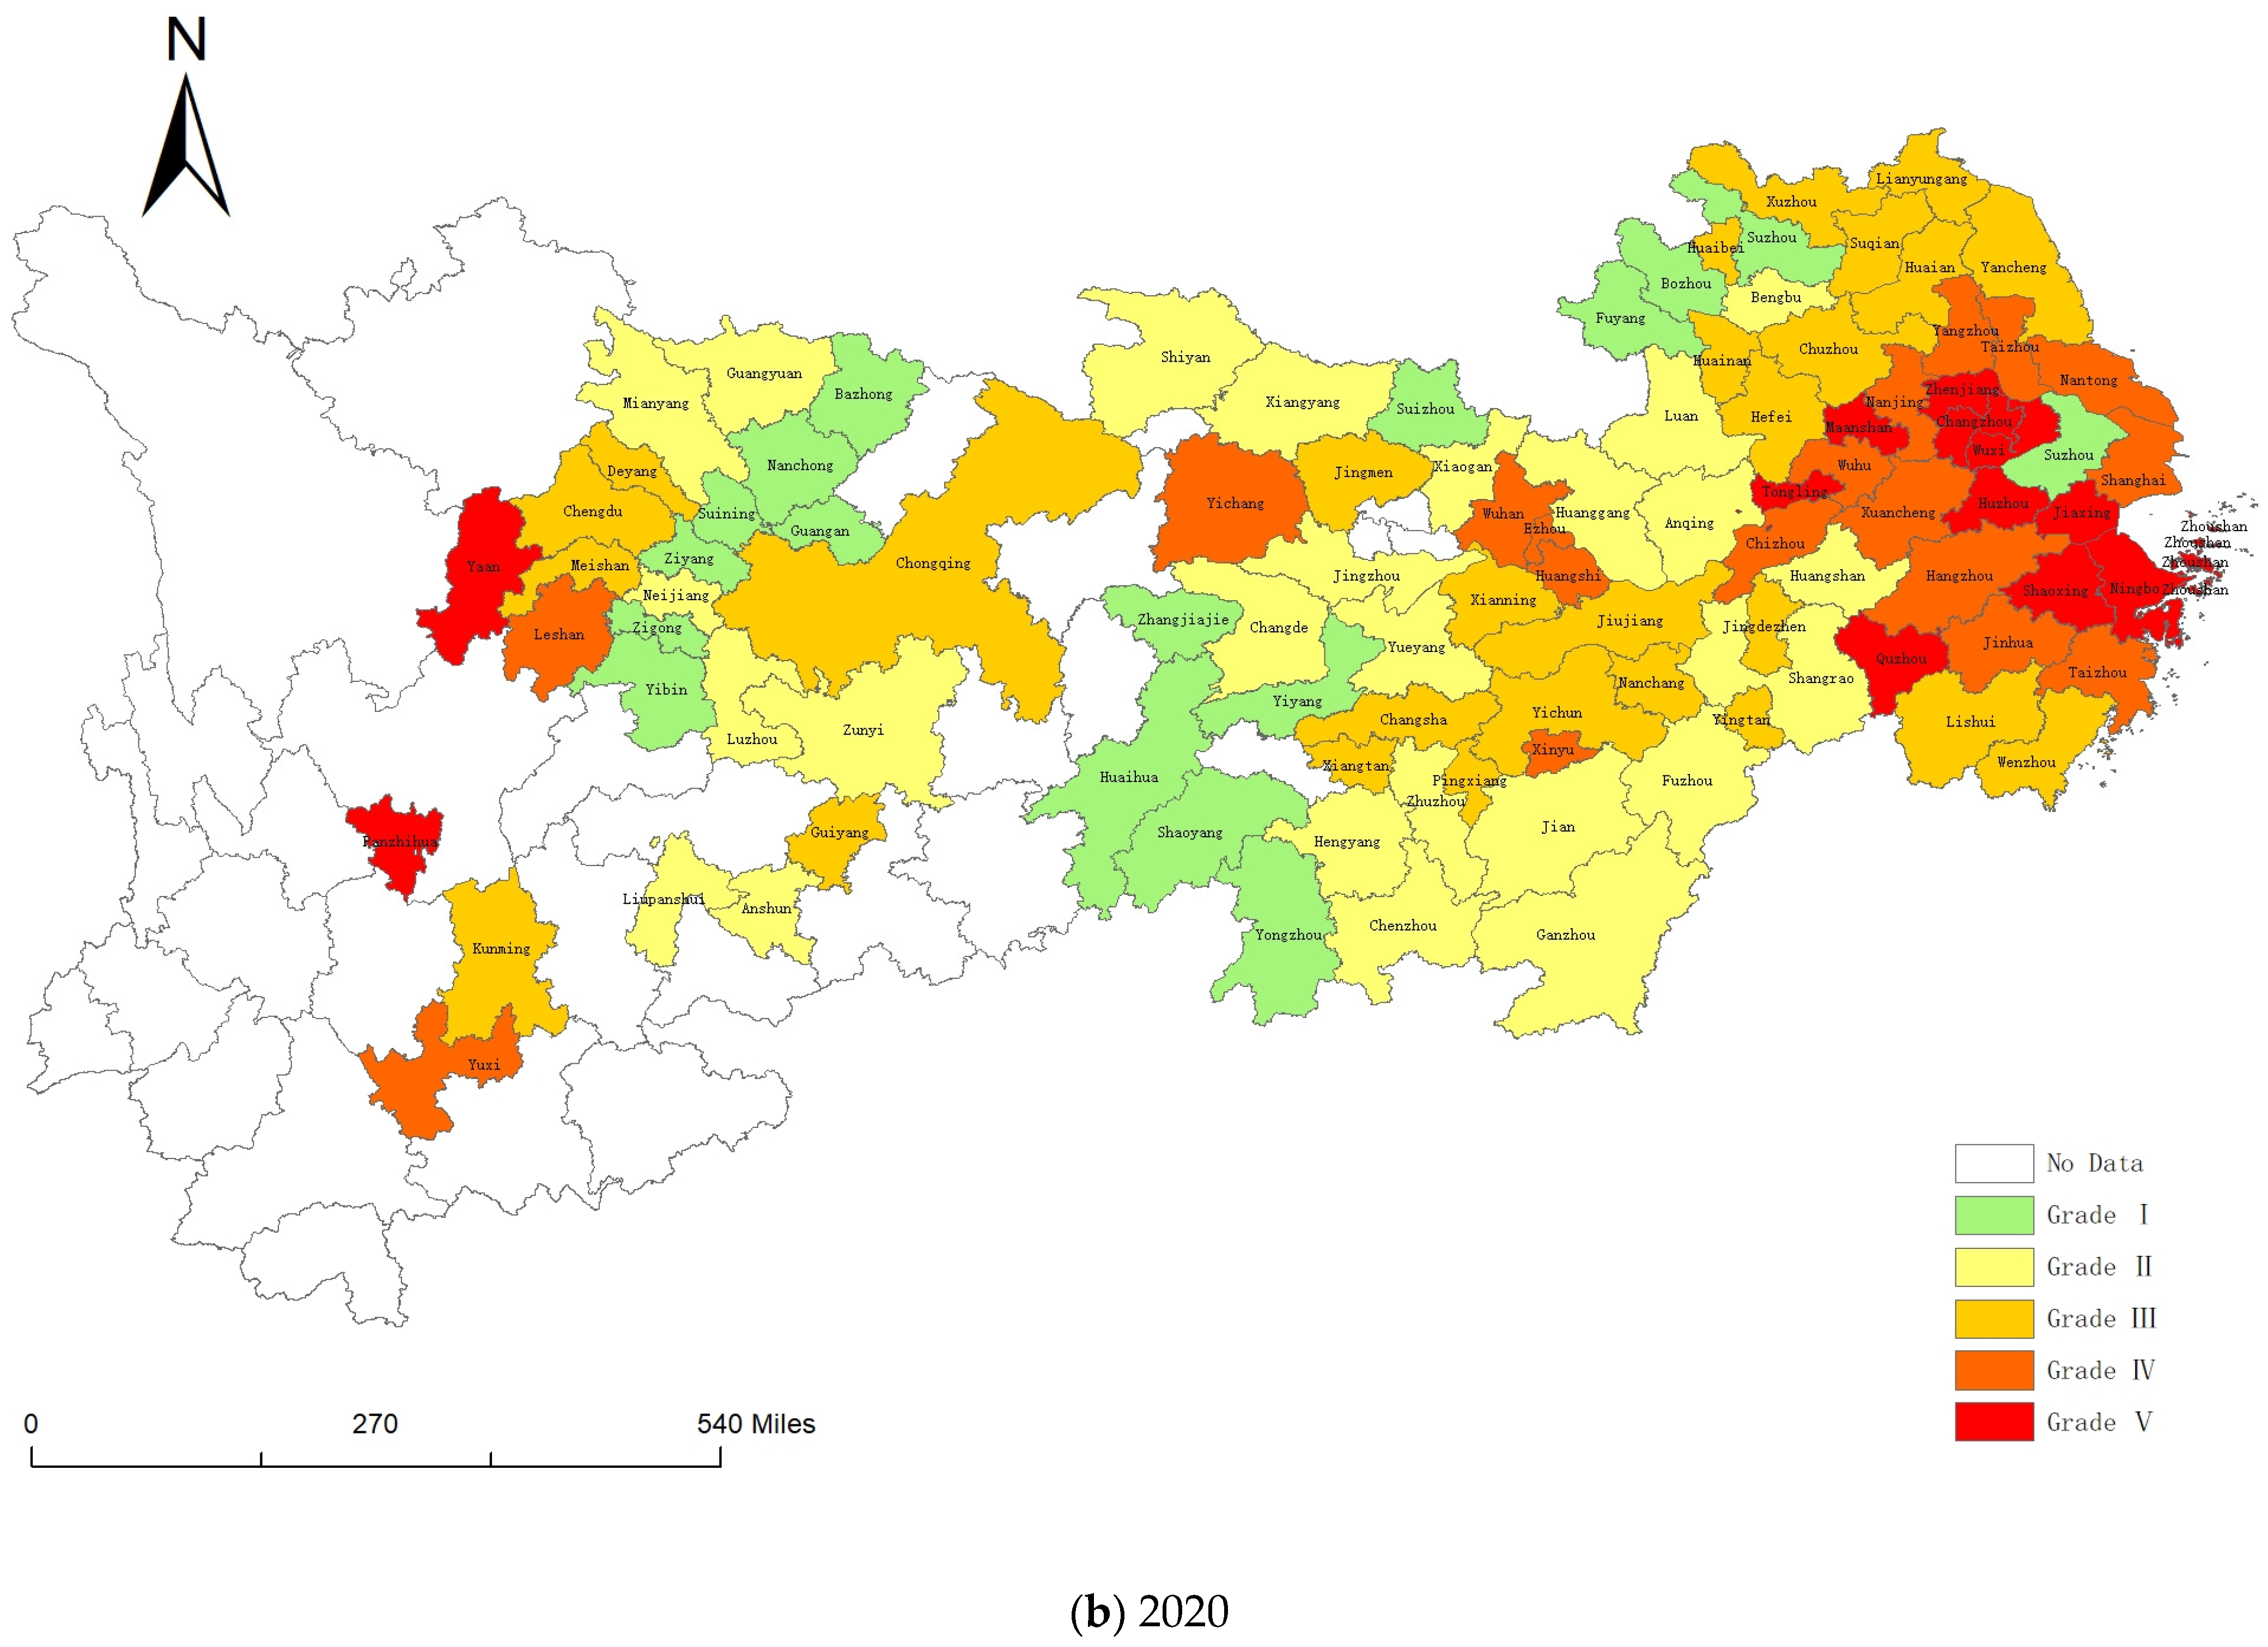
5. Analysis of Spatial and Temporal Changes in Carbon Emissions in China’s Yangtze River Economic Belt
6. Empirical Analysis
6.1. Baseline Regression Analysis
6.2. Intermediation Effect Test
6.3. Sub-Regional Heterogeneity Test
6.4. Robustness Tests
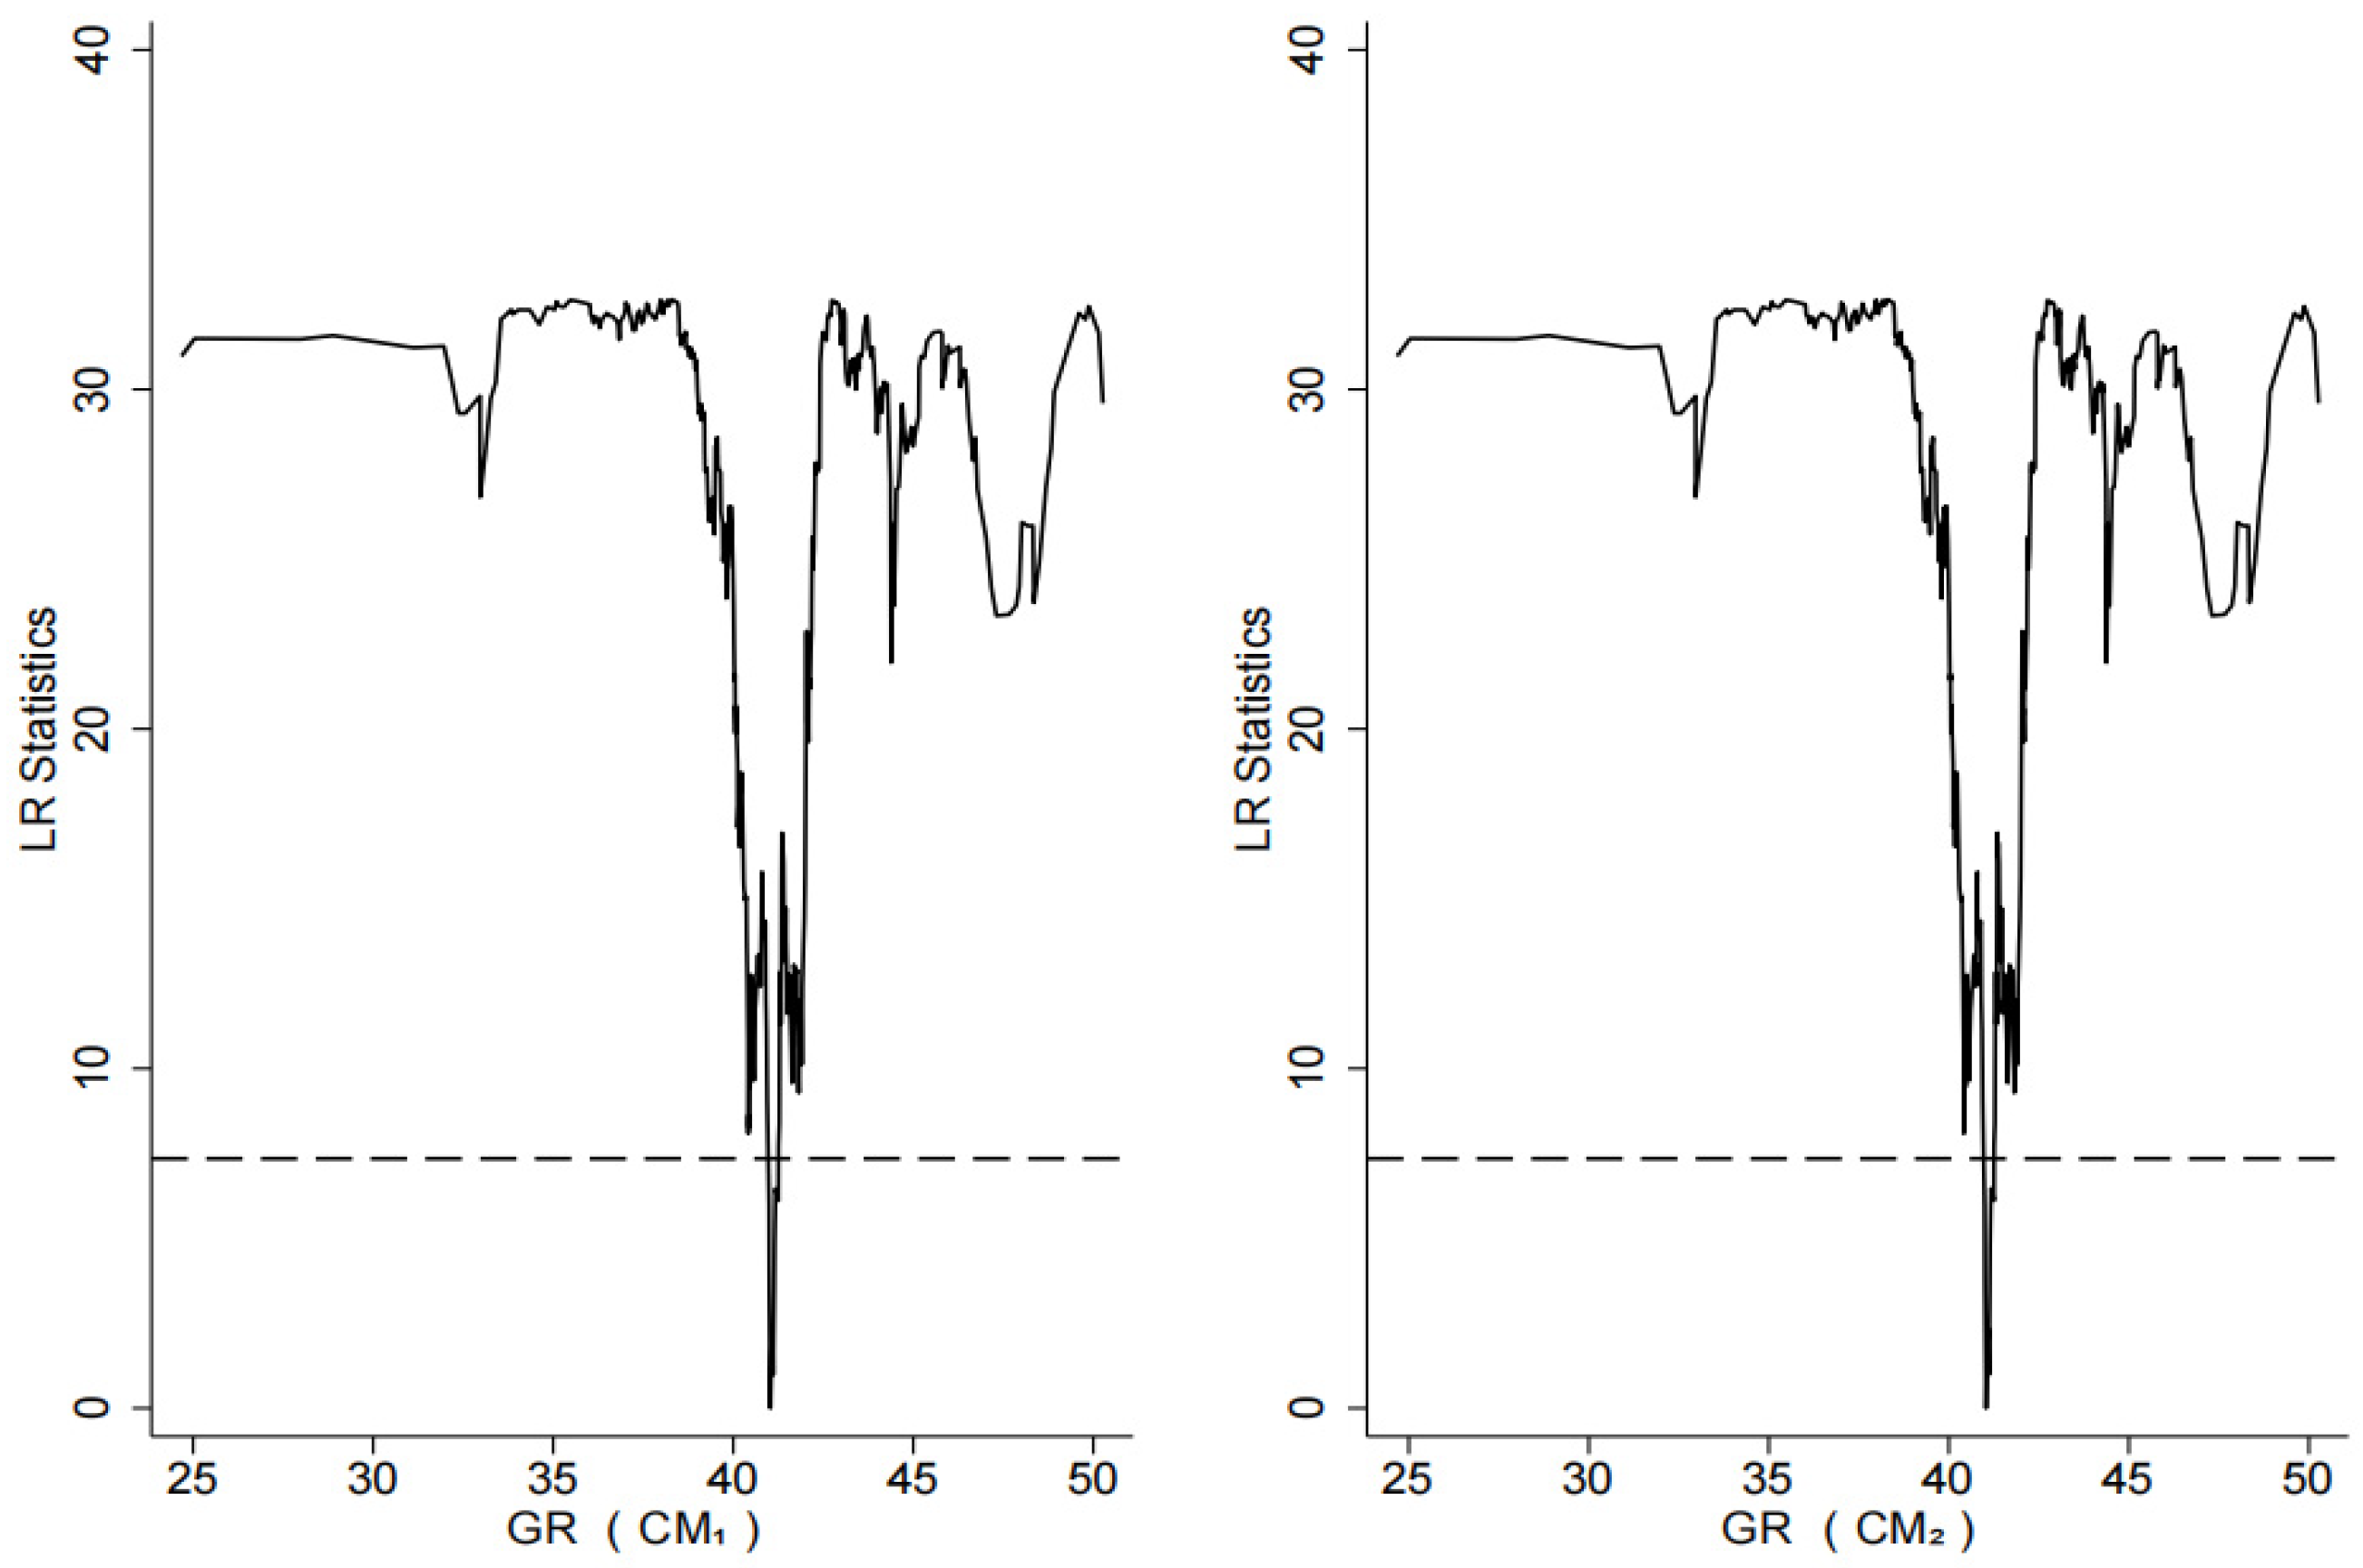
6.5. Threshold Effect Test
7. Conclusions and Recommendations
7.1. Research Conclusions
7.2. Policy Countermeasures and Recommendations
7.2.1. Differential Implementation of Green Taxation Policies
7.2.2. Investing in Green Technological Innovation
7.2.3. Cooperate to Promote Regional Low-Carbon Development
Author Contributions
Funding
Institutional Review Board Statement
Informed Consent Statement
Data Availability Statement
Conflicts of Interest
References
- Clemenz, G. Adverse selection and Pigou taxes. Environ. Resour. Econ. 1999, 13, 13–29. [Google Scholar] [CrossRef]
- Haitham, N.; Saif, U. Mapping green tax: A bibliometric analysis and visualization of relevant research. Sustain. Futures 2023, 6, 100129. [Google Scholar]
- Nakata, T.; Lamont, A. Analysis of the impacts of carbon taxes on energy systems in Japan. Energy Policy 2001, 29, 159–166. [Google Scholar] [CrossRef]
- Wissema, W.; Dellink, R. AGE analysis of the impact of a carbon energy tax on the Irish economy. Ecol. Econ. 2007, 61, 671–683. [Google Scholar] [CrossRef]
- Murray, B.; Rivers, N. British Columbia’s revenueneutral carbon tax: A review of the latest “grand experiment” in environmental policy. Energy Policy 2015, 86, 674–683. [Google Scholar] [CrossRef]
- Ploeg, F.; Withagen, C. Global Warming and the Green Paradox: A Review of Adverse Effects of Climate Policies. Oxcarre Work. Pap. 2015, 9, 285. [Google Scholar]
- Kok, R. Six years of CO2-based tax incentives for new passenger cars in The Netherlands: Impacts on purchasing behavior trends and CO2 effectiveness. Transp. Res. Part A 2015, 77, 137–153. [Google Scholar] [CrossRef]
- Zhou, Y.; Fang, W.; Li, M.; Liu, W. Exploring the impacts of a low-carbon policy instrument: A case of the carbon tax on transportation in China. Resour. Conserv. Recycl. 2018, 139, 307–314. [Google Scholar] [CrossRef]
- Kamal, M.K.U.; Mominur, M.R.; Shuvabrata, S. The impact of green tax and energy efficiency on sustainability: Evidence from Bangladesh. Energy Rep. 2023, 10, 2306–2318. [Google Scholar]
- Chen, S.Y. Marginal abatement costs and environmental tax reform in China. China Soc. Sci. 2011, 3, 85–100+222. [Google Scholar]
- Xu, Y.Z.; Yang, Y.C.; Guo, J. The path and effect of environmental regulation on carbon emission reduction—An empirical analysis based on provincial data in China. Sci. Technol. Manag. 2015, 36, 135–146. [Google Scholar]
- Tie, W.; Song, S. Research on tax policy and carbon emission based on STIRPAT model. J. Xi’an Univ. Financ. Econ. 2015, 28, 5–10. [Google Scholar]
- Wu, H. Analysis of the effect of China’s energy conservation and emission reduction tax policy. Tax. Res. 2016, 5, 58–61. [Google Scholar]
- Xu, H.C.; Zhang, X.J. Discussion on improving China’s green taxation system. Tax. Res. 2018, 9, 101–104. [Google Scholar]
- Fu, S.; Wang, J. Have green taxation policies reduced carbon emissions in China?—An empirical study based on the extended STIRPAT model. Mod. Econ. Inq. 2018, 2, 72–78. [Google Scholar]
- Zhou, D.; Luo, D.Q. The impact of industrial structure change on carbon emissions in China from the perspective of green taxation. Resour. Sci. 2021, 43, 693–709. [Google Scholar]
- Li, B.L.; Xiao, J.G. Green taxation to promote “carbon peaking” and “carbon neutrality”. China Tax. 2021, 5, 62–63. [Google Scholar]
- Ehrlich, P.R.; Holden, J.P. Impact of population growth. Science 1971, 171, 1212–1217. [Google Scholar] [CrossRef]
- Dietz, T.; Rosa, E.A. Rethinking the environmental impacts of population, affluence, and technology. Hum. Ecol. Rev. 1994, 1, 277–300. [Google Scholar]
- Xiang, J. Analysis and Prediction of Factors Influencing Carbon Emissions in Shenmu City, Shaanxi Province. Master’s Thesis, Shanghai University of Applied Technology, Shanghai, China, 2022. [Google Scholar]
- Ren, X.S.; Liu, Y.J.; Zhao, G.H. Impact of economic agglomeration on carbon emission intensity and transmission mechanism. China Popul.-Resour. Environ. 2020, 30, 95–106. [Google Scholar]
- Wu, J.X.; Guo, Z.Y. Convergence analysis of carbon emissions in China based on continuous dynamic distribution method. Stat. Res. 2016, 33, 54–60. [Google Scholar]
- Tao, F.; Zhao, J.Y.; Zhou, H. Does environmental regulation achieve “incremental improvement” in green technology innovation? Has environmental regulation achieved “incremental improvement” in green technology innovation—Evidence from the environmental protection target responsibility system. China Ind. Econ. 2021, 2, 136–154. [Google Scholar]
- Shi, M.X.; Liu, N. Can tax greening reduce carbon emissions?—An empirical analysis based on provincial panel data in China. Fisc. Sci. 2022, 10, 98–112. [Google Scholar]
- Wang, T.; Umar, M.; Li, M.; Shan, S. Green finance and clean taxes are the ways to curb carbon emissions: An OECD experience. Energy Econ. 2023, 124, 106842. [Google Scholar] [CrossRef]
- Zhang, H.M.; Yuan, P.F.; Zhu, Z.S. Population size, industrial agglomeration and carbon emissions in Chinese cities. China Environ. Sci. 2021, 41, 2459–2470. [Google Scholar]
- Hu, J.H.; Jiang, X. Study on the effect of urbanization on carbon emission from the perspective of urban agglomeration. J. China Univ. Geosci. (Soc. Sci. Ed.) 2015, 15, 11–21. [Google Scholar]
- Shi, B.Z.; Li, J.T. Does the Internet promote the division of labor: Evidence from Chinese manufacturing firms. Manag. World 2020, 36, 130–149. [Google Scholar]
- Tan, X.C.; Gao, J.X.; Zeng, A.; Xing, X.C. Assessment of the impact of green financial reform and innovation pilot zone policies on carbon emissions. Adv. Clim. Chang. Res. 2023, 19, 213–226. [Google Scholar]
- Zhang, C.L.; Zhang, F. The impact of ecological protection and industrial structure upgrading on carbon emissions--empirical evidence based on the data of China’s Yangtze River Economic Belt. Stat. Decis. Mak. 2022, 38, 77–80. [Google Scholar]
- Hansen, B.E. Threshold Effect in Non-dynamic Panels: Estimation, Testing and Inference. J. Econom. 1999, 93, 345–368. [Google Scholar] [CrossRef]


| Type of Energy | Gas | Liquefied Petroleum Gas | Social Electricity Consumption | Raw Coal |
|---|---|---|---|---|
| Carbon emission factors | 2.16225 | 3.1013 | 1.3203 | 1.9003 |
| Unit | /m3 | /kg | /kW·h | /kg |
| Variable Types | Name of Variable | Variable Symbols | Variable Definition | Data Processing Methods |
|---|---|---|---|---|
| Explained variables | Total carbon emissions | CM1 | Regional CO2 emissions | Take logarithm |
| Per capita carbon intensity | CM2 | Take logarithm | ||
| Explanatory variable | Green taxation intensity | GT | Actual value, winsorize | |
| Mediating variable | Level of green technology innovation | Patent | Green patent applications | Take logarithm |
| Threshold Variable | City greening level | GR | Greening coverage rate of urban built-up areas | Actual value |
| Control variables | Level of economic development | RGDP | Take logarithm | |
| Size of population | P | Regional year-end resident population | Take logarithm | |
| Level of urbanization | Ubr | Actual value, winsorize | ||
| Industrial structure | Ind | Output value of primary industry × 1 + output value of secondary industry × 2 + output value of tertiary industry × 3 | Take logarithm | |
| Energy intensity | Ener | Take logarithm | ||
| Level of external opening | Open | Actual value, winsorize |
| Variable Types | Variable Symbols | Mean Value | Standard Deviation | Min. Value | Max. Value | Number of Observations |
|---|---|---|---|---|---|---|
| Explained variables | CM1 | 15.555 | 1.150 | 12.721 | 18.834 | 1100 |
| CM2 | 9.542 | 0.983 | 6.620 | 11.559 | 1100 | |
| Explanatory variable | GT | 18.714 | 6.461 | 5.687 | 39.162 | 1100 |
| Mediating variable | Patent | 5.625 | 1.610 | 1.609 | 9.821 | 1100 |
| Threshold variable | GR | 40.933 | 4.390 | 14 | 57.103 | 1100 |
| Control variables | RGDP | 10.734 | 0.593 | 9.062 | 12.101 | 1100 |
| P | 6.013 | 0.644 | 4.282 | 8.074 | 1100 | |
| Ubr | 55.282 | 12.418 | 29.085 | 87.200 | 1100 | |
| Ind | 17.577 | 0.954 | 15.482 | 20.778 | 1100 | |
| Ener | 6.441 | 0.600 | 4.497 | 8.751 | 1100 | |
| Open | 16.530 | 21.127 | 0.458 | 108.042 | 1100 |
| Variables | Model (1) | Model (2) |
|---|---|---|
| L.CM1 | 0.116 *** (0.013) | |
| L.CM2 | 0.106 *** (0.014) | |
| GT | −0.008 *** (0.002) | −0.009 *** (0.003) |
| RGDP | 0.460 *** (0.159) | 0.436 *** (0.160) |
| P | 0.313 * (0.185) | −0.623 *** (0.180) |
| Ubr | −0.017 *** (0.005) | −0.016 *** (0.005) |
| Ind | 0.592 *** (0.182) | 0.611 *** (0.180) |
| Ener | 0.994 *** (0.019) | 1.001 *** (0.019) |
| Open | 0.001 (0.001) | 0.001 (0.001) |
| _Cons | −8.787 *** (0.720) | −8.520 *** (0.713) |
| AR (1) | 0.012 | 0.028 |
| AR (2) | 0.309 | 0.396 |
| Hansen test | 0.636 | 0.176 |
| N | 1000 | 1000 |
| Variables | Model (3) | Model (4) | Model (5) |
|---|---|---|---|
| Patent | |||
| L.Patent | 0.424 *** (0.057) | ||
| L.CM1 | 0.082 *** (0.017) | ||
| L.CM2 | 0.081 *** (0.017) | ||
| GT | 0.016 *** (0.005) | −0.005 ** (0.002) | −0.006 ** (0.002) |
| Patent | −0.088 *** (0.024) | −0.088 *** (0.023) | |
| _Cons | −13.740 *** (2.841) | −11.271 *** (1.094) | −11.221 *** (1.050) |
| Control variables | Yes | Yes | Yes |
| AR (1) | 0.000 | 0.003 | 0.003 |
| AR (2) | 0.873 | 0.286 | 0.315 |
| Hansen test | 0.623 | 0.997 | 0.996 |
| N | 1000 | 1000 | 1000 |
| Green Technology Innovation Level | Total Carbon Emissions | Carbon Emissions Intensity per Capita |
|---|---|---|
| Indirect (intermediary) effects | −0.001408 | −0.001408 |
| Direct effects | −0.005 | −0.006 |
| Total effects | −0.008 | −0.009 |
| Intermediary effect/Total effect | 0.176 | 0.156 |
| Variables | Upstream | Midstream | Downstream | |||
|---|---|---|---|---|---|---|
| Model (6) | Model (7) | Model (8) | Model (9) | Model (10) | Model (11) | |
| L.CM1 | 0.098 *** (0.029) | 0.175 *** (0.033) | 0.090 *** (0.025) | |||
| L.CM2 | 0.126 *** (0.044) | 0.185 *** (0.031) | 0.082 *** (0.022) | |||
| GT | −0.010 * (0.005) | −0.009 * (0.005) | −0.012 ** (0.006) | −0.009 ** (0.004) | −0.014 *** (0.003) | −0.014 *** (0.003) |
| RGDP | 0.036 (0.184) | 0.221 (0.396) | 0.065 (0.461) | 0.145 (0.513) | 0.689 *** (0.216) | 0.706 *** (0.227) |
| P | −0.131 (0.190) | −0.972 *** (0.300) | 0.003 (0.402) | −0.743 * (0.417) | 0.534 *** (0.202) | −0.365 * (0.216) |
| Ubr | −0.011 (0.006) | −0.020 (0.018) | −0.016 ** (0.006) | −0.016 ** (0.006) | −0.007 * (0.004) | −0.007 * (0.004) |
| Ind | 1.004 *** (0.195) | 0.934 *** (0.264) | 0.863 ** (0.401) | 0.794 * (0.423) | 0.278 (0.198) | 0.269 (0.208) |
| Ener | 0.916 *** (0.055) | 0.911 *** (0.081) | 0.960 *** (0.037) | 0.947 *** (0.046) | 1.016 *** (0.032) | 1.021 *** (0.030) |
| Open | −0.003 (0.004) | −0.004 (0.004) | 0.004 (0.003) | 0.004 * (0.002) | 0.000 (0.001) | −0.000 (0.001) |
| _Cons | −8.364 *** (1.070) | −9.231 *** (2.496) | −8.084 *** (1.062) | −8.291 *** (0.987) | −7.196 *** (0.557) | −7.230 *** (0.581) |
| AR (1) | 0.087 | 0.066 | 0.008 | 0.013 | 0.055 | 0.058 |
| AR (2) | 0.132 | 0.184 | 0.131 | 0.112 | 0.290 | 0.286 |
| Hansen test | 0.421 | 0.780 | 0.372 | 0.629 | 0.850 | 0.872 |
| N | 240 | 240 | 350 | 350 | 410 | 410 |
| Variables | Model (12) | Model (13) | Model (14) | Model (15) |
|---|---|---|---|---|
| L.CM1 | 0.118 *** (0.013) | 0.096 *** (0.013) | ||
| L.CM2 | 0.115 *** (0.013) | 0.090 *** (0.013) | ||
| GT | −0.007 *** (0.002) | −0.008 *** (0.002) | ||
| GT′ | −0.162 *** (0.035) | −0.184 *** (0.038) | ||
| RGDP | 0.468 *** (0.161) | 0.438 *** (0.165) | 0.608 *** (0.156) | 0.665 *** (0.182) |
| P | 0.341 * (0.185) | −0.569 *** (0.183) | 0.452 *** (0.172) | −0.389 * (0.207) |
| Ubr | −0.016 *** (0.005) | −0.016 *** (0.005) | −0.017 *** (0.005) | −0.016 *** (0.005) |
| Ind | 0.560 *** (0.182) | 0.591 *** (0.183) | 0.638 *** (0.172) | 0.581 *** (0.201) |
| Ener | 0.995 *** (0.020) | 0.999 *** (0.021) | 0.976 *** (0.020) | 1.002 *** (0.022) |
| Open | 0.001 (0.001) | 0.001 (0.001) | 0.003 *** (0.001) | 0.003 *** (0.001) |
| _Cons | −8.603 *** (0.694) | −8.637 *** (0.718) | −9.810 *** (0.779) | −9.685 *** (0.721) |
| AR (1) | 0.013 | 0.021 | 0.011 | 0.026 |
| AR (2) | 0.261 | 0.301 | 0.227 | 0.207 |
| Hansen test | 0.771 | 0.751 | 0.615 | 0.424 |
| N | 980 | 980 | 1000 | 1000 |
| Number of Thresholds | Explained Variables | F-Value | p-Value | Threshold Value | BS Times | ||
|---|---|---|---|---|---|---|---|
| 10% | 5% | 1% | |||||
| Single Threshold | 32.89 | 0.004 | 19.1479 | 22.1648 | 29.4542 | 1000 | |
| 32.89 | 0.005 | 19.1799 | 23.3812 | 30.3017 | 1000 | ||
| Double Threshold | 8.10 | 0.584 | 16.0445 | 18.3095 | 26.4101 | 1000 | |
| 8.10 | 0.609 | 15.8683 | 18.0282 | 24.6651 | 1000 | ||
| Three-fold threshold | 8.32 | 0.728 | 20.9289 | 24.4644 | 32.0346 | 1000 | |
| 8.32 | 0.753 | 21.1569 | 24.1466 | 30.0274 | 1000 | ||
| Explained Variables | Threshold Values | 95% Confidence Interval |
|---|---|---|
| Total carbon emissions | 41.0308 | [40.9701, 41.0612] |
| Carbon emission intensity per capita | 41.0308 | [40.9701, 41.0612] |
| Variable | ||||
|---|---|---|---|---|
| Regression Coefficient | t-Value | Regression Coefficient | t-Value | |
| lnGT·I (GR ≤ 41.0308) | −0.00848 *** | (0.00107) | −0.00848 *** | (0.00107) |
| lnGT·I (GR > 41.0308) | −0.00574 *** | (0.00107) | −0.00574 *** | (0.00107) |
| RGDP | 0.612 *** | (0.0471) | 0.612 *** | (0.0471) |
| P | 0.672 *** | (0.0639) | −0.328 *** | (0.0639) |
| Ubr | 0.00336 * | (0.00188) | 0.00336 * | (0.00188) |
| Ind | 0.302 *** | (0.0435) | 0.302 *** | (0.0435) |
| Ener | 1.032 *** | (0.00937) | 1.032 *** | (0.00937) |
| Open | 0.000108 | (0.000676) | 0.000108 | (0.000676) |
| _Cons | −7.073 *** | (0.386) | −7.073 *** | (0.386) |
Disclaimer/Publisher’s Note: The statements, opinions and data contained in all publications are solely those of the individual author(s) and contributor(s) and not of MDPI and/or the editor(s). MDPI and/or the editor(s) disclaim responsibility for any injury to people or property resulting from any ideas, methods, instructions or products referred to in the content. |
© 2023 by the authors. Licensee MDPI, Basel, Switzerland. This article is an open access article distributed under the terms and conditions of the Creative Commons Attribution (CC BY) license (https://creativecommons.org/licenses/by/4.0/).
Share and Cite
Fang, X.; Wei, M.; Huang, W.-C. Mechanism and Empirical Evidence of Green Taxation Influencing Carbon Emissions in China’s Yangtze River Economic Belt. Sustainability 2023, 15, 14983. https://doi.org/10.3390/su152014983
Fang X, Wei M, Huang W-C. Mechanism and Empirical Evidence of Green Taxation Influencing Carbon Emissions in China’s Yangtze River Economic Belt. Sustainability. 2023; 15(20):14983. https://doi.org/10.3390/su152014983
Chicago/Turabian StyleFang, Xingcun, Mengting Wei, and Wei-Chiao Huang. 2023. "Mechanism and Empirical Evidence of Green Taxation Influencing Carbon Emissions in China’s Yangtze River Economic Belt" Sustainability 15, no. 20: 14983. https://doi.org/10.3390/su152014983
APA StyleFang, X., Wei, M., & Huang, W.-C. (2023). Mechanism and Empirical Evidence of Green Taxation Influencing Carbon Emissions in China’s Yangtze River Economic Belt. Sustainability, 15(20), 14983. https://doi.org/10.3390/su152014983


