Article

Greenhouse Gas (GHG) Emission Estimation for Cattle: Assessing the Potential Role of Real-Time Feed Intake Monitoring

1
Ruminant Nutrition and Anaerobe Laboratory, Department of Animal Science and Technology, Sunchon National University, Suncheon 57922, Republic of Korea
2
Department of Animal Science, College of Agriculture and Forestry, Tarlac Agricultural University, Camiling 2306, Tarlac, Philippines
*
Authors to whom correspondence should be addressed.
Sustainability 2023, 15(20), 14988; https://doi.org/10.3390/su152014988
Submission received: 19 July 2023 / Revised: 2 October 2023 / Accepted: 12 October 2023 / Published: 18 October 2023

Abstract

:
This study investigated the impact of feeding systems on the determination of enteric methane (CH4) emissions factor in cattle. Real-time feed intake data, a crucial CH4 conversion rate (Ym value) parameter, were obtained using a roughage intake control (RIC) unit within a smart farm system. Greenhouse gas (GHG) emissions, including CH4 and carbon dioxide (CO2), from Holstein steers were monitored using a GreenFeed (GF) 344 unit. The results revealed satisfactory body weight (383 ± 57.19 kg) and daily weight gain (2.00 ± 0.83 kg), which are crucial factors. CO2 production exhibited positive correlations with the initial body weight (r = 0.72, p = 0.027), feed intake (r = 0.71, p = 0.029), and feed conversion ratio (r = 0.69, p = 0.036). Five different emission factors (EFs), EFA (New Equation 10.21A) and Equation 10.21 (EFB, EFC, EFD, and EFE), were used for GHG calculations following the Intergovernmental Panel on Climate Change (IPCC) Tier 2 approach. The estimated CH4 EFs using these equations were 69.91, 69.91, 91.79, 67.26, and 42.60 kg CH4/head/year. These findings highlight the potential for further exploration and adoption of smart farming technology, which has the potential to enhance prediction accuracy and reduce the uncertainty in Ym values tailored to specific countries or regions.

1. Introduction

In addition to carbon dioxide (CO2), other greenhouse gases (GHG) contribute to the ongoing global climate change. Methane (CH4), nitrous oxide (N2O), and trace gases, collectively known as the ‘F-gases’, have played a significant role in global warming. Recent data from South Korea have revealed substantial production of GHG, owing to its manufacturing-oriented industrial infrastructure, resulting in per capita gas accumulation. CO2 emissions increased from 11.53 t to 11.89 t between 2020 and 2021, while per capita CH4 emissions slightly increased from 0.77 t to 0.78 t [1]. Furthermore, ruminants, such as cattle and sheep, and their manure contribute to GHG emissions through enteric fermentation, with CH4 as a by-product. These sources account for 5.8% of the global GHG emissions, whereas grasslands sequester carbon at a rate of 0.1%. Estimating rumen fermentation rates provides crucial information regarding CH4 production as a by-product, which is relevant to the nutritional value of specific feeds. Approximately 90% of the CH4 emitted by ruminants originates in the rumen, although it can also occur in the lower gastrointestinal tract [2]. Methane is absorbed in the blood and excreted through the lungs via exhalation from the mouth and nose.
Various approaches have been proposed to minimize the adverse environmental impacts of agriculture and livestock. One important aspect of mitigating GHG emissions in agriculture is the development of strategies to reduce and accurately measure GHG emissions [3,4]. Livestock farming intensification, which encompasses housing, water, nutrition, veterinary care, temperature, humidity, and management, aims to maximize profits from rearing. However, in some developing countries, these practices are outdated [5]. Additionally, increasing interest is in establishing resilient and sustainable agricultural systems to promote precision livestock farming, urging farmers to maximize production efficiency [6].
Efforts to reduce enteric CH4 emissions necessitate accurately assessing emissions from specific animals [7]. Various techniques are available for measuring ruminant CH4 emissions, each with its application range. The sulfur hexafluoride (SF6) tracer technique provides insights into quantifying the sources and sinks of CH4 in the troposphere [8]. The respiration chamber (RC) is considered the standard method; however, it is expensive and not readily portable [9]. However, this study used GreenFeed (GF) technology, which involves spot sampling the eructated and exhaled gases. This enables the measurement of enteric CH4 production in many animals under farm conditions [10]. Operating on the same fundamental principle as RC, the GF system can be programmed to dispense small quantities of pelleted feed to individual animals. This allows animals to visit multiple times per day, allowing the measurement of CH4 production and various other exhaled gases.
Animal feeding behavior is influenced by several environmental factors, including feeding systems, feed type, and feed availability [11]. Some studies have found that estimates of CH4 emissions for the same animals differed between the two experimental locations, indicating that specialized knowledge of feeding behavior, affecting feed intake and methane production, may vary under different nutritional conditions [12]. Accuracy is crucial for investigating the efficiency and sustainability of animal production. Thus, this study aimed to document and understand the growth performance of individual animals in terms of GHG emissions and to explore the extent to which these variables are influenced by an advanced feeding system and GF technology. It has been hypothesized that advanced feeding systems incorporating radio transponder technology enable the accurate measurement of individual feed intake.

2. Materials and Methods

All animals used in this study were approved by the Sunchon National University (SCNU) Institutional Animal Care and Use Committee (SCNU-IACUC; approval number: SCNU-IACUC-2022-06).

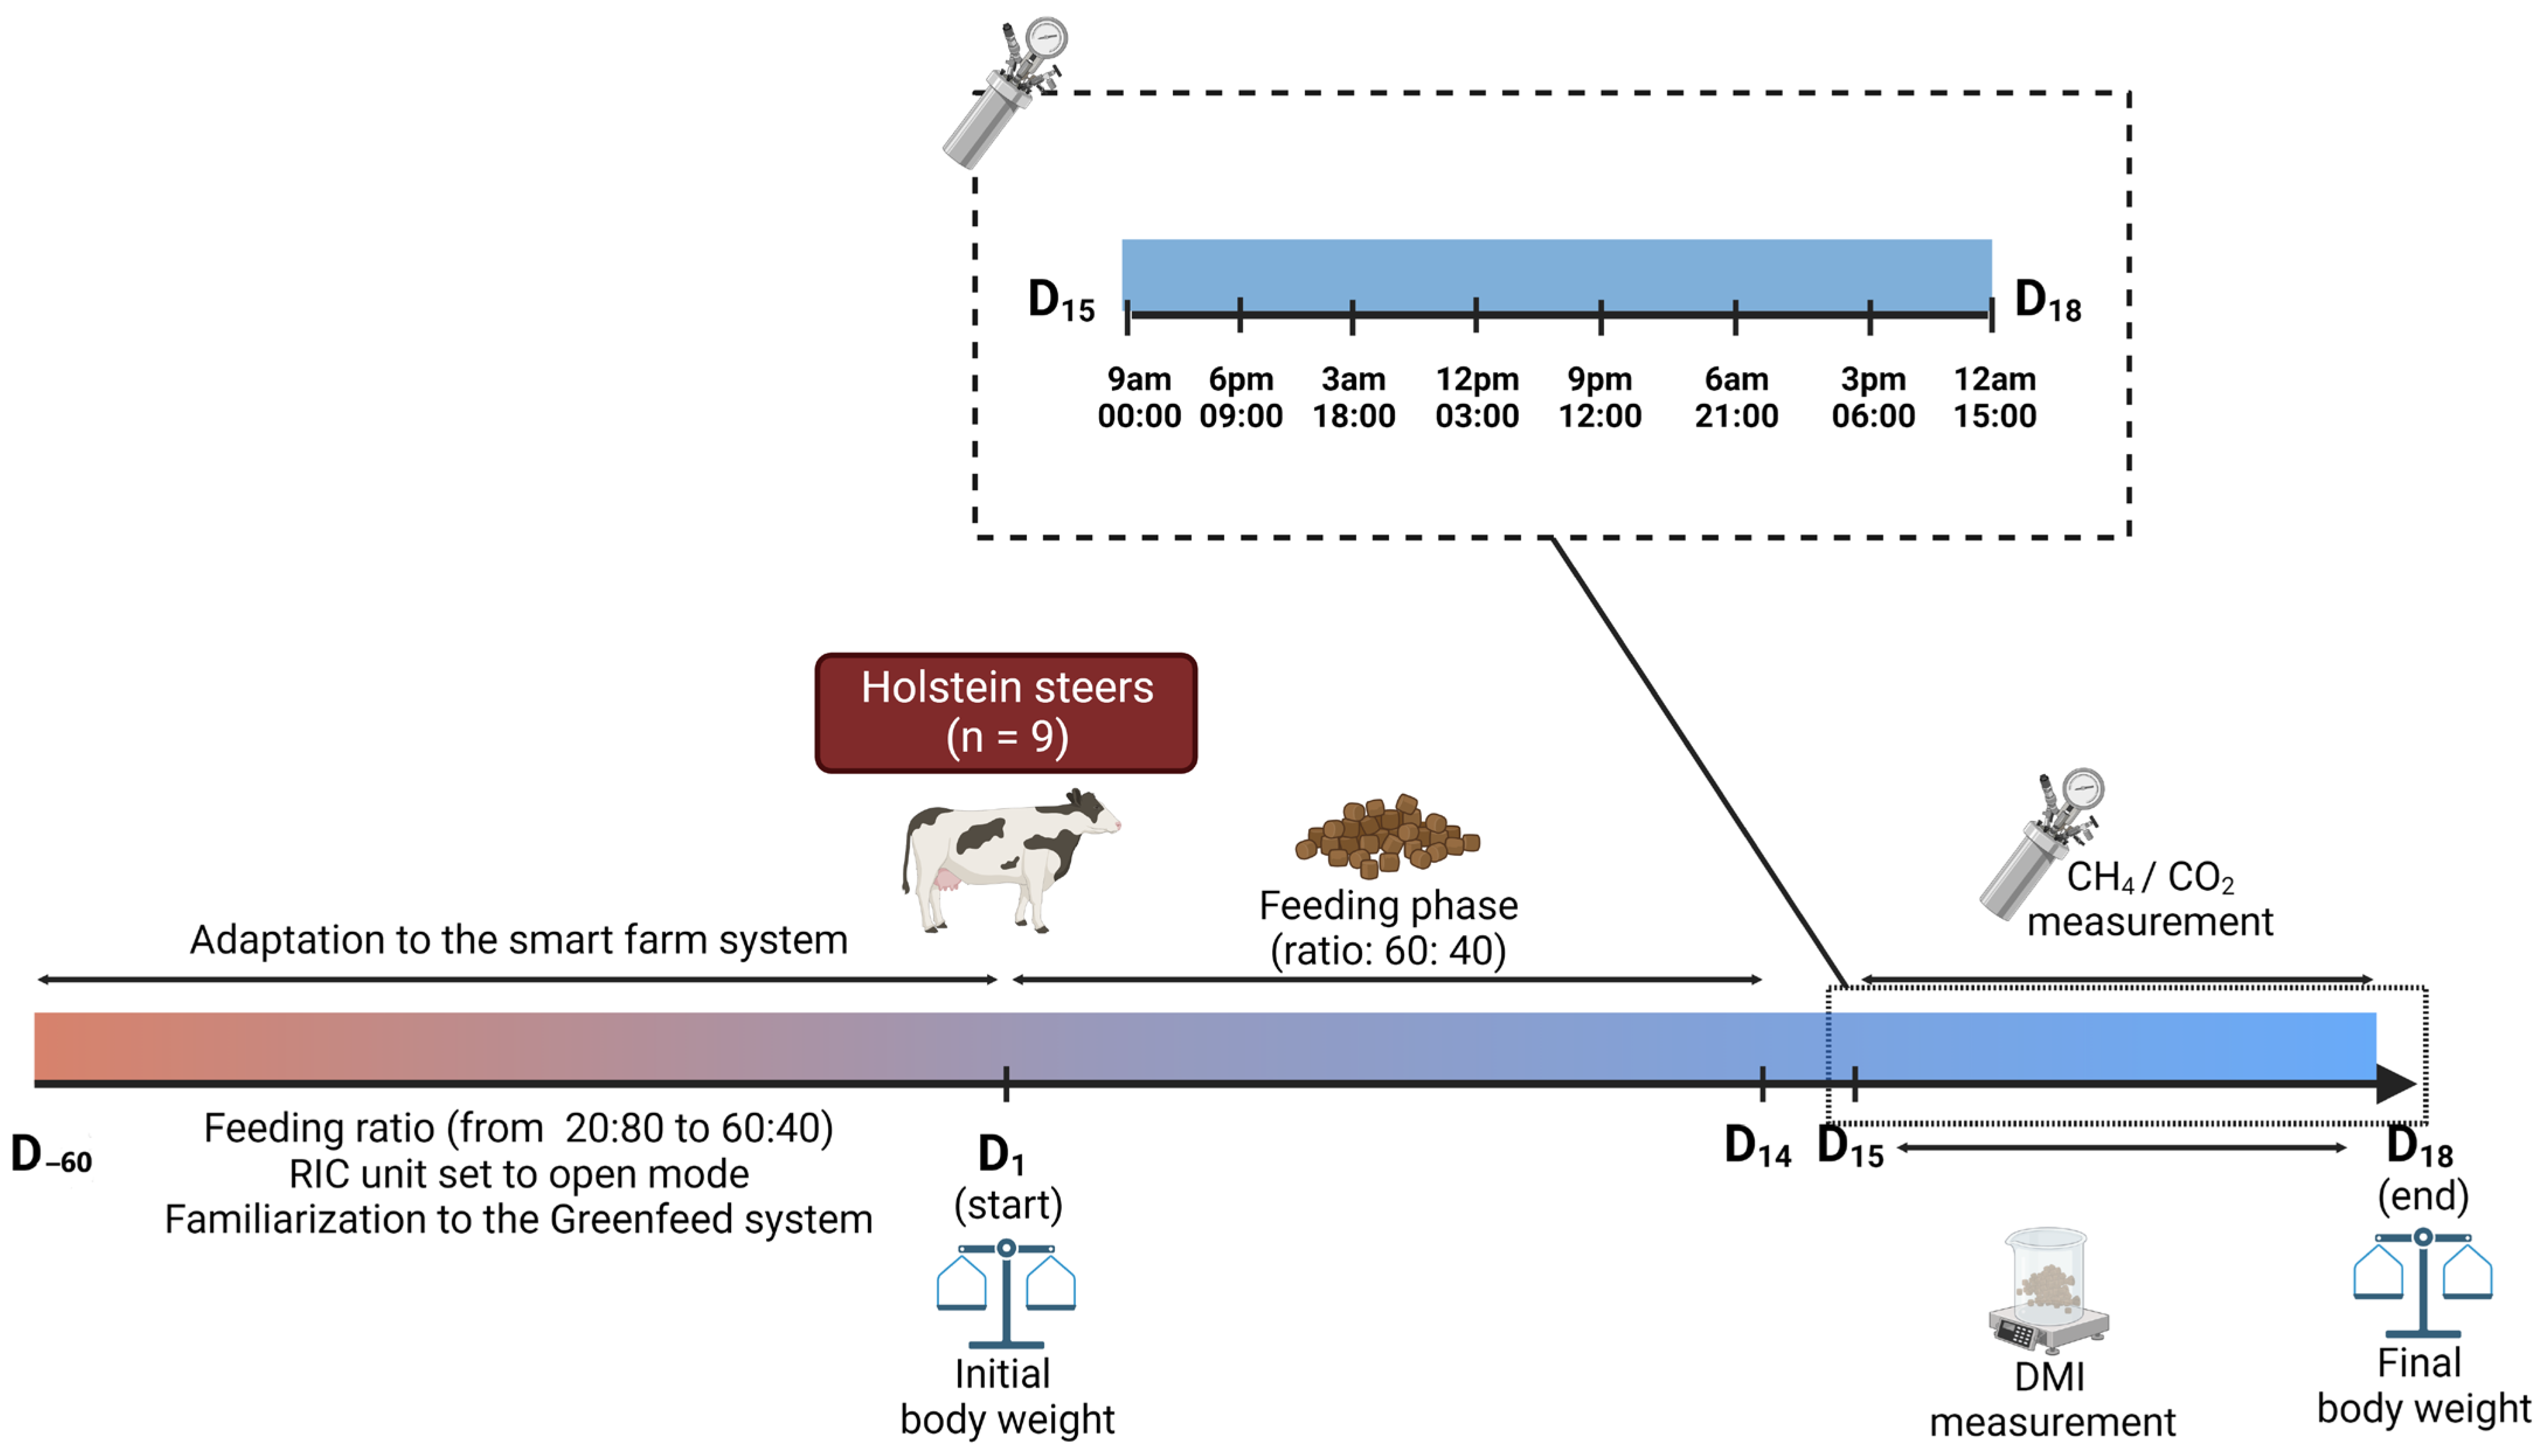
2.1. Experimental Animals, Housing, and Management

The SCNU Smart Farm and Greenhouse Gas Research Demo Farm served as sites for this study. An overview of the study design is shown in Figure 1.
Briefly, nine Holstein steers with an average body weight of 356.61 kg were used for the experimental group. They were fed the same forage-to-concentrate (60%:40%) ratio for 18 days. In this study, a proximate analysis (Table 1) was employed to determine the observed chemical composition of the feed samples. The first 14 days were used for the feeding trial, while the 15th to 18th days were utilized to determine DMI and measure CH4 emissions (15th to 17th days). Body weight was recorded on the last day.
Steers were reared under an intensive management system in individual pens with RIC units and automatic water troughs. Specific details regarding the RIC units are provided in Section 2.3. The roofed barn comprised seven pens, with the floor filled with approximately 0.30 m of straw bedding, and each pen had two RIC units, enough for two steers to move easily in each pen. Each pen had ventilated fans to ensure the correct indoor air quality.

2.2. Smart Tags

Transponders or smart tags (Nedap™ SmartTag, Nedap Livestock Management, Groenlo, The Netherlands) were attached to the neck of each steer before the start of the experiment. Radiofrequency identification (RFID) can recognize smart tags based on transponder numbers. This system facilitates easy monitoring of the location of each cow in the barn, thereby simplifying the oversight of individual animal care. To protect the electrical housing of the smart tags, a yellow bumper was used, which was animal friendly, durable, and able to withstand the stress of the barn environment.

2.3. Automatic Feeding System

The RIC system (feed-weigh scale; Hokofarm Group™, Emmeloord, The Netherlands) was utilized for feed intake measurements. Each animal was assigned a single RIC unit. This advanced feeding trough system has the following features:
Continuous and accurate weighing of the feed was achieved through its ability to weigh the feed in real-time. The dry matter (DM) content of the diet was continuously calculated using proximate analysis, as indicated in Table 1.
A quality-galvanized feeding gate with an access slide and animal identification sensors allowed the animals to access the feed without hindrance.
It has a stainless-steel lid to minimize feed spillage, which can be pneumatically opened to fill or clean the trough.
Smart tags attached to animals were activated by a specific RFID to send location information to the receiver. These tags were also linked to the RIC database (Apollo Data; Hokofarm Group™, Emmeloord, The Netherlands), allowing for accurate measurement of roughage intake and secure storage of individual animal data.
The animals were provided with the same forage and concentrate ratio once daily at 09:00 h. The feeding process was managed using a mobile phone connected to the Internet. Logging into the Apollo (Hokofarm Group™, Emmeloord, The Netherlands) web address was necessary to execute the following commands in sequence:
(1)
Cleaning. During this phase, feeding visits were not allowed because the slide (door) of each RIC unit moved upwards. The cover (gate) was open, and the unit was tilted forward for cleaning.
(2)
Calibration. Calibration was performed to ensure the accuracy of the weighing scale. The desired weights were used to calibrate the units.
(3)
Filling. The cover was open, and the RIC units were filled with the feed. Feeding visits were not permitted.
(4)
Auto. The slide was positioned at the upper position when the RIC units were set to automatic mode. Animals were identified by their transponders (smart tags), and the animal detection sensor was activated. At this point, the slide was moved down, and feeding visits commenced once the animals received permission according to their feed settings.

2.4. GreenFeed (GF) Technology

The methane emissions were measured using the latest GF 344 unit model (C-lock Inc., Rapid City, SD, USA). This system can be operated using the “C-lock” application installed on mobile phones connected to the Internet. Once connected to a GF system, various tasks can be executed according to manufacturer protocols. All tasks can be executed through a mobile application connected to the GF system.
The machine uses sensors to recognize the animals when their heads enter the sampling hood. The machine measured methane, carbon dioxide, and water vapor levels by analyzing the exhaled breath. During the measurement process, only one steer was allowed to enter its head into the hood, and the animal’s identity was determined using an RFID reader that read the animal’s ear tag. However, in this study, smart tags were attached to the necks of the animals and detected using RFID for each animal. The GF sampling process was activated when the animal’s head (detected by head proximity) was at the correct location within the hood. Measurements were scheduled at eight specific time points: 00:00, 03:00, 06:00, 09:00, 12:00, 15:00, 18:00, and 21:00. Prior to data collection, a vacant pen was allocated for the GF machine placement because the animals required intensive management. The animals underwent training sessions once or twice weekly (at the beginning of the study) after each feeding period. The objective of the training was to familiarize the animals with the machine and its location, including auditory cues such as a chime sound. The training was necessary owing to variations in animal behavior, such as frequent head movements in and out of the hood and differences in adaptation abilities to the system. The measurements of CH4 and CO2 during the training sessions were excluded from the data collection process.
To ensure successful measurements, the animals were trained to keep their heads inside the hood for a minimum of 3–5 min, allowing complete breath collection without interruption. These data were retained for future analyses. Maintaining the proper position of the animal heads within the hood automatically triggered the dispensing of pelleted concentrates.
In cases where automatic dispensing of pelleted concentrates was not observed but the animals continued to keep their heads within the hood, manual intervention could be performed by pressing the “drop feed bin1” button in the application. This ensured continuous feeding of the animal and encouraged it to keep its head within the hood during analysis. The GF machine was calibrated two days before the actual measurement to guarantee the accuracy of the reported concentration from the GF gas sensors. The calibration process involved zero gases with 200,000 ppm of oxygen (O2) and the remaining gas consisting of nitrogen (N2). Additionally, a span gas mixture (Airgas Specialty Gases, Airgas USA LLC, Radnor, PA, USA) was used, which included O2 (205,000 ppm), CH4 (500 ppm), CO2 (5000 ppm), 10 ppm of hydrogen (H2), and balanced with N2.
Furthermore, CO2 recovery was implemented to verify the proper functioning of the entire system and check the status of the airflow meter. Calibrations could be performed using a mobile application, taking up to 2 min for the zero and span gases by pressing the “Calibrate” button. In contrast, CO2 recovery required 3 min per run by pressing the “CO2 recovery” button.

2.5. Methane Conversion Factor (Ym) Calculation

Data related to the chemical composition of the diets (Table 1), growth performance, and CH4 production of the steers were collected to determine Ym according to equations from the Intergovernmental Panel on Climate Change (IPCC) Guidelines for National Greenhouse Gas Inventories [13] described in our previous study [14]. The equations are as follows:

2.5.1. Methane Conversion Factor

Y m = ( M E E / G E I i ) × 100
where:
Ym = methane conversion factor (% of gross energy intake; GEI).
MEE = methane emission energy (MJ/d).
GEIi = gross energy intake (MJ/d).

2.5.2. Methane Emission Energy

M E E = ( M P / 1000 ) × 55.65
where:
MEE = methane emission energy (MJ/d).
MP = methane production (g/d).
55.65 (MJ/kg CH4) = energy content of methane.

2.5.3. Gross Energy Intake (MJ/d) Calculated from GE of Feed

G E I i = D M I × G E i  
where:
GEIi = gross energy intake (MJ/d).
DMI = dry matter intake (kg/d).
GEi = gross energy content of the feed (MJ/kgDM).

2.5.4. Dry Matter Intake

D M I = M P / M Y
where:
DMI = dry matter intake (kg/d).
MP = methane production (g/d).
MY = methane yield (g CH4/Kg DMI).

2.5.5. Gross Energy Content of the Feed

G E i = 0.0226 C P + 0.0407 E E + 0.0192 C F + 0.0177 N F E
where:
GEi = gross energy content of the feed (MJ/kg DM).
CP = crude protein content (g/kg DM).
EE = ether extract (fat) content (g/kg DM).
CF = crude fiber content (g/kg DM).
NFE is the nitrogen-free extract content (g/kg DM), calculated from [NFE% = 100% − (% EE + % CP + % Ash + % CF)].
In this formula, the gross energy content of the feed (GEi) was calculated by multiplying the respective content of each component (crude protein, ether extract, crude fiber, and nitrogen-free extract) by their respective energy conversion factors, as described by MAFF [15] (Table 2).

2.6. Methane Emission Factor (EF) Calculation

2.6.1. IPCC Tier 2, Equation 10.21A (New)

E F A = [ D M I × ( M Y / 1000 ) × 365 ]        

2.6.2. IPCC Tier 2, Equation 10.21

E F B = [ G E I i × ( Y m / 100 ) × 365 ] / 55.65
E F C = [ G E I i i × ( Y m / 100 ) × 365 ] / 55.65
E F D = [ G E I i i × ( Y m ( 6.3 ) / 100 ) × 365 ] / 55.65
E F E = [ G E I i i × ( Y m ( 4.0 ) / 100 ) × 365 ] / 55.65
where:
EFA = Methane emission factor based on IPCC Tier 2 Equation 10.21A (New).
EFB = Methane emission factor based on IPCC Tier 2 Equation 10.21 with GEIi and Ym.
EFC = Methane emission factor based on IPCC Tier 2 Equation 10.21 with GEIii and Ym.
EFD = Methane emission factor based on IPCC Tier 2 Equation 10.21 with GEIii and Ym (6.3).
EFE = Methane emission factor based on IPCC Tier 2 Equation 10.21 with GEIii and Ym (4.0).
DMI = Dry matter intake (Kg/d).
MY = Methane yield (g/Kg DMI).
MP = Methane production (g/d).
GEIi = Gross energy intake (MJ/d) calculated from the gross energy content of the feed.
Ym = Methane conversion factor (developed).
GEIii = Gross energy intake (MJ/d) calculated from the IPCC prediction equation.
Ym (6.3) = Methane conversion factor 6.3 (digestibility of the feed (DE) 62–71%).
Ym (4.0) = Methane conversion factor 4.0 (DE ≥ 72%).
Energy Content of Methane = 55.65 (MJ/kg CH4).
These equations represent the various methane emission factors, DMI, CH4 yield, CH4 production, gross energy intake, CH4 conversion factors, and energy content of the CH4 used in the calculations.

2.6.3. Gross Energy Intake (MJ/d) Calculated from IPCC Prediction Equation

G E I i i = [   ( N E m / R E M ) + ( N E g / R E G )     ] / D E
The gross energy intake of an animal (GEIii) in MJ per day was determined as the sum of the net energy required for maintenance (NEm) and net energy needed for growth (NEg), both measured in MJ per day. Additionally, the equation considers the ratio of net energy available in the diet for maintenance (REM) and growth (REG) to the digestible energy consumed as well as the DE, expressed as a fraction of gross energy (DE/GE), which represents the proportion of digestible energy to gross energy.

2.6.4. Net Energy (NE) Required by the Animal for Maintenance, MJ/d

N E m = C f i × W e i g h t 0.75
The net energy required by an animal for maintenance (NEm) in MJ per day was calculated using a Cfi = coefficient of 0.322, which is specific to steers. This coefficient was measured in MJ/d/kg, multiplied by the weight and live weight of the animal in kilograms.

2.6.5. Net Energy Needed for Growth, MJ/d

N E g = [     22.02 × ( B W / ( C × M W ) ) ^ 0.75 × W G ^ 1.097     ]
The net energy required for growth (NEg) in MJ per day was determined by considering the following factors:
BW (kg) = average live body weight of the animals in the population.
C = coefficient with a value of 1.0 for castrated cattle.
MW (kg): mature body weight of an adult animal under moderate body conditions.
WG (kg/d): average daily weight gain of the animals in the population.

2.6.6. Ratio of NE Available in the Diet for Maintenance to DE

R E M = [ 1.123 ( 4.092 × 10 3 × D E ) + ( 1.126 × 10 5   × D E 2 ) ( 25.4 / D E ) ]
The ratio of the net energy available in the diet for maintenance to digestible energy (REM) was calculated, and the digestible energy (DE) of the feed was expressed as a percentage of gross energy (GE), represented as (DE/GE) multiplied by 100.

2.6.7. Ratio of NE Available in the Diet to DE Consumed

R E G = [ 1.164 ( 5.16 × 10 3 × D E ) + ( 1.308 × 10 5   × ( D E ) ^ 2 ) ( 37.4 / D E ) ]
The ratio of the net energy available for growth in a diet to the digestible energy consumed (REG) was calculated, and the DE of the feed was expressed as a percentage of the GE.

2.6.8. Digestibility of the Feed Expressed as a Fraction of GE

D E   ( a s   % ) = ( D E / G E )   × 100
DE is expressed as a percentage of the amount of energy that can be absorbed and utilized by an animal, measured in megajoules per kilogram (MJ/kg), whereas GE represents the total energy content of 18.45 MJ/kg.

2.6.9. DE According to NRC [16]

D E = T D N % × 0.04409 × 4.184
Total digestible nutrients (TDN) refer to the total amount of nutrients that can be digested and are expressed as a percentage of DM. The value 4.184 is the conversion factor used to convert energy units from mega calories per kilogram (Mcal/kg) to megajoules per kilogram (MJ/kg).

2.6.10. TDN

T D N = 88.936 ( 0.653 × A D F )
ADF is acid detergent fiber expressed as a percentage of DM.

2.7. Statistical Analysis

Data analysis was performed using SAS (Statistical Analysis System; SAS Institute, Cary, NC, USA) and R software, version 4.3.1 [17]. The distributions of growth performance parameters and GHG metrics were examined. Thereafter, the Pearson correlation coefficient was calculated to assess the potential associations between the growth parameters and GHG metrics. Visualizations in the form of 2D density contour plots and scatter charts were created to depict the hidden patterns between cattle emissions and calculated EFs. The analysis of data distribution and correlation analysis was performed via the “univariate” and “corr” procedures of the SAS software, version 9.4 while the “ggplot2” package of the R software was used for drawing the 2D density plots and scatter charts. Before further processing, the data were submitted to the ROUT method for outlier detection, but no outlier was detected within our dataset [18].

3. Results

3.1. Growth Performance and Methane Emissions

The results for Holstein steers in terms of body weight (initial, final, and total weight gain) are presented in Table 3. These values were 357 ± 57.24, 383 ± 57.19, and 27.0 ± 11.65 kg, respectively. The average daily feed intake, average daily gain, and feed conversion ratio were 8.20 ± 0.64 kg, 2.00 ± 0.83 kg, and 5.93 ± 4.69, respectively.
The parameters used in calculating GHG emissions, such as DMI in kilograms per day (kg/day) and DMI/kg of metabolic weight (DMI g/d/Kg BW0.75), were estimated to be 7.67 ± 0.63 and 89.04 ± 4.58, respectively. Methane production in grams per day (191.53 ± 21.76 CH4 production g/d), methane yield in grams per day per kilogram of DMI (25.07 ± 2.92 CH4 yield g/d/Kg DMI), emission intensity (2.15 ± 0.25 CH4 intensity g/d/kg BW0.75), and carbon dioxide production in grams per day (8860.95 ± 1188.00 CO2 production g/d) were also presented. Figure 2 illustrates the fluctuations in CO2 and CH4 emissions for each animal at specific time points. The x-axis denotes the time (in h) of detection, both before feeding (0 h) and after feeding (3–21 h), whereas the y-axis represents the corresponding CO2 and CH4 emissions measured in grams per day (g/d) from the GF unit.

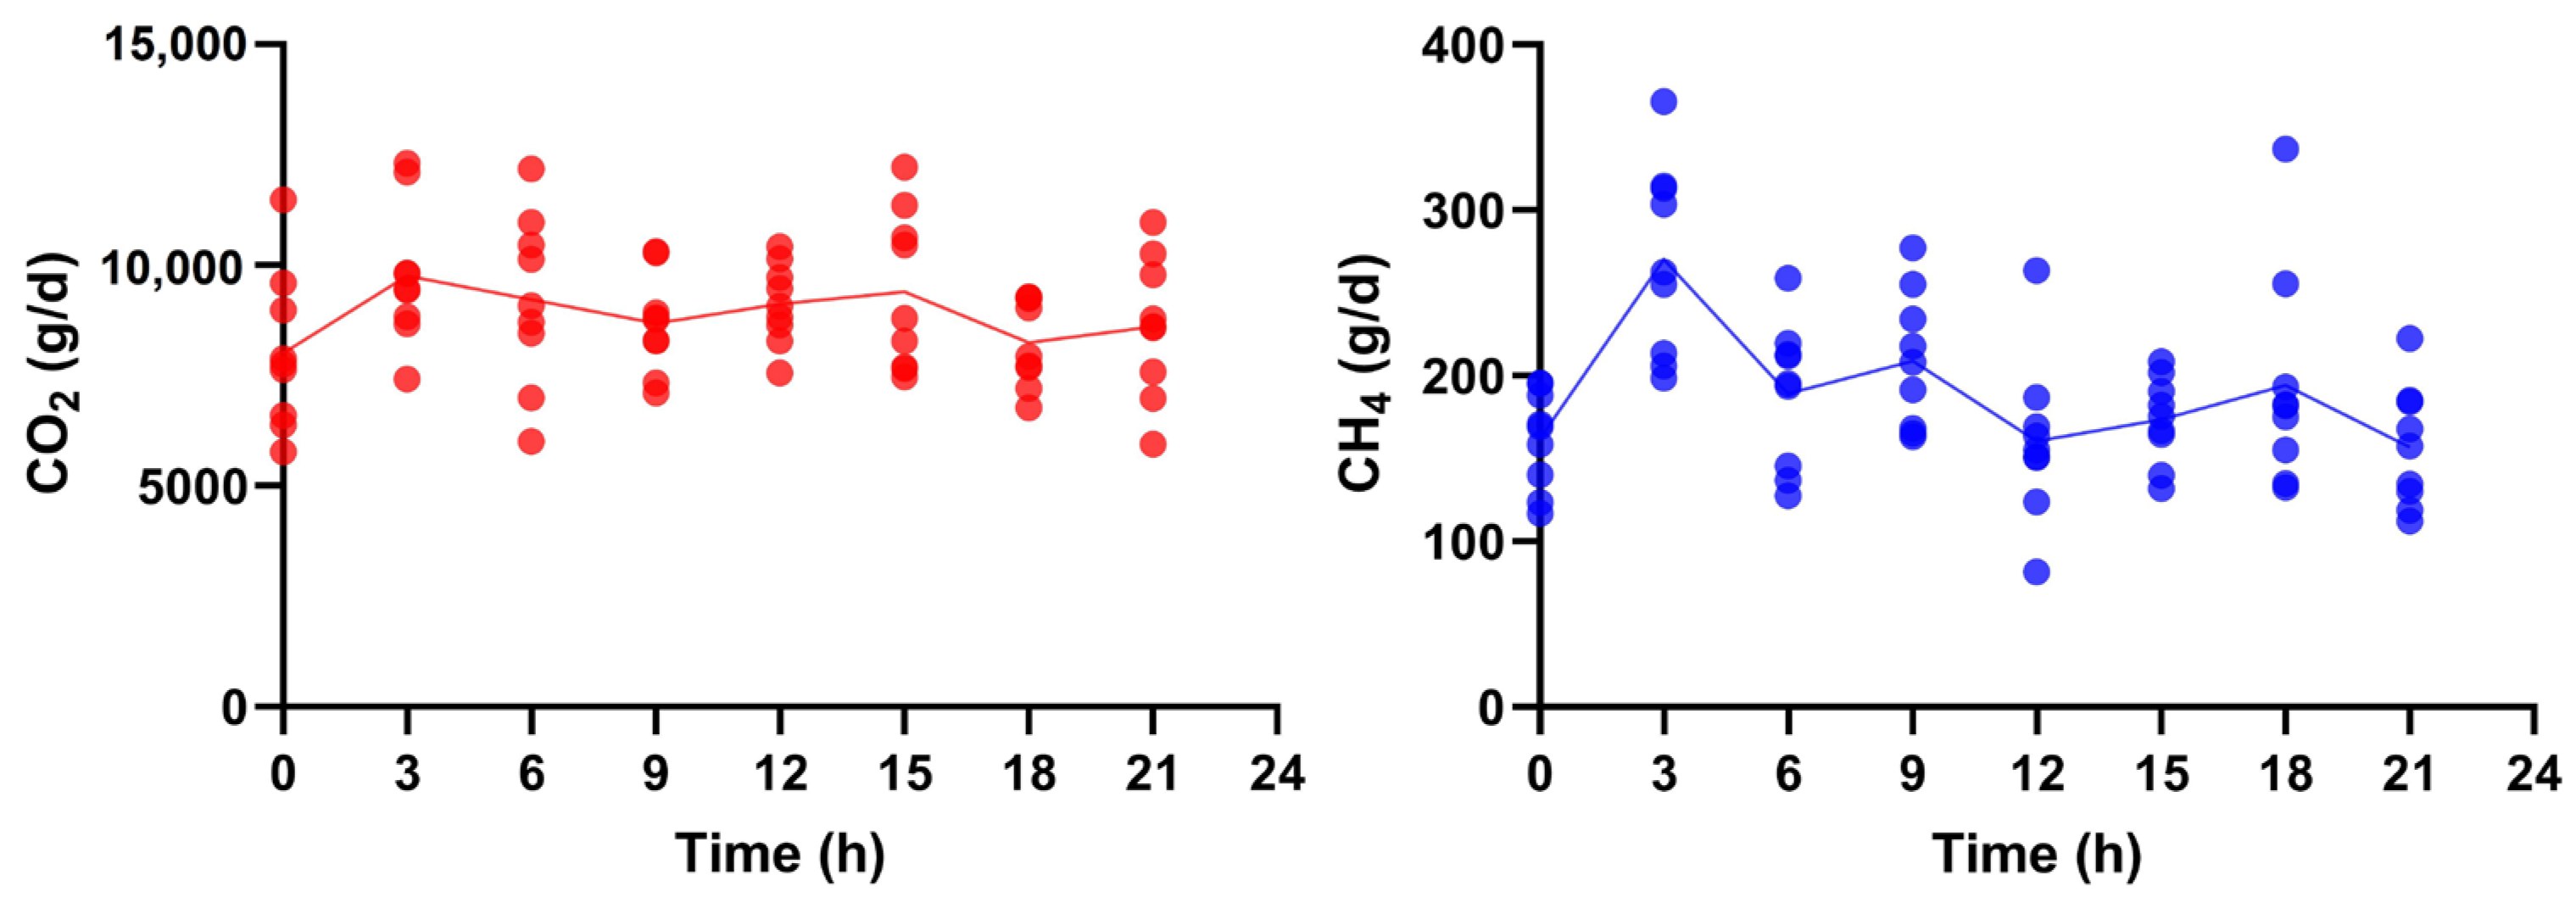
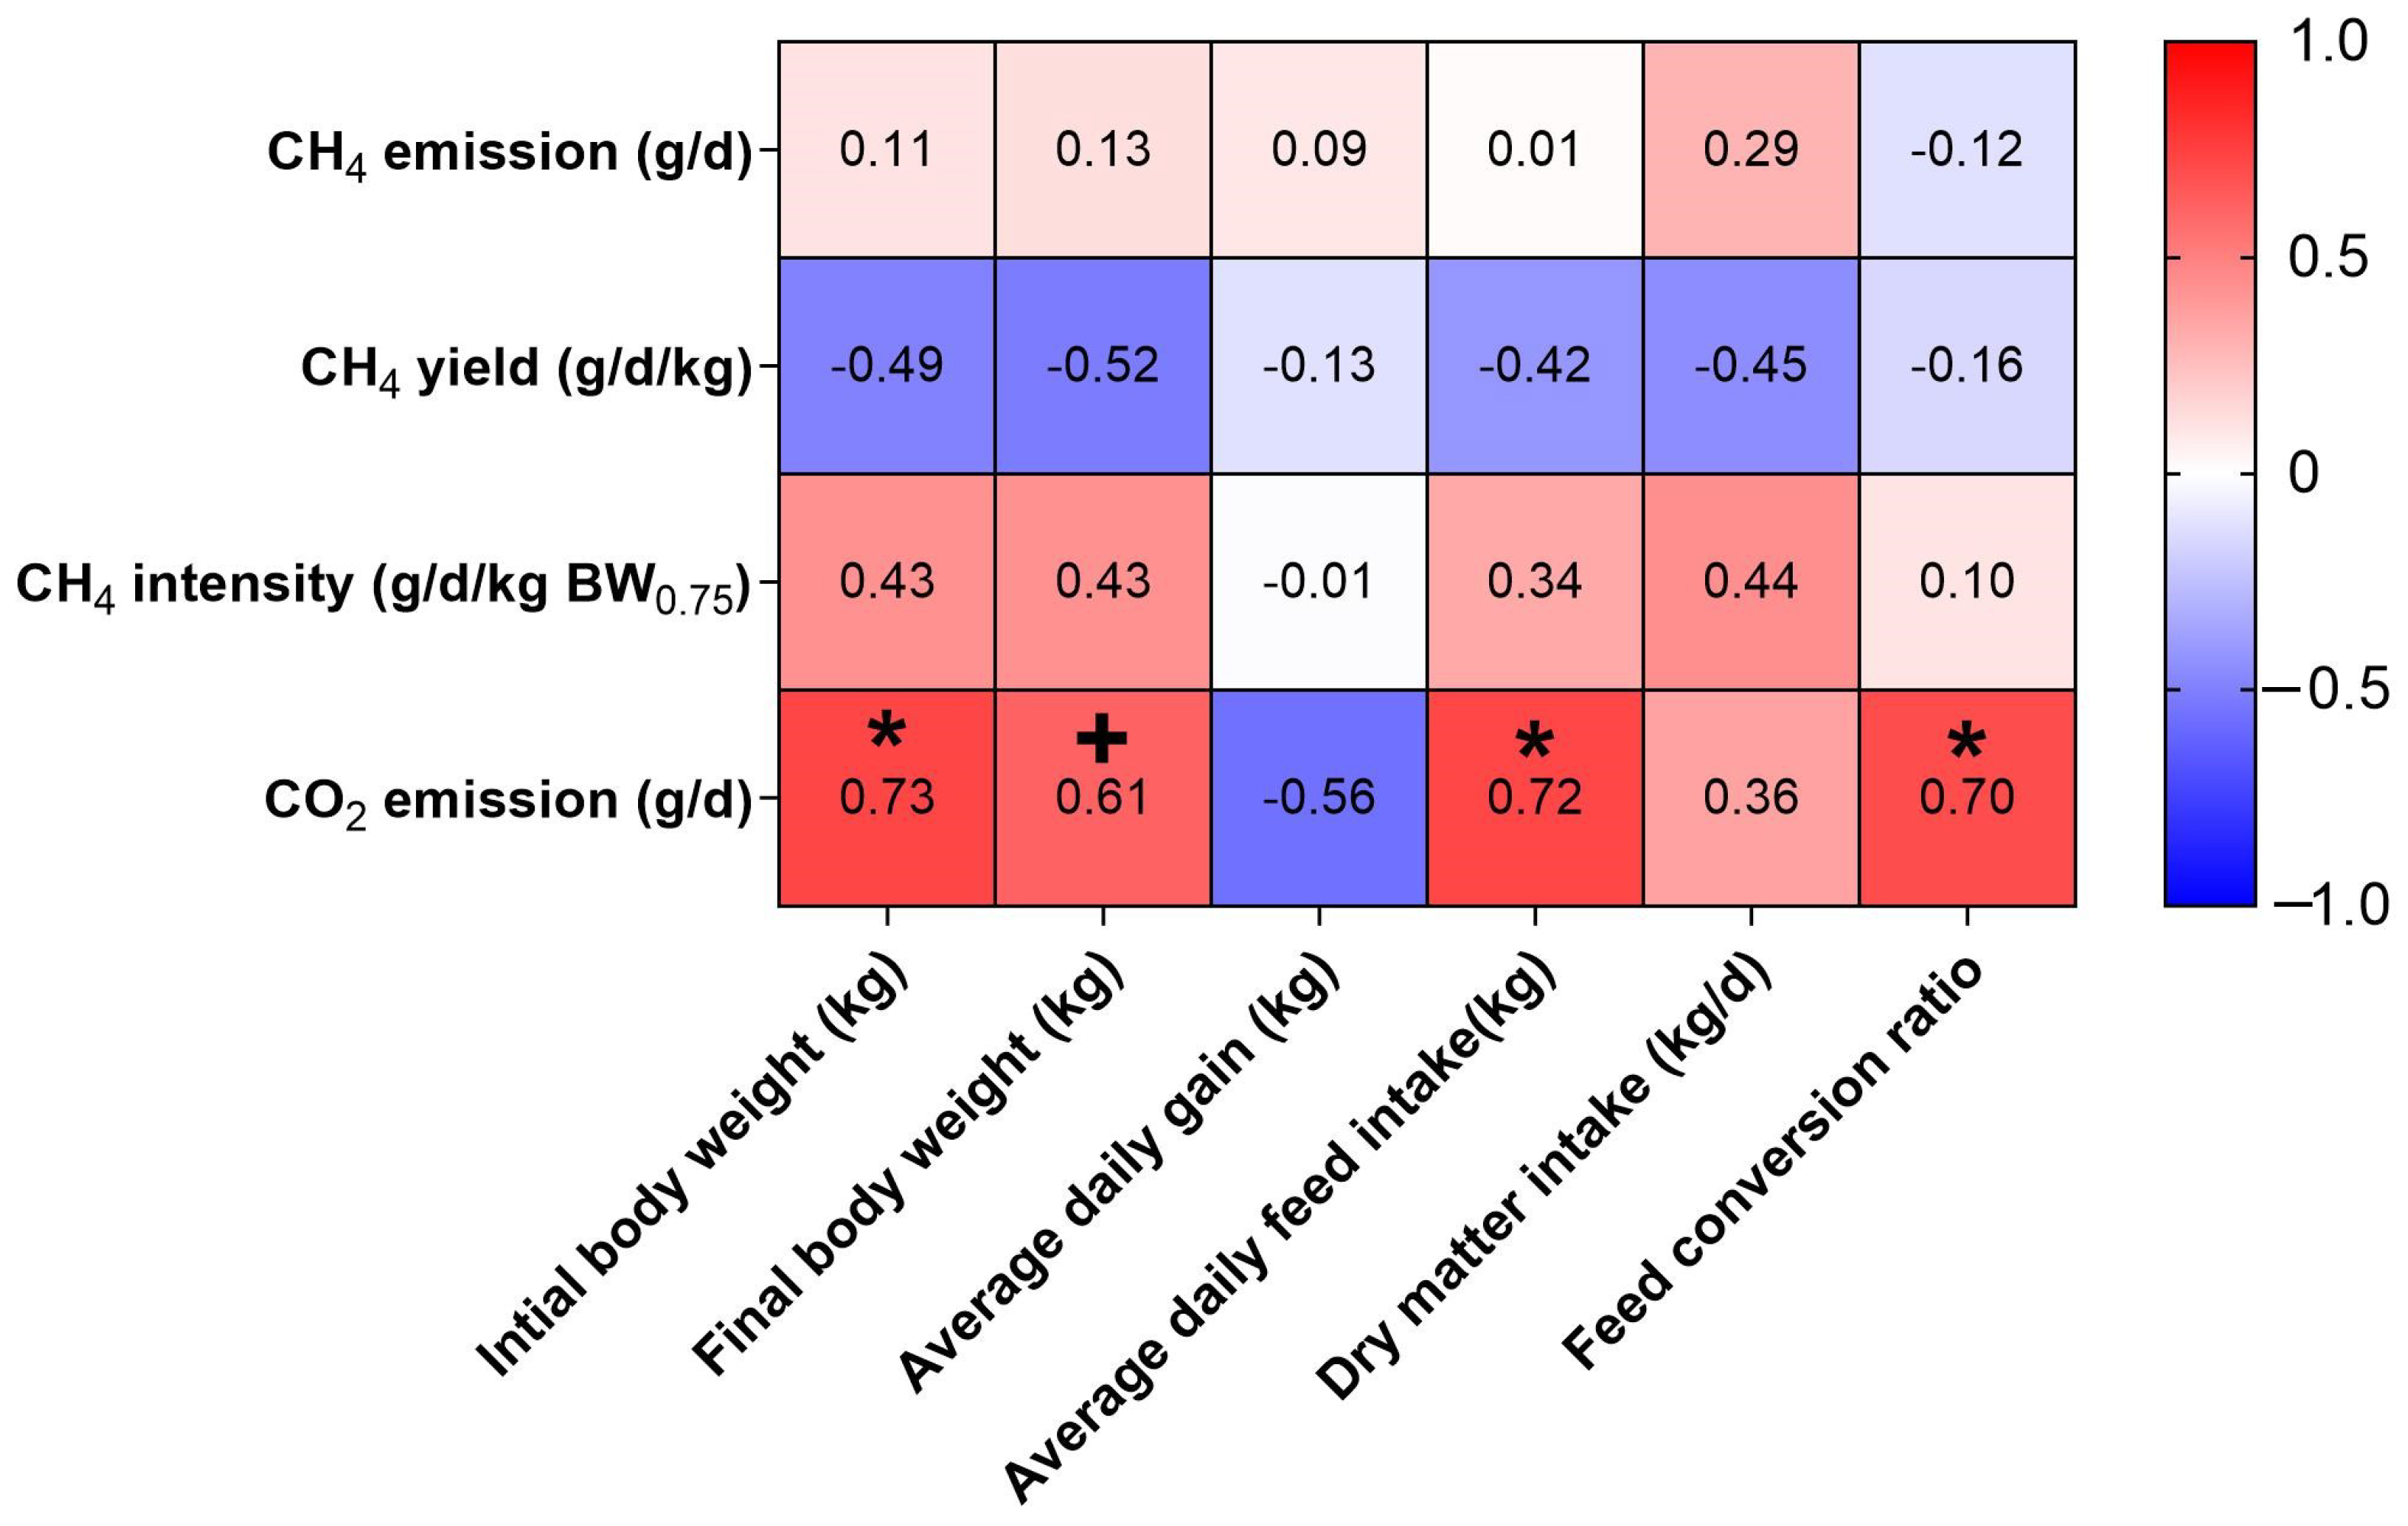
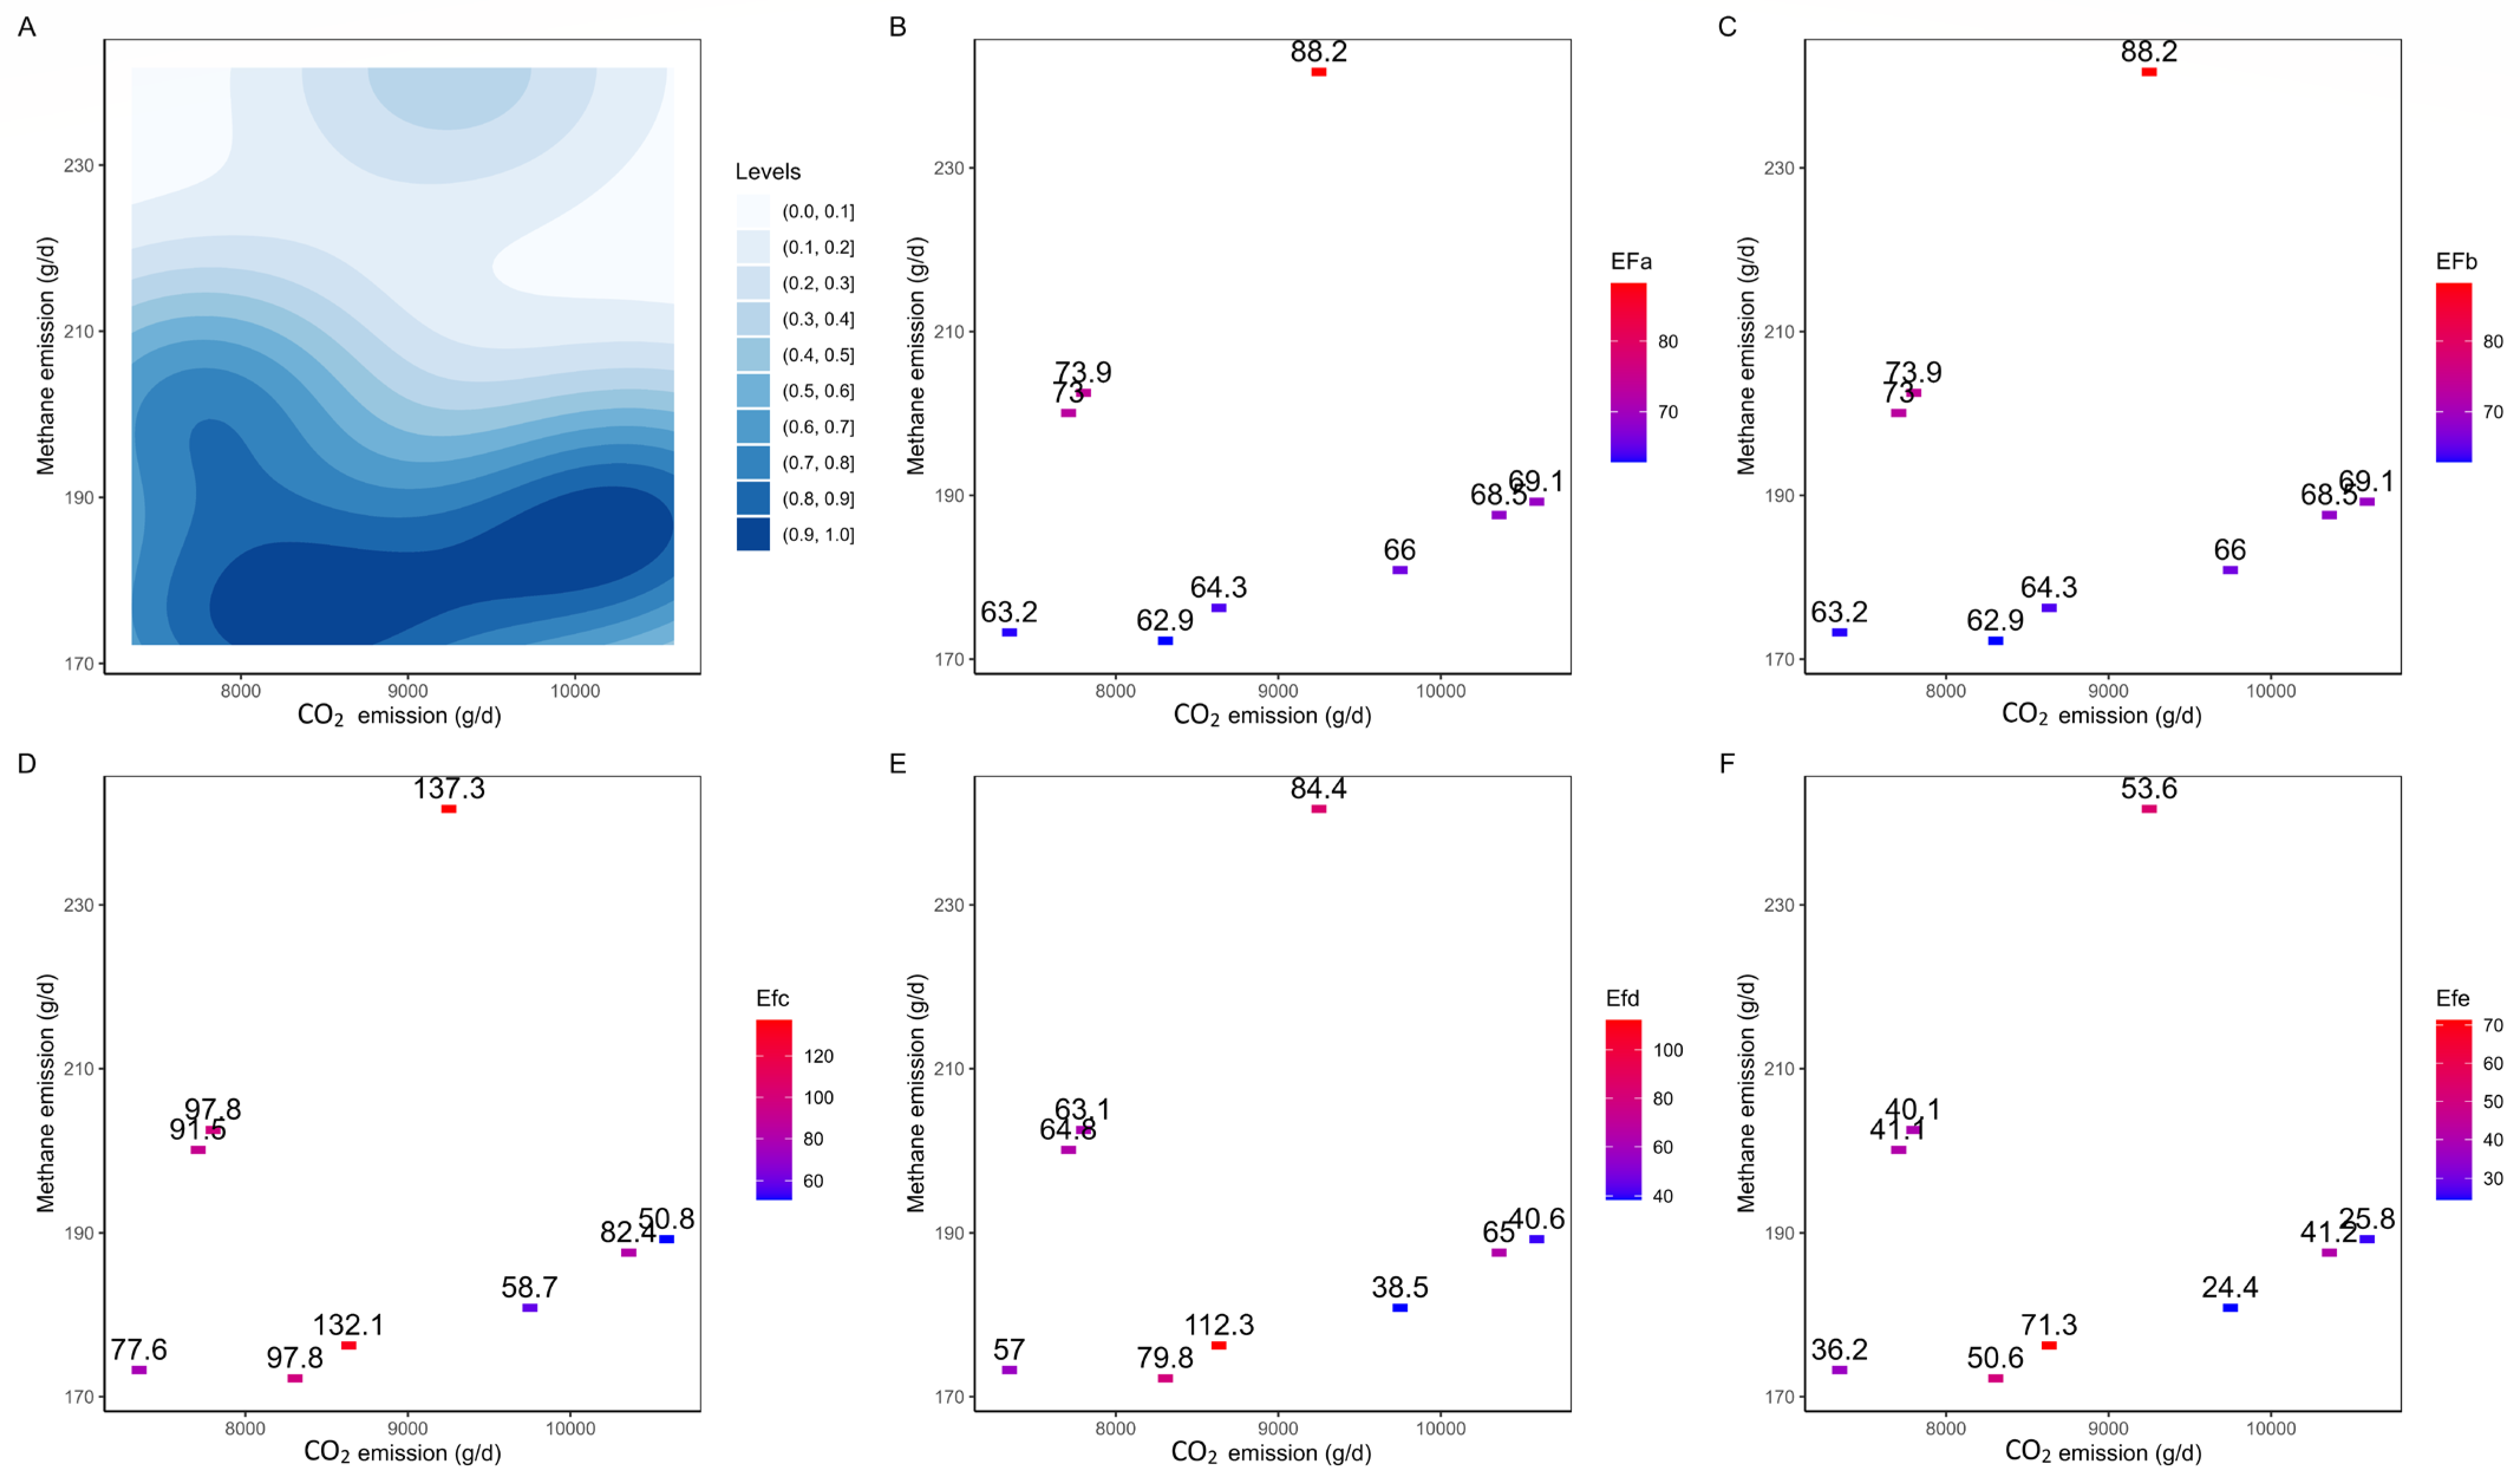
3.2. Emission Factors (EF), Comparison of GHG Production, and Variations in CO2 and CH4 Emissions

Emission estimates at a certain level typically require Tier 2 or Tier 3 calculations, as stated by the Intergovernmental Panel on Climate Change (IPCC) [13]. In this study, Tier 2 equations were utilized (Table 4 and Table 5). The calculated CH4 emission factors (EFs) varied depending on the specific EF used. The overall EFs (Table 6) for Holstein steers, categorized as EFA, EFB, EFD, and EFE, were 69.91 ± 7.94, 69.91 ± 7.94, 67.26 ± 22.78, and 42.70 ± 14.46 kg CH4 per head per year, respectively. These values were lower than the EF for type EFC, which was 91.79 ± 29.22 kg CH4 per head per year.
Positive correlations with CO2 emissions (Figure 3) were observed for the initial body weight (r = 0.725, p = 0.027), feed intake (r = 0.719, p = 0.029), and feed conversion ratio (r = 0.698, p = 0.037). A close relationship was also noted between the final body weight (r = 0.612, p = 0.080) and CO2 emissions. However, no significant relationship was observed between the overall methane production parameters (CH4, CH4 yield, and CH4 intensity) and other variables.
The inclusion of only nine steers may raise concerns regarding the statistical interpretation, especially when considering Pearson correlations. However, based on the current sample size of the study, it was determined that only strong correlations (0.7 and above) achieved statistical significance. The recorded emissions of CO2 and CH4 per animal varied considerably (Figure 4). The relationship between emitted CO2 (g/d) and CH4 is shown in the contour plot (Figure 4A). Darker regions in the plot indicate a higher number of records obtained from steers. The emissions varied widely, from 172 to 241 g/d for CH4 and from 7345 to 10,591 g/d for CO2.
Figure 4B,C presents the relationships between the GHG production recorded from the GF system and the evolution of EFA and EFB. There was a directional relationship between the variables. Both the EF values increased with increasing methane and carbon dioxide production. In contrast, EFC, EFD, and EFE did not have an evident directional relationship. The absence of clear patterns in these cases suggests the presence of specific sources or activities that significantly contribute to the emissions in these units, such as methane conversion factors or gross energy intake, from the IPCC-predicted equation.

4. Discussion

4.1. Growth Performance and Methane Emissions

The present study was conducted to compare the results related to growth and methane emissions obtained using an automated feeding system with those of previous studies. This comparison was motivated by the recognition that feed costs can account for as much as 65–75% of the total operating costs, which typically constitute approximately one-third of the total expenses in confined ruminant operations [19,20], and that available technologies have mostly been tested on experimental farms, which were primarily validated for adult cows [20,21].
The confined steers used in this study exhibited a higher BW and ADG compared to the findings of Puzio et al. [22], where steers (aged 7 to 18 months) housed in free stalls had lower feeding rates, resulting in a mean BW of 381 ± 101 kg and ADG of 933 ± 145 g/d over 12 months. Additionally, the study conducted by Cavani et al. [23] reported a smaller change in body weight, which could be influenced by factors such as meals or visits that may affect the definition of the feeding rate.
The GHG emission measurements in this study were conducted using the GF technology system, chosen for its compatibility with in-house and extensive grazing conditions [24]. Previous studies have primarily focused on measuring methane emissions, with limited consideration of carbon dioxide emissions [10]. However, in the present study, both gases were measured comprehensively.
In the context of the Pearson correlation results in this study, it is noteworthy that a relatively small sample size of nine steers was used. However, it is important to acknowledge that previous studies have also utilized a Pearson correlation to explore relationships between pairs of variables. Consequently, while this study may exhibit reduced statistical power due to its sample size, this limitation is often addressed by demonstrating statistical significance exclusively for stronger correlation values. Also, while previous studies demonstrated a correlation between DMI and CH4 emissions [25,26], our results did not reveal such trends. In fact, it is likely that the homogenous experimental conditions and the similarity between individuals encompassing factors such as weight, feed intake, and physiological conditions may have played a pivotal role in shaping the results obtained.
Significant variations were observed in the recorded emissions in studies that utilized the GF technology to measure CH4 emissions. Hristov et al. [27] obtained an overall CH4 concentration of 143 g/d from eight cows over a three-day sampling period using GF. Hammond et al. [7] conducted two separate experiments and found a CH4 production of 198 g/d with a CH4 yield of 26.6 g/d/Kg DMI from four growing Holstein heifers fed maize-or grass silage-based diets. In another trial of the same study, CH4 production values of 196, 202, 226, and 209 g/d with CH4 yield values of 24.1, 29.5, 28.9, and 28.8 g/d/Kg DMI were observed for four different heifers fed haylage treatments; in both experiments using GF, CH4 was measured over 7 days. Islam et al. [28] measured CH4 emissions from six non-cannulated Holstein and Jersey breeds and obtained results of 165.46 g/d with a CH4 yield of 9.69 g/d/Kg DMI for Holstein and 226.49 CH4 production g/d with 16.89 CH4 yield g/d/Kg DMI for Jersey breeds, using GF over three consecutive days [28]. The CH4 emissions and CH4 yield observed in the present study were consistently lower than those reported by Hammond et al. but revealed much higher values compared to other studies. The discrepancies among these studies can be attributed to the intermittent nature of short-term measurements conducted at various times throughout the day [7]. In the present study, the CH4 emissions from nine animals were measured at eight different time points, and most measurements were scheduled during the day. Methane emission rates can fluctuate significantly over a day as enteric methane production typically exhibits a diurnal pattern influenced by feeding and meal consumption timings [29].
The variations observed between other studies and the present study may also be related to the control of GF measurements, such as the timing of sampling events [7] or the number of GF visits per animal [30]. Additionally, cattle tend to release considerable amounts of methane through eructation while eating, resulting in elevated emission rates and more frequent occurrences of methane peaks characterized by higher concentrations [26]. In this study, more emphasis was placed on the duration for which the animal’s head remained in the GF unit, rather than the frequency of visits.
Another potential reason for the variations could be related to rumen microbiota variation [28] among the steers in this study, which influences the rumen ecosystem after feeding [31] or before CH4 measurement. However, ruminal microbiota was not measured in this study; therefore, this factor remains unclear.

4.2. Emission Factors (EF), Comparison of GHG Production, and Variations in CO2 and CH4 Emissions

Nevertheless, this study revealed potential mitigation opportunities for methane and carbon emissions. Mitigation opportunities pertain to the potential to decrease or limit the emissions of both gases. These opportunities may entail modifications to feeding management systems. Certain regions or specific geographical areas exhibited high levels of one type of emission and low levels of the other. The IPCC recognized that methane emissions can vary significantly depending on various factors, such as climate, land use, agricultural practices, industrial activities, and natural sources. This finding suggests the possibility of implementing targeted measures to reduce one type of emission without significantly increasing another.
EFs are typically derived based on the specific characteristics of the animal type, and corresponding metrics, including mature body weight and coefficients, are calculated accordingly [32]. Therefore, it is imperative to highlight that the findings of the present study are exclusively applicable to the particular animal type under investigation, which, in this instance, pertains specifically to steers.
This study followed the Tier 2 method to estimate GHG emissions because it is considered more accurate than the Tier 1 method. The Tier 1 method estimates emissions using limited data, whereas Tier 2 is based on country-specific emission factors [33,34]. This choice was motivated by the projected increase in global emissions from agricultural sources, with an expected 1% contribution by 2030, considering climate smart technology to reduce GHG emissions [33,35]. Although the CH4/CO2 ratio method plays a role in estimating CH4 production based on gas concentration readings [36], emphasizing the significance of reducing methane emissions per unit of intake or unit of product is important. This reduction was encapsulated in the methane conversion factor (Ym), which is a crucial parameter for extrapolating emissions to national and global inventories [37]. Therefore, despite several methods developed to measure ruminant emissions [38,39], this study used GF technology built with a combined feeder and CH4 and CO2 analyzer that quantifies GHG production during meals [40].
Regarding methane emission measurements obtained from GF technology, comparisons between housed dairy cows and non-lactating cows under GF, sulfur hexafluoride (SF6) tracer technique, sniffer methods, and laser detector methods suggested that less variable data and a more realistic range of emission estimates could be obtained under GF conditions [7,26,27,41]. Liu et al. [42] developed prediction models for lactating Holstein cows in terms of the daily and average methane production (g/d), yield (g/kg DMI), and intensity (g/kg fat- and protein-corrected milk). Their study reported higher methane emissions for both daily and average (372.60 vs. 350.20 CH4/g/d), but a lower yield (16.4 vs. 15.4 g/kg DMI) compared to this study. Parity and DMI are potentially useful predictors of CH4 intensity when tested using GF, where DMI is often used to predict CH4 production in inventory models [13].
Regarding feeding and CH4 mitigation strategies, equations predicting CH4 production per unit of feed intake (GE or DM) are biologically more valid in cattle and sheep than in other livestock species, namely swine (pigs) and poultry (chickens), which lack a rumen. Consequently, equations formulated for cattle and sheep may not be as relevant or applicable to swine and poultry. Therefore, it is recommended that CH4 production be predicted as intake (GEI or DMI) × production per unit (MJ of GE or kg of DMI) of intake [43]. This supports the observation that models predicting DMI can be used in conjunction with emission factors (EF) to estimate enteric CH4 emissions in Tier 2, along with accurate daily emission estimates from GF, which may vary depending on the type of animal, diet, and DMI level [7].
However, studies without GF utilization found that the enteric EF for gender effects on Holstein cattle (steers vs. heifers) showed no significant difference in enteric CH4 emissions. This was because of the net energy requirement for maintenance (MJ/kg BW0.75), which was used as the absolute value of the constant linear regression of ME against the energy balance. These results indicate that feeding regimens and management systems may influence emissions, and the use of the default methane EF of the IPCC may lead to errors in developing methane emission inventories when applied to young stocks at the age of six months [44].
In contrast, for other breeds, such as Hanwoo steers (growing: 43.4; finishing: 33.9 kg/CH4/hd/yr), it was implied that the IPCC Tier 2 model overestimated GE intake as the intake level increased. This suggests that the IPCC guidelines, which require a more detailed characterization of animals, diets, and management systems, may not be appropriate for Hanwoo steers due to the different production systems applied [45]. Furthermore, it is important to acknowledge that methane emissions can vary significantly among breeds, even when similar management practices are employed [46,47]. Notably, in this study, comparable values were projected for Holstein steers, with an estimated EFE of 42.70 kg/CH4/hd/yr, irrespective of the utilization of GF technology.

5. Conclusions

In conclusion, the utilization of the RIC unit on a larger scale as an advanced technique in feeding management should ultimately be explored as the feed intake per unit serves as a factor in calculating emissions. Although the utilization of RIC may not result in the complete elimination of methane, it offers valuable advantages for optimizing feeding practices. These benefits include enhancing feed efficiency, achieving a balanced nutrient intake, enabling real-time monitoring, facilitating targeted feeding strategies that prevent excessive feed intake, and serving as a valuable research and data collection tool. The emission factors in this study were estimated using the IPCC Tier 2 equations, and the EFC values for Holstein steers were overestimated, whereas the EFE values were undervalued (91.79 and 42.70 kg/hd/yr, respectively), with other counterparts being comparable to those reported in previous studies. The GF 344 was utilized as a valuable instrument for the estimation of methane emissions, facilitating the computation of these emission factors. The current results provide an opportunity to further explore the implementation of smart farming technology, particularly in terms of the systematic collection of larger datasets over an extended period to achieve a higher prediction accuracy in enteric CH4 prediction (Ym value) specific to each country or region. Exploring the wider implementation of RIC technology in livestock production systems could contribute to reducing emissions and enhancing the overall system efficiency. Future research should explore in detail the practical implications and effectiveness of RIC on a larger scale to advance our understanding of its potential role in mitigating methane emissions in livestock operations.

Author Contributions

Conceptualization, J.I.B., S.-H.K. and S.-S.L.; methodology, J.I.B., S.-H.K. and C.M.N.; software, C.M.N.; validation, J.I.B., C.M.N., A.-R.S., S.-H.K. and S.-S.L.; formal analysis, J.I.B. and A.-R.S.; investigation, J.I.B. and S.-H.K.; data curation, J.I.B. and C.M.N.; writing—original draft preparation, J.I.B.; writing—review and editing, J.I.B., C.M.N., A.-R.S. and S.-H.K.; supervision, S.-H.K. and S.-S.L.; funding acquisition, S.-H.K. All authors have read and agreed to the published version of the manuscript.

Funding

This research was supported by the Korea Institute of Planning and Evaluation for Technology in Food, Agriculture, and Forestry (IPET) through the Smart Farm Innovation Technology Development Program funded by the Ministry of Agriculture, Food, and Rural Affairs (MAFRA) (421022-04).

Institutional Review Board Statement

All animal use in this research was approved by the Sunchon National University (SCNU) Institutional Animal Care and Use Committee (SCNU-IACUC; approval number: SCNU-IACUC-2022-06).

Informed Consent Statement

Not applicable.

Data Availability Statement

The corresponding author can provide the data upon request.

Acknowledgments

We express our gratitude to the Divine for the gift of knowledge and wisdom and our appreciation for the technical support and assistance provided by our colleagues at the Ruminant Nutrition and Anaerobe Laboratory, Sunchon National University, during the study.

Conflicts of Interest

The authors declare no conflict of interest.

References

  1. Ritchie, H.; Roser, M.; Rosado, P. CO₂ and Greenhouse Gas Emissions. 2020. Available online: https://ourworldindata.org/co2-and-greenhouse-gas-emissions (accessed on 21 June 2023).
  2. Murray, R.M.; Bryant, A.M.; Leng, R.A. Rates of Production of Methane in the Rumen and Large Intestine of Sheep. Br. J. Nutr. 1976, 36, 1–14. [Google Scholar] [CrossRef]
  3. Mpofu, I. Ecosystem Services from Different Livestock Management Systems; Elsevier Inc.: Amsterdam, The Netherlands, 2019; ISBN 9780128164365. [Google Scholar]
  4. Hook, S.E.; Wright, A.D.G.; McBride, B.W. Methanogens: Methane Producers of the Rumen and Mitigation Strategies. Archaea 2010, 2010, 945785. [Google Scholar] [CrossRef]
  5. Shalloo, L.; Byrne, T.; Leso, L.; Ruelle, E.; Starsmore, K.; Geoghegan, A.; Werner, J.; O’Leary, N. A Review of Precision Technologies in Pasture-Based Dairying Systems. Ir. J. Agric. Food Res. 2021, 59, 279–291. [Google Scholar] [CrossRef]
  6. Riaboff, L.; Shalloo, L.; Smeaton, A.F.; Couvreur, S.; Madouasse, A.; Keane, M.T. Predicting Livestock Behaviour Using Accelerometers: A Systematic Review of Processing Techniques for Ruminant Behaviour Prediction from Raw Accelerometer Data. Comput. Electron. Agric. 2022, 192, 106610. [Google Scholar] [CrossRef]
  7. Hammond, K.J.; Crompton, L.A.; Bannink, A.; Dijkstra, J.; Yáñez-Ruiz, D.R.; O’Kiely, P.; Kebreab, E.; Eugène, M.A.; Yu, Z.; Shingfield, K.J.; et al. Review of Current in Vivo Measurement Techniques for Quantifying Enteric Methane Emission from Ruminants. Anim. Feed Sci. Technol. 2016, 219, 13–30. [Google Scholar] [CrossRef]
  8. Johnson, K.A.; Huyler, M.T.; Westburg, H.H.; Lamb, B.K.; Zimmerman, P.; Johnson, K.A.; Huyler, M.T.; Westburg, H.H.; Lamb, B.K.; Zimmerman, P. Measurement of Methane Emissions from Ruminant Livestock Using a SF6 Tracer Technique. Environ. Sci. Technol. 1994, 28, 359–362. [Google Scholar] [CrossRef]
  9. Hellwing, A.L.F.; Lund, P.; Weisbjerg, M.R.; Brask, M.; Hvelplund, T. Technical Note: Test of a Low-Cost and Animal-Friendly System for Measuring Methane Emissions from Dairy Cows. J. Dairy Sci. 2012, 95, 6077–6085. [Google Scholar] [CrossRef]
  10. Huhtanen, P.; Ramin, M.; Hristov, A.N. Enteric Methane Emission Can Be Reliably Measured by the GreenFeed Monitoring Unit. Livest. Sci. 2019, 222, 31–40. [Google Scholar] [CrossRef]
  11. Schwartzkopf-Genswein, K.S.; Atwood, S.; McAllister, T.A. Relationships between Bunk Attendance, Intake and Performance of Steers and Heifers on Varying Feeding Regimes. Appl. Anim. Behav. Sci. 2002, 76, 179–188. [Google Scholar] [CrossRef]
  12. Baker, S. Patterns of Methane Production and Feed Intake in Ruminants. CSIRO Livestock Industries, Floreat Park Laboratories, Wembley, WA 6014. Anim. Prod. Aust. 2003, 25, 213. Available online: https://www.publish.csiro.au/sa/pdf/sa0401058 (accessed on 21 June 2023).
  13. Dong, H.; Mangino, J.; McAllister, T.A.; Hatfield, J.L.; Johnson, D.E.; Lassey, K.R.; de Lima, M.A.; Romanovskaya, A.; Bartram, D.; Gibb, D.; et al. Chapter 10: Emissions from Livestock and Manure Management. In 2006 IPCC Guidelines for National Greenhouse Gas Inventories; U.S. Department of Energy: Washington, DC, USA, 2006; Volume 10, pp. 1–87. Available online: https://www.ipcc-nggip.iges.or.jp/public/2006gl/pdf/4_Volume4/V4_10_Ch10_Livestock.pdf (accessed on 21 June 2023).
  14. Islam, M.; Kim, S.H.; Son, A.R.; Lee, S.S.; Lee, S.S. Breed and Season-Specific Methane Conversion Factors Influence Methane Emission Factor for Enteric Methane of Dairy Steers. Sustainability 2022, 14, 7030. [Google Scholar] [CrossRef]
  15. Ministry of Agriculture, Fisheries and Food (MAFF). Energy Allowances and Feeding Systems for Ruminants; Ministry of Agriculture, Fisheries and Food, Department of Agriculture & Fisheries for Scotland, Department of Agriculture for Northern Ireland: London, UK, 1975; Volume 44, pp. 1–79. Available online: https://wellcomecollection.org/works/ey8cqebf (accessed on 25 May 2023).
  16. NRC. Nutrient Requirements of Beef Cattle: Update 2000, 7th ed.; National Academy Press: Washington, DC, USA, 2000. [Google Scholar]
  17. R Core Team. R: A Language and Environment for Statistical Computing; R Foundation for Statistical Computing: Vienna, Austria, 2023. [Google Scholar]
  18. Ncho, C.; Goel, A.; Jeong, C.; Gupta, V.; Choi, Y. Effects of In Ovo Feeding of γ-Aminobutyric Acid on Growth Performances, Plasma Metabolites, and Antioxidant Status in Broilers Exposed to Cyclic Heat Stress. Sustainability 2021, 13, 11032. [Google Scholar] [CrossRef]
  19. Halachmi, I.; Edan, Y.; Maltz, E.; Peiper, U.M. A Real-Time Control System for Individual Dairy Cow Food Intake. Comput. Electron. Agric. 1998, 20, 131–144. [Google Scholar] [CrossRef]
  20. Stygar, A.H.; Gómez, Y.; Berteselli, G.V.; Dalla Costa, E.; Canali, E.; Niemi, J.K.; Llonch, P.; Pastell, M. A Systematic Review on Commercially Available and Validated Sensor Technologies for Welfare Assessment of Dairy Cattle. Front. Vet. Sci. 2021, 8, 634338. [Google Scholar] [CrossRef]
  21. Tedeschi, L.O.; Greenwood, P.L.; Halachmi, I. Advancements in Sensor Technology and Decision Support Intelligent Tools to Assist Smart Livestock Farming. J. Anim. Sci. 2021, 99, skab038. [Google Scholar] [CrossRef]
  22. Puzio, N.; Purwin, C.; Nogalski, Z.; Białobrzewski, I.; Tomczyk, Ł.; Michalski, J.P. The Effects of Age and Gender (Bull vs Steer) on the Feeding Behavior of Young Beef Cattle Fed Grass Silage. Asian Australas. J. Anim. Sci. 2019, 32, 1211–1218. [Google Scholar] [CrossRef]
  23. Cavani, L.; Brown, W.E.; Parker Gaddis, K.L.; Tempelman, R.J.; VandeHaar, M.J.; White, H.M.; Peñagaricano, F.; Weigel, K.A. Estimates of Genetic Parameters for Feeding Behavior Traits and Their Associations with Feed Efficiency in Holstein Cows. J. Dairy Sci. 2022, 105, 7564–7574. [Google Scholar] [CrossRef]
  24. C-Lock Inc. GreenFeed Instruction Manual; C-Lock Inc.: Rapid City, SD, USA, 2021. [Google Scholar]
  25. Min, B.; Lee, S.; Jung, H.; Miller, D.N. And Beef Cattle Production: Strategies, Opportunities, and Impact of Reducing Emissions. Animals 2022, 12, 948. [Google Scholar] [CrossRef]
  26. Garnsworthy, P.C.; Craigon, J.; Hernandez-Medrano, J.H.; Saunders, N. On-Farm Methane Measurements during Milking Correlate with Total Methane Production by Individual Dairy Cows. J. Dairy Sci. 2012, 95, 3166–3180. [Google Scholar] [CrossRef]
  27. Hristov, A.N.; Oh, J.; Giallongo, F.; Frederick, T.; Harper, M.T.; Weeks, H.; Branco, A.F.; Price, W.J.; Moate, P.J.; Deighton, M.H.; et al. Short Communication: Comparison of the GreenFeed System with the Sulfur Hexafluoride Tracer Technique for Measuring Enteric Methane Emissions from Dairy Cows. J. Dairy Sci. 2016, 99, 5461–5465. [Google Scholar] [CrossRef]
  28. Islam, M.; Kim, S.H.; Ramos, S.C.; Mamuad, L.L.; Son, A.R.; Yu, Z.; Lee, S.S.; Cho, Y.-I.L.; Lee, S.S. Holstein and Jersey Steers Differ in Rumen Microbiota and Enteric Methane Emissions Even Fed the Same Total Mixed Ration. Front. Microbiol. 2021, 12, 601061. [Google Scholar] [CrossRef]
  29. Sauvant, D.; Milgen, J.; Faverdin, P.; Friggens, N. Modelling Nutrient Digestion and Utilisation in Farm Animals; Wageningen Academic Publishers: Wageningen, The Netherlands, 2010; pp. 176–180. [Google Scholar] [CrossRef]
  30. Waghorn, G.C.; Jonker, A.; MacDonald, K.A. Measuring Methane from Grazing Dairy Cows Using GreenFeed. Anim. Prod. Sci. 2016, 56, 252–257. [Google Scholar] [CrossRef]
  31. Shaani, Y.; Zehavi, T.; Eyal, S.; Miron, J.; Mizrahi, I. Microbiome Niche Modification Drives Diurnal Rumen Community Assembly, Overpowering Individual Variability and Diet Effects. ISME J. 2018, 12, 2446–2457. [Google Scholar] [CrossRef]
  32. Hristov, A.N.; Kebreab, E.; Niu, M.; Oh, J.; Bannink, A.; Bayat, A.R.; Boland, T.M.; Brito, A.F.; Casper, D.P.; Crompton, L.A.; et al. Symposium Review: Uncertainties in Enteric Methane Inventories, Measurement Techniques, and Prediction Models. J. Dairy Sci. 2018, 101, 6655–6674. [Google Scholar] [CrossRef]
  33. Höglund-Isaksson, L. Global Anthropogenic Methane Emissions 2005–2030: Technical Mitigation Potentials and Costs. Atmos. Chem. Phys. 2012, 12, 9079–9096. [Google Scholar] [CrossRef]
  34. Bekele, W.; Guinguina, A.; Zegeye, A.; Simachew, A.; Ramin, M. Contemporary Methods of Measuring and Estimating Methane Emission from Ruminants. Methane 2022, 1, 8. [Google Scholar] [CrossRef]
  35. Zaman, M.; Heng, L.; Müller, C. Measuring Emission of Agricultural Greenhouse Gases and Developing Mitigation Options Using Nuclear and Related Techniques; Zaman, M., Heng, L., Müller, C., Eds.; Springer International Publishing: Cham, Switzerland, 2021; ISBN 978-3-030-55395-1. [Google Scholar]
  36. Difford, G.F. Chapter 4 ‘Sniffer’ Methane Measurement Systems to Determine Methane Concentrations in Air Emitted by Cows. In Guidelines for Estimating Methane Emissions from Individual Ruminants Using: GreenFeed, ‘Snifferd’, Handhels Laser Detector and Portable Accumulation Chambers; New Zealand Agricultural Greenhouse Gas Research Centre: Palmerston North, New Zealand, 2020; ISBN 978-1-99-004336-9. [Google Scholar]
  37. Lassey, K.R. Livestock Methane Emission: From the Individual Grazing Animal through National Inventories to the Global Methane Cycle. Agric. For. Meteorol. 2007, 142, 120–132. [Google Scholar] [CrossRef]
  38. Smink, W.; Van Der Hoek, K.W.; Bannink, A.; Dijkstra, J. Calculation of Methane Production from Enteric Fermentation in Dairy Cows. SenterNovem. 2005, pp. 1–22. Available online: https://edepot.wur.nl/38583 (accessed on 21 June 2023).
  39. Hill, J.; McSweeney, C.; Wright, A.D.G.; Bishop-Hurley, G.; Kalantar-zadeh, K. Measuring Methane Production from Ruminants. Trends Biotechnol. 2016, 34, 26–35. [Google Scholar] [CrossRef]
  40. Storm, I.M.L.D.; Hellwing, A.L.F.; Nielsen, N.I.; Madsen, J. Methods for Measuring and Estimating Methane Emission from Ruminants. Animals 2012, 2, 160–183. [Google Scholar] [CrossRef]
  41. Doreau, M.; Arbre, M.; Rochette, Y.; Lascoux, C.; Eugène, M.; Martin, C. Comparison of 3 Methods for Estimating Enteric Methane and Carbon Dioxide Emission in Nonlactating Cows. J. Anim. Sci. 2018, 96, 1559–1569. [Google Scholar] [CrossRef]
  42. Liu, R.; Hailemariam, D.; Yang, T.; Miglior, F.; Schenkel, F.; Wang, Z.; Stothard, P.; Zhang, S.; Plastow, G. Predicting Enteric Methane Emission in Lactating Holsteins Based on Reference Methane Data Collected by the GreenFeed System. Animal 2022, 16, 100469. [Google Scholar] [CrossRef]
  43. Ramin, M.; Huhtanen, P. Development of Equations for Predicting Methane Emissions from Ruminants. J. Dairy Sci. 2013, 96, 2476–2493. [Google Scholar] [CrossRef]
  44. Jiao, H.P.; Yan, T.; McDowell, D.A.; Carson, A.F.; Ferris, C.P.; Easson, D.L.; Wills, D. Enteric Methane Emissions and Efficiency of Use of Energy in Holstein Heifers and Steers at Age of Six Months. J. Anim. Sci. 2013, 91, 356–362. [Google Scholar] [CrossRef]
  45. Jo, N.; Kim, J.; Seo, S. Comparison of Models for Estimating Methane Emission Factor for Enteric Fermentation of Growing-Finishing Hanwoo Steers. Springerplus 2016, 5, 1212. [Google Scholar] [CrossRef]
  46. Rooke, J.A.; Wallace, R.J.; Duthie, C.A.; McKain, N.; De Souza, S.M.; Hyslop, J.J.; Ross, D.W.; Waterhouse, T.; Roehe, R. Hydrogen and Methane Emissions from Beef Cattle and Their Rumen Microbial Community Vary with Diet, Time after Feeding and Genotype. Br. J. Nutr. 2014, 112, 398–407. [Google Scholar] [CrossRef]
  47. Flay, H.E.; Macdonald, K.A.; Camara, M.; Donaghy, D.J.; Roche, J.R. Hot Topic: Selecting Cattle for Low Residual Feed Intake Did Not Affect Daily Methane Production but Increased Methane Yield. J. Dairy Sci. 2019, 102, 2708–2713. [Google Scholar] [CrossRef]
Figure 1. Overview of the study design. (Throughout the adaptation period, the feeding ratio gradually shifted from 20:80 to 60:40 while maintaining the same nutrient composition provided during the study. Additionally, the RIC unit gate was initially set to an open mode and gradually transitioned to auto mode to acquaint the animals with the feeding method). Abbreviations: DMI, dry matter intake; RIC, roughage intake control.
Sustainability 15 14988 g001
Figure 2. Each animal represents distinct records at various time points, showcasing variations in CO2 and CH4 emissions.
Sustainability 15 14988 g002
Figure 3. Pearson correlation heatmap between growth production parameters and GHG emissions. The red color indicates a positive correlation, the blue color indicates a negative correlation, and the white color indicates no correlation. Pearson r values were calculated using SAS software version 9.4 (SAS Institute Inc., 2009). + Correlation is significant at the p < 0.1 (indicates a trend). * Correlation is significant at the 0.05 level.
Sustainability 15 14988 g003
Figure 4. Two-dimensional density Contour plot (A) and scatter graph (BF) describing relations between CH4 and CO2 emissions and emission factor.
Sustainability 15 14988 g004
Table 1. Chemical composition of the diet.
Parameters%
Dry matter88.32
Crude protein15.70
Crude fiber7.00
Ether extract3.04
Crude ash5.53
Acid detergent fiber13.71
Neutral detergent fiber31.78
Table 2. Data required to calculate the GEi, Ym, and CH4 emission.
ParametersNMeanMedianMaxMinSDSEReferences
CH4 production (g/d)9191.5187.6241.7172.221.77.25
CH4 yield (g/kg DMI)925.124.829.621.42.90.97
Body weight (Kg)938337445630057.119.1
Mature body weight (kg)9680 [16]
Weight gain (kg/d)92.001.963.210.500.830.28
Cfi 0.32 [13]
C 1.00 [13]
Cfi = coefficient for calculating NEm; C = coefficient with a value of 1.0 for castrated.
Table 3. Descriptive statistics of the calculated growth performance.
NMeanMedianMaxMinSDSE
Final Body weight (kg)938337445630157.119.1
Initial Body Weight (kg)935733944927357.219.1
Gain in weight (kg)927.028.045.07.0011.63.91
ADFI (kg)98.208.629.007.270.640.21
ADG (kg)92.002.003.001.000.830.28
DMI (kg/day)97.677.788.306.510.630.21
DMI g/d/Kg BW0.75989.089.996.983.54.581.53
FCR95.933.8817.22.804.691.56
ADFI, average daily feed intake; ADG, average daily gain; FCR, feed conversion ratio; DMI, dry matter intake.
Table 4. Descriptive statistics of the greenhouse gas metrics.
NMeanMedianMaxMinSDSE
CH4 production g/d9191.5187.6241.7172.221.77.25
CH4 yield g/d/Kg DMI925.124.729.621.42.920.97
CH4 intensity g/d/kg BW0.7592.152.132.661.790.250.08
CO2 production g/d98860863510,59173451188396.1
Table 5. Data needed to estimate overall CH4 emission factors.
ParametersNMean
DMI (kg/d)97.67
GEIi (MJ/d)9123.9
MEE (MJ/d)910.6
Ym98.64
NEm (MJ/d)927.8
NEg (MJ/d)929.2
REM%90.55
REG%90.37
GEIii (MJ/d)9162.7
GEi (MJ/kg)916.1
TDN%979.9
DE (MJ/kg)914.7
DE (as %)979.9
DMI = dry matter intake; GEI = gross energy intake; MEE = methane energy emission; Ym = methane conversion factor; NEm = net energy for maintenance; NEg = net energy for growth; REM = ratio of net energy available in diet for maintenance to digestible energy; REG = ratio of net energy available for growth in a diet to digestible energy consumed; GEIii = gross energy intake; GEi = gross energy content of feed; TDN = total digestible nutrients; DE = digestible energy calculated using the IPCC Tier 2 prediction equation.
Table 6. Emission factors (kg CH4/head/year) of Holstein steers according to the IPCC Tier 2 equations.
NMeanMedianMaxMinSD
EFA969.968.488.262.87.94
EFB969.968.488.262.87.94
EFC991.791.5137.250.829.2
EFD967.264.7112.238.422.7
EFE942.741.171.224.414.4
EF = emission factor.
Disclaimer/Publisher’s Note: The statements, opinions and data contained in all publications are solely those of the individual author(s) and contributor(s) and not of MDPI and/or the editor(s). MDPI and/or the editor(s) disclaim responsibility for any injury to people or property resulting from any ideas, methods, instructions or products referred to in the content.

