Abstract
Coconut fiber has excellent permeability and water retention properties, making it a popular choice as an organic substrate for cultivation in the field of facility agriculture. To investigate the dielectric properties of coconut fiber and develop an accurate measurement model for dielectric water content, a vector network analyzer was used to measure the relative dielectric permittivity of coconut fiber and study the dielectric properties of coconut fiber under different volumetric water contents, temperatures, and salinities. The results indicated that the relative dielectric permittivity of the coconut fiber increased with increasing volumetric water content. The optimal frequency range for measuring the water content of the coconut fiber was 200 MHz–3 GHz, with an optimal frequency of 210 MHz. The dielectric measurement model for the water content in the coconut fiber established at this frequency demonstrated good applicability, with an R2 of 0.9704 and RMSE of 0.0453 cm3/cm3. At the same moisture level (θV of approximately 30% and 50%), the error in the real part of the dielectric permittivity was less than 1.35 between 15 and 35 °C, and the error in the moisture content was less than 0.0339 cm3/cm3. The error due to the salinity was 0.0750 cm3/cm3. The experimental results showed that the modeling of the water content measurement of coconut fiber at 210 MHz can be applied to general greenhouse environmental conditions. This study serves as a valuable reference for calibrating the moisture monitoring sensors used in greenhouses for coir cultivation substrates, emphasizing the need for non-destructive, real-time monitoring of moisture content.
1. Introduction
Coconut fiber is an important material for plant growth substrates in facility agriculture [1]. Coconut fiber is a waste fiber powder material produced after the processing of coconut shell. Its main components are lignin, cellulose, and hemicellulose, which contribute to its looseness and air permeability [2]. Its excellent water-holding capacity provides an ideal environment for plant root growth [3,4]. Studies have found that the yield and quality of lettuce, melons, and marigolds cultivated in coir fiber increased to a certain extent compared with other cultivation substrates [5,6,7].
The accurate measurement of the substrate or soil water content is particularly important for crop growth and irrigation management. The measurement of soil water content using the dielectric method offers several advantages over other measurement methods, including high accuracy, a less destructive nature, and real-time monitoring. Research in soil physics has shown that soil dielectric permittivity contains a great deal of information that reflects the soil’s quality and properties. The soil water content and dielectric permittivity of the soil are closely related [8,9,10]. The relative permittivity of soil particles (3–4 at 20 °C) and air (approximately 1 at 20 °C) are very low, and the permittivity of water (80 at 20 °C) is much higher than that of soil and air [11]. Therefore, the relative permittivity of soil mainly depends on its water content. Therefore, soil water content can be indirectly obtained from relative dielectric permittivity. Soil moisture sensor technology, which utilizes time-domain or frequency-domain principles, is widely used and has become an important in situ observation tool in modern agriculture [12,13]. Physical and chemical properties such as soil texture, temperature, and salinity can influence the accuracy of the sensor [14,15]. Louki et al. showed that the sensor needs to be calibrated to achieve high accuracy within specific salinity and temperature ranges from 1.9 to 4.0 dS/m and 16 to 30 °C, respectively, beyond which the sensor will not function accurately [16]. Rosenbaum et al. showed that the accuracy of electromagnetic inductive soil moisture sensors is significantly affected by soil salinity and temperature, with underestimation occurring at low temperatures and overestimation at high temperatures. Additionally, they observed that salinity leads to deviations in dielectric permittivity from the theoretical results [17]. Therefore, the effects of the temperature and salinity on the sensor cannot be ignored.
With the development of soilless culture technology, dielectric sensors have also been used on organic substrates. Choi et al. studied moisture changes in the coir fiber of tomatoes using a frequency-domain reflectometer sensor [18]. Baek et al. conducted a quantitative study on the moisture content of the rockwool matrix using a capacitive moisture sensor and established an empirical equation for the relationship between capacitance value and moisture content [19]. Rhie studied changes in the physical properties of coir and perlite substrates at different ratios and calibrated a volumetric water content capacitive moisture sensor [20]. Similar to soil, the water content measurements are affected by the temperature and salinity of the coir fiber. Banon et al. compared the measurement accuracy of two sensors, EC5 and GS3, in coconut fiber under the influence of temperature and salinity and proposed a calibration scheme for the use of the two sensors under different conditions [21]. Rhie and Bañón have compared the accuracy of specific sensor measurements but have not commenced mechanistic investigations into the dielectric properties of coir fibers. Moreover, they did not suggest any optimizations for the measurement model related to the dielectric mechanism. Nemati et al. conducted a modeling study using time-domain reflectometry to measure water content in organic matrices, achieving an R2 value of 0.97 [22]. However, the effects of temperature and salinity have not been examined in their investigation. Soil moisture sensors are calibrated for specific soilless substrates to improve measurement accuracy when used in agricultural facilities [23]. In a study on the water content and pore water conductivity measurements of various horticultural substrates using frequency domain reflectometry, Incrocci et al. emphasized the need for substrate-specific calibration [24]. The physical and chemical properties of coconut fiber are different from those of soil, which has a certain complexity and particularity. There is a large error when the existing dielectric sensor is used directly in the coir fiber [25]. Moisture measurement models for coir fiber dielectrics are of great significance because of the difficulty in implementing effective water-saving irrigation control. Therefore, it is important to study the dielectric properties of coir fiber under various environmental conditions to ensure the fast and accurate measurement of the coir fiber water content in agriculture facilities.
These measurements were performed using a vector network analyzer in the frequency range from 10 MHz to 3 GHz under different water content, temperature, and salinity conditions. The bilinear theory was used in this study to convert the scattering parameters into relative dielectric permittivity. In this study, a dielectric model was established to measure the water content of coconut fibers at a characteristic frequency. This model enhanced the accuracy of the dielectric sensor. This study may serve as a reference for accurately measuring the water content of coconut fibers and for controlling irrigation in greenhouse settings.
2. Materials and Methods
2.1. Experimental Material
The raw material of the coir fiber was desalted by rinsing it with a large amount of fresh water. The basic physical properties of the coir fiber were determined using the method proposed by Bilderback and Byrne [26,27]. The coir was weighed using a ring knife of 100 mL. It was then air-dried and sieved before being lightly pressed and filled into a ring knife. The ring knife, along with the coir, was placed in a container and completely submerged in water for 24 h to measure the wet weight. Subsequently, the ring knife was placed on a wire mesh and weighed after 8 h of free drainage. The ring knife was then placed in a drying oven for 36 h to measure the dry weight. The bulk density, total porosity, air permeability, and water-holding porosity of the sample were calculated and are listed in Table 1.

Table 1.
Physical properties of coconut fiber substrate.
2.2. Experimental Design
After removing impurities, the coconut fiber was crushed, filtered through an 18-mesh sieve, and dried in an oven at 105 °C for 24 h. The required amount of coir fiber for each sample was weighed according to the volume of the PVC pipes (height, 30 mm; diameter, 46.5 mm) and sealed in plastic bags. Deionized water was used to configure the samples with a volumetric water content of 0, 10, 20, 30, 40, 50, 60, and 70%. The plastic-sealed bags were allowed to stand at room temperature (23 ± 2 °C) for 12.5 h before being filled and compacted into PVC pipes in two batches and then sealed with clingfilm to reduce water loss. To investigate the effect of ambient temperature on the measured value of the dielectric permittivity of the coir fiber, samples with 30% and 50% moisture content, by volume, were placed in a thermostat at temperatures of 5, 15, 25, 35, and 45 °C, and the dielectric permittivity of the samples was measured after 4 h. Considering the effect of the salt in the coir on its dielectric properties, NaCl solutions with concentrations of 0, 0.009, 0.017, 0.026, and 0.034 mol/L were configured, and specimens with 30% and 50% water contents, by volume, were prepared according to the above steps.
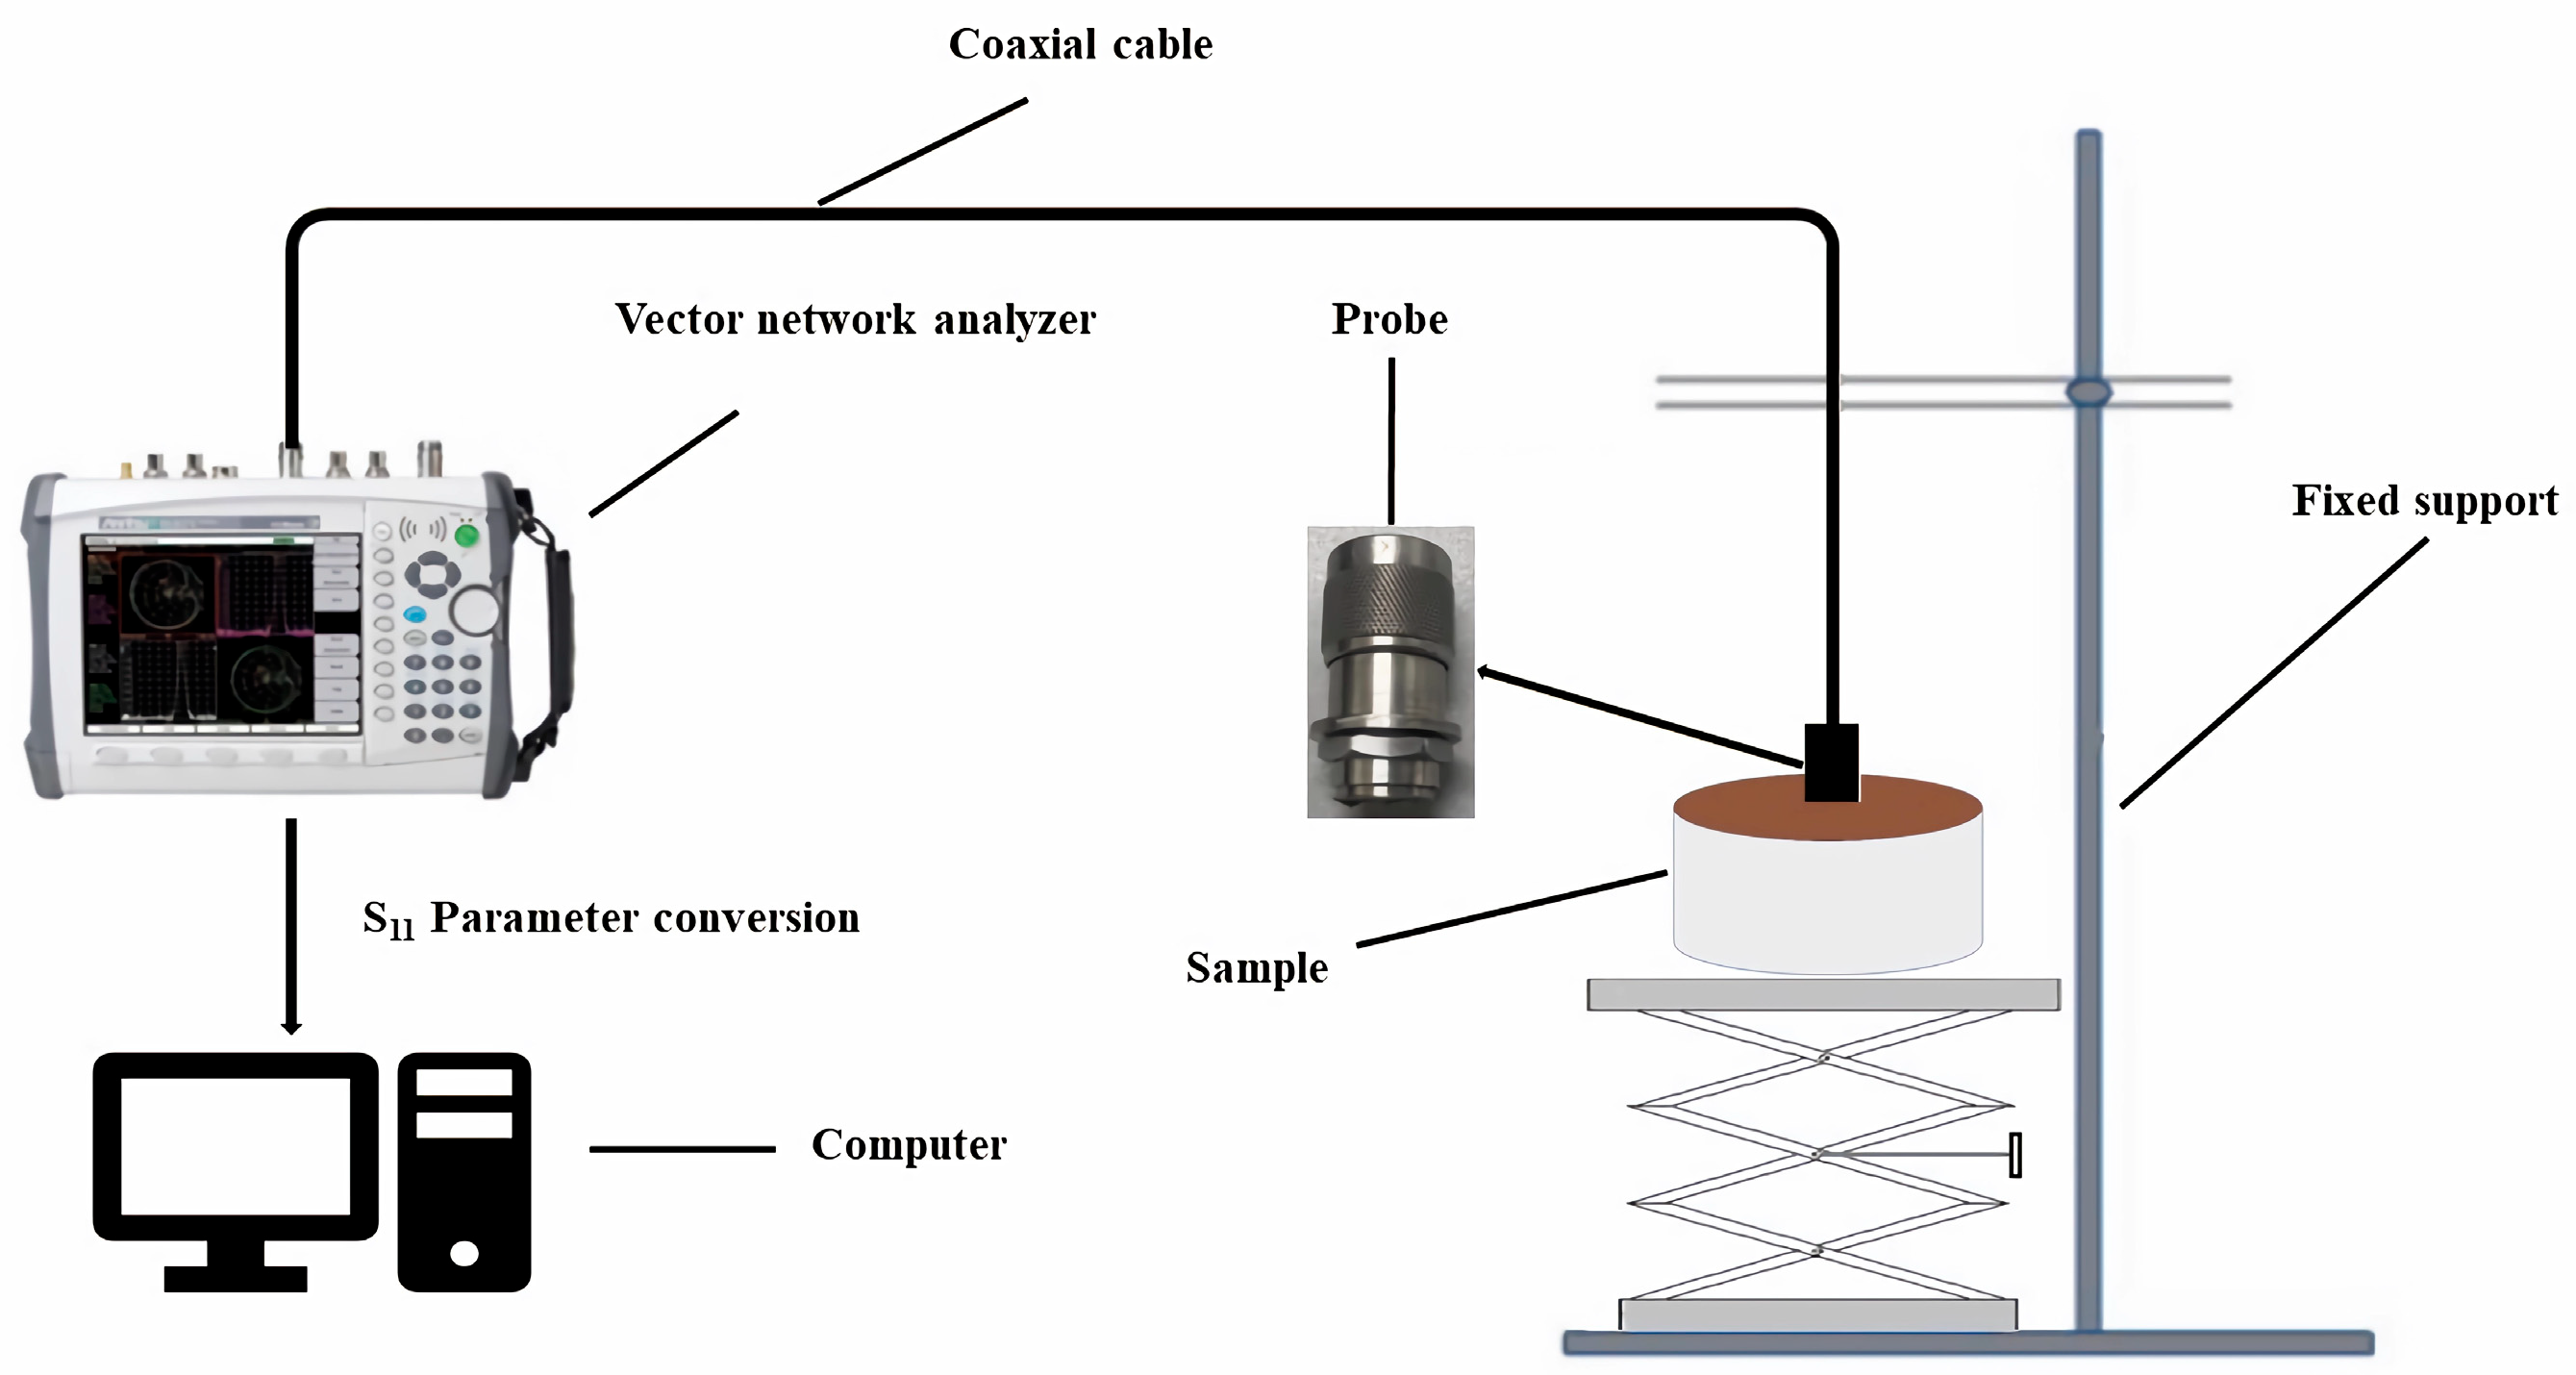
An Anritsu-MS2028B vector network analyzer was used with a 14 mm open-ended coaxial dielectric probe. The equipment was turned on for 2 h to achieve a thermal balance of the internal devices. The sampling point was set to 501 and the measurement frequency was set in a range from 10 MHz to 3 GHz. The measurement was performed only after calibration with Short, Open, and Load (50 Ω) tee calibrators. Three measurements were performed for each sample, and the average value of the measured S11 parameters was recorded. The actual moisture content was measured using a drying method. Three samples from each PVC pipe were weighed using a balance and their values were recorded; the samples were then placed in an oven. This was performed by collecting samples around the locations of the previous measurements. Moisture content was calculated using the average value. The measurement system used for the test is shown in Figure 1.
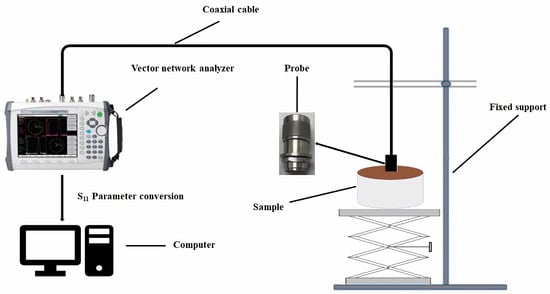
Figure 1.
Schematic of the measuring system.
2.3. Principle of Dielectric Measurement
When discussing the dielectric polarization and relaxation properties in an alternating electric field, the dielectric permittivity needs to be expressed in a complex form (). In the study of the dielectric properties of materials, is an important parameter to express the dielectric properties of materials [28,29].
where is the relative dielectric permittivity, is the real part of the dielectric permittivity, and is the dielectric loss factor (imaginary part of the dielectric permittivity). The real part of the dielectric permittivity represents the electrostatic energy stored by the bound charges in the medium owing to polarization in the external electric field. The dielectric loss factor characterizes the energy loss of a material in the presence of an external electric field [30,31].
In this experiment, the bilinear theory was used to convert the scattering coefficient S11 (measured using the vector network analyzer) into the relative dielectric permittivity. In dielectric measurements based on the coaxial probe method, the unknown sample conductances are related as follows [32]:
where is the unknown conductance, is the sample conductance, and are the probe parameters, C* is the smoothing coefficient, and is the reflection coefficient. where is defined as:
The formula for calculating the relative dielectric permittivity in the time domain is
where is the relative dielectric permittivity; A*, B*, , C* are defined as above.
Time domain is converted to frequency domain through Fourier transform:
where a is redefined as:
Equation (4) provides a method for correcting the effects of wave propagation and residual reflections using reference dielectric permittivity measurements. The bilinear coefficients can be determined by solving the two equations simultaneously using two reference materials with known dielectric permittivity and reflection coefficients. To calculate the above parameters using three dielectric samples with known dielectric permittivity, deionized water and isopropoxyethanol were chosen as reference materials for this experiment and were normalized with respect to the reference scattering parameters measured in the air [33,34].
3. Results and Discussion
3.1. Relationship between Moisture Content and Dielectric Permittivity of the Coconut Fiber Substrate
3.1.1. Dielectric Properties of Coconut Fiber with Different Water Contents
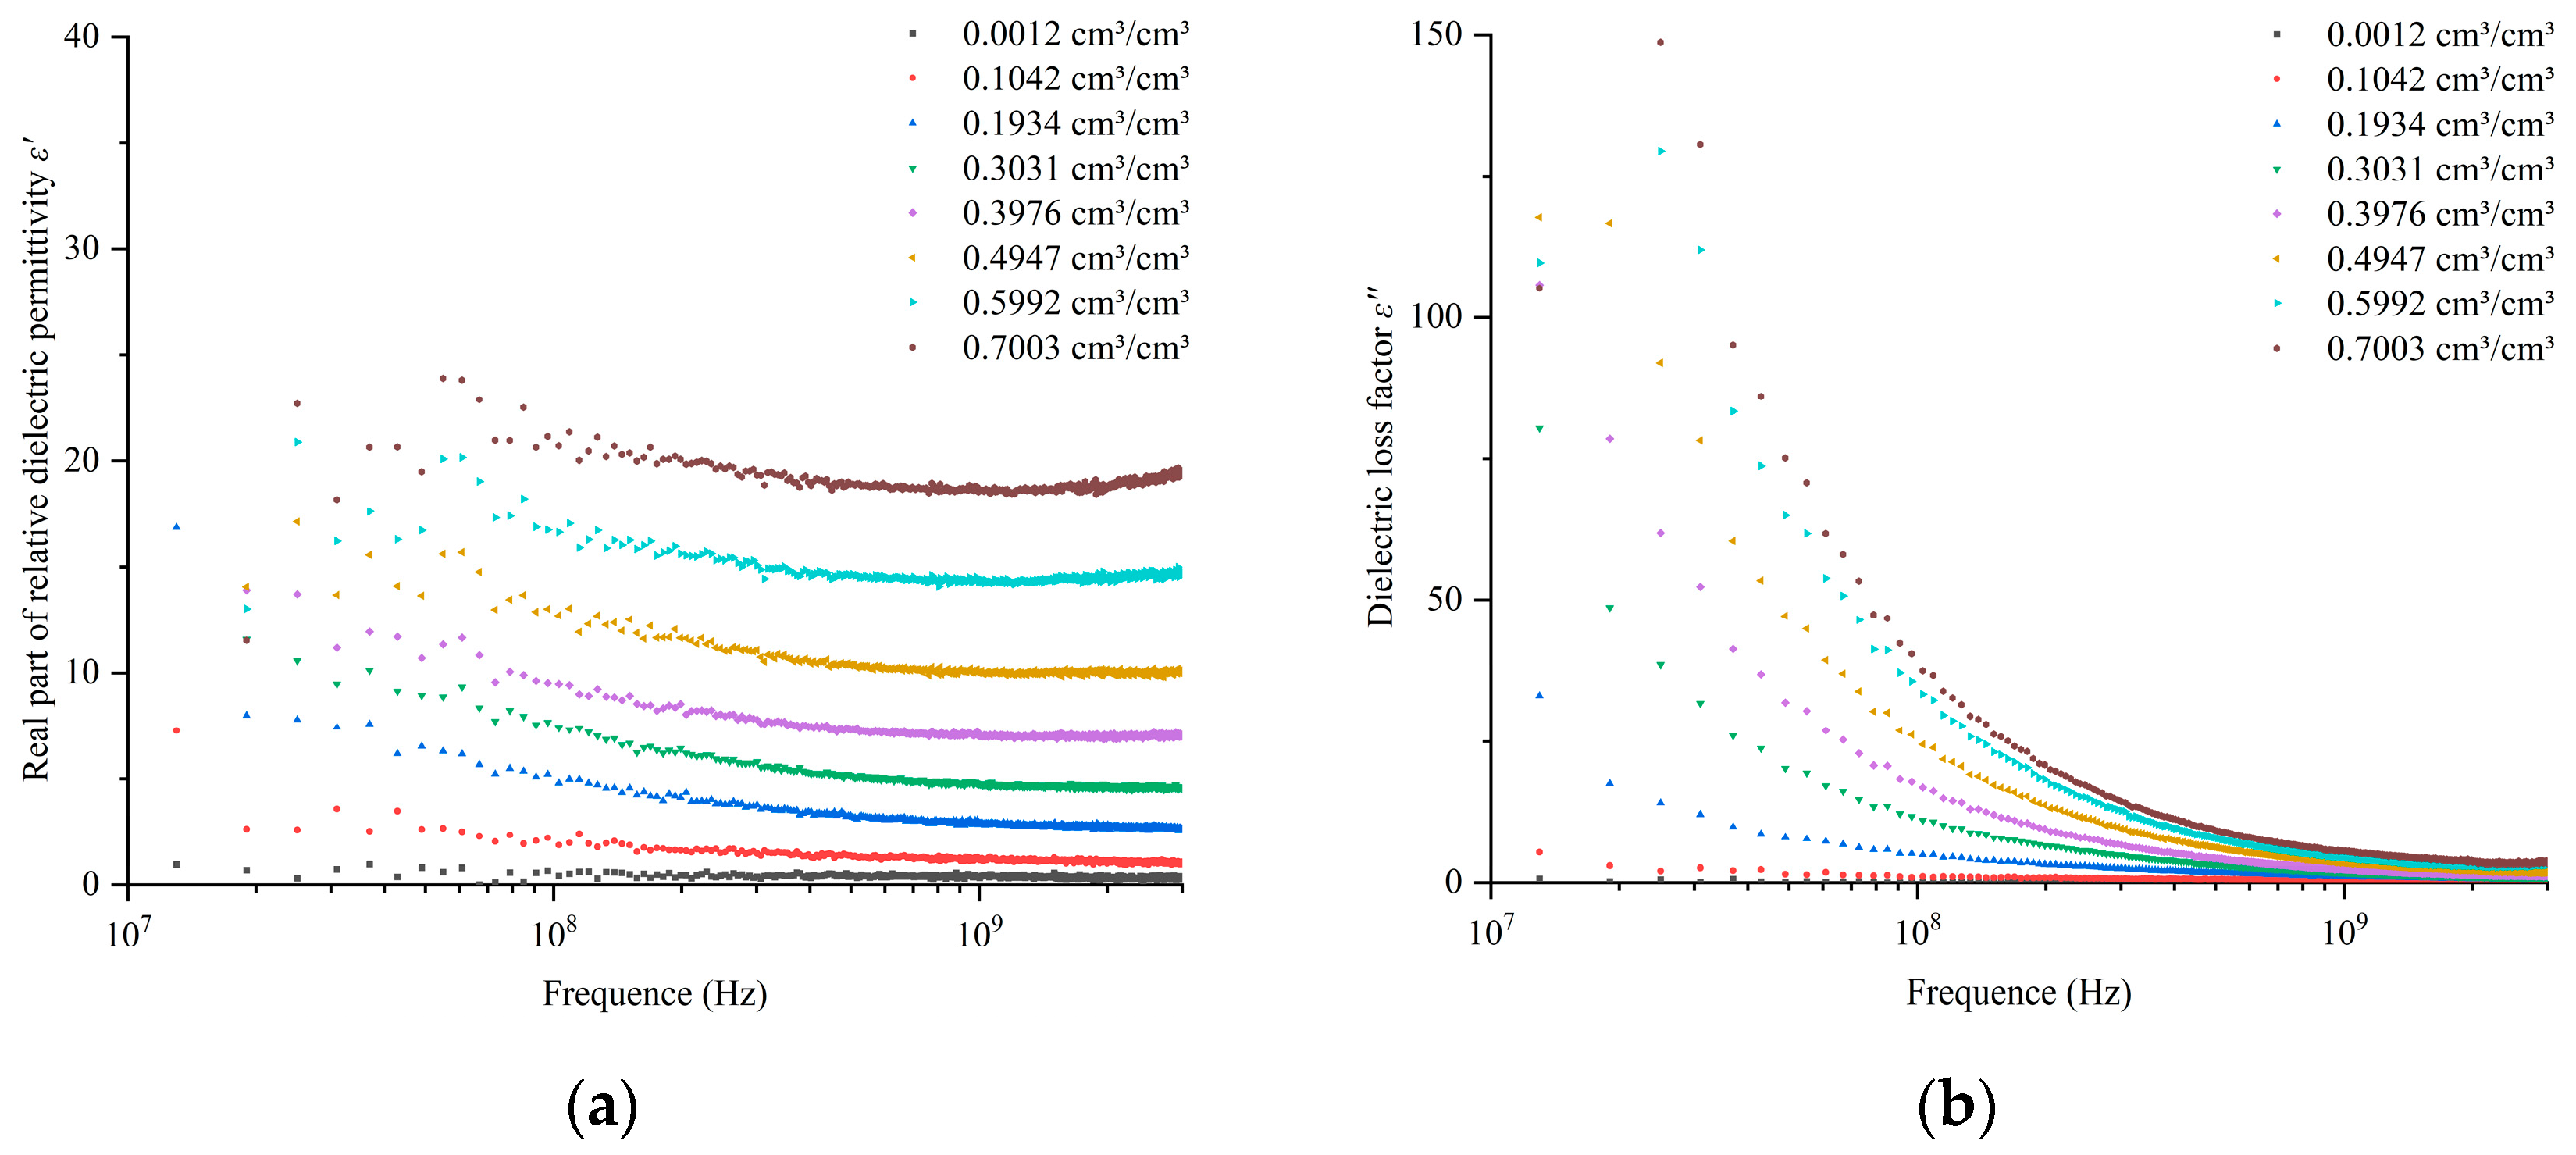
An Anritsu-MS2028B vector network analyzer was used to measure the coir matrix samples at eight moisture content levels. The measured S11 parameters were converted to relative permittivity using a bilinear dielectric measurement model, and the average of three measurements was used. The results are shown in Figure 2, where the label represents the actual volume moisture content of the matrix after calibration using the drying method.
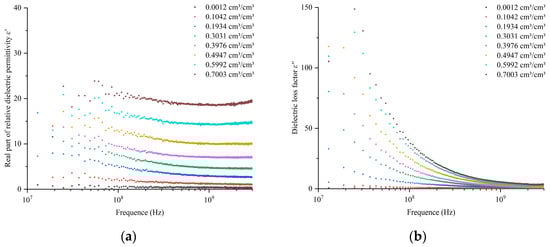
Figure 2.
Dielectric properties of coconut fiber with different water content: (a) real part of relative dielectric permittivity; (b) dielectric loss factor.
The results showed that the dielectric permittivity of the coir fiber with different water contents differed significantly: the larger the water content of the substrate, the larger its dielectric permittivity. The coir fiber particles were rough and porous, and the dried particles did not adhere firmly to each other. The incorporation of water amplified the adhesion properties of the fibers. When the water content of the coir fiber was approximately 0, the dielectric permittivity was approximately 1.46. The real part of the dielectric permittivity for each water content of the coir fiber decreased slowly in the frequency range of 10 MHz–200 MHz, and its dielectric permittivity decreased with increasing frequency and tended to level off gradually in the frequency band larger than 200 MHz. Its dielectric permittivity in the frequency range of 10 MHz–200 MHz showed a relatively large decrease; the larger the moisture content of the substrate, the more significant the decrease in its value. At 2 GHz, the dielectric loss factor slowly decreased to a minimum. A comparison of the dielectric spectra of soils with different water contents showed that the real part of the dielectric permittivity of the coir fiber for each water content was smaller than that of soil with the same water content; however, the value was more stable above 200 MHz [35,36,37].
Dielectric permittivity can comprehensively respond to the polarization response of macroscopic matter to an external electric field and produce different polarization behaviors in different frequency ranges. These were mainly electronic, ionic, oriented, and interfacial polarizations. In the frequency range from 10 MHz to 3 GHz, interface and orientation polarizations were primarily observed. Both polarizations influenced the real and imaginary parts of the relative dielectric permittivity. As shown in Figure 2a, the dielectric permittivity of the coir fiber at different volumetric water contents produced significantly different curves. This can be attributed to the increase in free water within the coir fiber–water–air mixture as the water content increased. Notably, free water is a polar substance with a large dielectric permittivity in the microwave frequency band. When comparing the coir fiber–water–air mixture with the soil–water–air mixture, based on the soil multiphase mixed media model [38,39], the permittivity of the water was significantly different from that of the coconut bran and air in the mixed system. Consequently, the dielectric property of water is dominant, and its permittivity increases as the volume ratio of water increases. In the low-frequency band from 10 MHz to 200 MHz, interface polarization mainly occurred in the coir fiber under the action of the external electric field, and the internal positive and negative ions moved to the negative and positive poles, respectively, at the composite interface, which led to the local aggregation of the internal space charge in the coir, resulting in an unbalanced distribution density and the generation of a macroscopic electric dipole moment. The real part of the dielectric permittivity of the system in the low-frequency band was larger; then, with the increase in frequency in the higher-frequency band, the role of interface polarization on the system decreased, and its permittivity tended to be stable after a gradual decrease [40,41]. Figure 2b shows the dielectric loss factor, which represents the change in the electric field owing to energy loss or dielectric loss. It also illustrates the occurrence of short-range displacement and the leakage of conductive current in the low-frequency band caused by the influence of internal charged particles in the external electric field [42]. As the frequency increased, the current asymptotically decreased in dielectric loss. When the dielectric loss was reduced to a minimum, the interfacial polarization no longer played the dominant displacement polarization role; thus, the latter was strengthened with a slight upward trend.
3.1.2. Construction of a Dielectric Measurement Model for the Water Content of Coconut Fiber
By analyzing the effect of water content on the dielectric permittivity of coir fiber through complex dielectric spectroscopy, it was found that the relative dielectric permittivity can better reflect the dielectric properties of coir fiber under different water contents, which can be used as a measurement parameter for the water content sensor of coir fiber in facility agriculture. Figure 2a,b shows that the real part of the dielectric permittivity of the coir fiber is more stable in the frequency range of 200 MHz–3 GHz, and there is a clear distinction between the different water contents. According to the dielectric spectrogram analysis, a total of ten characteristic frequency points (205, 210, 300, 600, 1200, 1500, 2100, 2400, 2700, and 3000 MHz) were selected in this range, and linear fitting was performed for the volumetric water content and real part of the relative dielectric permittivity of the coir fiber at each characteristic frequency point. The results of the fitting correlations are shown in Table 2.
Table 2.
Dielectric model of the water content of coconut fiber at characteristic frequency points.
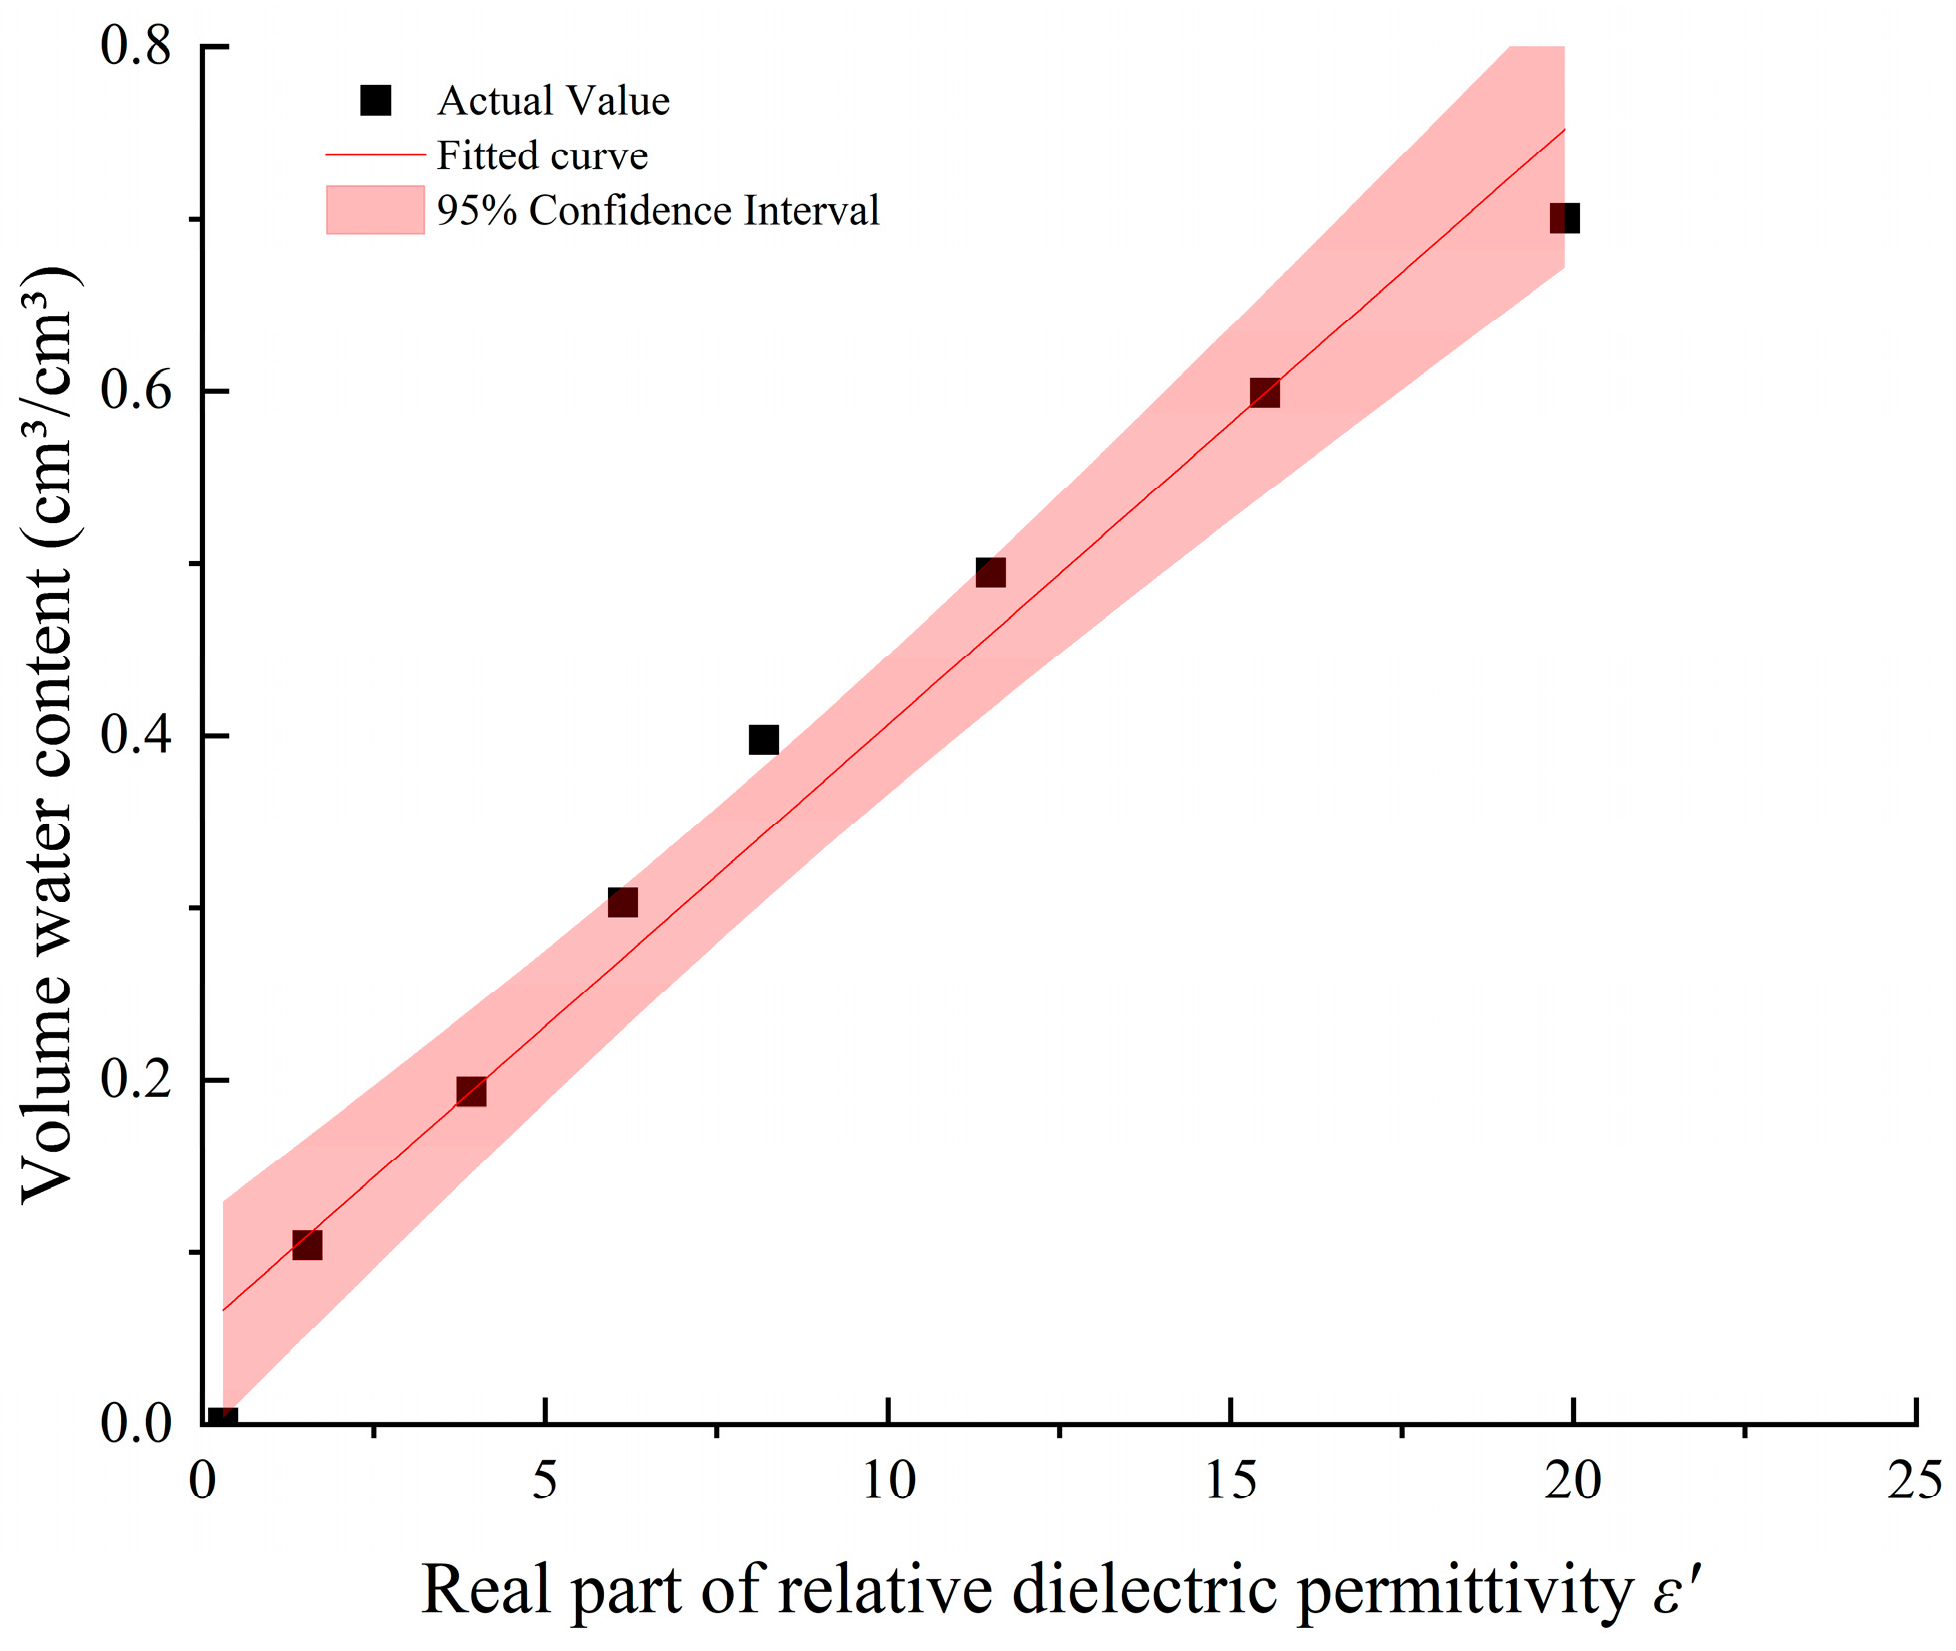
The results in Table 2 show that the characteristic frequency points at frequencies ≥ 200 MHz have a correlation coefficient of determination R2 > 0.94 and an RMSE in the range of 0.0453–0.0643 cm3/cm3 with high accuracy. At a frequency of 210 MHz, R2 reached a maximum of 0.9704 and the RMSE was 0.0453 cm3/cm3, which can be used as the measurement frequency of the dielectric model of the water content of the coir fiber. The relationship between the volumetric water content and dielectric permittivity of the coconut fiber obtained at this frequency is shown in Figure 3. The model developed in this study at 210 MHz is simpler and more accurate for coconut fibers than the cubic polynomials used in the literature [22] for organic substrates. The use of cubic polynomials in this study resulted in overfitting; therefore, linear fitting is more suitable for measuring the moisture content of the coconut substrates.

Figure 3.
Relationship between water content volume and dielectric permittivity of coconut fiber (210 MHz).
3.2. Effect of Temperature on the Dielectric Properties of Coconut Fiber
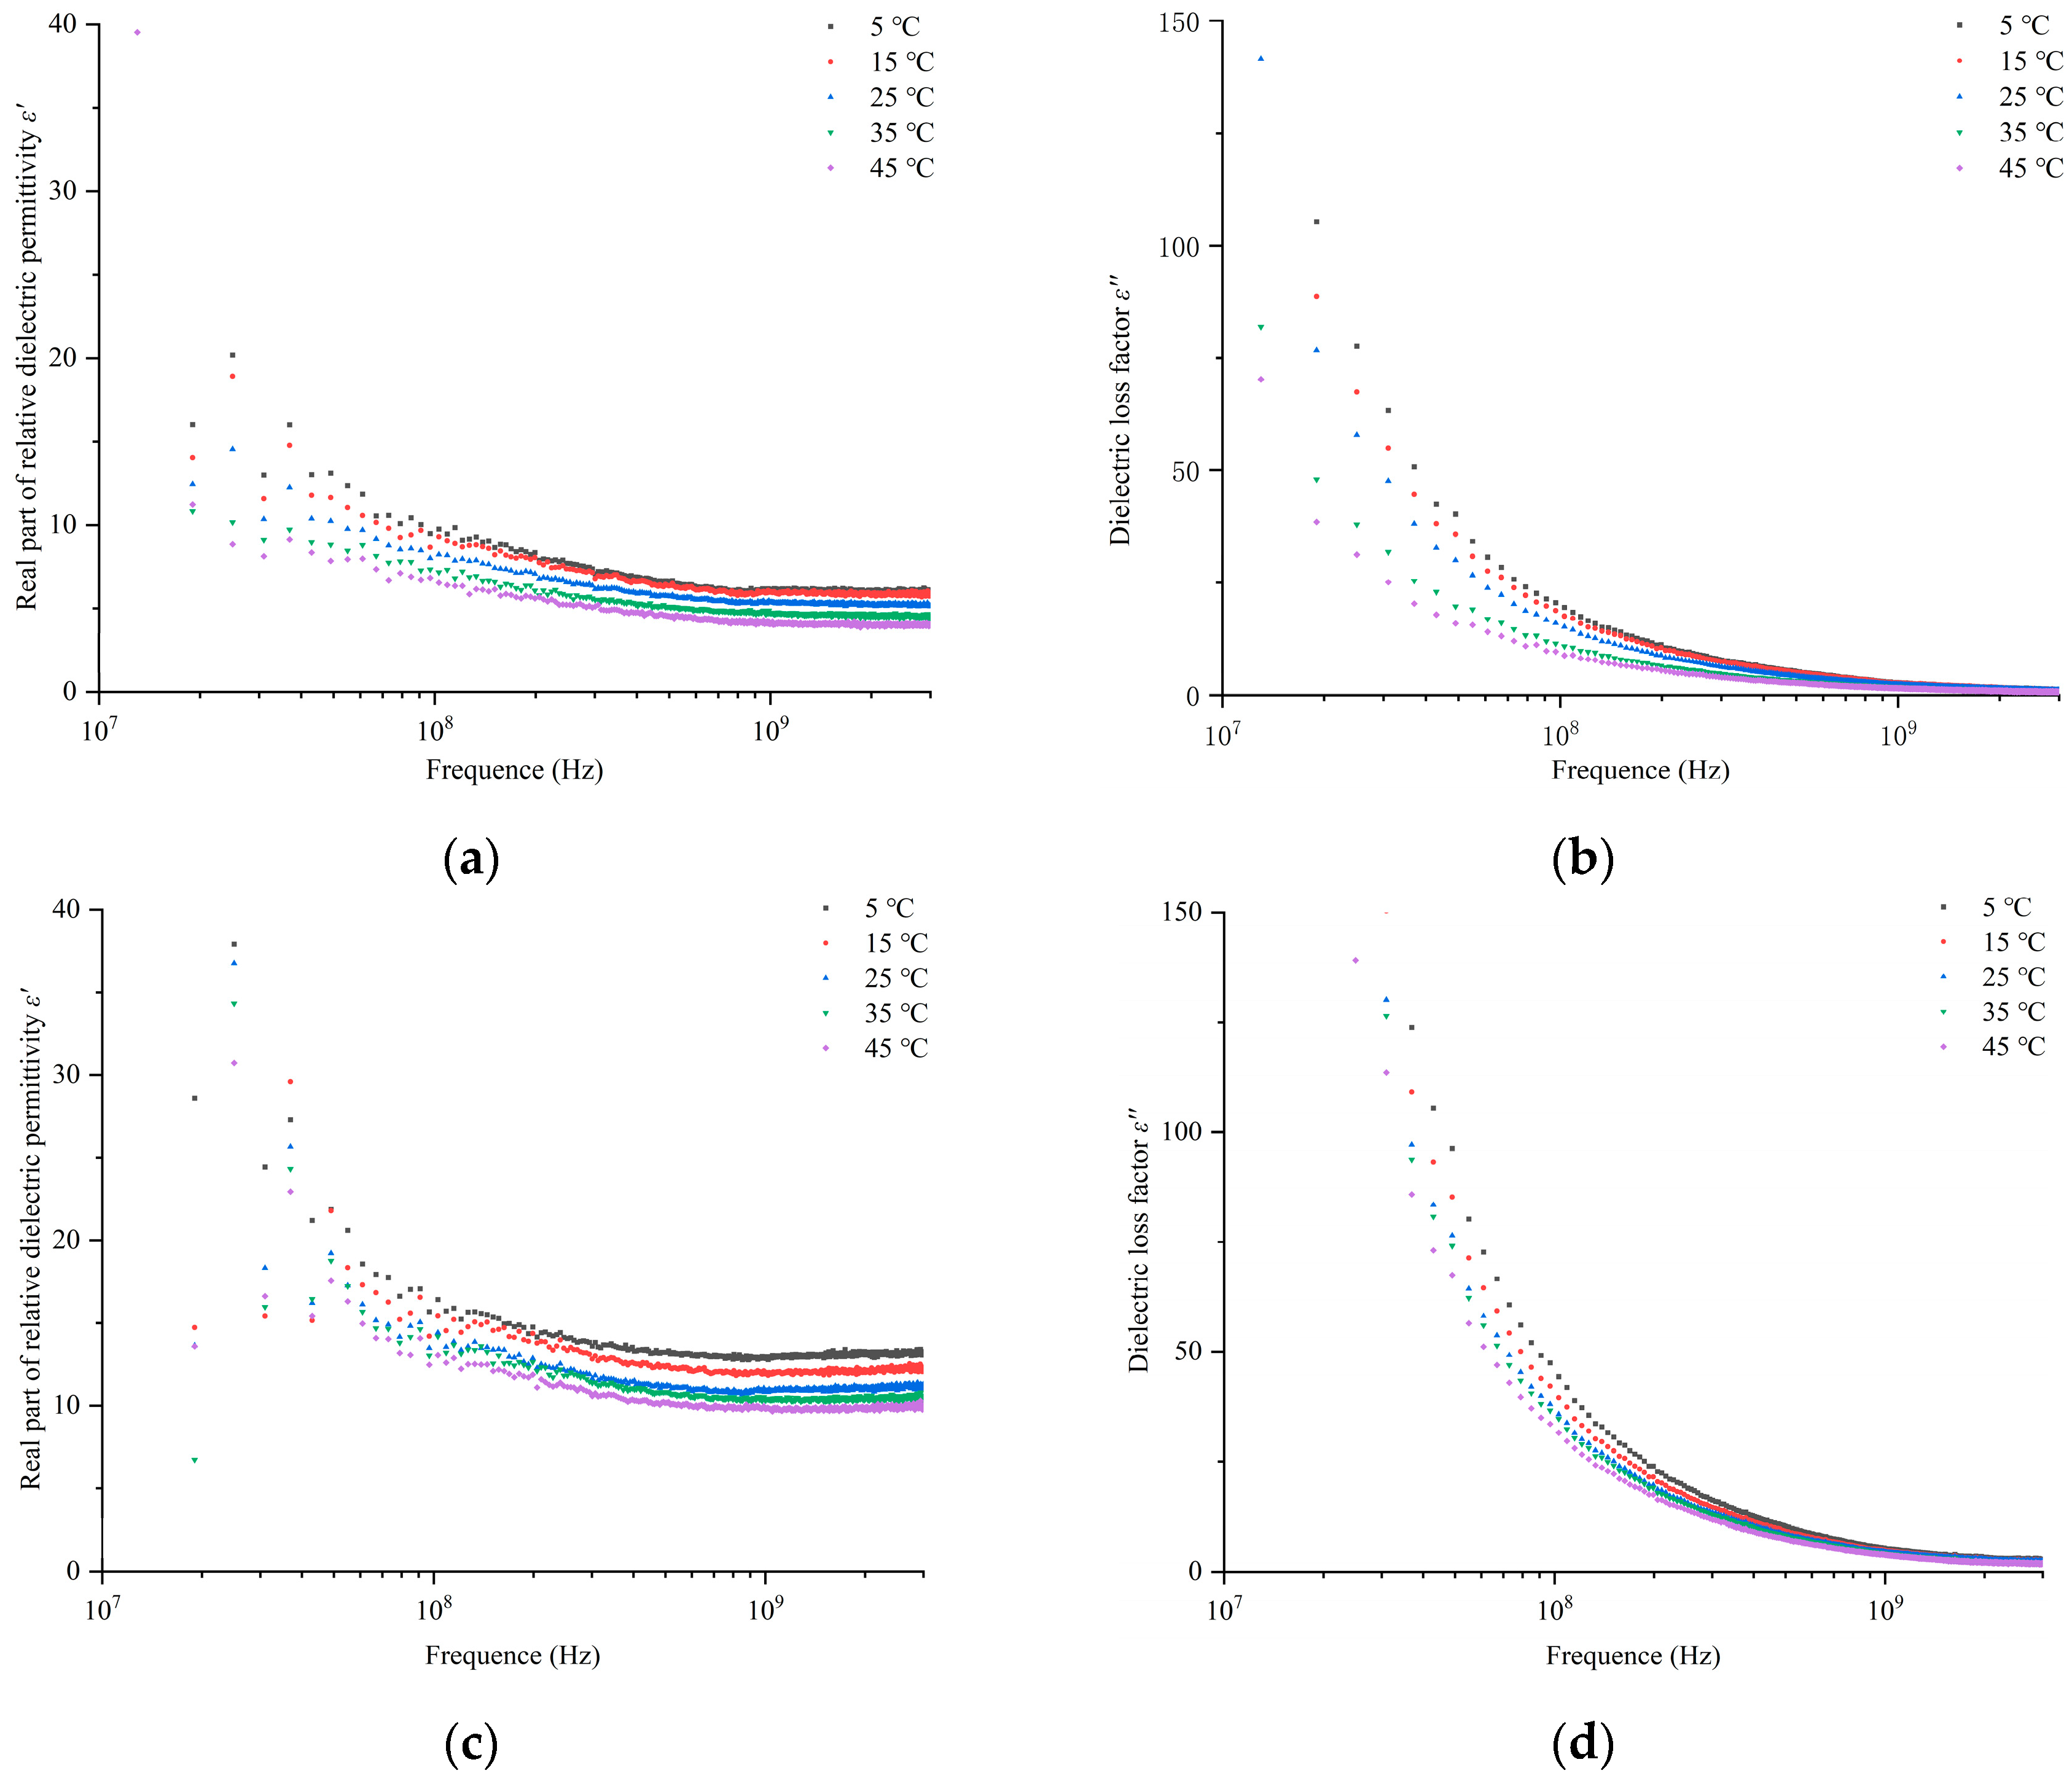
The effect of temperature on the relative dielectric permittivity of the coir fiber in the frequency range from 10 MHz to 3 GHz is shown in Figure 4. From the curves in the figure, it can be observed that the trends of the curves of the real and imaginary parts of the relative dielectric permittivity at different temperatures were the same; however, all of them showed a decreasing trend as the temperature increased. The dielectric permittivity of water decreases with increasing temperature [28,43], which increases the molecular motion in water and decreases the intermolecular interaction force, as well as the dielectric permittivity. In the dielectric performance of the coir fiber–water–air mixture, the dielectric properties of water dominated; therefore, the dielectric permittivity of the mixed system decreased with an increase in temperature. This result is in agreement with the conclusions reached by Banon et al., who evaluated the effect of temperature on the application of EC5- and GS3-type sensors in coconut fiber under low-salinity conditions [21]. An increase in the dielectric permittivity of soils with increasing temperature has been described in the literature [39], such as in laterite, loess, and sandy soils [44,45]. The reason for the different responses of the dielectric properties of the coir fiber and soil may be that the main components of the coir fiber are lignin and cellulose and that, after desalination treatment, the free charge becomes less than that of soils containing many mineral elements. As the temperature increased, the soil ions became more polarized in response to the external electric field, increasing their dielectric loss and displacement current. However, the degree of the polarization of the coir bran matrix was lower and the number of ions and deflection was lower. Consequently, the deflection was reduced, and, owing to its stronger water adsorption capacity, the dielectric performance of the mixed system was primarily influenced by the dielectric properties of water. Therefore, the two are not the same under the influence of temperature dielectric properties [46].
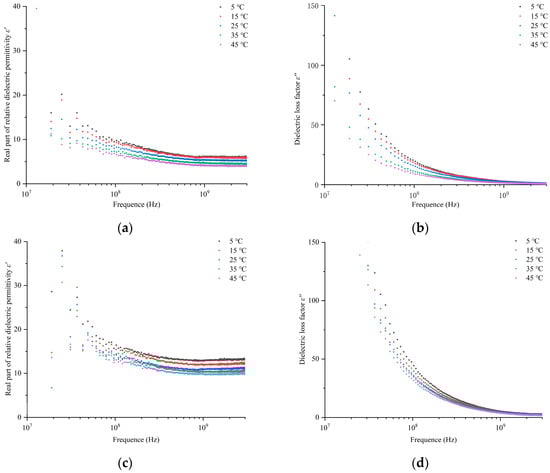
Figure 4.
Relative dielectric permittivity of the coconut fiber at different temperatures: (a,b) the real part of the dielectric permittivity and dielectric loss factor at θV = 30.31%; (c,d) the real part of the dielectric permittivity and dielectric loss factor at θV = 49.47%.
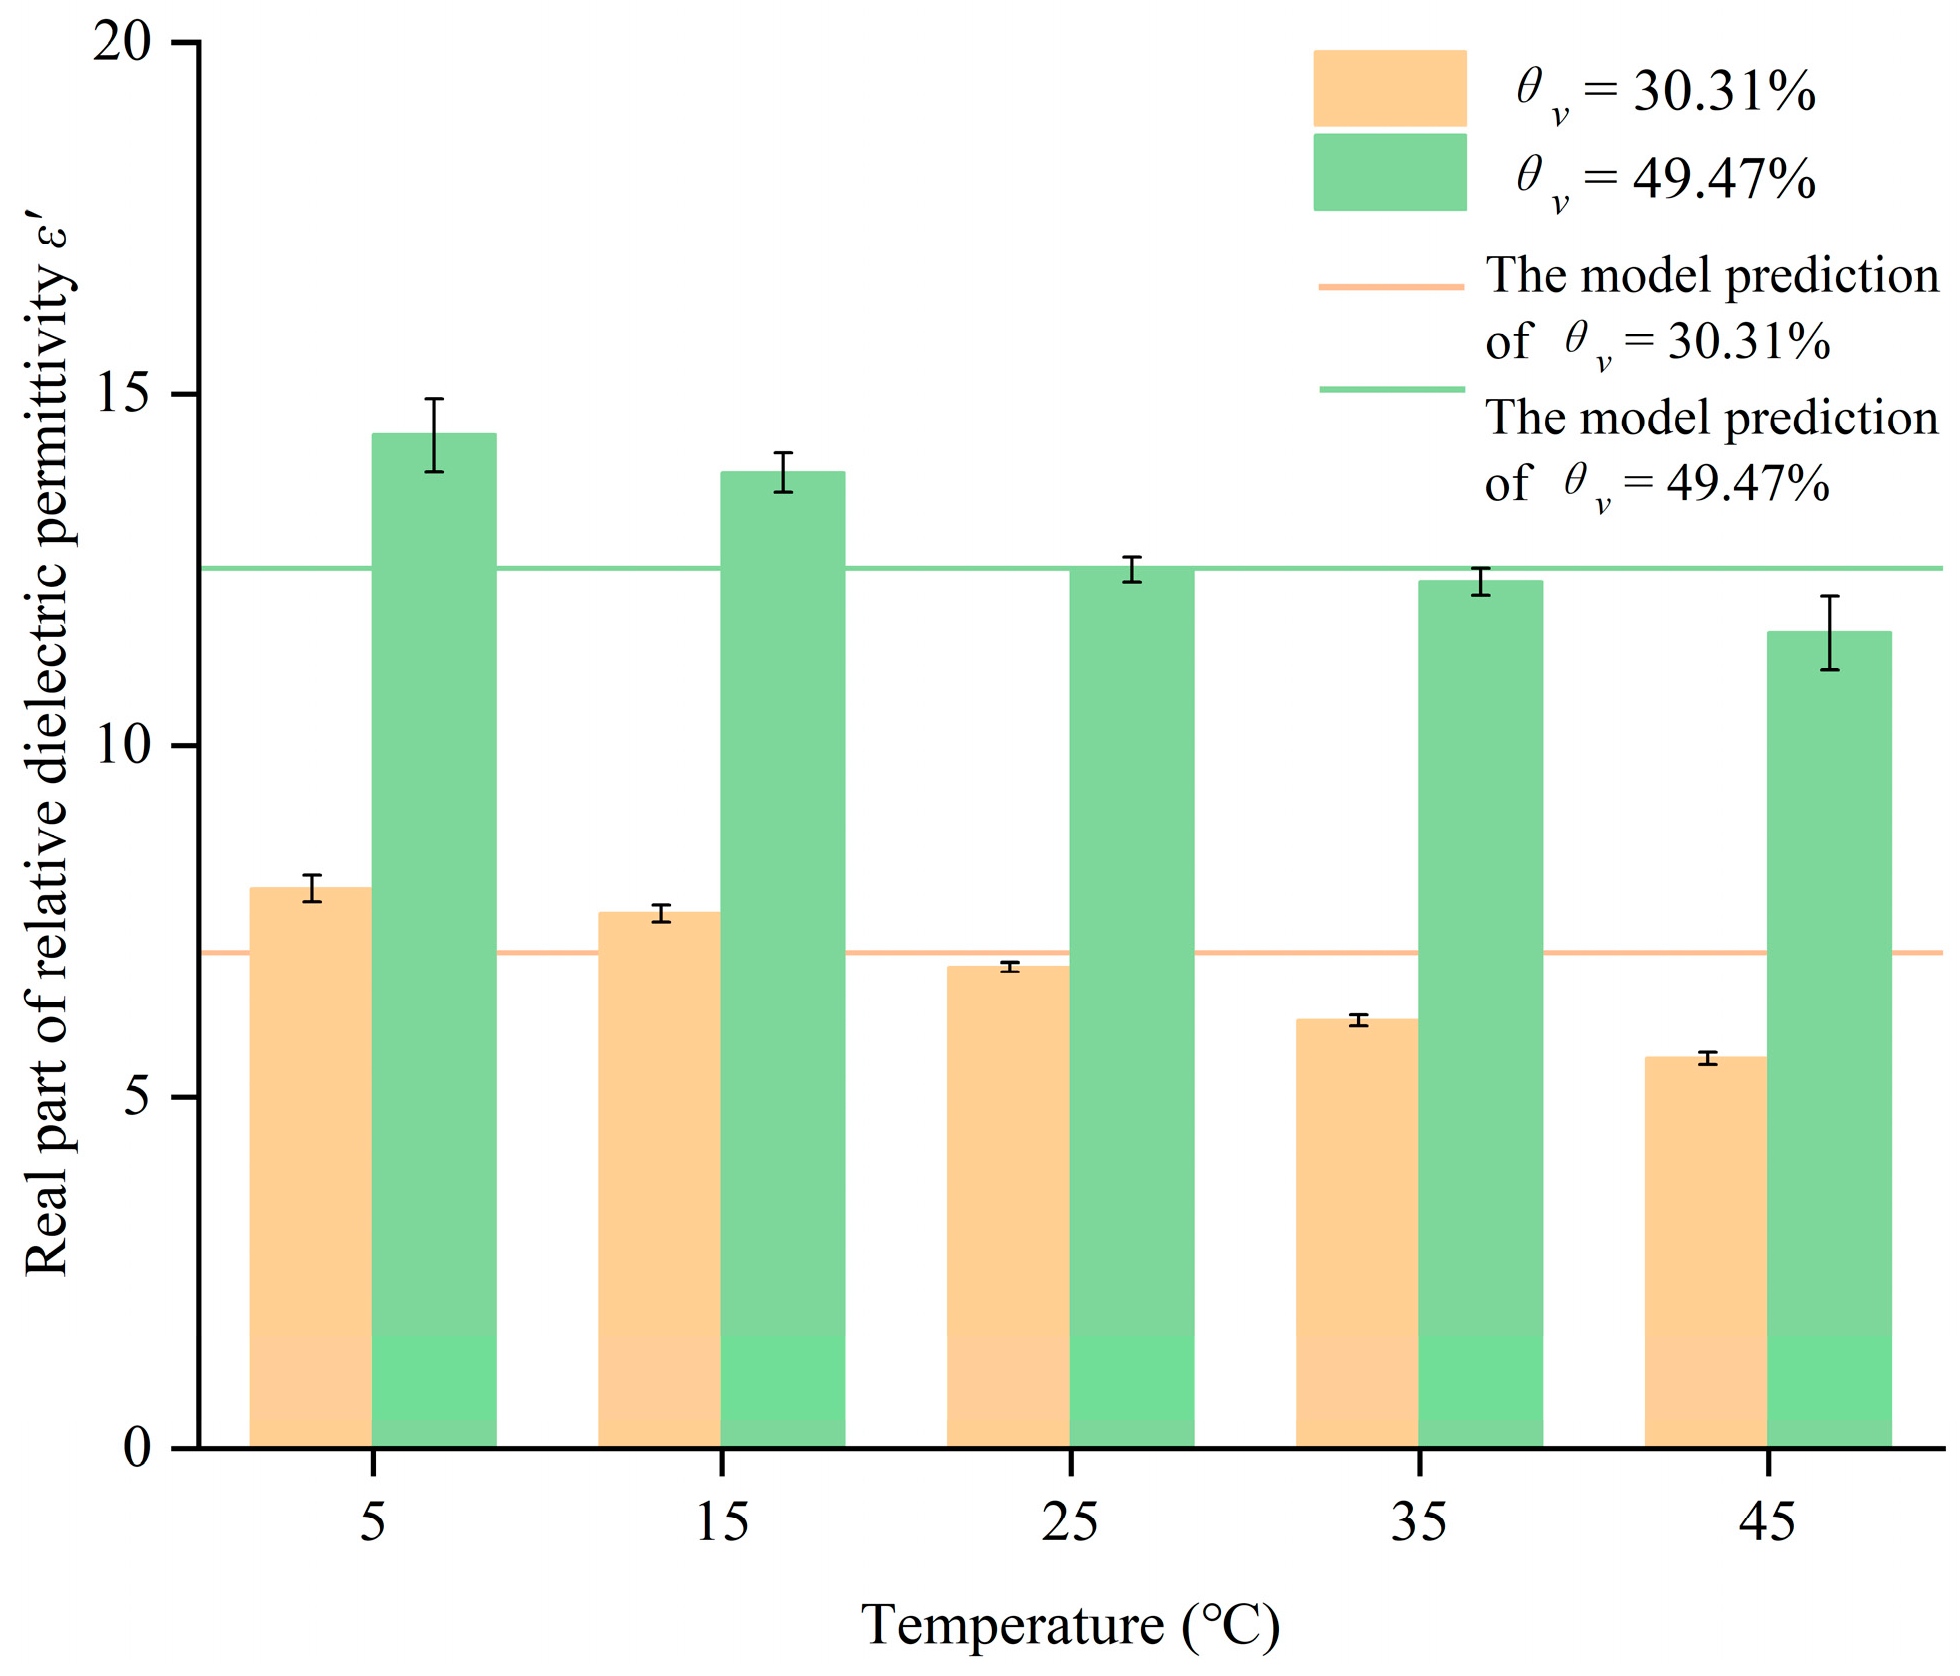
The real part constants of the dielectric at different temperatures for the coir fiber with 30.31% and 49.47% volumetric moisture content at the 210 MHz frequency point are shown in Figure 5. Between 15 and 35 °C, the real part error value of the dielectric permittivity was less than 1.35, and the error of the water content was less than 0.0339 cm3/cm3. When the temperature was low, the actual measured value of the real part of the dielectric permittivity of the matrix was too high, as was the water content estimated by the model. However, this effect was reversed at higher temperatures. Studies have shown that the suitable growing temperature for various fruit and vegetable crops in greenhouses ranges from 18 to 28 °C [47]. The effect of temperature increased the prediction error of the model: the greater the temperature difference from room temperature (23 ± 2 °C), the greater the error in the dielectric permittivity. Therefore, it can be seen that the dielectric measurement model of the coir fiber water content established at a frequency of 210 MHz has less deviation in the prediction results between 18 °C and 28 °C, which can be applied to the general temperature environment of the greenhouse.
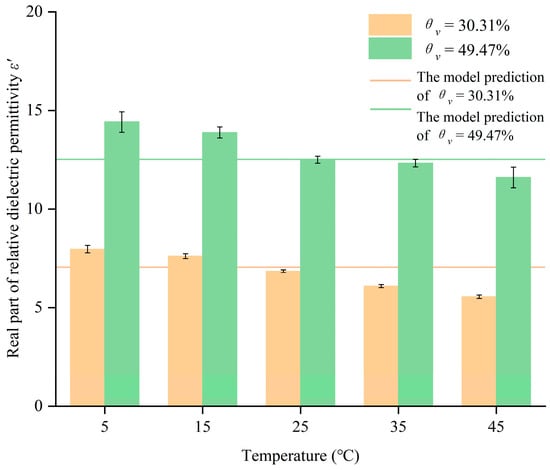
Figure 5.
Dielectric permittivity at different temperatures at a characteristic frequency of 210 MHz.
3.3. Effect of Salinity on the Dielectric Properties of Coconut Fiber
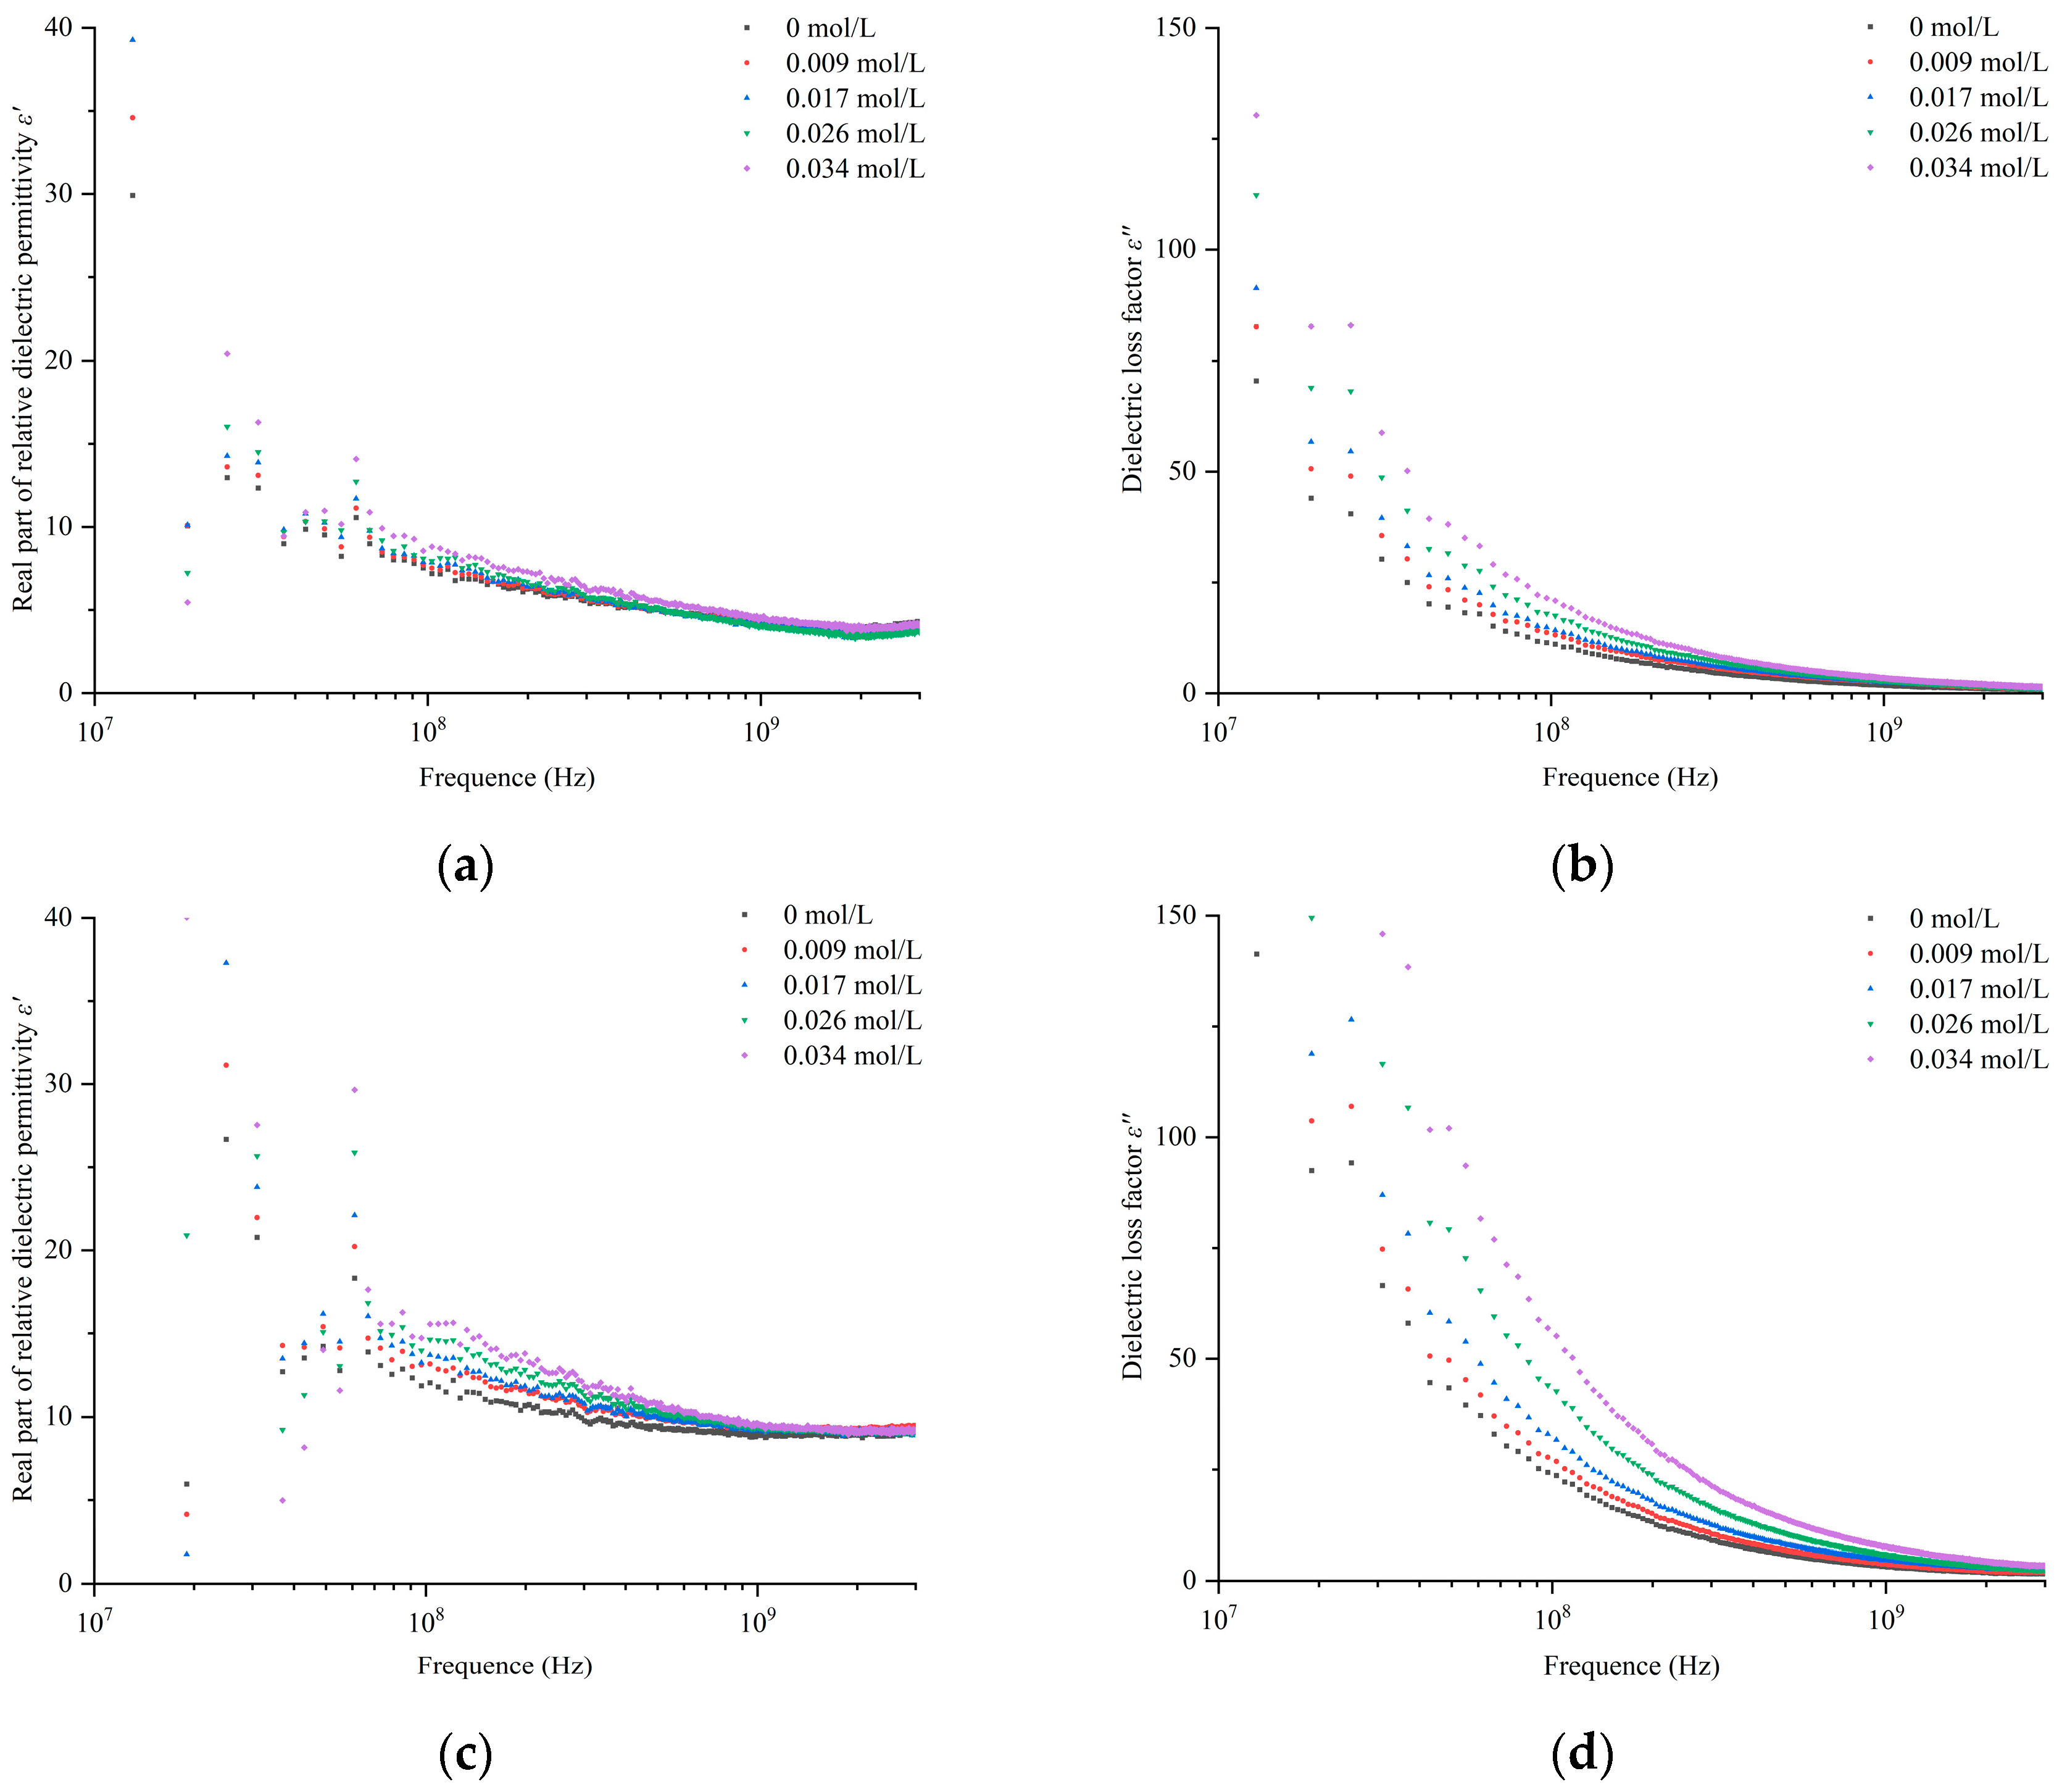
As shown in Figure 6, the change in salt content plays a role in the effect on the dielectric properties. The effect of salt on dielectric permittivity increased as the water content increased, whereas that of salt decreased and stabilized as the frequency increased. The greater the salt concentration, the higher the relative dielectric permittivity. In addition, the response of the dielectric loss factor to salinity was more clearly discernible than that of the real part. This phenomenon is different from that of other researchers who have found the effect of salinity on soil dielectric properties. Although the variation in the dielectric loss factor of coconut fiber and soil was the same, the salinity of the soil condition had little effect on the real part of the soil’s relative dielectric permittivity [48]. Unlike soil, the dielectric properties of the system are minimally affected by the physical and chemical properties of the coconut fiber and are primarily influenced by the water content. The inclusion of salt subsequently increased the quantity of anions and cations present in water, intensifying interfacial and orientational polarization. This increased in the real part of the dielectric permittivity. The dielectric loss factor represents the electromagnetic energy consumption and actual thermal effect energy consumption. The ions dissolved in water increase the conductivity of the water and move under the action of an external electric field to form a body current, which produces a current thermal effect that increases the dielectric loss such that the dielectric loss factor becomes larger [49,50]. Comparing Figure 6a,c shows that the effect of salt on the real part of the dielectric permittivity is less when the water content is low. However, as the water content increased, the effect of the salt increased the error. The maximum error values at 210 MHz were 0.0314 and 0.0750 cm3/cm3 for the 30% and 50% moisture contents, respectively. In facility agriculture, the salt content of the substrate must be kept at a low level to avoid stressing the plants [51]; therefore, the dielectric measurement model of the water content of the coconut fiber established at a frequency of 210 MHz at a low salinity level is still applicable. The use of GS3- and EC5-type sensors in coir fibers in the literature [21] requires more complex calibrations for temperature and salinity. The empirical formulas developed in this study can be used directly under general greenhouse environmental conditions with minimal error.
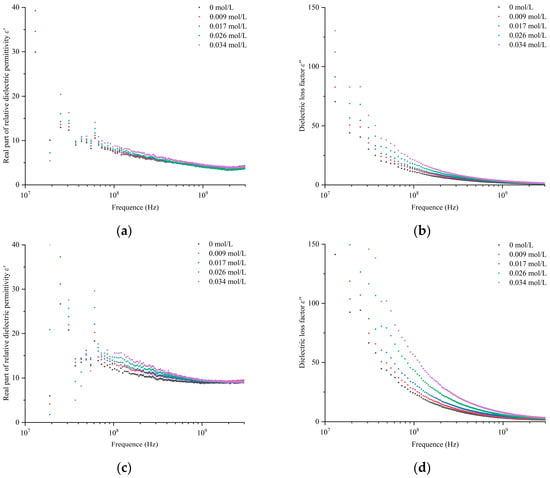
Figure 6.
Complex dielectric spectra of coconut fiber at different salinities: (a–d) the real part of the dielectric permittivity and dielectric loss factor at θV = 30% and θV = 50%, respectively.
4. Conclusions
This study provided essential data on the dielectric parameters of coconut fiber, which is commonly used in institutional agriculture. In this study, we examined the dielectric behavior of coconut fiber at various water contents, temperatures, and salinities. The findings of our study will serve as a valuable reference for the development and calibration of moisture-monitoring equipment based on dielectric properties that apply to coconut fiber in greenhouses.
The dielectric permittivity of coconut fiber increased with an increase in volumetric water content; 200 MHz–3 GHz was the optimal frequency band for measuring the water content of coconut fiber, 210 MHz was the optimal frequency point, and the dielectric measurement model of the water content of coconut fiber established at this frequency had good applicability, with an R2 of 0.9704 and RMSE of 0.0453 cm3/cm3.
The dielectric properties of the coconut fiber were found to be influenced by changes in ambient temperature, as indicated by the lower dielectric permittivity at higher temperatures. However, the general greenhouse ambient temperature (18–28 °C) had little effect on the accuracy of the dielectric measurement model for predicting the moisture content of the coconut fiber at the eigenfrequency point of 210 MHz. The influence of salinity on the dielectric properties of the coconut fiber increased with increasing water content. In addition, higher salt content led to an increase in both the real and imaginary parts of the dielectric permittivity. The salinity-induced changes in the dielectric loss factor of the coconut fiber were more discernible than those in the real part. The dielectric measurement model of the water content of coconut fiber established at 210 MHz under a low salinity level is still applicable.
Author Contributions
Research conceptualization, X.Y. and J.X.; data curation, X.Y. and J.C.; methodology, X.Y. and J.X.; writing—original draft, X.Y.; writing—review and editing, J.X., Z.Y. and Z.M. All authors have read and agreed to the published version of the manuscript.
Funding
This research was funded by the National Natural Science Foundation of China (Grant No. 52279046).
Institutional Review Board Statement
Not applicable.
Informed Consent Statement
Not applicable.
Data Availability Statement
The data that support the findings of this study are available from the corresponding author [Xu, J.] upon reasonable request.
Conflicts of Interest
The authors declare no conflict of interest.
References
- Atzori, G.; Pane, C.; Zaccardelli, M.; Cacini, S.; Massa, D. The Role of Peat-Free Organic Substrates in the Sustainable Management of Soilless Cultivations. Agronomy 2021, 11, 1236. [Google Scholar] [CrossRef]
- Hernandezapaolaza, L. Reuse of Waste Materials as Growing Media for Ornamental Plants. Bioresour. Technol. 2005, 96, 125–131. [Google Scholar] [CrossRef] [PubMed]
- Xiong, J.; Tian, Y.; Wang, J.; Liu, W.; Chen, Q. Comparison of Coconut Coir, Rockwool, and Peat Cultivations for Tomato Production: Nutrient Balance, Plant Growth and Fruit Quality. Front. Plant Sci. 2017, 8, 1327. [Google Scholar] [CrossRef] [PubMed]
- Meerow, A.W. Growth of Two Subtropical Ornamentals Using Coir (Coconut Mesocarp Pith) as a Peat Substitute. HortScience 1994, 29, 1484–1486. [Google Scholar] [CrossRef]
- Sahin, O. Combined Biofortification of Soilless Grown Lettuce with Iodine, Selenium and Zinc and Its Effect on Essential and Non-Essential Elemental Composition. J. Plant Nutr. 2021, 44, 673–678. [Google Scholar] [CrossRef]
- Aydi, S.; Sassi Aydi, S.; Rahmani, R.; Bouaziz, F.; Souchard, J.P.; Merah, O.; Abdelly, C. Date-Palm Compost as Soilless Substrate Improves Plant Growth, Photosynthesis, Yield and Phytochemical Quality of Greenhouse Melon (Cucumis melo L.). Agronomy 2023, 13, 212. [Google Scholar] [CrossRef]
- Gupta, A. Effects of Different Media on Growth and Flowering Traits of Calendula officinalis L. Bangladesh J. Bot. 2022, 51, 417–424. [Google Scholar] [CrossRef]
- Dalton, F.N.; Herkelrath, W.N.; Rawlins, D.S.; Rhoades, J.D. Time-Domain Reflectometry: Simultaneous Measurement of Soil Water Content and Electrical Conductivity with a Single Probe. Science 1984, 224, 989–990. [Google Scholar] [CrossRef]
- Cai, L.; Chen, T.-B.; Gao, D.; Liu, H.-T.; Chen, J.; Zheng, G.-D. Time Domain Reflectometry Measured Moisture Content of Sewage Sludge Compost across Temperatures. Waste Manag. 2013, 33, 12–17. [Google Scholar] [CrossRef]
- Nagare, R.M.; Schincariol, R.A.; Quinton, W.L.; Hayashi, M. Laboratory Calibration of Time Domain Reflectometry to Determine Moisture Content in Undisturbed Peat Samples. Eur. J. Soil Sci. 2011, 62, 505–515. [Google Scholar] [CrossRef]
- Noborio, K. Measurement of Soil Water Content and Electrical Conductivity by Time Domain Reflectometry: A Review. Comput. Electron. Agric. 2001, 31, 213–237. [Google Scholar] [CrossRef]
- Luciani, G.; Berardinelli, A.; Crescentini, M.; Romani, A.; Tartagni, M.; Ragni, L. Non-Invasive Soil Moisture Sensing Based on Open-Ended Waveguide and Multivariate Analysis. Sens. Actuators A Phys. 2017, 265, 236–245. [Google Scholar] [CrossRef]
- Kim, H.N.; Park, J.H. Research Trends Using Soil Sensors for Precise Nutrient and Water Management in Soil for Smart Farm. Korean J. Soil. Sci. Fert. 2021, 54, 366–382. [Google Scholar] [CrossRef]
- Hardie, M. Review of Novel and Emerging Proximal Soil Moisture Sensors for Use in Agriculture. Sensors 2020, 20, 6934. [Google Scholar] [CrossRef] [PubMed]
- Darayan, S.; Liu, C.; Shen, L.C.; Shattuck, D. Measurement of Electrical Properties of Contaminated Soil. Geophys. Prospect. 1998, 46, 477–488. [Google Scholar] [CrossRef]
- Louki, I.I.; Al-Omran, A.M.; Aly, A.A.; Al-Harbi, A.R. Sensor Effectiveness for Soil Water Content Measurements Under Normal and Extreme Conditions. Irrig. Drain. 2019, 68, 979–992. [Google Scholar] [CrossRef]
- Rosenbaum, U.; Huisman, J.A.; Vrba, J.; Vereecken, H.; Bogena, H.R. Correction of Temperature and Electrical Conductivity Effects on Dielectric Permittivity Measurements with ECH2O Sensors. Vadose Zone J. 2011, 10, 582–593. [Google Scholar] [CrossRef]
- Choi, E.-Y.; Seo, S.-K.; Choi, K.-Y.; Lee, Y.-B. Development of a Non-Drainage Hydroponic System with a Coconut Coir Substrate by a Frequency Domain Reflectometry Sensor for Tomato Cultivation. J. Plant Nutr. 2014, 37, 748–764. [Google Scholar] [CrossRef]
- Baek, J.-H.; Park, J.-S.; Lee, H.-J.; An, J.-H.; Choi, E.-Y. Quantification of Rockwool Substrate Water Content using a Capacitive Water Sensor. J. Bio-Environ. Con. 2021, 30, 27–36. [Google Scholar] [CrossRef]
- Rhie, Y.H.; Kim, J. Changes in Physical Properties of Various Coir Dust and Perlite Mixes and Their Capacitance Sensor Volumetric Water Content Calibrations. HortScience 2017, 52, 162–166. [Google Scholar] [CrossRef]
- Bañón, S.; Ochoa, J.; Bañón, D.; Ortuño, M.F.; Sánchez-Blanco, M.J. Assessment of the Combined Effect of Temperature and Salinity on the Outputs of Soil Dielectric Sensors in Coconut Fiber. Sustainability 2020, 12, 6577. [Google Scholar] [CrossRef]
- Nemati, R.; Fortin, J.P.; Arpin, J. Time Domain Reflectometry: Development of a Model to Determine Volumetric Water Content in Organic Substrates. Acta Hortic. 2008, 1, 401–406. [Google Scholar] [CrossRef]
- Nemali, K.S.; Montesano, F.; Dove, S.K.; Van Iersel, M.W. Calibration and Performance of Moisture Sensors in Soilless Substrates: ECH2O and Theta Probes. Sci. Hortic. 2007, 112, 227–234. [Google Scholar] [CrossRef]
- Incrocci, L.; Incrocci, G.; Pardossi, A.; Lock, G.; Nicholl, C.; Balendonck, J. The Calibration of Wet-Sensor for Volumetric Water Content and Pore Water Electrical Conductivity in Different Horticultural Substrates. Acta Hortic. 2009, 2, 289–294. [Google Scholar] [CrossRef]
- van Iersel, M.W.; Chappell, M.; Lea-Cox, J.D. Sensors for Improved Efficiency of Irrigation in Greenhouse and Nursery Production. HortTechnology 2013, 23, 735–746. [Google Scholar] [CrossRef]
- Fonteno, W.C.; Bilderback, T.E. Impact of Hydrogel on Physical Properties of Coarse-Structured Horticultural Substrates. J. Am. Soc. Hortic. Sci. 1993, 118, 217–222. [Google Scholar] [CrossRef]
- Byrne, P.J.; Carty, B. Developments in the Measurement of Air Filled Porosity of Peat Substrates. Acta Hortic. 1989, 1, 37–44. [Google Scholar] [CrossRef]
- Kaatze, U. Complex Permittivity of Water as a Function of Frequency and Temperature. J. Chem. Eng. Data 1989, 34, 371–374. [Google Scholar] [CrossRef]
- Cullen, A.L.; Yu, P.K. The Accurate Measurement of Permittivity by Means of an Open Resonator. Proc. R. Soc. Lond. A 1971, 325, 493–509. [Google Scholar] [CrossRef]
- Topp, G.C.; Zegelin, S.; White, I. Impacts of the Real and Imaginary Components of Relative Permittivity on Time Domain Reflectometry Measurements in Soils. Soil Sci. Soc. Am. J. 2000, 64, 1244–1252. [Google Scholar] [CrossRef]
- Santamarina, J.C.; Klein, A.; Fam, M.A. Soils and Waves: Particulate Materials Behavior, Characterization and Process Monitoring. J. Soils Sediments 2001, 1, 130. [Google Scholar] [CrossRef]
- Estevez, R.; Jones, S.B. Frequency Domain Soil Moisture Determination Using Bilinear Analysis with an Open-Ended Dielectric Probe. In Proceedings of the American Society of Agricultural and Biological Engineers Annual International Meeting 2009, Reno, NV, USA, 21–24 June 2009. [Google Scholar]
- Woszczyk, A.; Szerement, J.; Lewandowski, A.; Kafarski, M.; Szypłowska, A.; Wilczek, A.; Skierucha, W. An Open-Ended Probe with an Antenna for the Measurement of the Water Content in the Soil. Comput. Electron. Agric. 2019, 167, 105042. [Google Scholar] [CrossRef]
- González-Teruel, J.D.; Jones, S.B.; Robinson, D.A.; Giménez-Gallego, J.; Zornoza, R.; Torres-Sánchez, R. Measurement of the Broadband Complex Permittivity of Soils in the Frequency Domain with a Low-Cost Vector Network Analyzer and an Open-Ended Coaxial Probe. Comput. Electron. Agric. 2022, 195, 106847. [Google Scholar] [CrossRef]
- Saarenketo, T. Electrical Properties of Water in Clay and Silty Soils. J. Appl. Geophys. 1998, 40, 73–88. [Google Scholar] [CrossRef]
- González-Teruel, J.D.; Jones, S.B.; Soto-Valles, F.; Torres-Sánchez, R.; Lebron, I.; Friedman, S.P.; Robinson, D.A. Dielectric Spectroscopy and Application of Mixing Models Describing Dielectric Dispersion in Clay Minerals and Clayey Soils. Sensors 2020, 20, 6678. [Google Scholar] [CrossRef]
- Wu, S.Y.; Zhou, Q.Y.; Wang, G.; Yang, L.; Ling, C.P. The Relationship between Electrical Capacitance-Based Dielectric Constant and Soil Water Content. Environ. Earth Sci 2011, 62, 999–1011. [Google Scholar] [CrossRef]
- Birchak, J.R.; Gardner, C.G.; Hipp, J.E.; Victor, J.M. High Dielectric Constant Microwave Probes for Sensing Soil Moisture. Proc. IEEE 1974, 62, 93–98. [Google Scholar] [CrossRef]
- Wagner, N.; Emmerich, K.; Bonitz, F.; Kupfer, K. Experimental Investigations on the Frequency- and Temperature-Dependent Dielectric Material Properties of Soil. IEEE Trans. Geosci. Remote Sens. 2011, 49, 2518–2530. [Google Scholar] [CrossRef]
- Sugimoto, H.; Miki, T.; Kanayama, K.; Norimoto, M. Dielectric Relaxation of Water Adsorbed on Cellulose. J. Non-Cryst. Solids 2008, 354, 3220–3224. [Google Scholar] [CrossRef]
- Chen, Y.; Or, D. Geometrical Factors and Interfacial Processes Affecting Complex Dielectric Permittivity of Partially Saturated Porous Media. Water Resour. Res. 2006, 42, W06423. [Google Scholar] [CrossRef]
- Datsios, Z.G.; Mikropoulos, P.N.; Karakousis, I. Laboratory Characterization and Modeling of DC Electrical Resistivity of Sandy Soil with Variable Water Resistivity and Content. IEEE Trans. Dielect. Electr. Insul. 2017, 24, 3063–3072. [Google Scholar] [CrossRef]
- Singh Hudiara, I. Microwave Complex Permittivity of Water at High Temperatures. IETE Tech. Rev. 1998, 15, 221–223. [Google Scholar] [CrossRef]
- Liu, B.; Han, W.T.; Weckler, P.; Wang, Y.; Song, K.X. Detection Model for Effect of Soil Salinity and Temperature on FDR Moisture Content Sensors. Appl. Eng. Agric. 2014, 30, 573–582. [Google Scholar] [CrossRef]
- Xu, X.; Wang, H.; Qu, X.; Li, C.; Cai, B.; Peng, G. Study on the Dielectric Properties and Dielectric Constant Model of Laterite. Front. Earth Sci. 2022, 10, 1035692. [Google Scholar] [CrossRef]
- Samanta, A.K.; Basu, G.; Mishra, L. Role of Major Constituents of Coconut Fibres on Absorption of Ionic Dyes. Ind. Crops Prod. 2018, 117, 20–27. [Google Scholar] [CrossRef]
- Badji, A.; Benseddik, A.; Bensaha, H.; Boukhelifa, A.; Hasrane, I. Design, Technology, and Management of Greenhouse: A Review. J. Clean. Prod. 2022, 373, 133753. [Google Scholar] [CrossRef]
- Lasne, Y.; Paillou, P.; Freeman, A.; Farr, T.; McDonald, K.C.; Ruffie, G.; Malezieux, J.-M.; Chapman, B.; Demontoux, F. Effect of Salinity on the Dielectric Properties of Geological Materials: Implication for Soil Moisture Detection by Means of Radar Remote Sensing. IEEE Trans. Geosci. Remote Sens. 2008, 46, 1674–1688. [Google Scholar] [CrossRef]
- Chen, H.; Heidari, Z. Effect of Water Salinity and Water–Filled Pore Volume on High–Frequency Dielectric Measurements in Porous Media. SPE Reserv. Eval. Eng. 2018, 21, 202–214. [Google Scholar] [CrossRef]
- Zhuravlev, V.A.; Suslyaev, V.I.; Zhuravlev, A.V.; Korovin, E.Y. Analysis of Dielectric Spectra of Water with Conductive Impurities in a Wide Frequency Range. Russ. Phys. J. 2018, 60, 1893–1900. [Google Scholar] [CrossRef]
- Tzortzakis, N.; Nicola, S.; Savvas, D.; Voogt, W. Editorial: Soilless Cultivation through an Intensive Crop Production Scheme. Management Strategies, Challenges and Future Directions. Front. Plant Sci. 2020, 11, 363. [Google Scholar] [CrossRef]
Disclaimer/Publisher’s Note: The statements, opinions and data contained in all publications are solely those of the individual author(s) and contributor(s) and not of MDPI and/or the editor(s). MDPI and/or the editor(s) disclaim responsibility for any injury to people or property resulting from any ideas, methods, instructions or products referred to in the content. |
© 2023 by the authors. Licensee MDPI, Basel, Switzerland. This article is an open access article distributed under the terms and conditions of the Creative Commons Attribution (CC BY) license (https://creativecommons.org/licenses/by/4.0/).