Article

The Design and Experimental Study of a Double-Column Scrambler Wind–Sand Separator for Sustainable Soil Wind Erosion Monitoring

College of Mechanical and Electrical Engineering, Inner Mongolia Agricultural University, Hohhot 010018, China
*
Author to whom correspondence should be addressed.
These authors contributed equally to this work.
Sustainability 2023, 15(20), 15090; https://doi.org/10.3390/su152015090
Submission received: 7 August 2023 / Revised: 21 September 2023 / Accepted: 16 October 2023 / Published: 20 October 2023

Abstract

:
Sand collectors play an indispensable role in the study of land desertification, with the wind–sand separator serving as a vital core component. It plays a pivotal role in researching soil wind erosion. In response to the challenge of wind–sand separation in high-wind conditions, we introduce a novel approach. We designed, optimized, and validated a double-column scrambler wind–sand separator through computational fluid dynamics (CFD) simulations and wind tunnel experiments. Our test results showcased the impressive performance of this double-column scrambler wind–sand separator. It achieved substantial reductions in wind velocities at both the exhaust and sandfall ports, with reductions of 89.56% and 89.85%, respectively. Furthermore, the wind–sand separation efficiency consistently exceeded 98% across wind speeds ranging from 6 to 15 m/s. This study establishes a robust scientific foundation for further enhancements in the performance of the double-column scrambler wind–sand separator, holding promise for advancements in the field of desertification monitoring and control.

1. Introduction

Soil wind erosion stands as one of the primary catalysts behind land desertification [1]. Its repercussions extend beyond the realms of compromised crop production and diminished ecosystem service provision [2], permeating the sphere of global sustainable development. The Earth’s surface soils and their parent materials undergo ceaseless transformation at the hands of various natural forces, encompassing water erosion, wind denudation, gravity, and freeze–thaw processes. These persistent processes have fueled the annual proliferation of land degradation worldwide [3], posing a grave threat to ecosystem stability and the sustainable progress of human societies. Consequently, a dependable assessment of soil wind erosion and the understanding of near-surface wind–sand flow dynamics are of paramount importance. These studies provide indispensable tools and insights for formulating soil conservation strategies, thereby contributing to the realization of sustainable land utilization.
Sand collectors have evolved into essential core apparatus in the investigation of near-surface wind–sand flow dynamics. Primarily, these collectors are employed to gauge wind-borne sand particles, enabling the establishment of connections between single broadband sand transport rates, total sand transport rates, and wind speed. This serves as a pivotal means to delve into the intricacies of wind–sand interactions during wind erosion. Importantly, these studies not only offer invaluable guidance in the administration of soil wind erosion [4,5,6], but also lay a fundamental groundwork for the formulation of sustainable land management strategies. Prominent examples of sand samplers include the Mobile Wind Erosion Laboratory (MWAC) sampler developed by Wilson et al., the Big Spring Number Eight (BSNE) sampler developed by Fryrear et al., and the Wind Erosion and Traction Systems Experiment Generator (WITSEG) sampler developed by Dong et al. While these cost-effective and efficient sand samplers provide reliable data support for wind erosion studies [7,8,9,10], the structural design of their sand separation devices may sometimes lack a deep understanding of fluid dynamics and turbulence mechanisms. This deficiency can influence both the enhancement of separation efficiency and the performance of the separator under varying wind speeds. Moreover, some wind–sand environments necessitate real-time data acquisition to adapt to ever-changing conditions. Consequently, the development of fully automated, high-precision, real-time monitoring sand samplers has emerged as a prevailing trend. In recent years, researchers have made significant strides in this field. Liu Xinchun et al. [11] designed a high-precision automated sand sampler that combined dynamic sand collection with static weighing, enabling the real-time dynamic monitoring of wind erosion. Additionally, Song Tao et al. [12] devised a combined sand sampler, employing diversion and counterflow mechanisms, which not only provided real-time continuous weighing capabilities, but also facilitated wireless data transmission and automatic data acquisition. Their sand separator design, based on diversion and counterflow theories, effectively reduced the airflow velocity, resulting in efficient wind–sand separation. However, sand samplers equipped with automatic weighing functions are constrained by the relatively large size of sand separation devices. Consequently, the inlet cannot be arranged vertically on a logarithmic scale, which precludes its compatibility with ground wind speed curve analyses.
In both the realms of nature and engineering, the phenomenon of flow disruption around dual columns has captivated the attention of researchers as a quintessential example of bluff body aerodynamics. Prior investigations have underscored the substantial relevance of the flow dynamics around twin circular columns in domains such as wind engineering and fluid mechanics. Slaouti and Standsby [13] meticulously computed the flow patterns of tandem circular columns with varying spacing ratios using stochastic vortex methods. Simultaneously, Fei Baoling [14] harnessed the FLUENT 2020R2 computational fluid dynamics software to delve into the characteristics of the incompressible flow around tandem circular columns. Moreover, researchers have undertaken in-depth examinations of inclined circular column flows to elucidate the impact of the inclination angle on wake structures, cylinder force characteristics, and axial flow properties [15,16]. Through wind tunnel experiments, Shirakasi et al. [17] observed vortical motion along the axis of inclined circular column wakes, highlighting that the shedding frequency of vortices decreases with an increase in the inclination angle α , leading to a more irregular vortex street in the wake (where α represents the inclination angle of the column perpendicular to the incoming flow, set at 90°). Hogan and Hall [18] further stipulated that, with higher cylinder inclination angles, the presence of three-dimensional turbulence within the flow field becomes more prominent, ultimately culminating in a more chaotic and disorderly detachment of vortices within the primary wake region.
Against this backdrop, the wind–sand separator, as a pivotal component of sand samplers, plays a crucial role, with its deceleration performance and wind–sand separation efficiency significantly influencing the overall performance of the sand sampling. Reducing the airflow velocity in wind–sand flows has proven to be an effective method for segregating gaseous and particulate components. Despite previous research delving into the application of twin-column and inclined-column flow phenomena within the field of fluid dynamics, their integration into wind–sand separator design remains unexplored. Hence, this study, by meticulously analyzing and synthesizing research outcomes related to cylinder-induced flow disturbances, applies this knowledge to the design of wind–sand separators, aiming to realize efficient sand separation. With a profound understanding of the attributes of twin-column and inclined-column flow phenomena and by amalgamating factors such as column arrangement patterns, structural adjustments, and inclination angles, we embarked on exploring the optimal wind–sand separator structure, thereby effectively reducing the airflow velocity and achieving efficient wind–sand separation.

2. Materials and Methods

2.1. Structural Design and Speed Reduction Principle

The design of the wind–sand separator is based on the principles of diversion and cyclic frictional energy loss, with the aim of effectively achieving the separation of gas and solid particles by reducing the flow velocity of the wind–sand mixture. Through structural modifications, the flow of air within the separator is altered, leading to energy losses due to frictional resistance and localized obstruction, consequently resulting in a reduction in the flow velocity of the air.
The loss caused by frictional resistance refers to the energy loss incurred in the wind–sand separator due to both external frictional forces between the airflow and the wall surface and internal frictional forces between the airflow and the sand particles [19]. Its calculation formula is as follows:
P f = ζ ρ v 2 L 2 D
where P f represents the loss due to frictional resistance, Pa; ζ denotes the coefficient of frictional resistance; ρ signifies the density of the airflow, kg m−2; v denotes the velocity of the airflow inside the separator, m s−1; L denotes the length of the separator, m; and D denotes the equivalent diameter, m.
(1) For smooth pipes, the frictional resistance loss is related to the Reynolds number ( R e ) of the airflow. The relationship between the frictional resistance coefficient ( ζ ) and the Reynolds number ( R e ) is as follows:
When R e < 2320 , the frictional resistance coefficient ζ is calculated as follows:
ζ = 64 R e
When 4 × 10 3 < R e < 10 5 , the frictional resistance coefficient ζ is calculated as follows:
ζ = 0.3164 R e 0.25
When 10 5 < R e < 3 × 10 6 , the frictional resistance coefficient ζ is calculated as follows:
ζ = 0.0032 + 0.221 R e 0.237
(2) For rough pipes, the frictional resistance loss is related to the roughness of the wall surface. Let e be the average height of the rough particles on the wall surface. Then:
When 4000 < R e < 26.98 ( D / e ) 8 7 , the frictional resistance coefficient ζ is calculated as follows:
1 ζ = 2.0351 g ( R e ζ ) 0.91
When 26.98 ( D / e ) 8 7 < R e < 4160 ( D / 2 e ) 0.85 , the frictional resistance coefficient ζ is calculated as follows:
1 ζ = 21 g ( e 3.71 × 2 r b + 2.51 R e ζ )
where r b is the radius of the pipe.
Local resistance loss refers to the energy dissipation that occurs when the airflow passes through a conduit with local variations, such as changes in direction, expansion, contraction, or the presence of obstacles. This loss results from the impact between the airflow and the conduit within the localized area of change, or due to a collision between the air particles resulting from changes in the airflow direction and velocity [20]. The calculation formula for the local resistance loss is given by:
P L = ζ ρ v 2 T * 2 T
where P L represents the loss due to local drag, Pa; ζ denotes the coefficient of frictional drag; ρ signifies the density of the airflow, kg m−2; v denotes the velocity of the airflow at the back end of the separator, m s−1; and T * and T distributions denote the temperatures at the front and back ends of the separator, °C [21].
In typical fluid conduit systems, there are often special flow sections such as throttling valves, contraction zones, and expansion zones. These particular sections introduce significant resistance losses to the airflow. Resistance losses can be broadly categorized into the sudden expansion type, gradual expansion type, and contraction type. Considering the issue of sand particle settling within the sand separator, it is more appropriate to use a gradual expansion type conduit.
As shown in Figure 1, the upstream pipe diameter of the gradually expanding pipe is D 1 , with a velocity of v 1 , and the downstream pipe diameter is D 2 with a velocity of v 2 . Let θ be the divergence angle. The resistance coefficient for the local resistance loss is calculated as follows:
ζ = 2.6 1 D 1 D 2 2 sin θ 2 D 1 D 2 4 ( θ 45 ° ) 1 D 1 D 2 2 D 1 D 2 4 ( 45 ° < θ 180 ° )
Double-cylinder disturbance refers to the introduction of two cylindrical objects into a fluid, resulting in a disturbance or vortex effect. This disturbance can influence the flow behavior of the fluid. In a sand dust separator, double-cylinder disturbance is introduced to separate the dust particles in the air. The double-cylinder structure can alter the velocity distribution of the fluid, thereby affecting the deposition and separation behavior of the suspended particles in the fluid.
By employing the principles of inclined cylinder disturbance design, the first cylinder is modified into a truncated cone shape. This helps to decompose the incoming airflow velocity into axial and vertical components, effectively reducing the airflow’s interference with the sand collection port. The structure model of the double-cylinder disturbance and cyclical friction wind–sand separator (DCSS) is shown in Figure 2, consisting of five parts: the intake pipe, truncated cone, wind–sand separation chamber, exhaust pipe, and sand collection port.
In the wind–sand separator geometry, as depicted in Figure 3, the inlet cross-section is square with a cross-sectional area of 100 mm2. It features a certain expansion angle that facilitates outward diffusion, forming the expanded sand inlet channel. The initial values for the expansion angle (θ) and expansion section (La) are set to 13° and 60 mm, respectively. It is worth noting that considerations were made for the potential stagnation airflow within the sand collector casing, leading to an initial setting of 30 mm for the horizontal channel (Lb) of the inlet pipe.
The wind and sand separators are vertically distributed according to an exponential function. As a result, the maximum distance between two wind and sand separators near the ground is 60 mm. The optimal design height (H) for the separator is set to 26 mm, taking into account the space occupation by other structures.
The radius of the bottom surface of the intercepting cone (R) is initially set to 16 mm, and the angle of the intercepting cone (φ) is set at 20°. This configuration creates a double-column structure with the exhaust pipe, which serves to decelerate the airflow. Additionally, the beveled structure alters the flow direction of the wind and sand, further reducing the flow rate of the wind and sand.
The height of the exhaust pipe should exceed the height of the inlet pipe outlet. This design reduces the sand particle overflow from the exhaust pipe and enhances the sand particle collection efficiency. However, an excessively long exhaust pipe could hinder a smooth gas discharge, affecting the efficiency of gas–solid separation. Therefore, the height of the exhaust pipe is set at 13 mm (Ha).
The initial values for the double-column spacing (L) and exhaust pipe diameter (D) are L = 70 mm and D = 22 mm, respectively. These values are chosen to ensure a smoother gas flow within the separator and prevent the formation of Carmen vortex steps on the column surface.

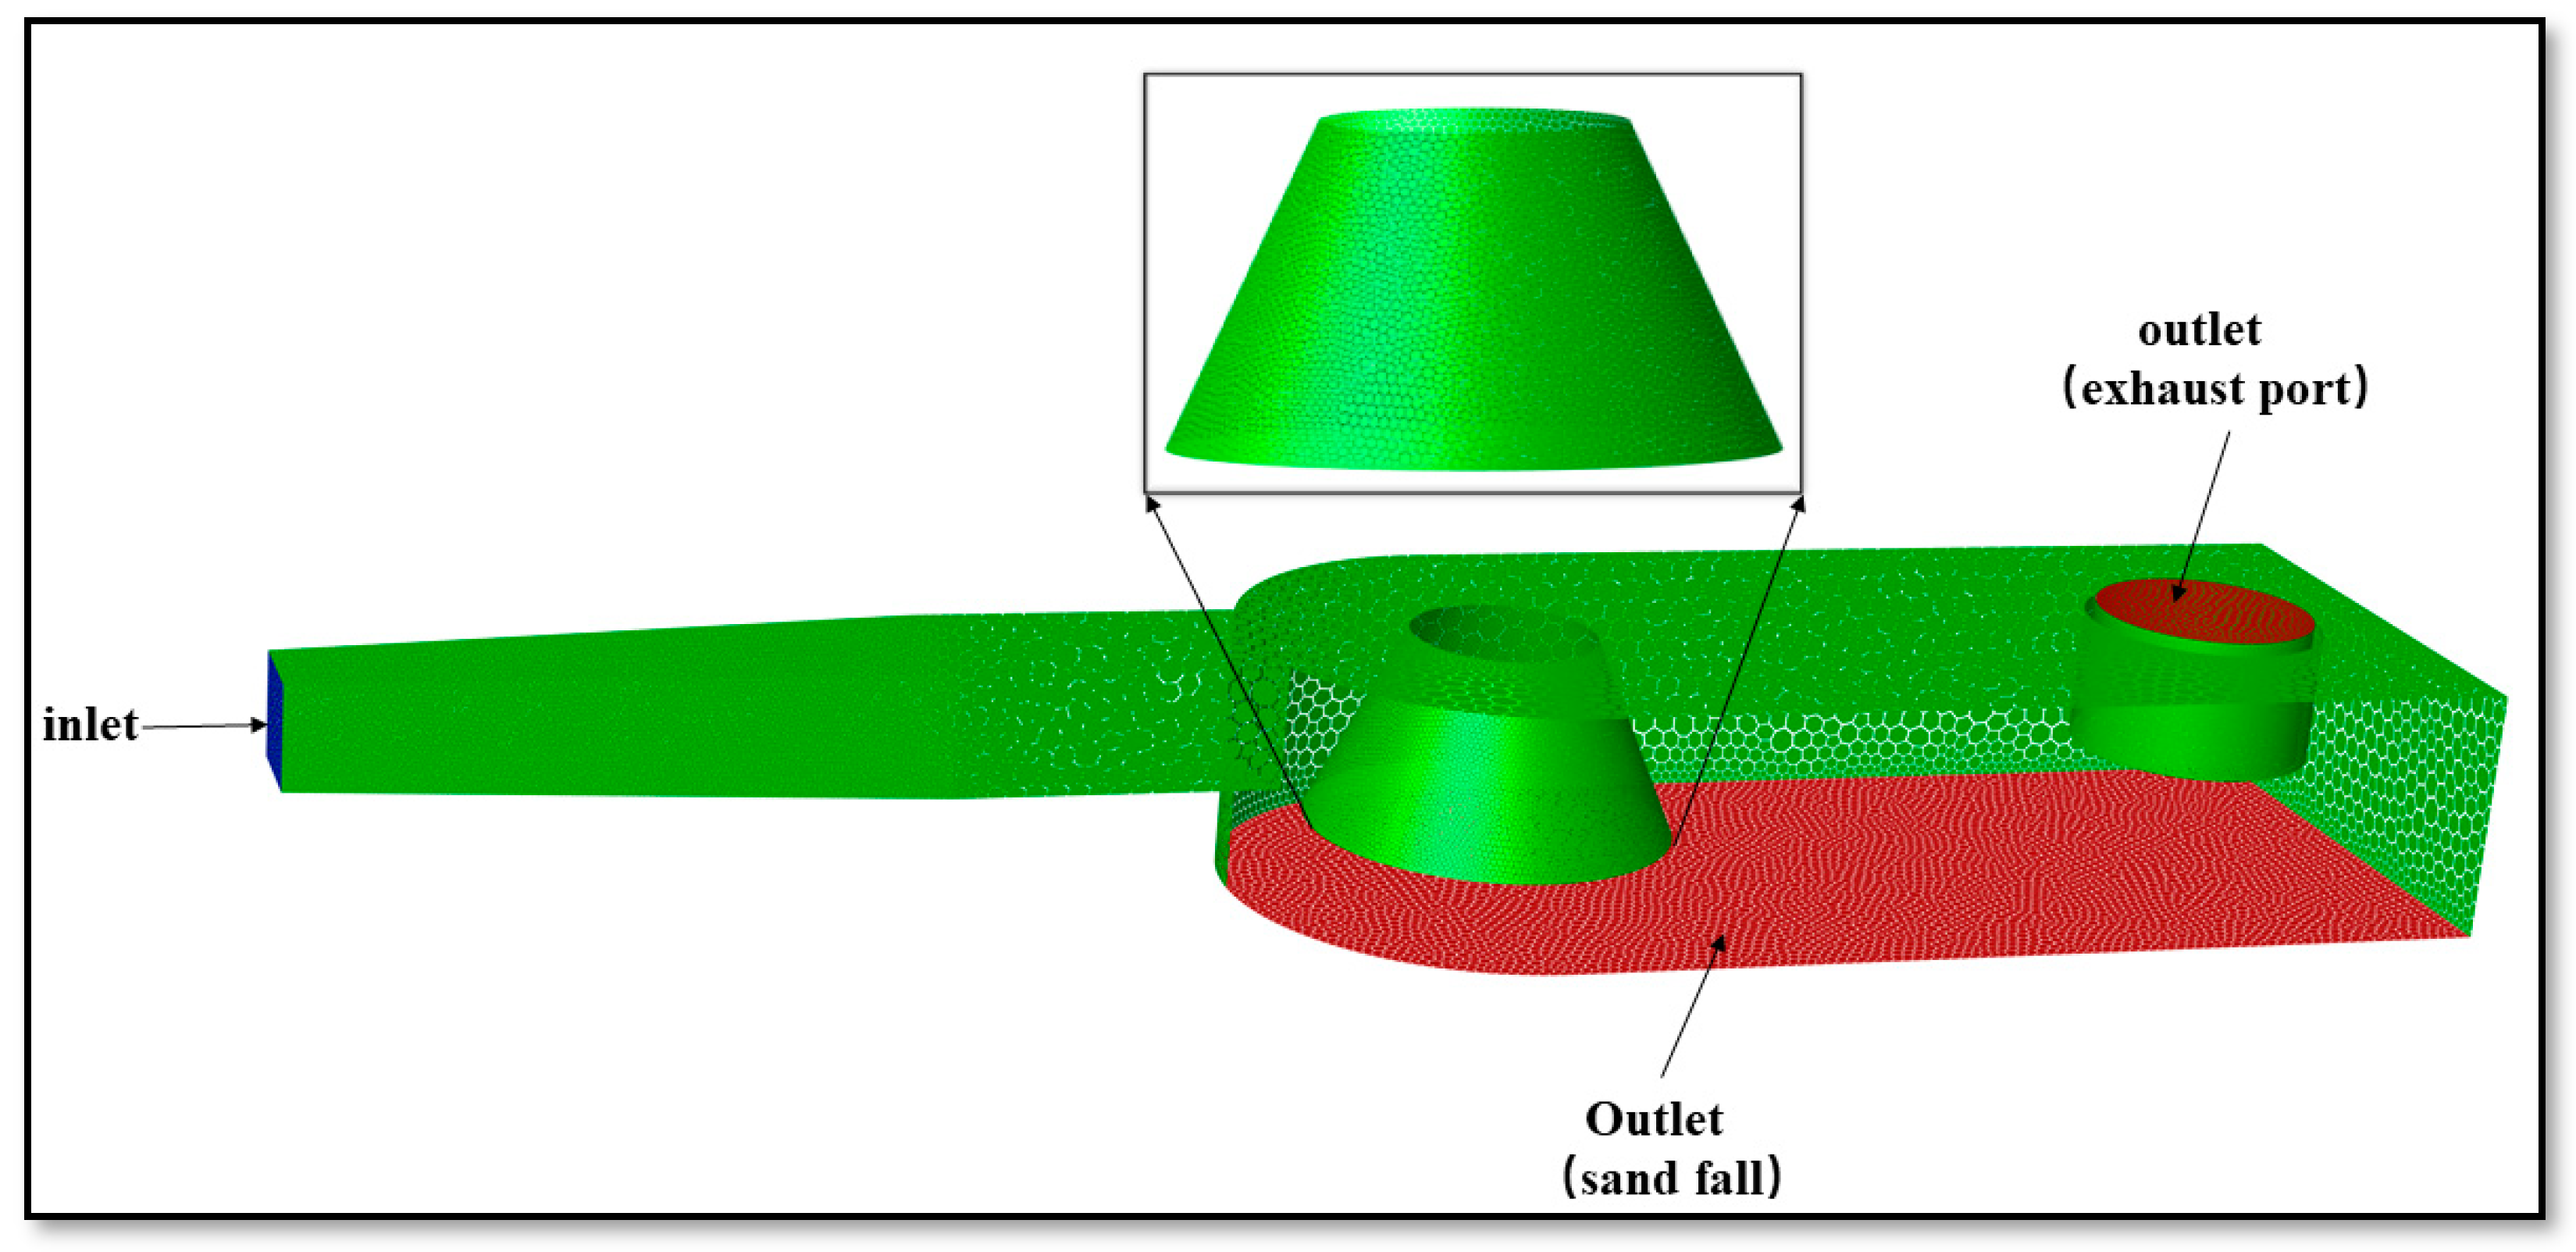
2.2. Computational Fluid Dynamics (CFD) Simulation

Inside the wind–sand separator, a two-phase flow occurs, consisting of air and soil particles. Its primary function is to separate soil particles from the air. Since the concentration of soil particles is not excessively high, the movement of these particles within the wind–sand separator is predominantly influenced by the gas phase, which is the air. The vast majority of the soil particles travel along with the airflow.
Within the wind–sand separator, a substantial number of vortices manifest within the separation chamber. These vortices are a result of the airflow bypassing and recirculation along the conical wall, occupying a significant portion of the entire flow field. Therefore, we opted for the RNG k − ε model, which was enhanced by Yokhot and Orszag. The respective equations for k and ε are as follows [22]:
( ρ k ) t + ( ρ k u i ) x i = x j α k μ e f f k x j + G k + ρ ε
( ρ ε ) t + ( ρ ε u i ) x i = x j α ε μ e f f ε x j + C 1 ε * ε k G k C 2 ε ρ ε 2 k
No-slip boundary conditions (turbulent kinetic energy k = 0 and dissipation rate ε = 0) are applied to the solid wall within the computational domain. Standard wall function conditions, which adhere to the logarithmic distribution, are employed for modeling the flow in the near-wall region. Detailed numerical computational settings can be found in Table 1, while all other parameters are maintained at their default values.
The computational domain consists of the interior of the wind–sand separator, and a Fluent-meshing module is employed for meshing the computational domain. Mesh independence is verified to assess the sensitivity of the computational results to changes in the mesh density. Under a central wind speed of 12 m s−1, depicted in Figure 4 is the wind speed at a height (Z) of 18 mm. It can be observed that, with an increase in the grid density, the variation in the wind speed remains below 5%. This confirms that the meshing scheme satisfies the grid independence criterion [23]. The grid cell dimensions for three groups are detailed in Table 2. The computational outcomes for the Group 1 and Group 2 grid sizes are in substantial agreement, while the results for the Group 3 grid size surpass the upper error limit of 5% within the range X ∈ (150, 210). Consequently, the grid configuration from Group 2 is selected to ensure accuracy. In this configuration, the total cell counts for the wind–sand separator’s computational domain amounts to 755,000 cells, with an average grid mass exceeding 0.87, as illustrated in Figure 5.
The choice of boundary conditions plays a pivotal role in elucidating the physical and operational characteristics of the topological structural entities representing the model’s boundaries in the geometric model. In consideration of the sand separator’s operational context within a free-flow wind field, the following boundary conditions are adopted: the air inlet employs a free-flow velocity inlet (VELOCITY_INLET); there exists a distinct gap between the sand drop port and the sand collection box of the sand separator, leading to the utilization of two free-flow outlets (sand drop port and exhaust port), designated as free-flow outlet boundary types (OUTFLOW); and to ensure internal flow state consistency within the separator, symmetry surfaces (SYMMETRY) are assigned to the top and side boundaries of the separator.
The Reynolds number is a dimensionless number employed to characterize the state of fluid flow. It serves as a discriminating factor between laminar and turbulent fluid flows and aids in determining the resistance an object experiences within the flow. The formula for calculating the Reynolds number is as follows:
R e = ρ v d μ
In this equation, ρ represents the air density, kg m−3; v represents the airflow velocity, m s−1; D H D represents the hydrodynamic diameter, m; and μ represents the air viscosity, Pa·s.
As the inlet pipe has a square cross-section, the hydraulic diameter is calculated as follows:
d = 4 S / L
The intensity of the turbulence is typically quantified through turbulence intensity, computed as:
I = 0.16 R e 1 8
According to wind speed and wind-rating standards, wind speeds ranging from 10.8 to 13.8 m s−1 are classified as strong winds. Strong winds possess a sufficient force to induce severe wind erosion and exert a considerable influence on land surface. Considering that this level of wind may lead to soil erosion and the suspension of particles, the inlet air velocity is set at 13.8 m s−1 to ensure the wind–sand separator’s effective operation in strong wind conditions and to achieve efficient sand separation. Subsequently, the boundary conditions for the inlet airflow are detailed in Table 3.
To better analyze the discrepancy between the simulation results and wind tunnel test results, the relative standard deviation (RSD) is employed as an evaluation index to assess the degree of dispersion of the wind speed data obtained from the numerical simulation and the wind tunnel test. The relative standard deviation is calculated as the ratio of the standard deviation of the data set to its arithmetic mean, serving as a measure of the accuracy of the test results. It is considered that the data fit well when the value of the relative standard deviation of the wind speed was in the range of 0–5% [24]. The calculation formula for the relative standard deviation is as follows:
R S D = ( v 1 v ¯ ) 2 + ( v 2 v ¯ ) 2 v ¯ × 100 %
where v 1 denotes the test wind speed, m s−1; v 2 denotes the numerically simulated wind speed, m s−1; and v ¯ denotes the arithmetic mean, m s−1.

2.3. TCSS Separator Testing

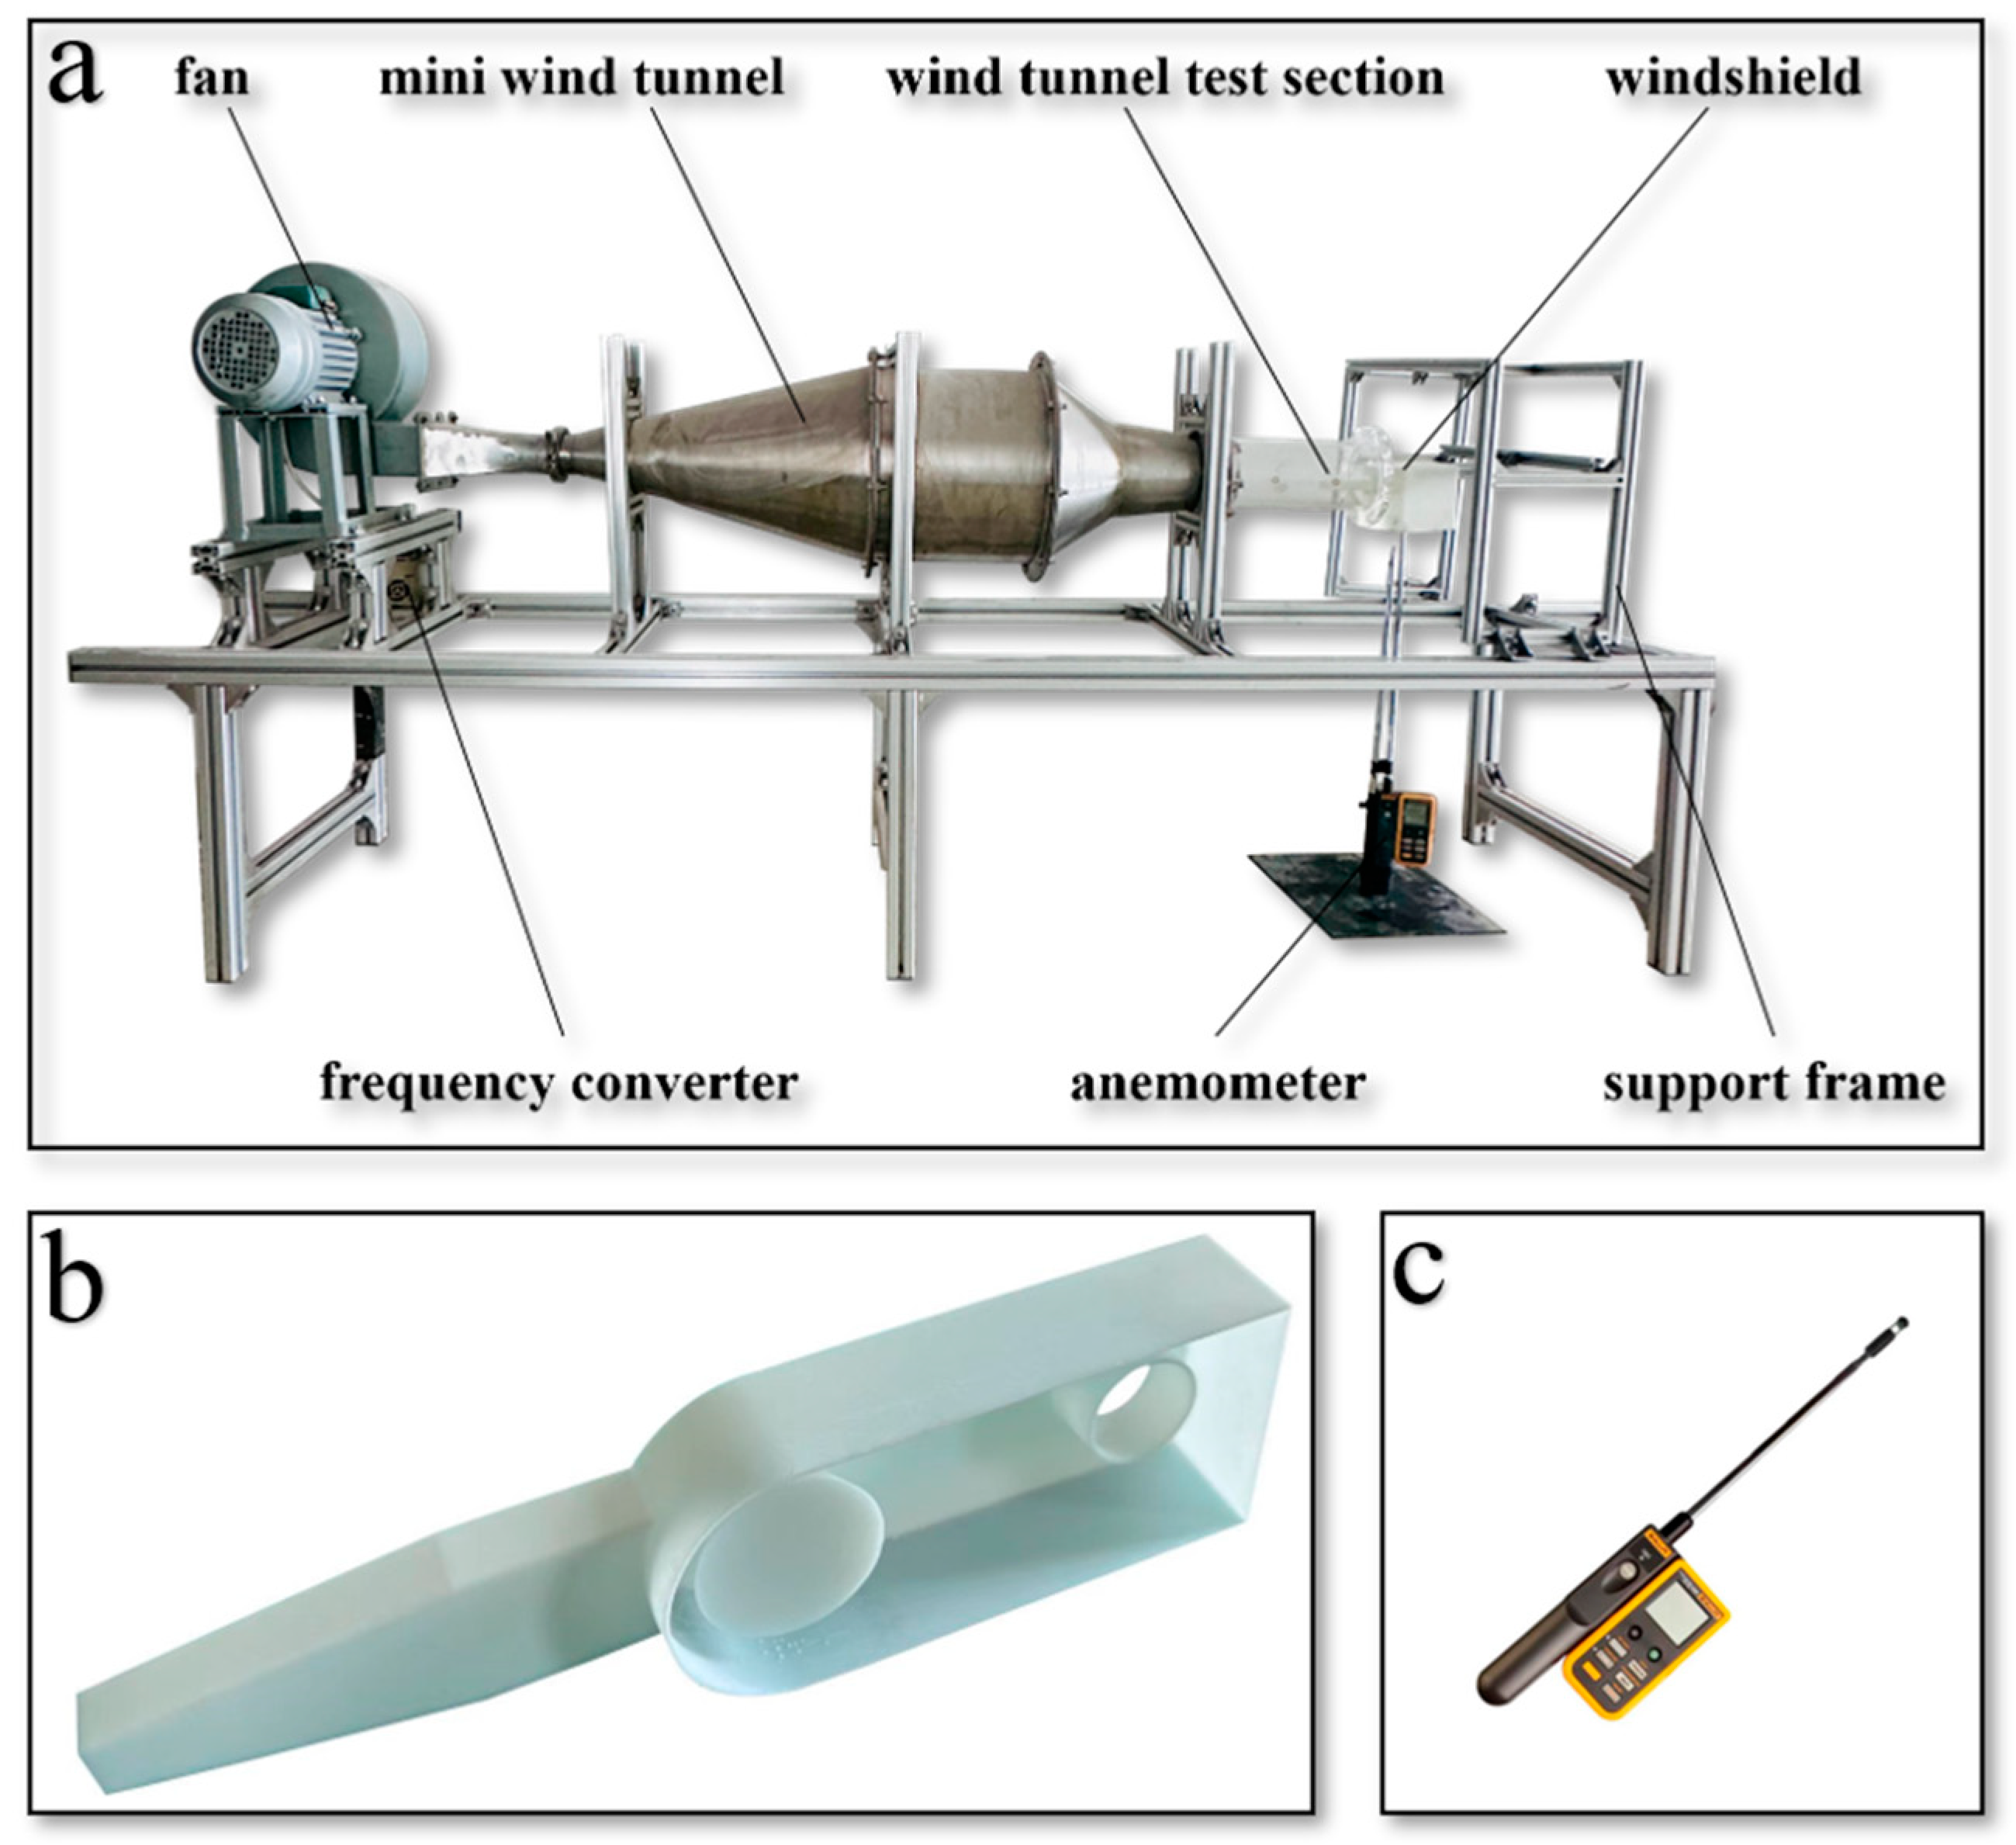
2.3.1. Experimental Test Equipment

The performance test of the wind–sand separator was conducted at the Laboratory of Environment and Energy Engineering Discipline, Inner Mongolia Agricultural University, under controlled conditions of a 20 °C temperature, no wind influence, and a stable atmospheric pressure. The laboratory is equipped with the miniature test wind tunnel shown in Figure 6a, comprising a diffusion section, rectification section, contraction section, and test section. The internal honeycomb features a hexagonal grid design, which minimizes the airflow pressure loss and turbulence degree [25]. A damping net is positioned between the honeycomb apparatus and the contraction section to reduce the airflow vortex at the rear end of the honeycomb apparatus. This reduction in vortex helps to decrease the turbulence intensity of the airflow at the stabilization end, ensuring a more homogeneous radial flow field. The wind tunnel maintains a 1 cm thickness for the boundary layer, and the wind speed is adjustable within the range from 1 to 18 m s−1 [26]. To conduct experiments with the wind–sand separator (Figure 6b), it was placed within a windshield to eliminate external airflow interference within the measurement area. A support frame was employed to secure it in place. Wind speed measurements were carried out using a Fluke 923 hot-wire anemometer (Figure 6c). Figure 7 illustrates the wind-speed-testing system employed during the wind tunnel experiment.

2.3.2. Speed Reduction Performance Test

Before conducting the test, the air inlet of the wind–sand separator was adjusted to face the center axis of the test section in the mini wind tunnel. During the test, the anemometer probe was carefully inserted into the center axis of the test section through the speed-measuring hole, ensuring alignment with the incoming flow direction. The fan was then activated, and the wind speed was stabilized at 6, 9, 12, 13.8, and 15 m s−1, respectively. Subsequently, an anemometer was used to test the wind velocity of bottom and back of the flow diverter slanting column and the center of the separator exhaust port, respectively. The probe was moved slowly in the horizontal plane, and 30 wind speed readings were randomly taken at each position and then averaged to obtain the actual wind speed at that specific location.
Velocity reduction efficiency ( η ) is defined as the ratio of the wind speed at the outlet ( v 1 ) to the wind speed at the inlet ( v ), as measured during testing. The formula is as follows:
η = ( 1 v 1 v ) × 100 %

2.3.3. Wind–Sand Separation Efficiency Test

Experimental soil samples were collected from Siziwang Banner, Ulanchab City, located in the central Inner Mongolia Autonomous Region, China. The soil was sieved and its particle size distribution was determined according to the soil classification criteria [27,28], as presented in Table 4. The test soil samples were classified as fine sand, with particles larger than 0.075 mm accounting for 86% of the total mass. The moisture content was determined using the gravimetric method. The soil samples (50 g) were collected from a depth of 0–5 cm and placed in an oven at 105–110 °C for approximately 8.0 h until their weight was stabilized. The moisture content of the naturally dried soil samples was measured to be 1.65%. The soil samples with particle sizes less than 0.5 mm were sieved and 25 portions of 20 g each were taken. For the diverter hedge-type and recirculating friction-type wind–sand separators, a sand inlet was designed at the upper side of the front end of the inlet pipe, and a sand funnel was fixed in the sand inlet. During the tests, the wind speed was stabilized at 6, 9, 12, 13.8, and 15 m s1, respectively, and the soil samples were slowly and uniformly added to the sand funnel. The process was repeated five times for each wind speed condition. The soil samples collected from the sand collection box after each test were weighed, and the average weight was determined at the same wind speed to analyze the separation efficiency.
The gas–solid separation efficiency ( γ ) is defined as the ratio of the mass of sand particles collected in the sand collection box after the test ( m ) to the mass of sand particles poured into the sand funnel before the test ( M ). Its calculation formula is as follows:
γ = m M × 100 %

3. Results

3.1. Determination of Key Parameters for Wind–Sand Separators

In order to determine the wind–sand separator’s structure, key parameters of each component were analyzed using CFD numerical simulations. The simulation results revealed the following:
(1)
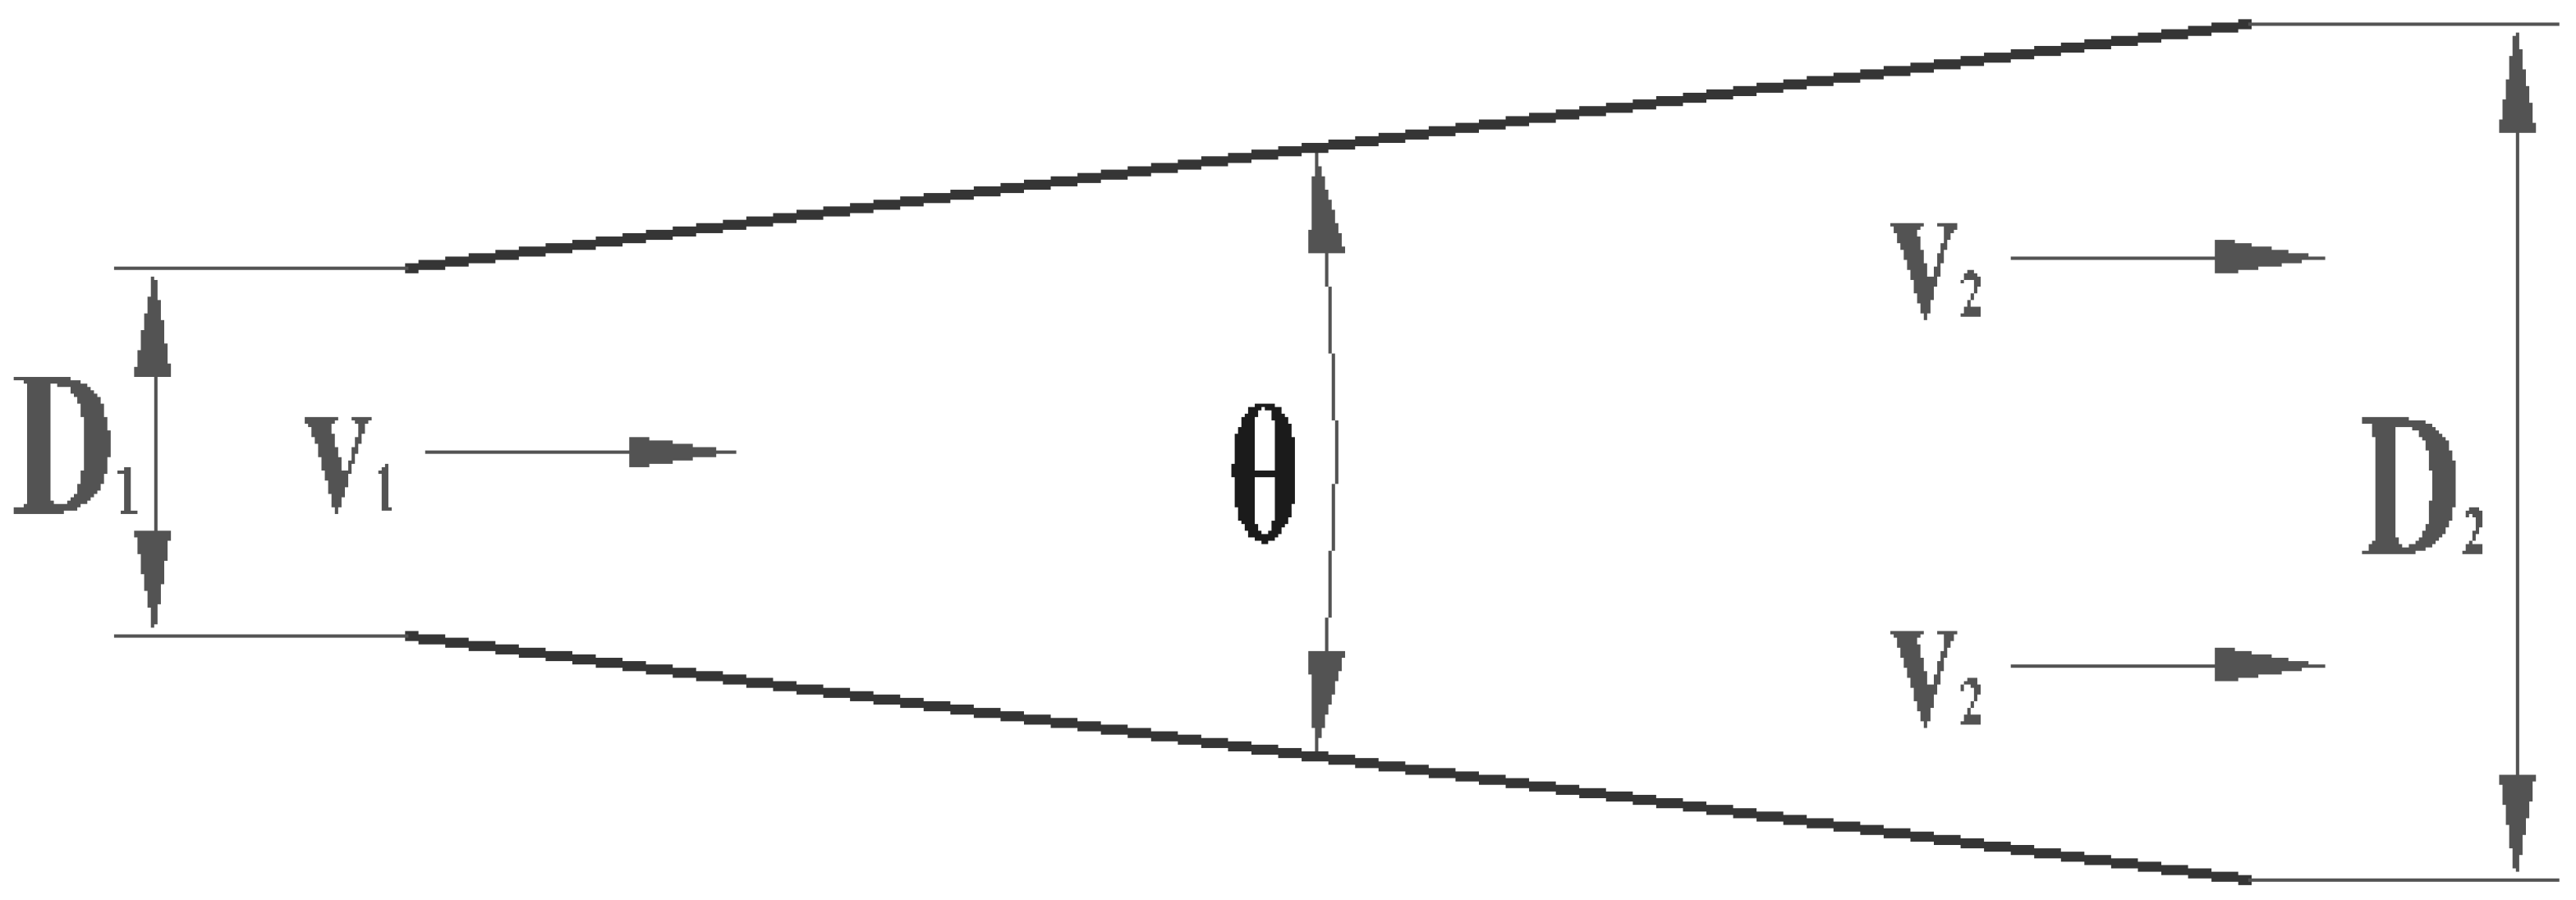
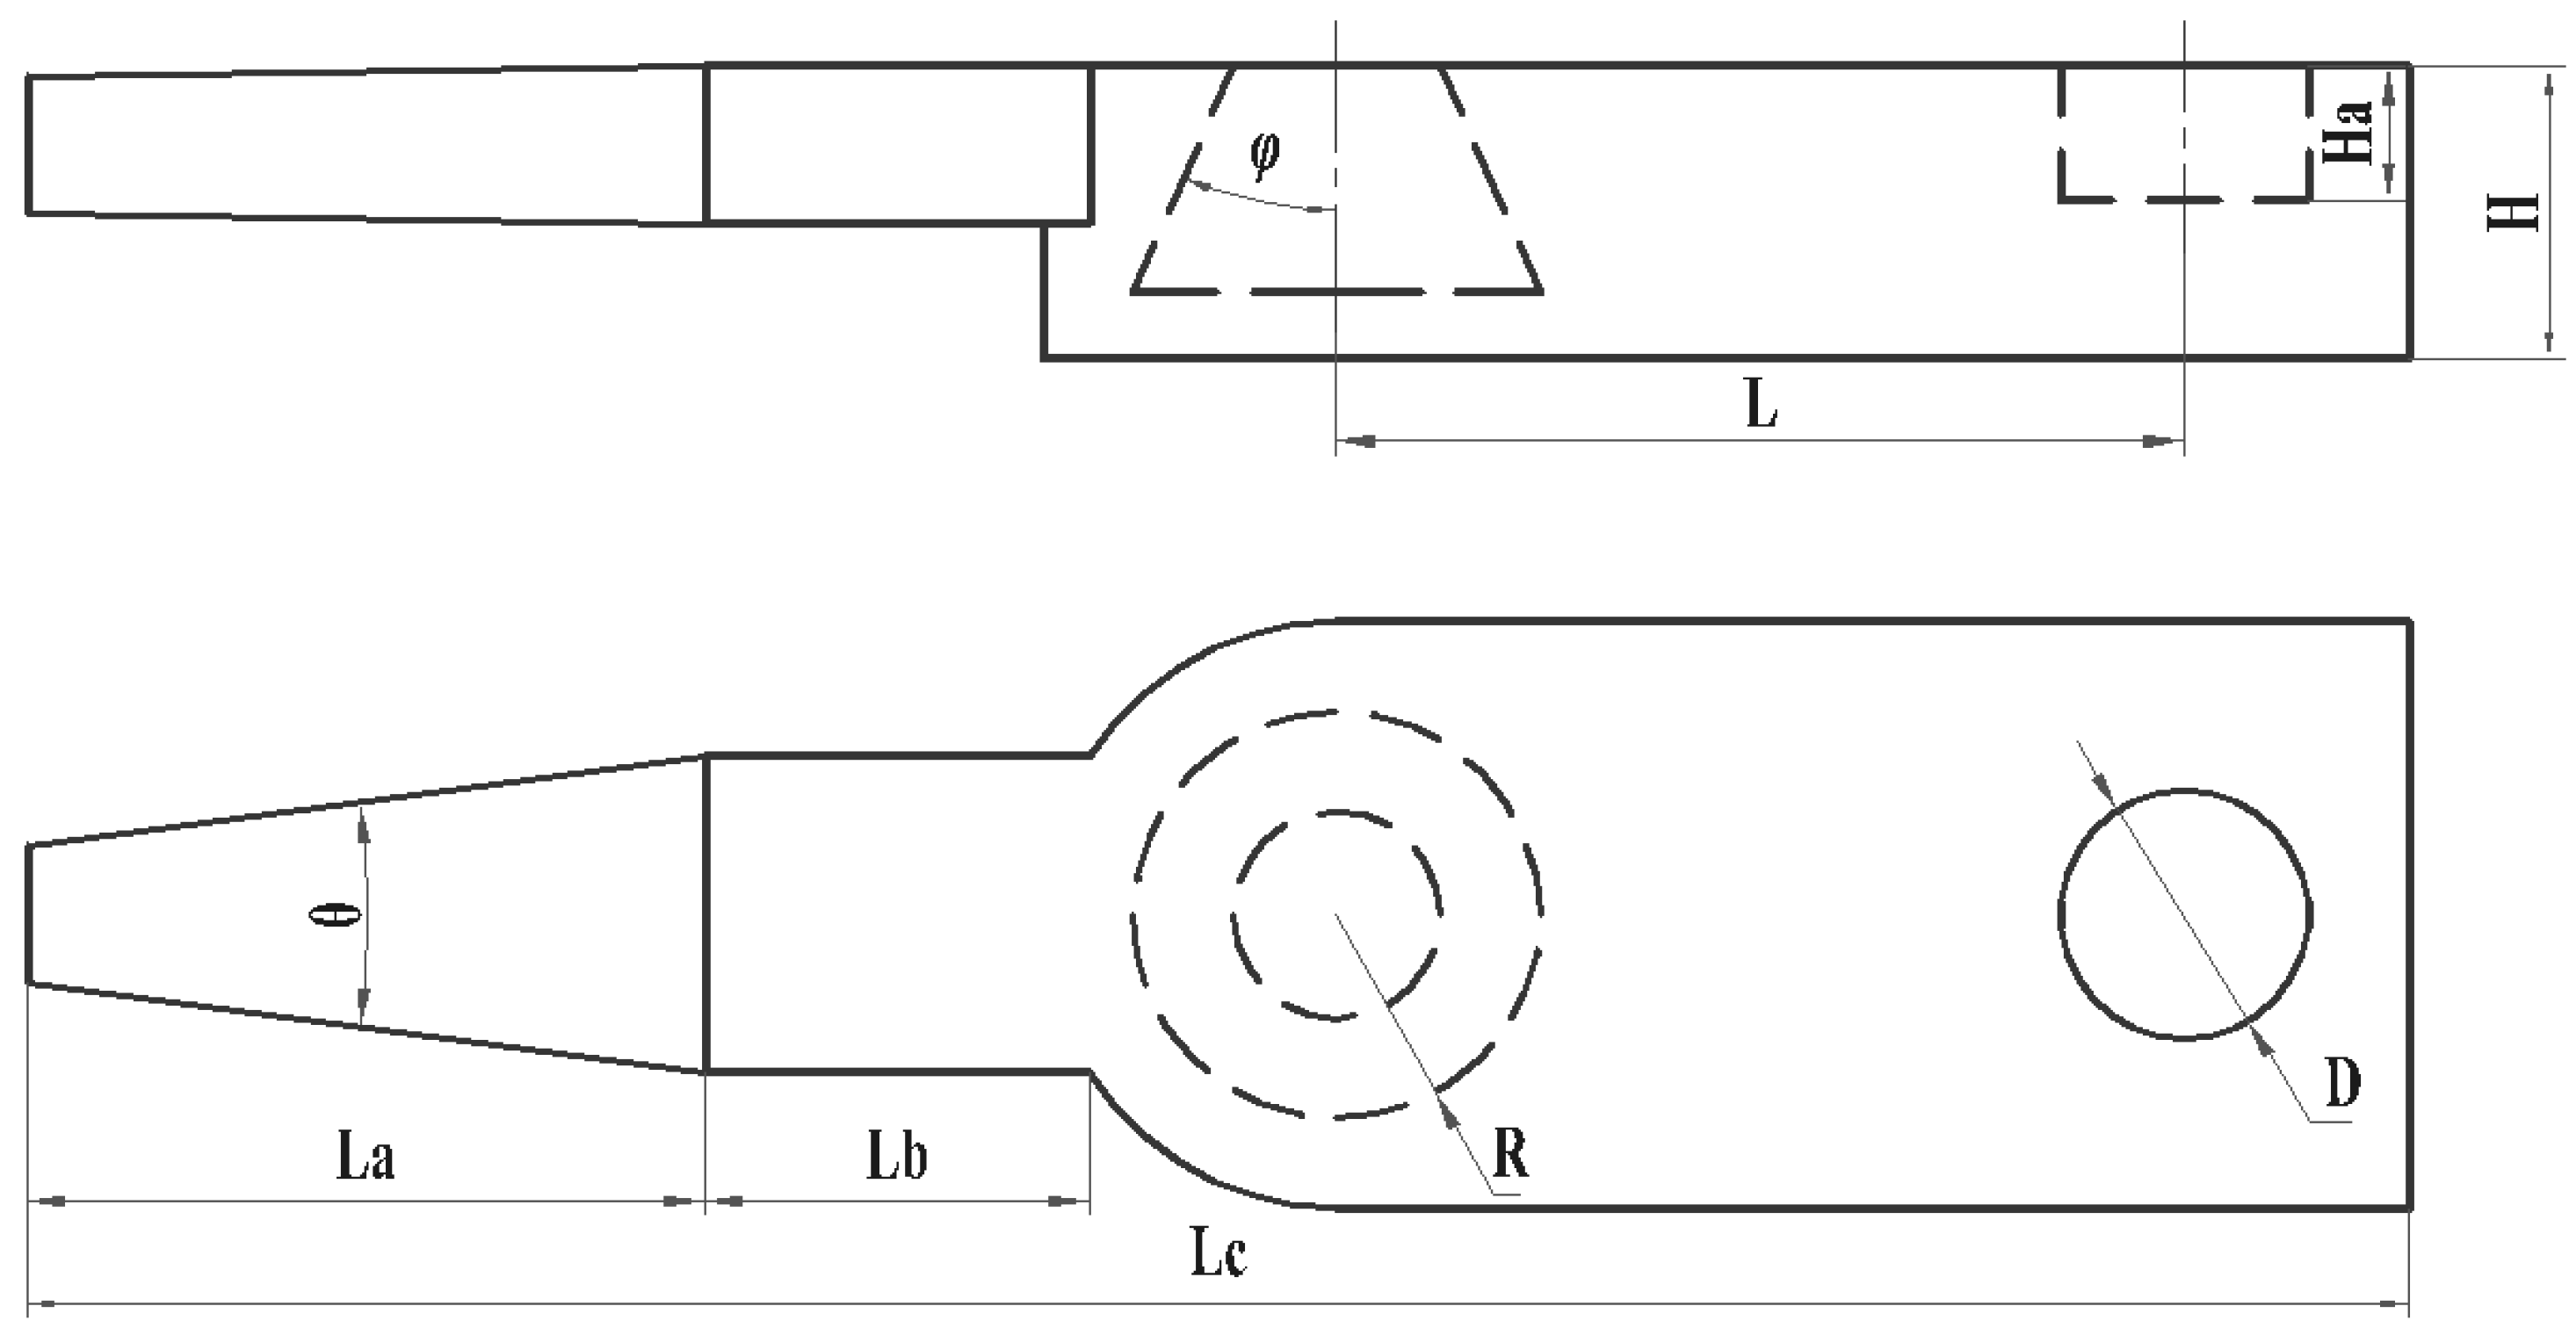
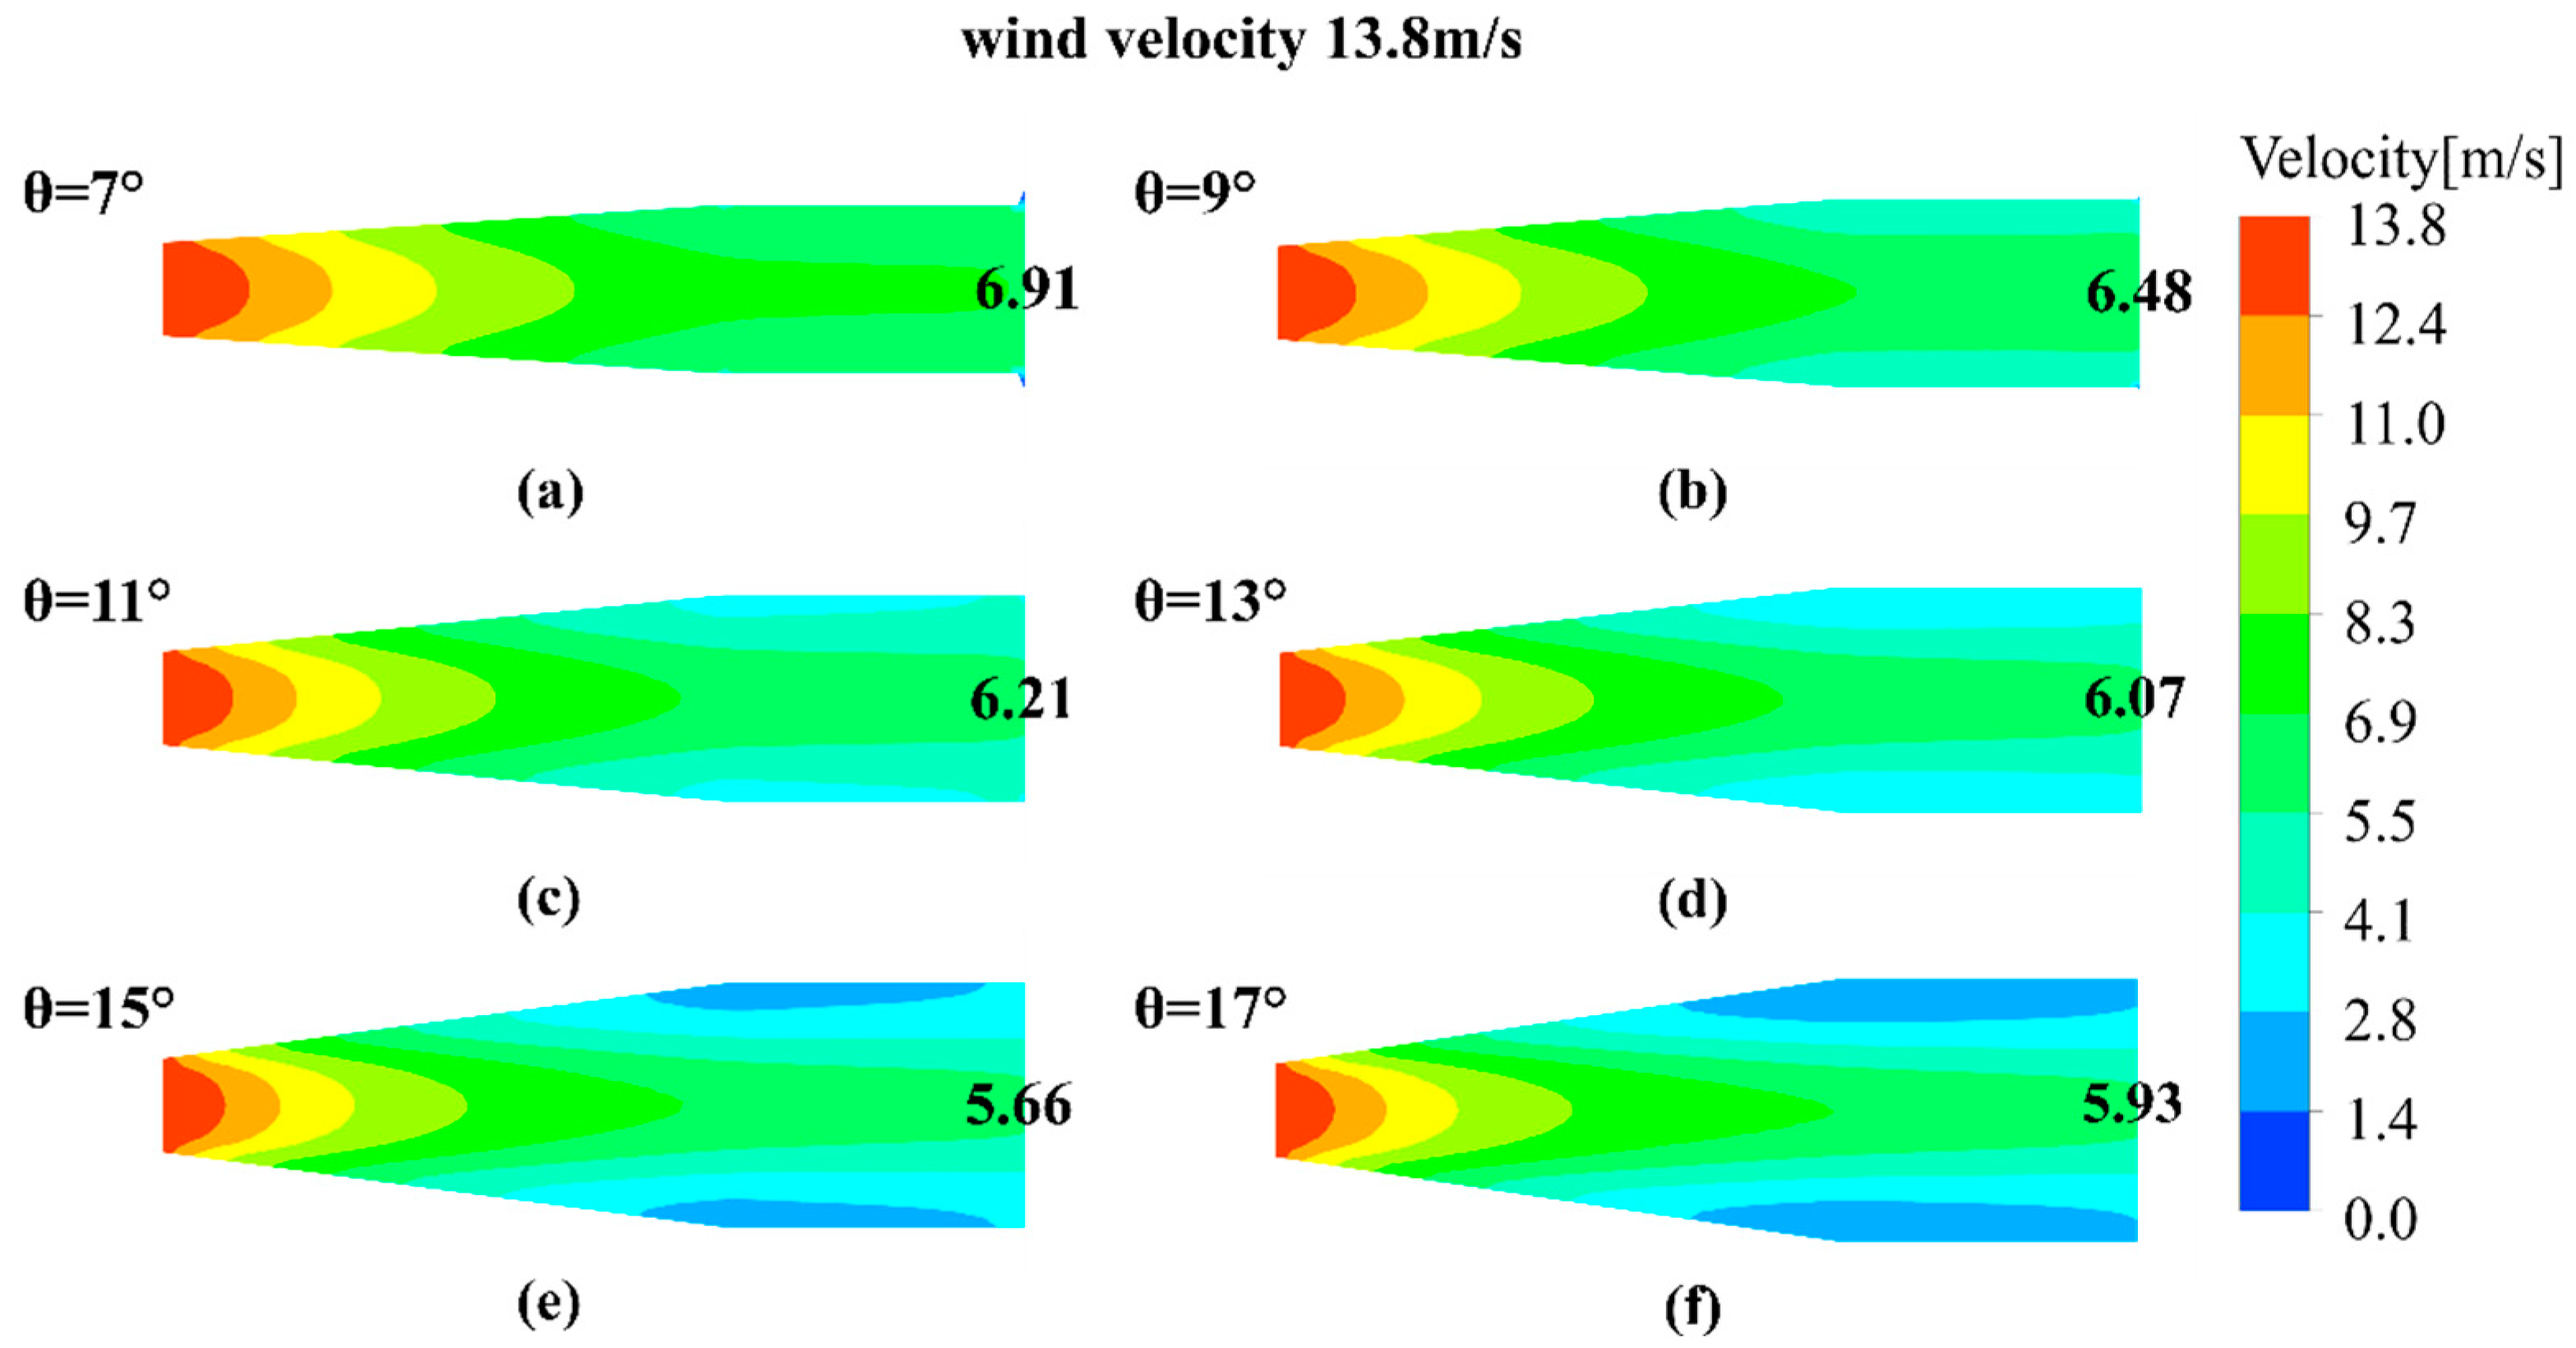
Setting the inlet pipe’s expansion angle (θ) at 15° (Figure 8) increased the boundary layer thickness, significantly reducing the mainstream airflow velocity (from 13.8 m s−1 to 5.66 m s−1). The expansion section’s length (La) was established at 60 mm, and the horizontal channel’s length (Lb) was fixed at 35 mm (Figure 9). These measures were taken to prevent the blockage of the inlet airflow by the sand collector’s shell and to ensure isodynamic requirements.
(2)
Setting the cone angle (φ) and its bottom radius (R) at φ = 25° and R = 18 mm (Figure 10) effectively slowed down the airflow’s speed and reduced the impact on the bottom caused by the slanting column’s end.
(3)
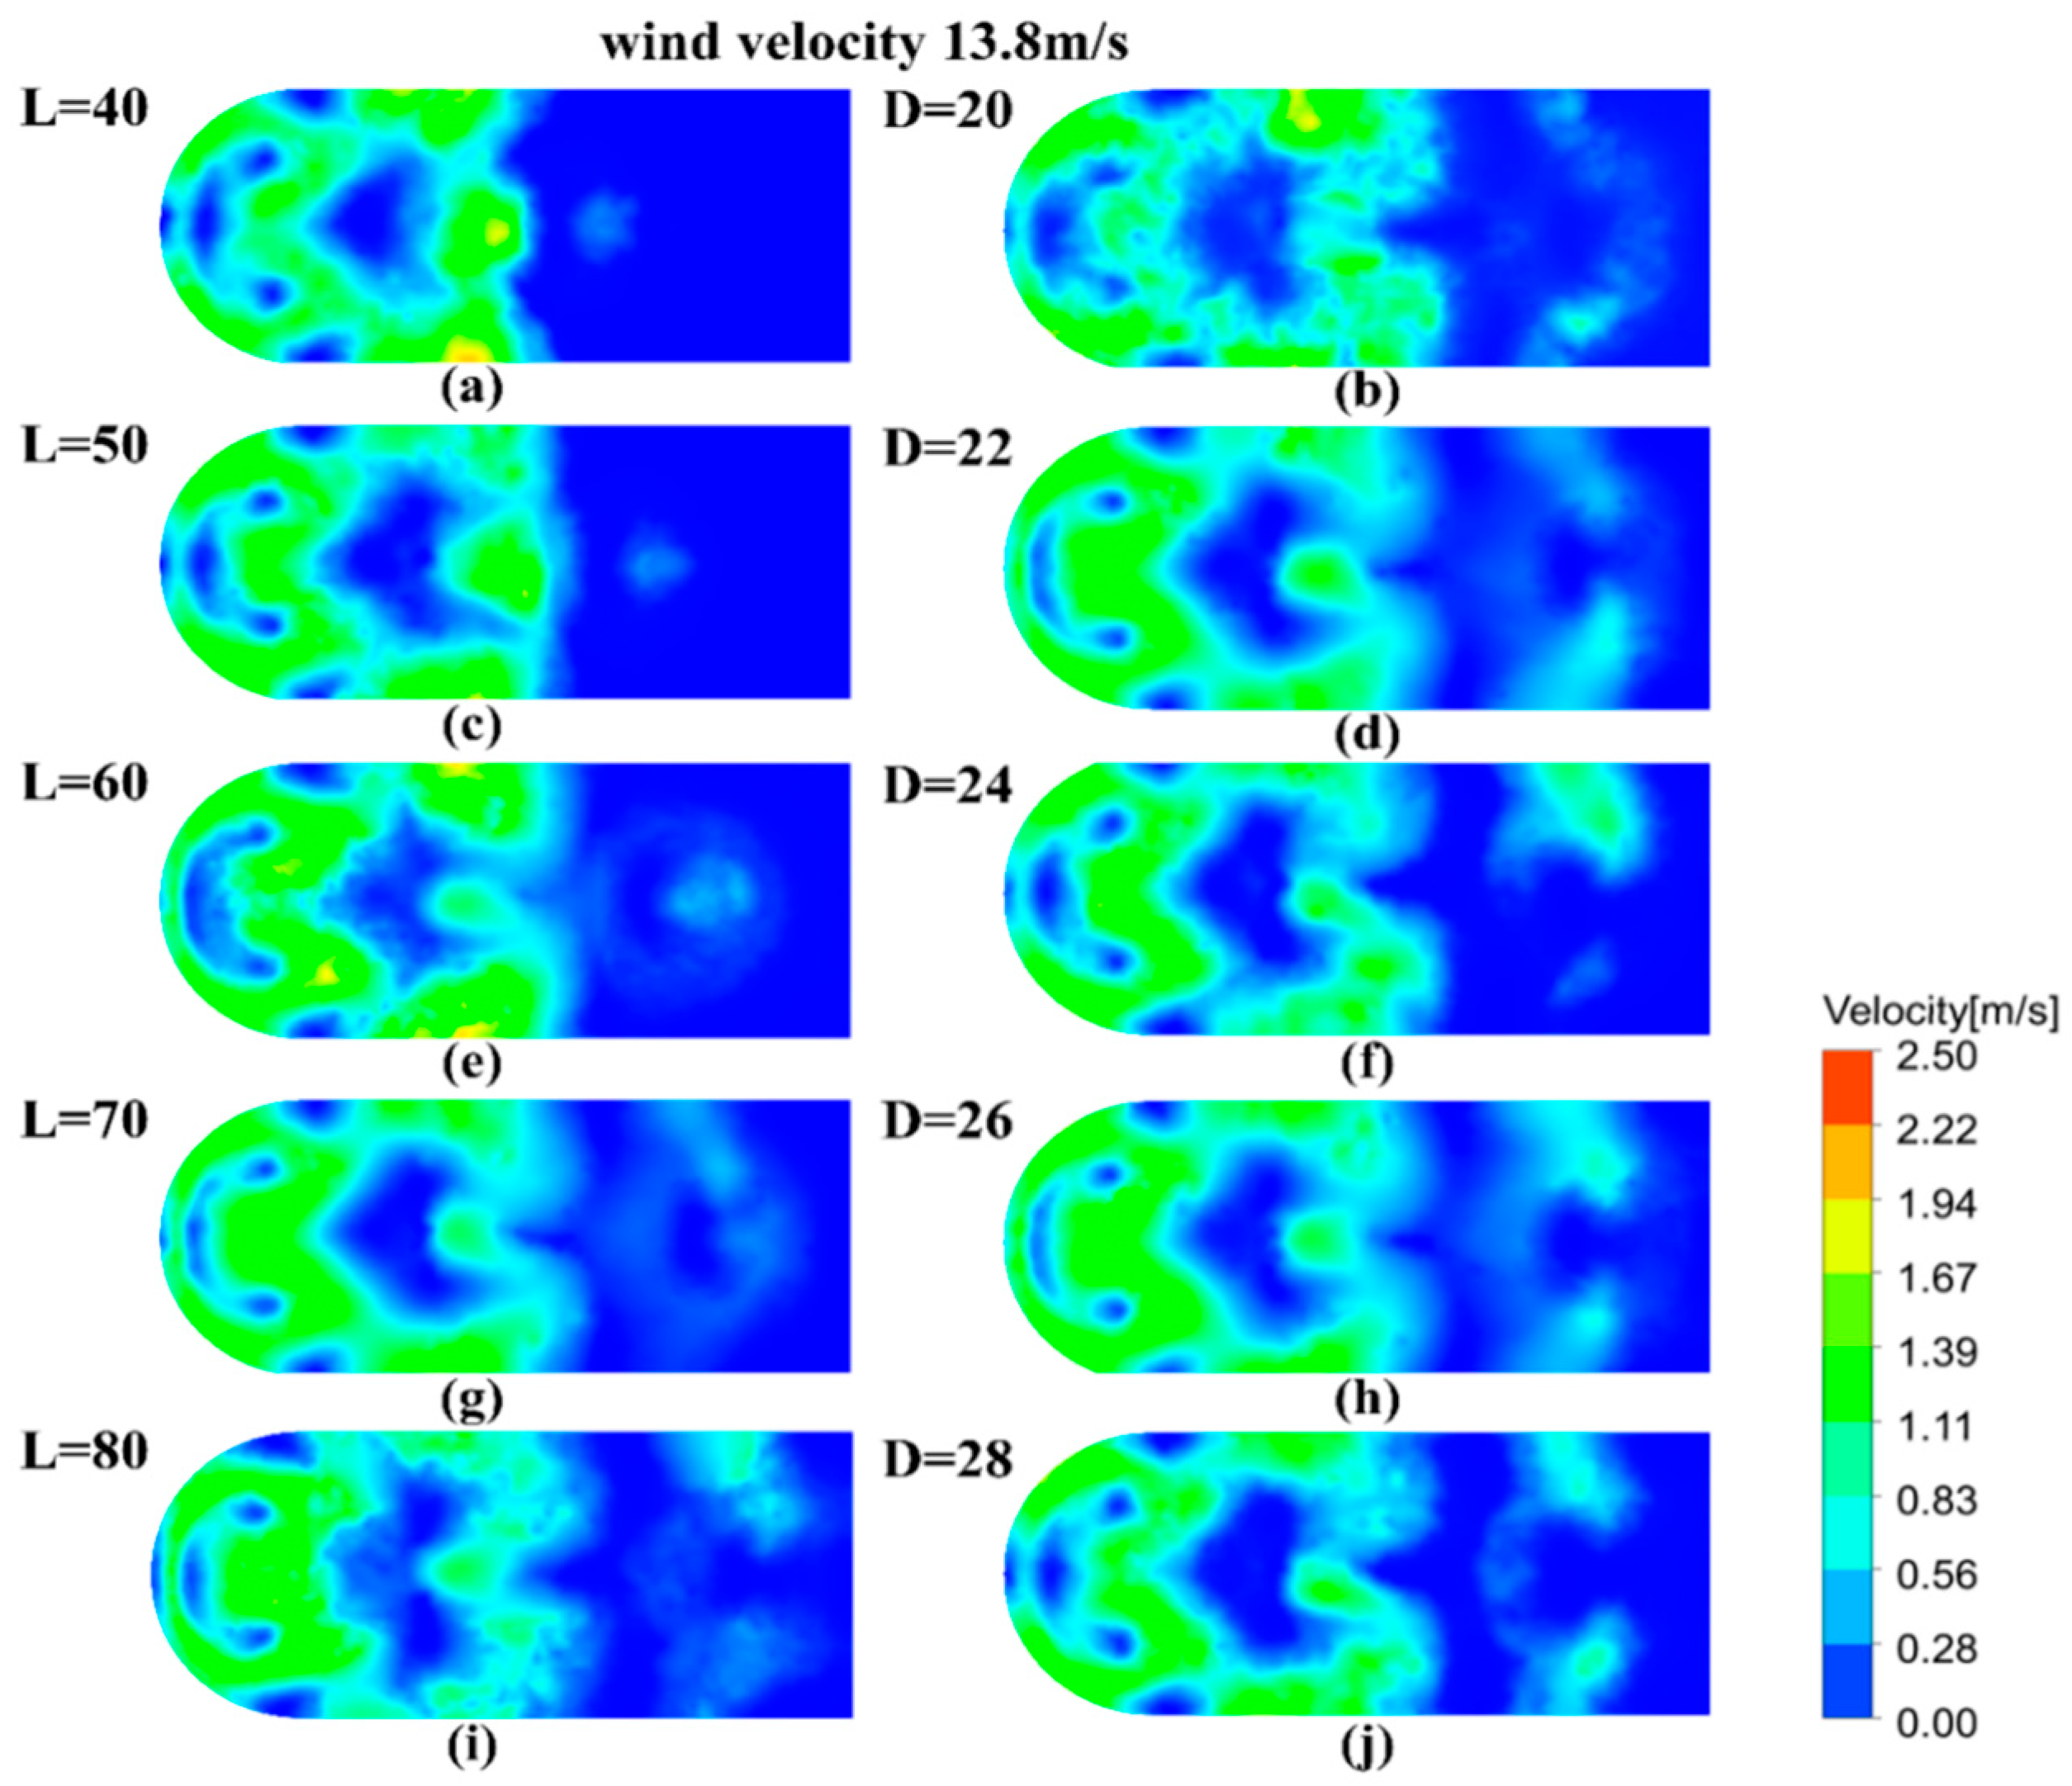
Finalizing the values of double-column spacing (L) and exhaust pipe diameter (D) at L = 75 mm and D = 22 mm (Figure 11) ensured a smoother airflow inside the separator and prevented the formation of Carmen vortex steps on the column’s surface.

3.2. CFD Simulation Analysis of Wind–Sand Separator

After the sand flow entered the air inlet, the first reduction in speed was achieved through the local expansion of the air inlet (Figure 12). Subsequently, the airflow impacted the diverter slanting column through the gas–solid separation cavity, causing a change in flow direction and resulting in the second speed reduction through the energy consumption induced by the local resistance. The airflow then bifurcated along the wall, bypassing the flow, and underwent collision at the end before merging into the main stream, leading to the third speed reduction through collision with the exhaust pipe wall. Additionally, a portion of the airflow formed a vortex flow, moving along the wall and colliding with it, thereby achieving the fourth speed reduction through the loss caused by the frictional resistance. Moreover, the space between the manifold column and exhaust pipe generated multiple cycles of impact and friction, resulting in a loss of airflow energy and achieving a further speed reduction.
Referring to Figure 13, the velocity cloud at the sandfall outlet (Figure 13a) clearly demonstrated significant variations in the airflow velocity across different locations within the sandfall outlet region following the velocity reduction by the wind–sand separator. In areas 1, 2, 3, and 4 of the sand outlet, the wind velocities ranged between 0.69 to 1.48 m s−1. Meanwhile, in the remaining sections of this region and in area 5, the wind speeds ranged from 0 to 0.69 m s−1.
Similarly, by examining the velocity cloud at the exhaust outlet (Figure 13b) in Figure 9, it becomes evident that the wind speeds in certain sections of the exhaust port varied between 0.45 and 1.38 m s−1. In contrast, the remaining areas exhibited wind speeds ranging from 0 to 0.45 m s−1.

3.3. TCSS Separator Test

3.3.1. Separator Exhaust and Sandfall Wind Velocity

Table 5 presents the average wind speeds recorded under the 13.8 m s−1 wind speed condition for the five designated test regions within the sandfall area, as depicted in Figure 13a. The measured wind speeds during the tests consistently fell within the range from 0.4 to 1.40 m s−1. It is worth noting that the test data slightly outperformed the simulated data, likely due to the idealized boundary conditions applied to the separators in the simulation.
Table 6 presents the wind speed data for both the exhaust port and the sandfall area at five different wind speeds, with the highest recorded wind speed being 1.44 m s−1 at the exhaust port and 1.40 m s−1 at the sandfall area under strong wind conditions (13.8 m s−1). When these data are applied to Equation (15), it is observed that the wind speeds at the exhaust port decreased by as much as 89.56%, while at the sandfall area, they decreased by up to 89.85%. The recorded wind speeds at the sandfall area ranged from 0 to 1.48 m s−1, which aligns with the results obtained through the simulation.

3.3.2. Separator Exhaust and Sandfall Wind Velocity

Table 7 presents the data obtained from the wind–sand separation tests, and by substituting the data into Equation (16), wind–sand separation efficiencies of 99.4%, 99.35%, 98.5%, and 98.35% were obtained for inlet wind speeds of 6, 9, 12, and 15 m s−1, respectively.

4. Discussion

The wind–sand separator plays a crucial role in the efficient separation of wind–sand particles within the sand collector, especially under strong wind conditions, making its speed reduction performance a critical factor. The structure of the wind–sand separator directly influences its speed reduction performance, thus necessitating the design and analysis of its structure.
In this study, the key parameters of each part of the wind–sand separator were analyzed using Computational Fluid Dynamics (CFD) numerical simulation, and a series of simulation results were obtained. A detailed discussion of each simulation parameter is presented below:
(1)
Influence of Intake Duct Structural Parameters (θ, La, and Lb)
The numerical simulation results depicted in Figure 8 revealed that, as the expansion angle (θ) increased to 15°, the reduction in the velocity of the main airflow stream increased by 49.92%, 53.04%, 55%, 56.01%, and 58.98%, respectively. This was accompanied by an increase in the thickness of the boundary layer, causing the main airflow to gradually concentrate towards the central axis region. Consequently, the velocity of the airflow decreased from 6.91 m s−1 to 5.66 m s−1, with an obvious increase in contour intervals. When the expansion angle (θ) was further increased to 17°, the reduction in the velocity of the main stream reached 57.02%, a slight increase compared to that of the 15° scenario. Vortices appeared in the isokinetic section, the boundary layer thickened significantly, and the main stream began to concentrate towards the central axis area.
In the external flow field where the sand collector operates, the shell’s influence led to the formation of a stagnant flow field on the windward side, as shown in Figure 9. This stagnant flow field acted as a protective shield, obstructing the incoming airflow and even contributing to airflow separation. However, when the sand collector’s inlet was within this stagnant flow field, it failed to meet the isokinetic requirement, potentially impacting the inlet’s collection efficiency. Therefore, the length of the expansion section (La) was set at 60 mm and the horizontal channel (Lb) was established with a length of 35 mm. This design was aimed at mitigating the effects of the stagnant flow generated by the sand collector’s shell on the inlet flow and ensuring isokinetic conditions.
(2)
Influence of the structural parameters of the truncated cone (φ and R)
The numerical simulation results presented in Figure 10 highlight the substantial influence of the cone angle (φ) and radius (R) of the truncated cone’s bottom surface on the airflow behavior. Firstly, in regard to the cone angle (φ), when φ was less than or equal to 20°, the decomposition effect on the airflow velocity along the axial direction was not particularly noticeable. This resulted in a more pronounced impact on the airflow’s bottom velocity component at the end of the slanting column. Conversely, when φ was greater than or equal to 30°, the airflow failed to pass through the truncated cone with a sufficient impact to effectively slow down its velocity. Instead, a significant portion of the airflow passed through the walls on both sides of the double column, leading to the creation of a high-speed vortex region following collision with the wall. This phenomenon notably affected the region surrounding the sandfall opening and sand drop area.
Secondly, concerning the radius of the bottom surface of the truncated cone (R), when R was greater than or equal to 20 mm, the airflow encountered an obstruction at the front end of the truncated cone. This obstruction resulted in airflow stagnation and created a narrow tube effect, leading to the formation of high-speed airflow at the front end of the truncated cone. Conversely, when R was less than or equal to 16 mm, the airflow exhibited characteristics similar to those when φ was greater than or equal to 30°. In this case, the airflow failed to generate a sufficient impact to slow down its velocity. Consequently, a high-speed vortex zone formed after colliding with the wall surface, further impacting the sand drop area.
(3)
Influence of exhaust pipe structural parameters (L and D)
The CFD numerical simulation of the exhaust pipe structural parameters revealed (Figure 11) that, when L was less than or equal to 60 mm, the airflow was predominantly obstructed at the front end of the separator. This obstruction resulted in flow instability in that region and the formation of a local high-speed vortex area, directly impacting the gas–solid separation efficiency. However, when L was set to 70 mm and 80 mm, the airflow tended to diffuse more effectively, resulting in a smoother airflow within the separator and the absence of local vortex formations caused by airflow obstruction. Additionally, no Carmen vortex steps were observed at the rear end of the double columns; instead, they alternately attached to the surface of the double columns. On the other hand, the diameter of the exhaust pipe (D) had a minor impact on the airflow. When D was set to 22, no higher wind speed points were found in the wind speed cloud map at the sand falling mouth.
Figure 14 presents the calculated results and distribution statistics of the wind speed RSD (Relative Standard Deviation) for the numerical simulation and wind tunnel experimental data under various inlet wind speed conditions. The results reveal that the test points with RSD values higher than 5% were predominantly concentrated in area 3, with the maximum wind speed RSD reaching 23.07%. This observation is primarily attributed to the lower wind speeds experienced in area 3, resulting in a greater sensitivity to changes in the wind speed RSD. On the other hand, approximately 88% of the test points exhibited wind speeds lower than 5%, indicating a favorable agreement between the numerical simulation and wind tunnel experiments.
Two common wind–sand separators, namely the shunt-hedge wind–sand separator (SHS) and the multistage expansion combined wind–sand separator (MES), underwent testing within a wind tunnel. Their performances in reducing wind speed and their efficiencies in separating wind-borne sand particles were evaluated under identical altitude conditions, but with varying wind speeds (6, 9, 12, 13.8, and 15 m s−1).
A comparison of the speed reduction performance data, as illustrated in Figure 15, reveal that the DCSS consistently outperformed in reducing the wind speed across all the tested wind speeds.
Figure 16 provides insights into the wind–sand separation performance. Notably, at lower wind speeds, the performance of the SHS was relatively insensitive. However, at other wind speeds, it closely matched the performance of the multistage expanded combined wind–sand separator. While the wind–sand separation efficiency of the DCSS might be comparatively lower, it remained above 98.6% across all the tested wind speeds. An additional advantage of the DCSS is its slight superiority in velocity reduction performance. Even more advantageous is the fact that the DCSS can be installed vertically within the sand collector. This feature enhances its portability, reduces its susceptibility to wind and sand mobility, and renders it suitable for open field experiments.
The conducted tests underlined the remarkable advantages of the wind–sand separator design in the acquisition of wind erosion data. By efficiently segregating and capturing the sand and dust particles within the wind, it enabled precise measurements of the wind erosion event intensity and frequency, as well as the subsequent soil impact. This dataset is invaluable for informing decisions related to land management and conservation. It aids decision makers in more informed land use planning, the selection of suitable vegetation planting strategies for mitigating soil erosion and land degradation risks, and the formulation of vital strategies for sustainable land conservation and restoration.

5. Conclusions

To address the challenges of the wind–sand separator’s large volume and staggered arrangement in the sand collector, a novel design was proposed based on the characteristics of double-column turbulence. This design achieved a significant reduction in height and enabled a vertical arrangement of wind–sand separators within the sand collector, thereby improving the testing accuracy of the sand collector.
Efficient wind and sand separation inside the sand collector under strong wind conditions, essentially a speed reduction issue, was addressed by establishing a geometrical model of the wind–sand separator. This model combined the perturbation characteristics of the inclined column and the theory of circulating friction. Computational Fluid Dynamics (CFD) were used to simulate the structural parameters of the separator’s inlet pipe, truncated cone, and exhaust pipe. Under a wind speed of 13.8 m s−1, the optimal parameters for the wind–sand separator were obtained, with θ at 15°, φ at 25°, R at 18 mm, L at 70 mm, and D at 22 mm, resulting in the most significant speed reduction effect.
The wind tunnel test demonstrated that the velocity reduction in the airflow at the exhaust port of the wind–sand separator was 89.56%, and the velocity reduction at the sand drop port was 89.27%. This indicates a high velocity reduction performance and strong wind resistance. The wind–sand separation efficiency reached more than 98% within the range of 6–15 m s−1, ensuring highly efficient wind–sand separation. Wind speed RSD calculation results and distribution statistics were utilized to validate the wind speed of the wind–sand separator, confirming a reduction of over 98%, indicating an efficient separation capability. The numerical simulation and wind tunnel experimental results were validated through the wind speed RSD calculation and distribution statistics of the wind–sand separator’s wind speed.
The wind–sand separator, constructed from polycarbonate material and produced using 3D printing technology, exhibits a vast spectrum of application possibilities. Its modular design facilitates easy installation within a sand collector, effectively reducing manufacturing costs and installation complexities. Furthermore, this design expansion extends its applicability for prolonged observations of wind erosion events. Through enhanced land management practices, we can provide better protection for soil resources, ensure the stability of ecosystems, and advance the cause of sustainable land utilization.

Author Contributions

Conceptualization, H.L.; methodology, X.C. and B.H.; software, B.H. and M.G.; validation, X.T.; investigation, M.G.; writing—original draft preparation, X.C. and B.H.; writing—review and editing, X.T. and Z.H. All authors have read and agreed to the published version of the manuscript.

Funding

This research was funded by the National Natural Science Foundation of China [42367046]. This research was funded by the Natural Science Foundation of Inner Mongolia Autonomous Region [2020BS04005]. This research was funded by the Key R&D and achievement transformation plan project of Inner Mongolia [2023YFDZ0006]. This research was funded by the Natural Science Foundation of Inner Mongolia Autonomous Region [2023LHMS04010]. This research was funded by the Research Program of science and technology at Universities of Inner Mongolia Autonomous Region [NJZZ23032].

Informed Consent Statement

Informed consent was obtained from all subjects involved in the study.

Data Availability Statement

The data is in the text.

Conflicts of Interest

The authors declare no conflict of interest.

References

  1. Bullard, J.E.; Zhou, Z.; Davis, S.; Fowler, S. Technology. Breakdown and modification of microplastic beads by aeolian abrasion. Environ. Sci. Technol. 2022, 57, 76–84. [Google Scholar] [PubMed]
  2. Giambastiani, Y.; Giusti, R.; Gardin, L.; Cecchi, S.; Iannuccilli, M.; Romanelli, S.; Bottai, L.; Ortolani, A.; Gozzini, B. Assessing Soil Erosion by Monitoring Hilly Lakes Silting. Sustainability 2022, 14, 5649. [Google Scholar]
  3. Zhi, C.; Shuoshi, M.; Yonglai, Z.; Yuechao, S.; Hongmei, C. Characteristics of drifting sand flux over conservation tillage fiel. Trans. Chin. Soc. Agric. Eng. 2010, 26, 118–122. [Google Scholar]
  4. Goossens, D.; Offer, Z.; London, G. Wind tunnel and field calibration of five aeolian sand traps. Geomorphology 2000, 35, 233–252. [Google Scholar]
  5. An, M.; Li, S.; Liu, Z.; Yan, B.; Li, L.; Chen, Z. Galloping vibration of stay cable installed with a rectangular lamp: Field observations and wind tunnel tests. J. Wind. Eng. Ind. Aerodyn. 2021, 215, 104685. [Google Scholar]
  6. Shannak, B.; Corsmeier, U.; Kottmeier, C.; Al-Azab, T. Wind tunnel study of twelve dust samples by large particle size. Atmos. Environ. 2014, 98, 442–453. [Google Scholar] [CrossRef]
  7. Mendez, M.J.; Funk, R.; Buschiazzo, D.E. Field wind erosion measurements with big spring number eight (BSNE) and modified wilson and cook (MWAC) samplers. Geomorphology 2011, 129, 43–48. [Google Scholar]
  8. Fryrear, D.W. A field dust sampler. J. Soil Water Conserv. 1986, 41, 117–120. [Google Scholar]
  9. Dong, M.; Zhao, S.; Fan, G.; Zhao, M.; Tu, Y. Experimental study on the performance of the whirling separation sand sampler. J. Agric. Mech. Res. 2012, 6, 139–140,222. [Google Scholar]
  10. Sherman, D.; Swann, C.; Barron, J. A high-efficiency, low-cost aeolian sand trap. Aeolian Res. 2014, 13, 31–34. [Google Scholar] [CrossRef]
  11. Liu, X.; Kang, Y.; Chen, H.; Lu, H. Application of a High-Precision Aeolian Sand Collector in Field Wind and Sand Surveys. Int. J. Environ. Res. Public Health 2021, 18, 7393. [Google Scholar] [CrossRef] [PubMed]
  12. Song, T.; Chen, Z.; Ma, Q.; Si, Z.; Liu, H.; Xuan, C. Design and Performance Experiment of Shunt-hedging Sand Sampler. Trans. Chin. Soc. Agric. Eng. 2015, 46, 173–177. [Google Scholar]
  13. Mingde, S.; Qinjun, K. Large eddy simulation of the turbulent flow around a circular cylinder at subcritical Reynolds number. Chin. J. Theor. Appl. Mech. 1999, 31, 100–105. [Google Scholar]
  14. Baoling, F.; Tinghui, Z.; Junliu, Y. Numerical simulation of flow over two tandem cylinders. J. Southwest Minzu Univ. 2007, 33, 376–380. [Google Scholar]
  15. Wu, Y.; Ken, H.; Xia, J. Port & Waterway Engineering. Port Waterw. Eng. 2017, 2, 19–26+56. [Google Scholar]
  16. Chen, W.; Ji, C.; Alam, M.M.; Yan, Y. Three-dimensional flow past two stationary side-by-side circular cylinders. Ocean Eng. 2022, 244, 110379. [Google Scholar] [CrossRef]
  17. Masataka, S.; Masahiro, S.; Shoichi, W. Structure of Karman vortex shedding from a yawed cylinder in a uniform flow. Trans. Jpn. Soc. Mech. Eng. Ser. B 1986, 52, 3152–3158. [Google Scholar]
  18. Cheeseman, I.C. Fluid-Dynamic Drag: Practical Information on Aerodynamic Drag and Hydrodynamic Resistance. SF Hoerner. Hoerner Fluid Dynamics, Brick Town, New Jersey. 1965. 455 pp. Illustrated. $24.20. Aeronaut. J. 1976, 80, 371. [Google Scholar] [CrossRef]
  19. Urbanowicz, K. Fast and accurate modelling of frictional transient pipe flow. ZAMM-J. Appl. Math. Mech. Z. Für Angew. Math. Und Mech. 2018, 98, 802–823. [Google Scholar] [CrossRef]
  20. Ziganshin, A.; Logachev, K.; Batrova, K. Environment. Reducing the drag of midpoint lateral orifices of exhaust air ducts by shaping them along vortex zone outlines. J. Affect. Disord. 2021, 188, 107491. [Google Scholar]
  21. Dou, Y.; He, X. Calculation method for hydraulic resistance of pipe. J. Hydraul. Eng. 1995, 7, 28–31+22. [Google Scholar]
  22. Choudhury, D. Introduction to the Renormalization Group Method and Turbulence Modeling. In Technical Memorandum TM-107; Fluent Inc.: Lebanon, NH, USA, 1993. [Google Scholar]
  23. Zhan, X.; He, Y.; Sun, Z.; Shen, B.; Li, X. Technology. Mixing Characteristics of High-Viscosity Fluids under Forced Vertical Vibration. Chem. Eng. Technol. 2020, 43, 1327–1335. [Google Scholar] [CrossRef]
  24. Guo, Z.; Yang, X.; Wu, X.; Zou, X.; Zhang, C.; Fang, H.; Xiang, H.J.A.; Meteorology, F. Optimal design for vegetative windbreaks using 3D numerical simulations. Agric. For. Meteorol. 2021, 298, 108290. [Google Scholar] [CrossRef]
  25. Qiang, L.; Jue, D.; Weng, P. Aerodynamic and Structural Design of Low-Velocity and Low-Turbulence Wind Tunnel. J. Shanghai Univ. Nat. Sci. Ed. 2007, 13, 203–207. [Google Scholar]
  26. Haiyang, L.; Lili, K.; Zhi, C.; Chuanzhong, X.; Tao, S.; Zhimin, S. Design and Experiment of Portable Mini Low—Speed Wind Tunnel. J. Agric. Mech. Res. 2016, 38, 244–249. [Google Scholar]
  27. Viana, J.R.; Macêdo, A.A.M.; Santos, A.O.d.; Façanha Filho, P.d.F.; Graça, M.P.F.; Silva, C.C.d. Análise comparativa da síntese de hidroxiapatita via estado sólido. Matéria 2020, 25, e-12588. [Google Scholar] [CrossRef]
  28. Hao, B.; Tong, X.; Chen, Z.; Liu, H. Calibration of simulation parameters for wind erosion gas-solid two-phase flow in arid and semiarid soils. Rev. Bras. Eng. Agrícola E Ambient. 2022, 26, 564–570. [Google Scholar] [CrossRef]
Figure 1. Expansion pipeline model.
Sustainability 15 15090 g001
Figure 2. Structure of double-column disturbing and circulating friction type wind and sand separator: 1. inlet pipe, 2. truncated cone, 3. wind- and sand-separating chamber, 4. exhaust pipe, and 5. sand falling mouth.
Sustainability 15 15090 g002
Figure 3. Geometry of sand separator.
Sustainability 15 15090 g003
Figure 4. Verification of mesh independence for three mesh sizes.
Sustainability 15 15090 g004
Figure 5. Computational domain grid (The green areas represent walls).
Sustainability 15 15090 g005
Figure 6. Experimental layout: (a) micro wind tunnel layout, (b) wind–sand separator model, and (c) Fluke 923 hot-wire anemometer.
Sustainability 15 15090 g006
Figure 7. Block diagram of wind tunnel wind speed test system.
Sustainability 15 15090 g007
Figure 8. XY cross-section wind speed cloud at the center of the intake pipe: (a) θ = 7°, (b) θ = 9°, (c) θ = 11°, (d) θ = 13°, (e) θ = 15°, and (f) θ = 17°.
Sustainability 15 15090 g008
Figure 9. Influence of sand collector housing on the flow field.
Sustainability 15 15090 g009
Figure 10. Numerical simulation of wind speed cloud at the sandfall port of the wind–sand separator when adjusting the structural parameters of the truncated cone.
Sustainability 15 15090 g010
Figure 11. Numerical simulation of wind speed cloud at the sandfall port of the sand separator when adjusting the structural parameters of the exhaust pipe.
Sustainability 15 15090 g011
Figure 12. Vector diagram of velocity of wind–sand separator: 1—The first speed reduction in intake pipe, 2—The second speed reduction in diverter slanting column, 3—The third speed reduction in the exhaust pipe wall, and 4—The fourth speed reduction by the frictional resistance.
Sustainability 15 15090 g012
Figure 13. Velocity cloud: (a) sandfall of wind–sand separator, and (b) exhaust port of wind–sand separator.
Sustainability 15 15090 g013
Figure 14. Distribution of RSD values of wind speed separator wind speed at different wind speeds.
Sustainability 15 15090 g014
Figure 15. Contrast deceleration performance.
Sustainability 15 15090 g015
Figure 16. Contrast wind–sand separation performance.
Sustainability 15 15090 g016
Table 1. Settings related to numerical calculations.
ItemsTurbulence ModelDiscretization MethodUnder-Relaxation FactorSolution AlgorithmResidual Convergence Value
Calculation setup RNG   k ε First-Order UpwinddefaultSIMPLE0.0001
Table 2. Configuration of cell sizes for the three sets of grids.
No.Double-Column Area
Face Grid Size (mm)
Import and Export
Face Grid Size (mm)
Geometry
Mesh Size (mm)
Average RateNumber of Grids
Group 10.50.821.21.3 × 106
Group 20.81.221.27.55 × 105
Group 31.21.821.23.89 × 105
Table 3. Boundary conditions of inlet airflow with strong winds.
Density   ρ
kg m−3
Velocity   v
m s−1
Hydraulic   Diameter   d
m
Dynamic Viscosity (μ)
P a · s
Reynolds   Number   R e Turbulence   Intensity   ( I )
1.205 13.8 6.153 × 10 3 1.8 × 10 5 5.684 × 10 3 5.43%
Table 4. Percentage distribution of soil particle size.
Soil Particle Size (mm)Soil Percentage (%)
<0.2552.96
0.25~0.518.56
0.5~18.53
1~22.83
>216.93
Table 5. Mean wind speeds in five areas of the estuary where strong wind speeds (13.8 m s−1) prevailed.
ItemsArea 1Area 2Area 3Area 4Area 5
Mean wind speed (m s−1)1.181.150.471.291.28
Table 6. Exhaust and sandfall port wind velocity.
ItemTest Wind Speed (m s−1)Maximum Air Outlet Wind Speed (m s−1)Mean Air Outlet Wind Speed (m s−1)Maximum Sand Outlet Wind Speed (m s−1)Mean Sand Outlet Wind Speed (m s−1)
Wind–sand separator 6 0.36 0.22 0.63 0.43
9 0.7 0.44 0.97 0.31
12 0.76 0.54 1.26 0.48
13.8 1.03 0.66 1.34 0.59
15 1.09 0.71 1.59 0.71
Table 7. Quality of soil samples collected by sand collection boxes of wind-sand separators.
ItemTest NumberTest Wind Speed (m s−1)
691215
Wind–sand separator 1 19.88 19.9 19.7 19.68
2 19.86 19.85 19.72 19.63
3 19.89 19.87 19.69 19.7
Mean 19.88 19.87 19.7 19.67
Disclaimer/Publisher’s Note: The statements, opinions and data contained in all publications are solely those of the individual author(s) and contributor(s) and not of MDPI and/or the editor(s). MDPI and/or the editor(s) disclaim responsibility for any injury to people or property resulting from any ideas, methods, instructions or products referred to in the content.

