
Distribution Characteristics of Drought Resistance and Disaster Reduction Capability and the Identification of Key Factors—A Case Study of a Typical Area in the Yun–Gui Plateau, China

 , ,
, ,
Abstract
:1. Introduction
2. Study Area Profile and Data Sources
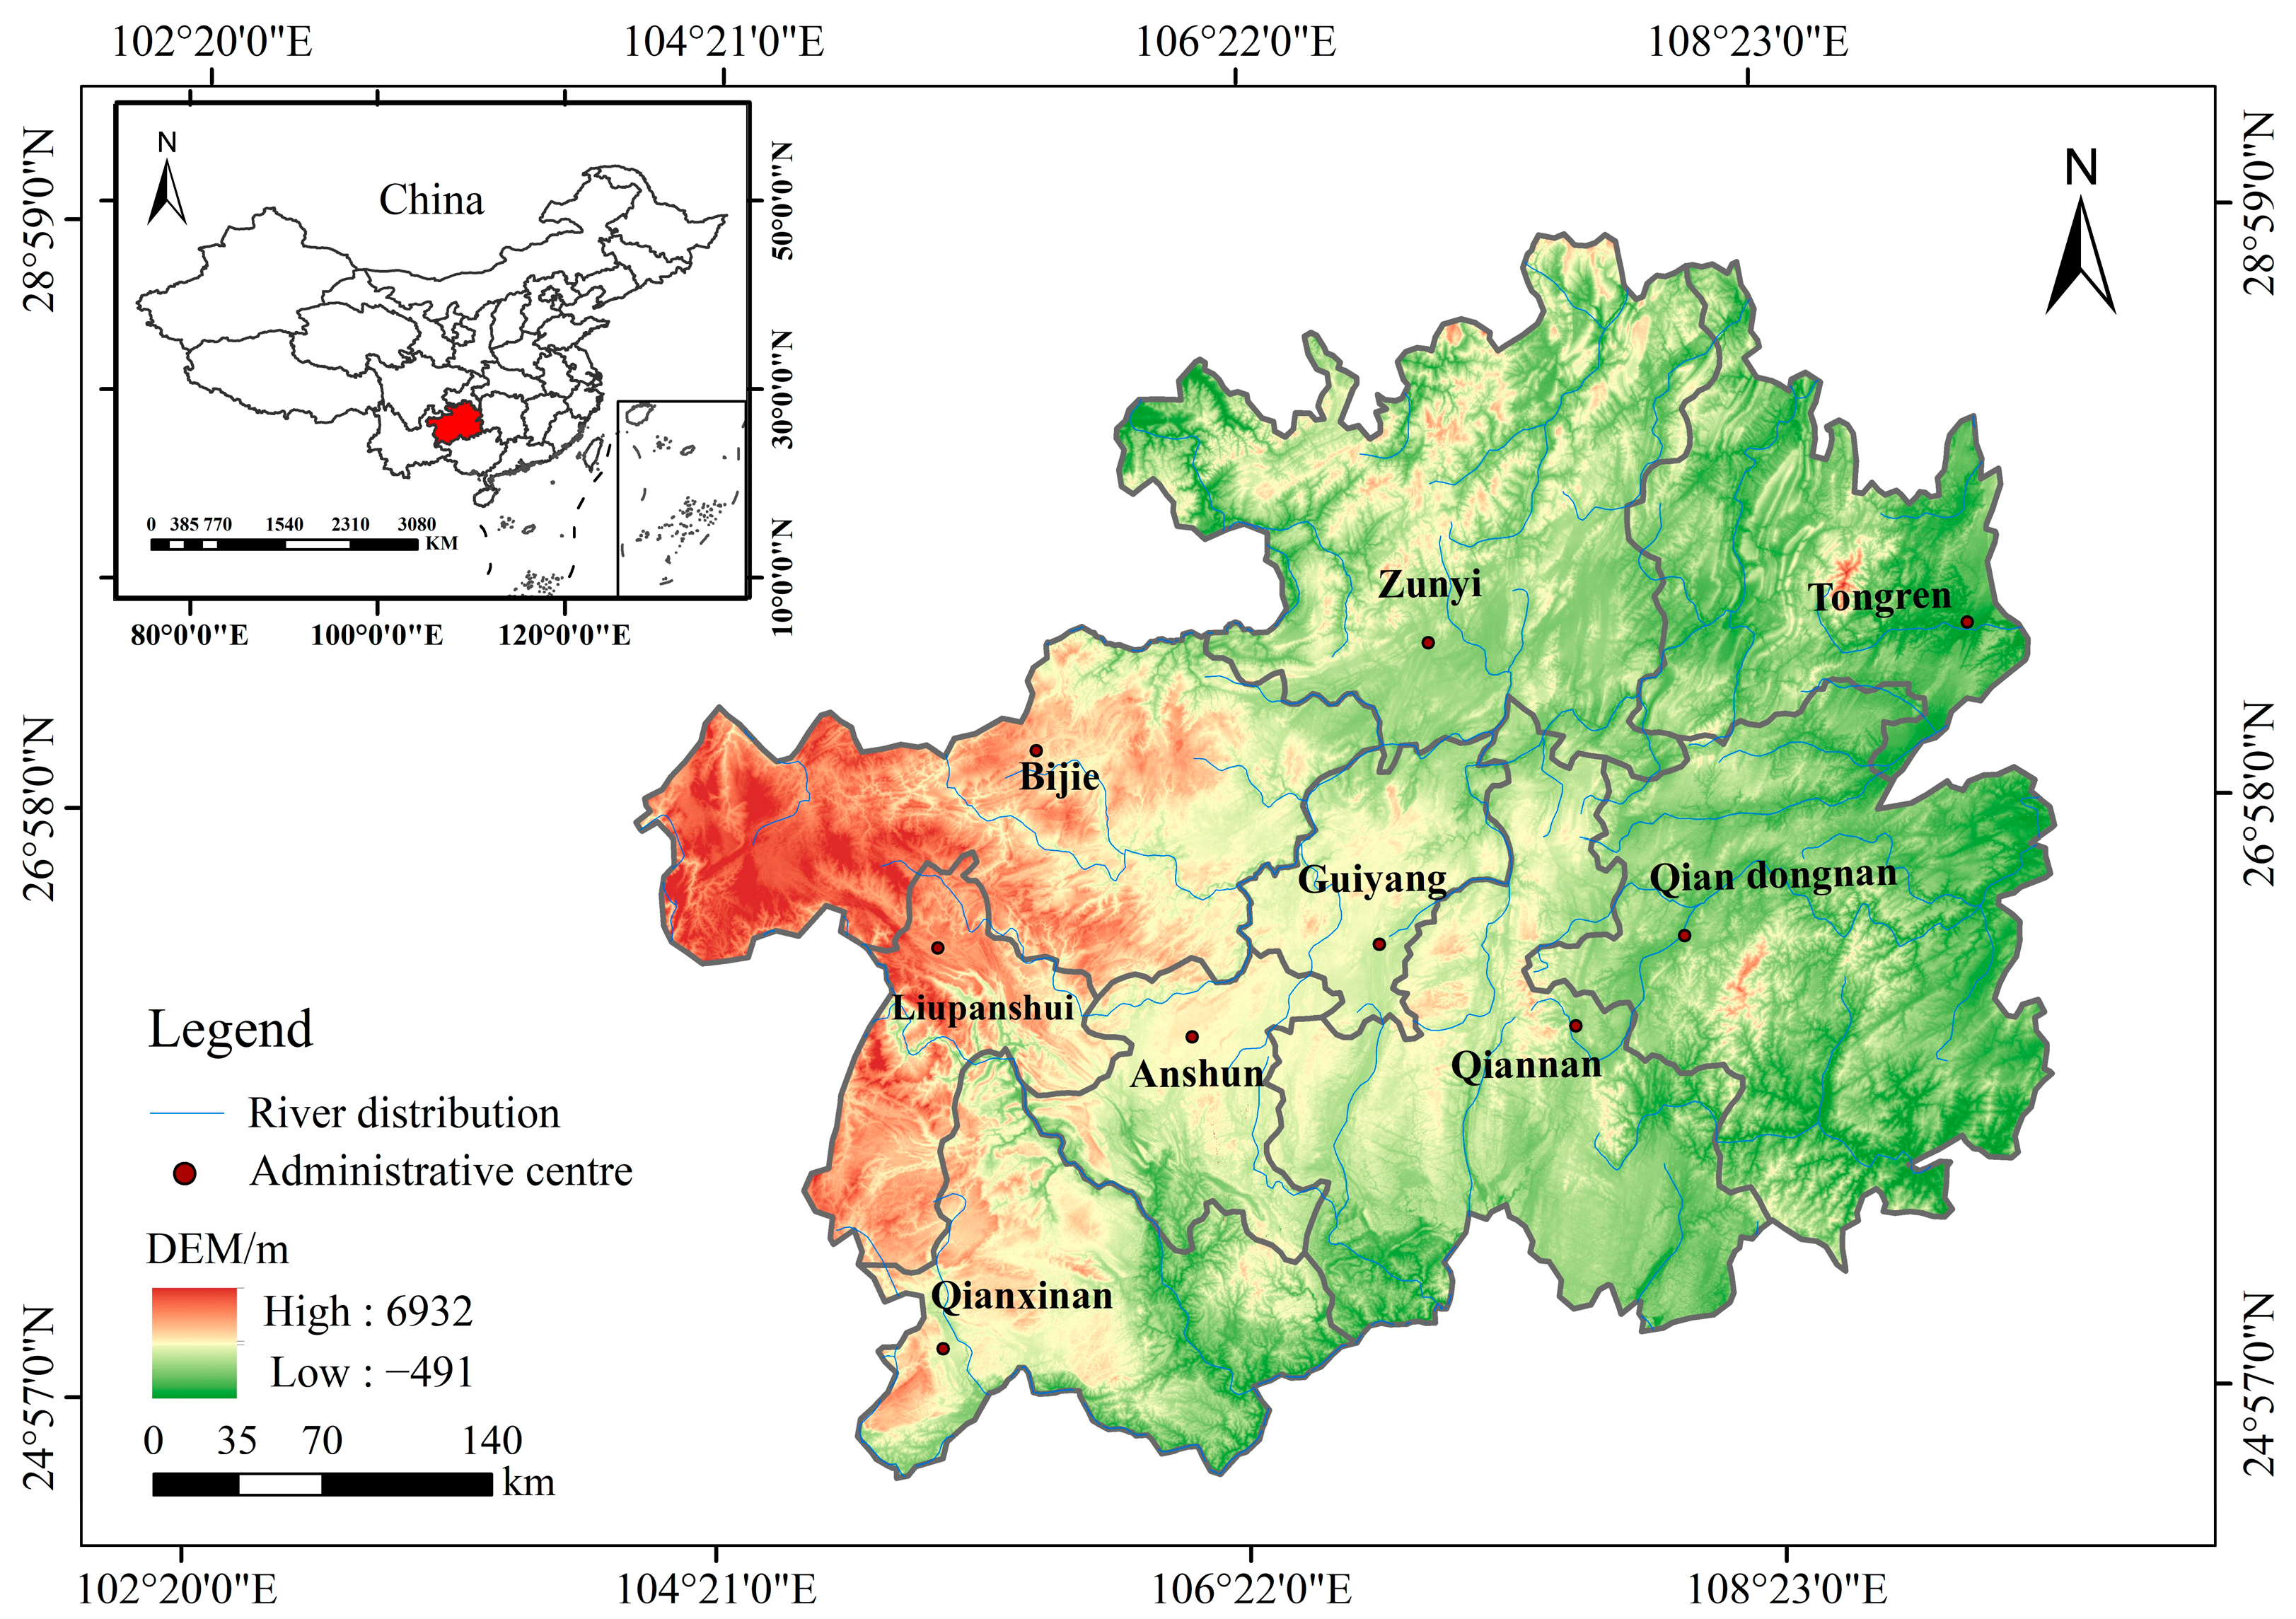
2.1. Overview of the Study Area
2.2. Data Sources
2.3. Research Ideas
3. Evaluation Method
3.1. Fuzzy Comprehensive Evaluation Method
3.1.1. Index System Construction
3.1.2. Preliminary Formulation of the Weights of Indicators
3.1.3. Comprehensive Evaluation
- 1.
- Membership Degree Matrix
- 2.
- Fuzzy vectors
- 3.
- Evaluation criteria
3.2. Supply and Demand Balance Forecasting
3.2.1. Water Availability
3.2.2. Water Demand Calculation
- 1.
- Water Requirement
- 2.
- Water for Agriculture Needs
3.2.3. Calculation of Supply–Demand Ratio
3.2.4. Rules for Evaluating Drought Resistance and Disaster Reduction Capability
3.3. Spatial Class Transfer Matrix
4. Results and Discussion
4.1. Spatial Distribution Characteristics of Drought Resistance and Disaster Reduction Capability
4.2. Fuzzy Comprehensive Evaluation Method and Correction
4.2.1. Adjustment of Index Weight
4.2.2. Rationality Analysis
4.3. Identification of Main Influencing Factors of Dought Resistance and Disaster Reduction
4.3.1. Analysis of Contribution Rates of Influencing Factors
4.3.2. Countermeasure Analysis
5. Conclusions
- The drought resistance and disaster reduction capacities of Guizhou Province are determined based on whether or not the water supply can meet the water demand under different drought frequencies. The results show that the areas with lower drought resistance and reduced disaster capacity in Guizhou Province are mainly located in the northwest, northeast, southeast, and some southern areas. The central, northeast, and southwest regions, such as Zunyi and Tongren, exhibit a relatively developed economy, relatively effective water conservancy project construction, and a relatively high urbanization level, resulting in higher overall drought resistance and disaster reduction capacity.
- The evaluation results in regards to drought resistance and reduction capacity according to the supply and demand balance method were taken as the reference object. This is helpful to determine the index weight of the fuzzy comprehensive evaluation method in order to ensure the accuracy of identifying the factors impacting drought resistance and disaster reduction ability. The ranking of the contribution rates of the influencing factors is as follows: surface water supply and storage rate > average number of soil moisture monitoring stations > per capita GDP > agricultural emergency drought irrigation rate > regional water supply assurance rate > cultivated land effective irrigation rate > agricultural water allocation ratio > average number of drought service personnel per unit area > irrigation efficiency> dryland crop planting ratio > urbanization rate > rocky desertification degree> vegetation coverage > average elevation > rural centralized water supply project population coverage rate > irrigation water effective utilization coefficient > runoff depth negative anomaly index. Therefore, it is considered that in terms of water conservancy projects, economic strength, and emergency drought criterion, the six key indicators that primarily affect drought resistance and disaster reduction capabilities are surface water supply and storage rate, average number of soil moisture monitoring stations, per capita GDP, agricultural emergency drought irrigation rate, regional water supply guarantee rate, and cultivated land effective irrigation rate.
Author Contributions
Funding
Institutional Review Board Statement
Informed Consent Statement
Data Availability Statement
Acknowledgments
Conflicts of Interest
References
- IPCC. Climate Change 2021: The Physical Science Basis. Contribution of Working Group I to the Sixth Assessment Report of the Intergovernmental Panel on Climate Change; Cambridge University Press: Cambridge, UK, 2021. [Google Scholar]
- Guo, C.H.; Zhu, X.F.; Zhang, S.Z.; Tang, M.X.; Xu, K. CMIP6-BASED assessment of future high temperature risk changes in China. J. Earth Inf. Sci. 2022, 24, 1391–1405. (In Chinese) [Google Scholar]
- Ari, G.; Bao, Y.B.; Asi, H.F.; Zhang, J.Q.; Na, L.; Angge, L.; Bao, Y.L.; Han, A.; Dong, Z.H.; Zhi, J.T.; et al. Impact of global warming on meteorological drought: A case study of the Songliao Plain, China. Theor. Appl. Climatol. 2021, 146, 1315–1334. [Google Scholar] [CrossRef]
- Chen, S.S.; Yuan, X. CMIP6 projects less frequent seasonal soil moisture droughts over China in response to different warming levels. Environ. Res. Lett. 2021, 16, 044053. [Google Scholar] [CrossRef]
- Sun, X.; Wang, J.; Ma, M.; Han, X. Attribution of extreme drought events and associated physical drivers across southwest China using the budyko framework. Rem. Sens. 2023, 15, 2702. [Google Scholar] [CrossRef]
- Yao, Y.B.; Zhang, Q.; Wang, J.S.; Shang, J.L.; Wang, Y.; Shi, J.; Han, L.Y. Response characteristics of drought in southwest China to climate warming. J. Ecol. Env. 2014, 23, 1409–1417. (In Chinese) [Google Scholar] [CrossRef]
- Li, X.; Li, Y.; Chen, A.; Gao, M.; Slette, I.J.; Piao, S. The impact of the 2009/2010 drought on vegetation growth and trrestrial carbon balance in Southwest China. Agr. Forest Meteorol. 2019, 269, 239–248. [Google Scholar] [CrossRef]
- Sun, Z.X.; Zhang, Q.; Sun, R.; Deng, B. Characteristics of extreme high temperature and drought in southwest China in 2022 and its main impacts. Dry Weather 2022, 40, 764–770. (In Chinese) [Google Scholar]
- Yang, X.H.; Yuan, L.G.; Jiang, Z.S.; Feng, X.J.; Tang, M.L.; Chang, H. The spatial and temporal characteristics of extreme drought in Yunnan province from 2011 to 2020 were quantitatively analyzed by using GPS vertical displacement. Geophys. 2022, 65, 2828–2843. (In Chinese) [Google Scholar]
- Lu, Q.P.; Zhao, C.W.; Huang, H.Y. Comparative study on the temporal and spatial evolution of the ecosystem service value of different karst landform types: A case study in Guizhou province, China. Appl. Sci. 2022, 12, 12801. [Google Scholar] [CrossRef]
- Antriyandarti, E.; Barokah, U.; Rahayu, W.; Laia, D.H.; Asami, A. Factors associated with food security of dryland farm households in the karst mountains of Gunungkidul Indonesia. Sustainability 2023, 15, 8782. [Google Scholar] [CrossRef]
- Oyounalsoud, M.S.; Abdallah, M.; Gokhan, Y.A.; Siddique, M.; Atabay, S. A new meteorological drought index based on fuzzy logic: Development and comparative assessment with conventional drought indices. J. Hydrol. 2023, 619, 129306. [Google Scholar] [CrossRef]
- Zhang, T.; Su, X.L.; Wu, L.Z. Integrating multiple comparison methods for attributing hydrological drought evolution and drought propagation: The impact of climate change cannot be ignored. J. Hydrol. 2023, 621, 129557. [Google Scholar] [CrossRef]
- Xu, Y.Y.; Zhu, X.Y.; Cheng, X.; Gun, Z.; Lin, J.; Zhao, J.W.; Yao, L.; Zhou, C.H. Drought assessment of China in 2002–2017 based on a comprehensive drought index. Agri. Forest Meteorol. 2022, 319, 108922. [Google Scholar] [CrossRef]
- Aida, H.N.; Hossein, A.; Seyed, H.S. Analyzing drought history using Fuzzy Integrated Drought Index (FIDI): A case study in the Neyshabour basin, Iran. Arab. J. Geosci. 2018, 11, 1–10. [Google Scholar] [CrossRef]
- Liu, Y.B.; Liu, L.M.; Xu, D.; Zhang, S.H. Risk assessment of flood and drought in major grain-producing areas based on information diffusion theory. E. Office T. Chin. Soc. Agric. Eng. 2010, 26, 1–7. [Google Scholar]
- Ying, H. Assessment research of bijie drought risk based on cloud model. J. Risk Anal. Crisis Response 2013, 3, 192–200. [Google Scholar] [CrossRef]
- Jin, C.; Wen, L.; Chen, W.K.; Zhang, S.P. Assessment of earthquake prevention and disaster reduction capability of county-level administrative units in Gansu Province. J. Risk Anal. Crisis Response 2017, 7, 214–224. [Google Scholar] [CrossRef]
- Sim, K.B.; Jo, D.J.; Kim, E.S. Study on Evaluation of flood disaster reduction ability based on operation scenarios at the pump station. Korean Soc. Hazard Mitig. 2017, 17, 393–400. [Google Scholar] [CrossRef]
- Ban, Y.U.; Baek, J.I.; Kim, Y.M. Developing an urban safety assessment framework using sustainable urban metabolism. Crisis Emerg. Manag. Theory Prax. 2018, 14, 119–135. [Google Scholar] [CrossRef]
- Zhao, L.M.; Dong, Y. Research on coastal cities’ comprehensive disaster prevention and mitigation capacity by catastrophe-fuzzy matter-element evaluation method based on coefficient of variation. Indian J. Geo-Mar. Sci. 2018, 47, 1574–1580. [Google Scholar]
- Wang, H.Y.; Liu, X.J.; Li, J.S.; Liu, C.P.; Jiang, J.Y. Research and practice of regional comprehensive disaster prevention and mitigation planning: A case study in Tanghai county. Appl. Mech. Mater. 2012, 256–259, 2747–2753. [Google Scholar] [CrossRef]
- Emmanuel, A.F.; Carmen, D.M.O.; Los, D.S.S.; Gustavo, S.; Oluranti, B.O. Recent Developments in the Application of Plant Growth-Promoting Drought Adaptive Rhizobacteria for Drought Mitigation. Plants 2022, 11, 3090. [Google Scholar] [CrossRef]
- Rostamian, A.; Moaveni, P.; Mozafari, S.S.; Hamid, M.; Faezeh, R. Effective drought mitigation by rhizobacteria consortium in wheat field trials. Rhizosphere 2023, 25, 100653. [Google Scholar] [CrossRef]
- Zhang, P.P.; Mao, J.Q.; Gu, K.Y.; Dai, L.Q.; Dai, H.C. Integrated scheduling-assessing system for drought mitigation in the river-connected lake. J. Envir. Manag. 2022, 313, 114999. [Google Scholar] [CrossRef] [PubMed]
- Wang, Y.M.; Yang, J.; Chang, J.X.; Zhang, R. Assessing the drought mitigation ability of the reservoir in the downstream of the Yellow River. Sci. Total Environ. 2019, 646, 1327–1335. [Google Scholar] [CrossRef]
- Yan, N.; Wu, B.; Zhu, W.; Ma, Z.; Zhang, X.; Bulgan, D. The Evolution of Irrigation Effects on Agricultural Drought Mitigation in North China. Rem. Sens. 2022, 20, 5197. [Google Scholar] [CrossRef]
- Gu, Y.; Ni, S.H.; Wang, H.R. Comprehensive evaluation of agricultural drought resistance in China. Adv. Water Sci. 2005, 05, 700–704. (In Chinese) [Google Scholar]
- Jin, J.L.; Fei, Z.Y.; Li, J.Q.; Zhou, Y.L. Evaluation method of regional drought resistance capacity based on water supply and demand balance analysis of different water supply frequencies. J. Water Conserv. 2013, 44, 687–693. (In Chinese) [Google Scholar] [CrossRef]
- Huang, F.Y.; Zhou, L.; Song, B.; Pang, R.; Wu, Y.; Wang, F.P.; Zhang, Y.X. Characteristics of as content in dryland soil and maize and evaluation of its planting safety in Guizhou province. Environ. Sci. 2023, 44, 415–425. (In Chinese) [Google Scholar] [CrossRef]
- Bo, L.; Qiang, W.; Li-Xia, C. An analytical method of regional water resources carrying capacity in karst area—A case study in Guizhou province, China. Water Pract. Technol. 2016, 11, 796–805. [Google Scholar] [CrossRef]
- Chen, L.H.; He, Z.H.; Pan, S.; Gu, X.L.; Xu, M.J.; You, M.; Pi, G.N. Spatio-temporal evolution and driving exploration of agricultural drought in Kras province based on different time scales: A case study of Guizhou Province. J. Soil Water Conserve. 2023, 37, 136–148. (In Chinese) [Google Scholar] [CrossRef]
- Ma, L.Q.; Xu, Y.J.; Ngo, I.; Wang, Y.Y.; Zhai, J.T.; Hou, L.X. Prediction of water-blocking capability of water-seepage-resistance strata based on AHP-fuzzy comprehensive evaluation method—A case study. Water. 2022, 14, 2517. [Google Scholar] [CrossRef]
- Nasrollahi, M.; Khosravi, H.; Moghaddamnia, A.; Malekian, A.; Shahid, S. Assessment of drought risk index using drought hazard and vulnerability indices. Arab. J. Geosci. 2018, 118, 1–12. [Google Scholar] [CrossRef]
- Fan, R.; Cao, W. An empirical analysis of financial ecological environment evaluation of Guangzhou and Shenzhen—Based on entropy weight method and K-means clustering method. Acad. J. Bus. Manag. 2023, 5, 050315. [Google Scholar] [CrossRef]
- Tan, Y.T.; Wang, X.L.; Liu, X.G.; Zhang, S.; Li, N.; Liang, J.P.; Xu, D.; Yang, Q.L. Comparison of AHP and BWM methods based on ArcGIS for ecological suitability assessment of Panax notoginseng in Yunnan Province, China. Ind. Crop. Prod. 2023, 199, 116737. [Google Scholar] [CrossRef]
- Jiang, W.; Deng, L.; Chen, L.; Wu, J.; Li, J. Risk assessment and validation of flood disaster based on fuzzy mathematics. Prog. Nat. Sci.-Mater. 2009, 19, 1419–1425. [Google Scholar] [CrossRef]
- Li, Y.X.; Yang, W.; Li, J.J.; Zhang, Z.; Meng, L.K. A novel method for mapping lake bottom topography using the GSW dataset and measured water level. Rem. Sens. 2022, 14, 1423. [Google Scholar] [CrossRef]
- Chen, K.W.; Yu, S.G.; Li, Q.Q.; Zhang, M.T.; Wang, Y.; Liu, Z.X. Simulation and evaluation of water-saving irrigation schemes for rice under different hydrological year patterns. J. Agric. Mach. 2019, 50, 268–277. (In Chinese) [Google Scholar]
- Li, L.C.; Zou, Y.F.; Li, Y.; Lin, H.X.; Liu, D.L.; Wang, B.; Yao, N.; Song, S.B. Trends, change points and spatial variability in extreme precipitation events from 1961 to 2017 in China. Hydrol. Res. 2020, 51, 484–504. [Google Scholar] [CrossRef]
- Liu, C.; Jiang, W.L.; Wu, Y.F.; Liu, Y.F.; Liang, L.J. Estimation of regional farmland irrigation water requirements and water balance in Northeast China. Environ. Sci. Pollut. Res. Int. 2022, 29, 71840–71856. [Google Scholar] [CrossRef]
- DB52/T725-2021; Water Intake Norm. Guizhou Provincial Market Supervision Administration: Guizhou, China, 2021. (In Chinese)
- Zhu, M.B.; Yu, H.; Yang, L.; Wang, X.H.; Zou, Y.C. Effects of land consolidation and precipitation changes on the balance of water supply and demand in western Jilin. Water. 2022, 14, 3206. [Google Scholar] [CrossRef]
- Hu, M.Q.; Liu, L.M.; Liu, M. Calculation Method of state transfer matrix in markov Chain model for airborne contaminant transport: Investigation and improvement. Build. Environ. 2020, 185, 107295. [Google Scholar] [CrossRef]
- Babulal, S.; Sk, J.H. Empirical Bayes estimation of parameters in Markov transition probability matrix with computational methods. J. Appl. Stat. 2015, 42, 508–519. [Google Scholar] [CrossRef]
- Zeng, D.Z.; He, Q.Y.; Yu, Z.M.; Jia, W.Y.; Zhang, S.; Liu, Q.P. Risk assessment of sustained casing pressure in gas wells based on the fuzzy comprehensive evaluation method. J. Nat. Gas Sci. Eng. 2017, 46, 756–763. [Google Scholar] [CrossRef]
- Sharma, S.; Singh, S.K.; Kanga, S.; Kranjčić, N.; Đurin, B. Urban space change and future prediction of kanpur nagar, uttar pradesh using EO data. Environ. Eng.-Inženjerstvo Okoliša. 2021, 8, 72–86. [Google Scholar] [CrossRef]
- Huang, J.; Sun, Z.M.; Zhong, P.S. The spatial disequilibrium and dynamic evolution of the net agriculture carbon effect in China. Sustainability 2022, 14, 13975. [Google Scholar] [CrossRef]
- Li, W.; Wang, W.J.; Wu, Y.J.; Quan, Q.; Zhao, S.X.; Zhang, W.J. Impact of human activities on hydrological drought evolution in the Xilin river basin. Atmosphere 2022, 13, 2079. [Google Scholar] [CrossRef]
- Zeng, Z. Problems and strategies of water safety management in Guizhou during the 14th five-year plan period. Theory Contemp. 2022, 5, 13–15. (In Chinese) [Google Scholar]
- Achite, M.; Bazrafshan, O.; Wałęga, A.; Azhdari, Z.; Krakauer, N.; Caloiero, T. Meteorological and hydrological drought risk assessment using multi-dimensional copulas in the wadi ouahrane basin in algeria. Water 2022, 14, 653. [Google Scholar] [CrossRef]
- Ou, G.L.; Tan, S.K.; Zhou, M.; Lu, S.S.; Tao, Y.H.; Zhang, Z.; Zhang, L.; Yan, D.P.; Guan, X.L.; Wu, G. An interval chance-constrained fuzzy modeling approach for supporting land-use planning and eco-environment planning at a watershed level. J. Environ. Manag. 2017, 204, 651–666. [Google Scholar] [CrossRef]
- Lv, C.; Liao, H.L.; Ling, M.H.; Wu, Z.N.; Yan, D.H. Assessment of eco-economic effects of urban water system connectivity project. Environ. Sci. Pollut. Res. Int. 2022, 29, 53353–53363. [Google Scholar] [CrossRef] [PubMed]
- Xia, J.; Chen, J.; She, D.X. Extreme drought events in the Yangtze River basin in 2022 and their impacts and countermeasures. J. Water Conserv. 2022, 53, 1143–1153. (In Chinese) [Google Scholar] [CrossRef]


| Criterion Layer | Index Layer | Low | Medium-Low | Medium | Medium-High | High |
|---|---|---|---|---|---|---|
| Natural condition | rocky desertification degree (%) | ≤20 | 20–40 | 40–50 | 50–60 | >60 |
| average elevation (%) | ≤20 | 20–40 | 40–60 | 60–70 | >70 | |
| runoff depth negative anomaly index | ≤50 | 50–60 | 60–70 | 70–80 | >80 | |
| vegetation coverage (%) | ≤20 | 20–40 | 40–60 | 60–80 | >80 | |
| Water conservancy project | surface water supply and storage rate (%) | ≤20 | 20–40 | 40–50 | 50–60 | >60 |
| cultivated land effective irrigation rate (%) | ≤30 | 30–50 | 50–70 | 70–90 | >90 | |
| regional water supply assurance rate (%) | ≤60 | 60–80 | 80–100 | 100–150 | >150 | |
| rural centralized water supply projects population coverage rate (%) | ≤60 | 60–70 | 70–80 | 80–90 | >90 | |
| Economic strength | per capita GDP (10,000/person) | ≤3 | 3–4 | 4–5 | 5–7 | >7 |
| urbanization rate (%) | ≤40 | 40–60 | 60–80 | 80–90 | >90 | |
| Water usage and water-saving level | water-saving irrigation rate (%) | ≤30 | 30–50 | 50–65 | 65–80 | >80 |
| dry land crop planting proportion (%) | ≥70 | 50–70 | 40–50 | 30–40 | <30 | |
| agricultural water allocation ratio (%) | ≥70 | 55–70 | 40–50 | 20–40 | <20 | |
| irrigation water effective utilization coefficient | ≤0.47 | 0.41–0.48 | 0.48–0.49 | 0.49–0.5 | >0.5 | |
| Emergency drought resilience capacity | average number of drought service personnel per unit area (person/20,000 ha) | ≤15 | 15–20 | 20–25 | 25–30 | >30 |
| agricultural emergency drought irrigation rate (%) | ≤40 | 40–60 | 60–80 | 80–90 | >90 | |
| average number of soil moisture monitoring stations (piece/50,000 ha) | ≤2 | 2–4 | 4–6 | 6–8 | >80 |
| Criterion Layer | Natural Condition | Water Conservancy Project | Economic Strength | Water Usage and Water-Saving Level | Emergency Drought Resilience Capacity | |||||
|---|---|---|---|---|---|---|---|---|---|---|
| 0.041 | 0.123 | 0.156 | 0.132 | 0.548 | ||||||
| index layer | rocky desertification factor | 0.47 | surface water supply and storage rate | 0.62 | per capita GDP | 0.69 | water-saving irrigation efficiency | 0.32 | average number of drought service personnel per unit area | 0.19 |
| average elevation | 0.20 | cultivated land effective irrigation rate | 0.15 | urbanization rate | 0.31 | dry land crops planting proportion | 0.25 | agricultural emergency drought irrigation rate | 0.19 | |
| runoff depth negative anomaly index | 0.21 | regional water supply assurance rate | 0.20 | agricultural water allocation ratio | 0.35 | average number of soil moisture monitoring stations | 0.62 | |||
| vegetation coverage | 0.12 | rural centralized water supply projects population coverage rate | 0.03 | irrigation water effective utilization coefficient | 0.07 | |||||
| Drought Frequency | Once in Five Years | Once in Ten Years | Once in Twenty Years | Once in Fifty Years | |
|---|---|---|---|---|---|
| supply–demand ratio | <1 | ≥1 | ≥1 | ≥1 | ≥1 |
| level | low | low-medium | medium | medium-high | high |
| Criterion Layer | Natural Condition | Water Conservancy Project | Economic Power | Water Usage and Water Conservation Level | Emergency Preparedness Capacity | |||||
|---|---|---|---|---|---|---|---|---|---|---|
| 0.060 | 0.370 | 0.160 | 0.140 | 0.270 | ||||||
| index layer | rocky desertification degree | 0.38 | surface water supply and storage rate | 0.62 | per capita GDP | 0.80 | irrigation efficiency | 0.32 | average number of drought service personnel per unit area | 0.17 |
| average elevation | 0.20 | cultivated land effective irrigation rate | 0.15 | urbanization rate | 0.2 | dryland crop planting ratio | 0.25 | agricultural emergency drought irrigation rate | 0.30 | |
| runoff depth negative anomaly index | 0.12 | regional water supply assurance rate | 0.20 | agricultural water allocation ratio | 0.35 | average number of soil moisture monitoring stations | 0.53 | |||
| vegetation coverage | 0.30 | rural centralized water supply project population coverage rate | 0.03 | irrigation water effective utilization coefficient | 0.08 | |||||
| Drought Resistance and Disaster Reduction Capability Level Area Ratio (%) | Fuzzy Evaluation Method | Reduction (∇) | ||||||
|---|---|---|---|---|---|---|---|---|
| Low | Low-Medium | Medium | Medium-High | High | Total | |||
| supply–demand balance method | low | 57.72 | 0.00 | 0.00 | 0.00 | 0.00 | 57.72 | 0.00 |
| low-medium | 14.59 | 2.52 | 1.10 | 0.00 | 0.59 | 18.80 | 16.28 | |
| medium | 6.89 | 2.59 | 0.00 | 0.00 | 1.15 | 10.63 | 10.63 | |
| medium-high | 1.28 | 0.61 | 0.00 | 0.00 | 0.61 | 2.50 | 2.50 | |
| high | 1.65 | 0.00 | 1.46 | 5.26 | 1.98 | 10.35 | 8.38 | |
| total | 82.13 | 5.73 | 2.56 | 5.26 | 4.32 | 100.00 | 37.79 | |
| Promotion (Δ) | 24.41 | 3.21 | 2.56 | 5.26 | 2.35 | 37.79 | —— | |
| Number | Indicators | Contribution Rate | Number | Indicators | Contribution Rate |
|---|---|---|---|---|---|
| 1 | surface water supply and storage rate | 22.93% | 10 | dryland crop planting ratio | 3.50% |
| 2 | average number of soil moisture monitoring stations | 14.31% | 11 | urbanization rate | 3.20% |
| 3 | per capita GDP | 12.80% | 12 | rocky desertification degree | 2.28% |
| 4 | agricultural emergency drought irrigation rate | 8.10% | 13 | vegetation coverage | 1.80% |
| 5 | regional water supply assurance rate | 7.40% | 14 | average elevation | 1.20% |
| 6 | cultivated land effective irrigation rate | 5.51% | 15 | rural centralized water supply project population coverage rate | 1.16% |
| 7 | agricultural water allocation ratio | 4.90% | |||
| 8 | average number of drought service personnel per unit area | 4.59% | 16 | irrigation water effective utilization coefficient | 1.12% |
| 9 | irrigation efficiency | 4.48% | 17 | runoff depth negative anomaly index | 0.72% |
Disclaimer/Publisher’s Note: The statements, opinions and data contained in all publications are solely those of the individual author(s) and contributor(s) and not of MDPI and/or the editor(s). MDPI and/or the editor(s) disclaim responsibility for any injury to people or property resulting from any ideas, methods, instructions or products referred to in the content. |
© 2023 by the authors. Licensee MDPI, Basel, Switzerland. This article is an open access article distributed under the terms and conditions of the Creative Commons Attribution (CC BY) license (https://creativecommons.org/licenses/by/4.0/).
Share and Cite
Liu, X.; Du, M.; Lei, H.; Pan, H.; Shang, C.; Feng, K.; Wang, W. Distribution Characteristics of Drought Resistance and Disaster Reduction Capability and the Identification of Key Factors—A Case Study of a Typical Area in the Yun–Gui Plateau, China. Sustainability 2023, 15, 15148. https://doi.org/10.3390/su152015148
Liu X, Du M, Lei H, Pan H, Shang C, Feng K, Wang W. Distribution Characteristics of Drought Resistance and Disaster Reduction Capability and the Identification of Key Factors—A Case Study of a Typical Area in the Yun–Gui Plateau, China. Sustainability. 2023; 15(20):15148. https://doi.org/10.3390/su152015148
Chicago/Turabian StyleLiu, Xin, Mengyuan Du, Hongjun Lei, Hongwei Pan, Chongju Shang, Kai Feng, and Wenbo Wang. 2023. "Distribution Characteristics of Drought Resistance and Disaster Reduction Capability and the Identification of Key Factors—A Case Study of a Typical Area in the Yun–Gui Plateau, China" Sustainability 15, no. 20: 15148. https://doi.org/10.3390/su152015148
APA StyleLiu, X., Du, M., Lei, H., Pan, H., Shang, C., Feng, K., & Wang, W. (2023). Distribution Characteristics of Drought Resistance and Disaster Reduction Capability and the Identification of Key Factors—A Case Study of a Typical Area in the Yun–Gui Plateau, China. Sustainability, 15(20), 15148. https://doi.org/10.3390/su152015148