Abstract
Orange-juice production represents a significant, world-leading economic sector in Brazil. Orange processing residues, however, correspond to 50% to 60% of the in natura fruit mass. Despite the high amount of generated waste, which is disposed of in landfills or used as raw material to produce low-value animal feed, studies on the use of this waste are still developing in Brazil. However, orange peels contain compounds that can be precursors to higher value-added products in different sectors. Therefore, this study presents a conceptual proposal for a biorefinery integrated into the orange-juice-production route to assess integrated processes’ technical, environmental, and economic performance to convert waste into chemicals, fuels, and energy. A stationary process simulation model was developed to analyze the manufacturing of four products, namely, D-limonene, pectin, biomethane, and electricity, comparing the results to the conventional feed production route according to generated revenue and environmental impacts. The results indicate that pectin production is the highest financial-return route, presenting the most significant environmental impact, whereas D-limonene production is more attractive, generating the second-highest revenue with the lowest associated environmental impacts.
1. Introduction
According to the United States Department of Agriculture, Brazil is the largest orange-juice producer in the world, with an estimated harvest yield of around 1.1 million tons in 2022/2023 [1]. Citrus farming is present in all Brazilian states, and according to the Confederation of Agriculture and Livestock, the country accounts for 79% of the world’s orange juice trade [2].
Even though this market is highly profitable, it faces challenges that take time to solve, such as the high generation of waste. This is because up to 60% of the initial mass of fresh fruit is discarded during the production of orange juice [3,4,5], becoming a solid waste whose destination can be disposal in landfills or being used as an input in animal-feed production. The landfill disposal of this residue associated with a high fermentable carbohydrate content accelerates orange peel degradation, producing an aqueous phase that can harm microbial soil flora and pollute groundwater [6]. In other cases, uncontrolled orange peel decomposition under anaerobic conditions can have a flammable methane mixture when in contact with air [7]. Using peels in animal feed processing can also cause severe environmental impact due to its high fermentability and results in expressive costs to the process regarding transportation and logistics (i.e., the lack of suitable disposal sites). In addition, at the slightest sign of degradation, orange peels produce ration with a low nutritional content and an unpleasant taste for livestock. Finally, the high moisture content of the waste (>75% w/w) implies significant operating costs for its management and disposal [8]. In terms of opportunity, orange peels contain significant amounts of free sugars, insoluble carbohydrates, essential oils, pigments, flavonoids, and acids [5,9,10]. These compounds can be employed as the precursors of more profitable products in the food, cosmetics, and medicine industries [10,11] or applied in energy facilities, where organic matter is converted into heat and electricity [12].
In a global scenario of food insecurity, economic instability, recession, and pandemics, waste from the agricultural food industry should be minimized. The natural way for this to happen is to create process logic capable of converting them into quality by-products that can be used in other manufacturing processes. Moreover, for many experts in this sector, the reuse of waste in agri-food production chains plays a decisive role in consolidating the Circular Economy by generating (or expanding) economic gains and reducing adverse environmental effects [13].
The proposition of alternatives for waste recovery and manufacturing arrangements within the same process structure has become a tendency within the biorefinery concept. However, although uncommon in the literature, studies involving orange processing residues date from about the last decade. An example of such developments is the research conducted by Pourbafrani et al., who used data collected in a pilot plant to propose an integrated arrangement of the production of ethanol, biogas, pectin, and limonene from citrus wastes [14]. Although successful because of the results obtained, this assessment was restricted to the technical dimension of the process. Also noteworthy are the efforts of Cerón-Salazar and Cardona-Alzate, who used a commercial simulator to conceive a process for extracting essential oil and pectin [15]. The results were validated via confrontation with experimental parameters, and as it proved to be consistent, the process was scheduled to 1.0 t of orange peel. Finally, Davila et al. designed a scheme for extracting p-cymene and pectin. In this development, the authors verified the performance of the process in technical, economic, and environmental terms for situations with and without electricity generation [16].
Despite the socio-economic importance of the orange juice industry in Brazil, our literature search did not identify any studies by local researchers on solving the problem of oversupply of orange peel. In this context, although an appropriate approach to the problem is the design of a citrus-based biorefinery, verifying this approach’s environmental and economic viability is a fundamental and compulsory aspect [12,17]. This study aims to fill these gaps by presenting a conceptual proposal for an orange-peel-recovery route developed from the technical, economic, and environmental-feasibility perspective. It was imagined that the proposed approach could generate four products: D-limonene, pectin, biogas, and electricity. D-limonene is an essential oil used by the pharmaceutical industry (i.e., treatment of tumors, cancer, diabetes, and obesity) [18,19] and by the food (oxidizing agent and flavoring) and chemical (resins and solvents) sectors [9,20,21]. Pectin is a soluble fiber that serves as a sugar, fat substitute, thickening, and stabilizing agent [3,6]. The operations and flows of matter and energy that make up the process were determined by computer simulation using the Aspen Plus tool (version 8.4). Quantitative metrics were applied to estimate the environmental impacts and costs associated with the scheme. Taking the opportunity to propose ways of converting waste from an industrial process into valuable products for human beings should always be encouraged, especially in a scenario of natural-resource scarcity such as that which modern society is likely to face in the medium term. However, these solutions will be useless if they are not economically attractive and do not mitigate environmental impacts. Initiatives such as the one that guided this study are current and innovative precisely because they corroborate this perspective, integrating the technical dimension with two of the essential pillars of sustainability with an equal degree of importance.
2. Materials and Methods
This study presents a conceptual proposal for recovering orange peels by two biorefineries based on available studies concerning technically viable citrus residue-utilization routes. Two scenarios were defined: D-limonene, pectin, and biogas production (case A) and D-limonene, pectin, and energy production (case B). A general flowchart of these integrated processes is presented in Figure 1.
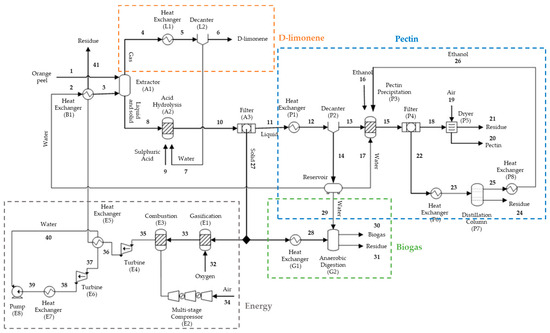
Figure 1.
Conceptual design of the processes proposed in the study.
The first stage consists of steam-extracting the limonene present in orange peels. The steam stream, rich in D-limonene, is condensed and decanted, separating the aqueous phase from the essential oil. The extractor bottom stream containing the solids and liquid is then sent to a hydrolysis step employing diluted sulfuric acid for pectin solubilization. The hydrolysate is then filtered, and the solids are separated. The pectin is subsequently precipitated by an ethanol solution and dried.
The remaining solids from the continuous filtration stage are separated and used as input for biogas or electricity production (cases A and B, respectively). In case A, the solids are used as raw material for biogas production through an anaerobic digestion process, while electricity is produced by the combined cycle in case B. The solids are then used in the gasification step, the produced synthesis gas is taken to combustion, and the exhaust gases are used to make the shaft work in the gas turbine. The heat from the gas stream is used to heat a water stream, producing a high-pressure superheated steam that generates additional energy in a steam turbine.
The equipment and operational conditions of each stage are presented below.
2.1. Computational Simulation
A steady-state simulation was run using the Aspen Plus V. 8.4 software (Aspen Tech, Bedford, MA, USA). Each stage’s equipment and operational conditions are presented in the following sections.
The process flowchart represents the potential orange peel usage routes. Plant sizing was carried out by processing 10% of all orange peels generated in Brazil, resulting in a processed residue flow of 1.0 kg/s. The Non-Random Two-Liquid model (NRTL) was chosen as the thermodynamic model, considering that the system does not contain strong electrolytes (i.e., salts, strong bases, and acids) but does contain polar compounds, including water, cellulose, and free sugars (glucose, fructose, and sucrose), and that the operating conditions are mostly mild.
2.1.1. Components
The raw material comprised orange peels, and the composition indicated in Table 1 was considered, according to Cerón-Salazar and Cardona-Alzate (2011) [15].

Table 1.
Orange peel percentage mass composition. Source: Cerón-Salazar and Cardona-Alzate (2011) [15].
After identifying the process topology and its steps and chains, all components were specified. As lignin, cellulose, and pectin are unavailable in the Aspen library, these fractions were inserted using the “user-defined” option. The National Renewable Energy Laboratory (NREL) database was used to obtain data on physicochemical lignin and cellulose properties [22]. Concerning pectin, the molecular structure of the pectin monomer was designed in the program, and its properties were estimated according to Lopez et al. (2017) [23]. The remaining components listed in Table 1 are available in the Aspen library and were added to the simulation. Hemicellulose was defined as glucose to simplify the simulation.
2.1.2. D-Limonene Production
The first stage comprises the extraction of D-limonene. Water is heated from 25 °C (stream (2)) to 90 °C (3) by gases generated during the energy production. The top flow of the extractor—a limonene-rich vapor (4)—will be cooled until it reaches 80 °C (5). At the same time, the liquid fraction is decanted to separate the essential oil (6) from water (7). Table 2 depicts the operating conditions adopted in each D-limonene processing flowchart step (Figure 1).
Table 2.
D-limonene production simulation data.
2.1.3. Pectin Production
The bottom stream from the separator (8), composed of residual solids and liquids, is hydrolyzed with diluted sulfuric acid (0.5% v/v) at 150 °C to liquefy pectin, cellulose, and hemicellulose (10). Filtering separates the residual solids (27) from the hydrolysate (11) (Figure 1). The liquid stream is cooled until 35 °C to preserve physicochemical pectin properties (12), and the excess water is removed using a decanter. The liquid pectin is precipitated (15) using a 70% (v/v) ethanol solution at 30 °C (16 and 26) and, already in the solid phase, is filtered and dried at room temperature (20). Simultaneously, the decanted liquid is heated at 70 °C (23) and fed into a distillation column to recover the ethanol (25). The operating conditions set to model this process in Aspen Plus are indicated in Table 3.
Table 3.
Pectin production simulation data.
2.1.4. Biogas Production
In biogas synthesis, the solid-containing stream (27) is cooled to room temperature (28) and diluted until it reaches a 25% solid content equivalent (Figure 1). Aerobic digestion was simulated in the Aspen Plus considering four steps. First, the ash present in the orange peel composition is separated from other compounds, and cellulose, hemicellulose, lignin, and solid pectin are decomposed into O2, H2, and C. Equations (1)–(4) describe the acidogenesis, acetogenesis, and methanogenesis reactions that take place during anaerobic digestion, comprising monomer conversion into acetic acid, hydrogen, and carbon dioxide for subsequent methane production [25]. Finally, the biogas is separated from the liquid waste (30).
Table 4 depicts the simulation block models, the respective operating conditions, and the data references employed in each step.
Table 4.
Data concerning the biomethane production simulation.
2.1.5. Energy Production
Energy is generated through a biomass-based integrated gasification combined cycle (BIGCC). This arrangement was simulated based on two processes: (i) solid gasification following hydrolysis, and (ii) converting the gas heat into work through a Rankine cycle (Figure 1). The solids remaining from the continuous filtration (27) are input for the gasification step, which comprises partial thermal biomass oxidation and produces the synthesis gas, a mixture composed of H2, carbon monoxide (CO), methane (CH4), and other light hydrocarbons. Complex chemical reactions occur during the gasification, including rapid pyrolysis, partial pyrolysis product oxidation, coal gasification, and tar and hydrocarbon conversion [28].
Four steps were employed in Aspen Plus to simulate the gasification process. The ash was first separated from other solid components, and cellulose, hemicellulose, lignin, and solid pectin were decomposed into O2, H2, and C. This step’s solids were mixed with the oxygen-containing stream, which acts as a gasifying agent. The mass flow of oxygen (32) was defined as 15% of the total solids from a Sensitivity Analysis tool of Aspen Plus. The main variables (pressure, temperature, density, and concentration) are interdependent in the gasification reactor and vary at each point in the reactor. A stoichiometric thermodynamic equilibrium model was chosen to estimate the synthesis gas composition. For this construction, the following hypotheses were applied: (i) all compounds react under perfect mixing conditions for an infinite period, and (ii) basic gasification reactions (Equations (5)–(13)) were considered [29,30]. The gasifier operating conditions (1100 °C and 20 bar) were also determined based on a Sensitivity Analysis.
An air stream with a mass flow rate 2.88-fold higher than the synthesis gas (34) is compressed to 11.38 bar and proceeds with the synthesis gas to the combustion stage, performed at 1126.85 °C and 20 bar. The exhaust gases (35) produce shaft work in a gas turbine, generating electricity. At this stage, the gaseous stream is still boiling (631.75 °C), with a High Calorific Value of 0.15 MJ kg−1. Therefore, a steam turbine-based combined cycle was integrated into the gasification to take advantage of the residual heat in the flue gas. The energy from the flow leaving the turbine is also recovered to heat the water that acts in the combined cycle (40) and preheat the water that enters the extractor (3). The high-pressure steam formed in the heat exchanger produces additional power in the turbine. During this operation, this fluid is fully condensed at 90 °C in the heat exchanger (39), and its pressure is increased from 2.0 to 33 bar in the pump (40). Liquid water returns to the heat exchanger to be transformed into superheated steam. The operating conditions considered in each step of energy production are listed in Table 5.
Table 5.
Data concerning the energy production simulation.
2.2. Performance Evaluation Metrics
Based on the simulation model results, an environmental and economic performance assessment was carried out to assist in decision-making regarding which citrus residue use process, case A or case B, is more advantageous.
2.2.1. Environmental Metrics
The environmental assessment of the orange peel usage routes was carried out by applying the environmental aspects and impacts spreadsheet proposed by Sanchez (2006) [33]. This comprises a qualitative and quantitative analysis that characterizes and evaluates the effects of the material and energy streams that enter and leave the established orange peel reuse processes, aiming to convert mass and energy balance information into potential environmental effects.
The development of this worksheet was based on the conceptual process flowchart described in Section 2.1.4 and Section 2.1.5. Aspects of inputs and outputs (concentration, outflow, flow, and type of substance) were identified according to the nature of the streams and subdivided into raw materials, utilities, atmospheric emissions, and the generation of liquid effluents.
The second stage of the evaluation consists of quantifying each impact based on the assumption that no form of control is available. Impacts can be manifested in inputs, such as the use of natural resources, and outputs, i.e., air, water, soil, and groundwater contamination. Environmental impacts were evaluated in terms of severity (S), scope (A), and occurrence probability (P) [34,35,36,37], which can then be combined according to Equation (14):
The score intervals 0–4, 5–8, and 9–12 are assigned to the N (negligible), M (moderate), and C (critical) categories, respectively, according to Seiffert (2008) [37].
2.2.2. Economic Metrics
Product sale revenues were used as an economic metric to compare the proposed processes in a preliminary economic assessment. The revenue calculations analyzed the gross revenue of the biorefineries based on estimated annual product sales. The flow rates and compositions of the produced chemicals and the energy flows generated as products were obtained from the simulation model. Assuming that the biorefineries operate 8000 h per year, the revenues for each product were determined based on Equation (15) [16,17]:
where R (USD) is the revenue, Q (kg/h or kW) is the flow, t (h) is the plant operating time, and P (USD/kg, or USD/kWh) is the selling price of the products. Table 6 indicates D-limonene, pectin, biomethane, energy, and animal feed prices and their respective references. The income from animal feed sales (base case) was calculated for comparison purposes.
Table 6.
D-limonene, pectin, biomethane, energy, and animal feed sale prices.
3. Results and Discussion
3.1. D-Limonene
A D-limonene production process flowchart depicting the main energy streams is presented in Figure 2. The water stream is heated with the surplus heat from the combustion gases.
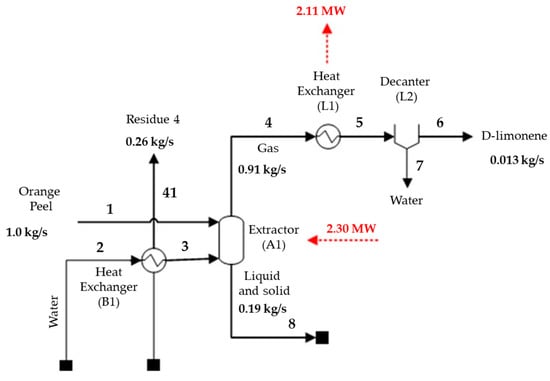
Figure 2.
Main D-limonene production mass and energy streams.
The produced D-limonene is 94.4% pure, similar to the value reported by Cerón-Salazar and Cardona-Alzate (2011) of 94.9% [15]. The simulated yield was 84.3%, higher than the yields obtained by Cerón-Salazar and Cardona-Alzate (2011) and Pourbafrani et al. (2010) [14,15] of 54.8% and 64.6%, respectively. Pourbafrani et al. (2010) [14] extracted D-limonene employing a different method, through a hydrolysis step using diluted sulfuric acid, while Cerón-Salazar and Cardona-Alzate (2011) [15] used steam extraction under the same conditions as those proposed herein plus two more steps, comprising D-limonene dehydration using anhydrous sodium sulfate and filtration. Although the yields obtained in this study and reported by Cerón-Salazar and Cardona-Alzate (2011) [15] differ by 20%, the final D-limonene yields are in the same order of magnitude, of 12.65 g D-limonene/kg orange peel and 8.22 g D-limonene/kg orange peel, respectively.
3.2. Pectin
The main pectin production process mass and energy streams are displayed in Figure 3. The process consumes 4.14 MW and produces 0.79 MW, requiring 3.35 MW of net energy to be used. The most energy-demanding step is hydrolysis, which consumes 85% (3.51 MW) of all supplied energy to maintain a temperature of 150 °C. It is important to note that this step is expected in the processes of pectin, biomethane, and energy.
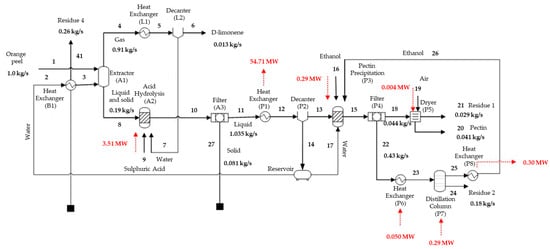
Figure 3.
Main pectin production mass and energy streams.
The obtained pectin yield was 64.8%, like that obtained by Cerón-Salazar and Cardona-Alzate (2011) [15], of 65%, even when using diluted citric acid in the hydrolysis step instead of the one employed in our simulation. A similar pectin purity of 96.5% was obtained to that reported by Pourbafrani et al. (2010) [14] of 95.0%. Although the process simulated herein was developed based on two studies applying different hydrolysis and precipitation stages, their yield and purity values were comparable, validating the proposed model.
3.3. Biomethane
A flowchart of the integrated D-limonene, pectin, and biomethane production biorefinery (case A) is presented in Figure 4. This simulated process demands less energy than the other proposed models, generating 389.87 MW. The biomethane obtained from biogas can also be used as an energy source for the process, reducing the plant’s energy demands by about 40%.
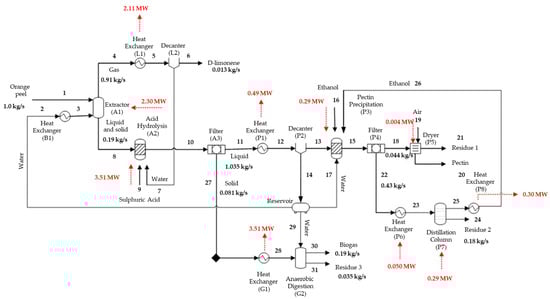
Figure 4.
Main biomethane production mass and energy streams.
The produced biogas yields 0.60 L/g total volatile solids, consistent with the value obtained experimentally by Zema et al. (2018) [26] of 0.46 L/g total volatile solids in a semi-continuous pilot scale reactor. Total volatile solids refer to volatile solids likely to be biotransformed, estimated based on the difference between the total solids introduced into the reactor and the fixed solids remaining following the anaerobic digestion process.
The methane and carbon dioxide present in the biogas comprised 46.21% and 45.91% on a molar basis, respectively. Typical values in biogas range from 50% to 75% methane and 30 to 50% carbon dioxide. Therefore, the biogas composition obtained in the simulation is in agreement with literature values concerning biogas obtained from biomass [25]. The generated energy mass was estimated as 0.47 MW from the biomethane flow rate.
3.4. Energy
A sensitivity analysis was performed for the gasification step to evaluate temperature, pressure, and oxygen-flow effects on synthesis gas composition, specifically on the H2/CO ratio. Figure 5a displays the calculated H2/CO ratio variations according to temperature.
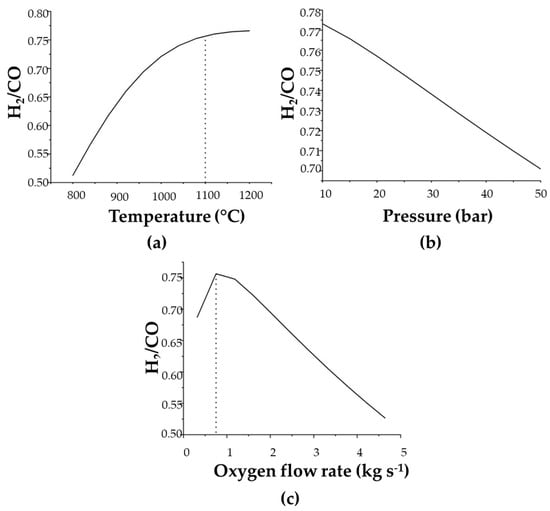
Figure 5.
Sensitivity analysis according to (a) temperature, (b) pressure, and (c) oxygen flow-rate variations in the gasification feed.
The determined H2/CO values stabilize from 1100 °C, with no significant increase. The proposed temperature was, therefore, set at 1100 °C for the gasification step. Dávila et al. (2015), Galvagno et al. (2016), and Prestipino et al. (2017) [16,31,47], however, when studying orange peel gasification, employed a maximum gasification temperature of 800 °C. Although this parameter was different, it is important to note that the material stream introduced into the reactor was also different, as orange peels were used after the D-limonene extraction step and solid hydrolysis employing diluted sulfuric acid in the present simulation. Thus, the employed residue had already lost a significant amount of carbon during the gasification step, unlike the conditions applied by other authors, in which gasification was carried out directly with the orange peels.
Figure 5b depicts pressure H2/CO effects on the obtained gas, which can be used to assess the quality of the generated synthesis gas. The ratio was noted as behaving linearly with increasing pressure. Thus, an 11-bar pressure was chosen as the optimum value for gasification, as it is the same pressure at which the next step (combustion) takes place. The analyzed pressure range begins at 10 bar due to the need to operate the gasification and combustion steps at high pressures, as exhaust gases are used to generate electricity in the gas turbine.
The effects of the oxygen flow rate on the H2/CO ratio of the obtained gas are displayed in Figure 5c. The ratio reaches a maximum value close to a 0.75 flow rate, the same value applied in the simulation. However, the gasification agent employed herein differs from that used in the literature. Galvagno et al. (2016) [47], for example, used air as the gasification agent at an air–residue ratio of 2, while Prestipino et al. (2017) [31] also used air but adopted a 1.25 ratio. The gasification agent considered herein was oxygen, and the optimal O2 and orange peel ratio was set at 0.15.
Although the costs associated with using air as the gasification agent are lower than those of pure oxygen, the synthesis gas produced with air contains more impurities, while using oxygen as a gasification agent has a higher energy-content synthesis gas [48].
The amount of the gasification agent used in the simulation is lower than that applied in other studies [31,47] but similar when compared to the gasification process for coal containing high or low ash contents, for example, of 0.5 and 0.9, respectively, as applied by Arabkhalaj et al. (2015) [32] when using air as a gasifying agent. Figure 5 indicates that increasing oxygen levels lead to reduced H2/CO ratios, demonstrating favorable residue combustion compared to gasification under higher O2 availability conditions.
The synthesis gas and combustion-stage gas compositions are listed in Table 7.
Table 7.
Synthesis gas and combustion-stage gas composition.
The synthesis gas obtained in our simulation is similar to that reported by Solarte-Toro et al. (2018) [48]. According to these authors, the synthesis gas from biomass gasification contains lower hydrogen contents than carbon monoxide, with a H2/CO molar ratio typically between 0.5 and 0.73, and CH4 and CO2 percentages representing about 2.5% and 10% of the gas composition, respectively. The H2/CO value obtained herein was 0.76, close to the expected maximum (0.73) for synthesis gases obtained from biomass. The synthesis gas heating value (12.13 MJ/Nm³) was also within the desired range from 12 to 28 MJ/Nm3 [48].
Figure 6 presents a flowchart for the biorefinery capable of simultaneously producing D-limonene, pectin, and energy (case B). The combustion gas gives a pressure of 11 bar, a temperature of 1126 °C, and an HHV of 0.15 MJ/kg, used to produce shaft work in the turbine following combustion. A total energy of 0.17 MW is generated in this stage. After this process, the exhaust gas is maintained at 1.74 bar and 631.75 °C. Due to the high temperature of this stream, the water that participates in the combined cycle is first preheated and then heated from 90 °C to 550 °C, reducing the gas temperature to 102.33 °C.
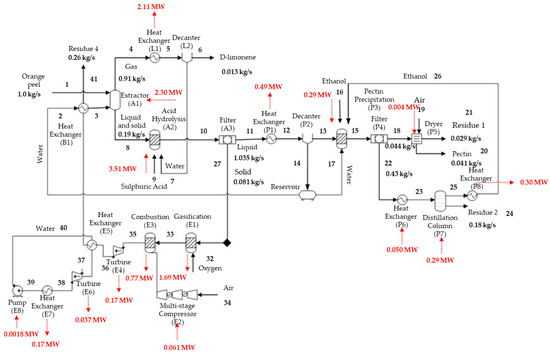
Figure 6.
Main mass and energy streams obtained during energy production.
The second turbine uses the saturated steam, producing 0.04 MW of additional electrical energy.
3.5. Environmental Assessment
The main purpose of this preliminary environmental assessment was to examine the future consequences of proposed actions. According to the results presented in Table 8, production impacts were noted in the following decreasing order: pectin, energy, biomethane, and D-limonene. Thus, the least environmentally favorable route is pectin production. In general, utility and raw material consumption alter the conditions of physical and biotic environments and may contaminate soil and aquatic environments. However, the most critical aspect is the generated liquid effluent, composed of sulfuric acid, cellulose, hemicellulose, pectin, and untreated D-limonene.
Table 8.
Aspects and impacts concerning D-limonene, pectin, energy, and biomethane production processes.
Dávila et al. (2015) [16] presented a similar situation in which a liquid residue formed by ethanol, citric acid, cellulose, hemicellulose, pectin, and ash cannot be reused in the hydrolysis step and must be discarded, generating further significant environmental impacts. Although pectin production impacts were higher, ethanol recycling was incorporated into the process, leading to a 99% ethanol consumption reduction, minimizing the effects of pectin production. Concerning the aspects and impacts spreadsheet, the hydrolysis step is accounted for only in the pectin production process, as this is a common step in energy and biomethane production.
Electricity production through a combined cycle with integrated biomass gasification (BIGCC) was the second route most likely to generate environmental impacts. The gasification step releases high amounts of CO2 and CO, contributing to global warming. According to Dávila et al. (2015) [16], it is preferable not to generate electricity from orange peels, reducing the biorefinery for the integrated production of pectin, p-cumene, and hydrogen. Negro et al. (2017) [27] carried out a Life-Cycle Assessment (LCA) for ten orange peel processing methods, including electricity generation, reporting that the high amount of required energy and the share of released gases that contribute to global warming negatively impact the environmental sustainability of these processes.
Biomethane production was proven to be more environmentally viable than the electricity generation route, both of which use solids originating from hydrolysis as an input. This finding is consistent with the literature, which points out that anaerobic digestion is usually environmentally preferable to thermochemical routes due to lower global warming contributions [12,16]. It is also important to note that biomethane can be used as an energy source for the process. This alternative, in addition to minimizing the plant’s energy consumption, converts biomethane into energy and ensures the non-emission of this gas into the atmosphere, minimizing environmental impact concerning the greenhouse effect [49]. Therefore, D-limonene production comprised the most environmentally friendly route, mainly due to the absence of chemical consumption and no effluent generation.
The animal feed production aspects and respective environmental impacts were preliminarily and qualitatively estimated, as no data regarding the inputs and outputs of this process are available.
Animal feed production comprises four stages: grinding, pressing, drying, and pelletizing [50]. Energy is consumed during the first two stages, while air is consumed during drying, generating greenhouse gases. The aspects thus comprise energy consumption, air, and greenhouse gas emissions, which lead to physical and biotic environmental alterations and global warming, respectively. Table 8 shows that the potential environmental impacts produced in the animal feed route are more significant than those obtained in D-limonene production and equal to those generated in the biomethane route.
3.6. Economic Assessment
A preliminary economic analysis was carried out based on estimates concerning the revenues generated by D-limonene, pectin, biomethane, and energy sales employing available market prices. The revenues were then compared to the probable revenue from the animal feed sales, the traditional orange peel destination route (Table 9).
Table 9.
Estimates of the revenues achieved from D-limonene, pectin, biomethane, energy, and animal feed sales and their environmental and economic production consequences.
As discussed previously, two biorefineries (cases A and B) were proposed for comparison to the traditional animal feed production route (base case). Regardless of the scenario, the generated revenue was at least 3320-fold higher than feed sales.
As depicted in Table 9, the estimated annual feed sale revenue was USD 106.9 million, while the biomethane and energy biorefineries (cases A and B) generated USD 3225.9 million and USD 3233.2 million, respectively. One of the main reasons for this difference concerns the selling price of each product: while animal feed is sold for 0.11 USD/kg, quoted prices for D-limonene, pectin, biomethane, and electricity are 15 USD/kg, 21 USD/kg, 0.07 USD/kWh, and 0.19 USD/kWh, respectively [38,39,40,41,42,43,44,45,46].
Herein, pectin generated the most revenue. Dávila et al. (2015) [16] calculated the total profit margin for the integrated production of pectin, p-cumene, hydrogen, and electricity. They concluded that the pectin production route, in addition to being technically viable, also presents the highest profit margin.
The biomethane and electricity production routes produced the lowest revenues, consistent with Dávila et al. (2015) [16], who do not recommend electricity production, as gasification plants increase capital costs, making electricity generation economically unfeasible. Lohrasbi et al. (2010) [17], in turn, when analyzing the capital costs for ethanol, biogas, pectin, and D-limonene productions, indicate that the fixed capital investment in biomethane production presents the most significant contribution, reaching 31% of the total capital.
The preliminary economic evaluation based on revenues demonstrates that some products obtained from orange juice residues have more significant revenue potential than conventional animal feed production. The proposed biorefineries comprise suggestions for integrated production, complementing the existing literature and allowing other approaches to be defined from the proposed multi-product systems. Table 9 also presents the environmental and economic analysis results for D-limonene, pectin, biomethane, and electricity and animal feed production.
In this regard, none of the orange peel processing routes can achieve the best financial performance and the lowest environmental impacts. Pectin, followed by D-limonene, is the most attractive product in economic terms. The income from animal feed sales was higher than that of biomethane and electricity. However, this scenario uses the total orange peel flow (1.00 kg/s) for animal feed production. At the same time, biomethane and electricity are produced from the remaining solids following a hydrolysis step, corresponding to 0.08 kg/s. According to Negro et al. (2017) [27], the orange peel dehydration step requires a significant amount of energy, around 1.70 MJ/kg, which makes the process more expensive, compromising its economic viability.
Regarding environmental viability, D-limonene generated the most negligible impacts, followed by animal feed, biomethane, electricity, and pectin. The animal feed production route appears more environmentally viable than the other proposed processes. However, it is important to note that only the input stream of the orange peels was quantified in the aspects and impacts table (Table 9), omitting the use of electrical energy consumed by the hammer mill, hydraulic press, dryer, and pelletizer. In addition, the consumed air and gas eliminated in the drying step were not quantified. Thus, it is reasonable to assume that animal feed has more significant environmental impacts than other processing routes, such as biomethane production.
The literature also indicates challenges for commercializing the produced animal feed due to its characteristic bitterness, which is unattractive to ruminants. In addition, low protein content requires the addition of dietary protein to supply nutritional deficiencies, as highlighted by Caparra et al. (2007) and Feedipedia (2019) [51,52].
4. Conclusions and Recommendations
An integrated simulation model concerning citrus residue reuse (orange peels) was developed, identifying the stream compositions, energy consumption, and generation involved in the D-limonene, pectin, biomethane, and electric energy production routes. The revenue potential from the sale of these products and the environmental impacts associated with each process route were estimated considering the severity, scope, and probability of occurrence of impacts.
The results indicate pectin production as the route with the more significant financial return and the greatest environmental impact. D-limonene is more attractive in terms of combining the two aspects: it generates the second-highest revenue and has the lowest environmental impact among the five products analyzed. These preliminary results identified that if 10% of all orange waste generated in Brazil is upgraded to value-added products, pectin would generate revenue of USD 2776 million per year, and D-limonene would generate USD 643.7 million. Regarding environmental impact, pectin was the most harmful, around seven times worse than D-limonene, which has the most negligible impact.
Although only a preliminary economic evaluation was carried out with suboptimal process topologies, this study underlines the technical and economic potential of using abundant and available waste in a consolidated agro-industrial sector in Brazil.
To expand the study, improve the employed methodologies, and mitigate the technical, environmental, and economic uncertainties of the proposed processes, we suggest estimating the capital and operating costs of each process, also covering complementary steps employed in the base process, such as an atmospheric gas separation plant to obtain the oxygen used in the gasification stage, the use of economic indicators to capture the effect of a lifetime of processes, such as the Net Present Value (NPV), and the use of systemic environmental assessment methodologies, such as the Life-Cycle Assessment (LCA), to include the environmental impacts of the entire waste-generation chain and final-product uses in the analysis.
Author Contributions
Conceptualization, L.L.S. and M.T.d.S.; methodology, L.L.S. and C.E.T.; software, L.L.S.; validation, L.L.S., I.L.C.C., and M.T.d.S.; formal analysis, L.L.S. and M.T.d.S.; investigation, L.L.S.; resources, M.T.d.S.; data curation, L.L.S. and I.L.C.C.; writing—original draft preparation, L.L.S. and I.L.C.C.; writing—review and editing, I.L.C.C., L.K., and M.T.d.S.; visualization, I.L.C.C., L.K., and M.T.d.S.; supervision, M.T.d.S.; project administration, M.T.d.S.; funding acquisition, M.T.d.S. All authors have read and agreed to the published version of the manuscript.
Funding
This research was funded by Coordenação de Aperfeiçoamento de Pessoal de Nível Superior-Brazil (CAPES)—Finance Code 001, grant number 3300201/2017, and New Talents Program at the Institute for Technological Research (IPT), the São Paulo Research Foundation (FAPESP), project 2022/02809-0.
Institutional Review Board Statement
Not applicable.
Informed Consent Statement
Not applicable.
Data Availability Statement
Not applicable.
Acknowledgments
The authors thank the financial support from the São Paulo Research Foundation (FAPESP) project number 2022/02809-0.
Conflicts of Interest
The authors declare no conflict of interest.
References
- USDA. Available online: https://downloads.usda.library.cornell.edu/usda-esmis/files/w66343603/8910m906m/f4754035x/citrus.pdf (accessed on 4 August 2023).
- CITRUSBR. Available online: https://www.facebook.com/CitrusBR/photos/3650681681696116 (accessed on 27 July 2023).
- John, I.; Muthukumar, K.; Arunagiri, A. A review on the potential of citrus waste for D-Limonene, pectin, and bioethanol production. Int. J. Green Energy 2017, 14, 599–612. [Google Scholar] [CrossRef]
- Putnik, P.; Kovačević, D.B.; Jambrak, A.R.; Barba, F.J.; Cravotto, G.; Binello, A.; Lorenzo, J.M.; Shpigelman, A. Innovative “Green” and Novel Strategies for the Extraction of Bioactive Added Value Compounds from Citrus Wastes—A Review. Molecules 2017, 22, 680. [Google Scholar] [CrossRef] [PubMed]
- Satari, B.; Karimi, K. Citrus processing wastes: Environmental impacts, recent advances, and future perspectives in total valorization. Resour. Conserv. Recycl. 2018, 129, 153–167. [Google Scholar] [CrossRef]
- Ángel Siles López, J.; Li, Q.; Thompson, I.P. Biorefinery of waste orange peel. Crit. Rev. Biotechnol. 2010, 30, 63–69. [Google Scholar] [CrossRef] [PubMed]
- Negro, V.; Mancini, G.; Ruggeri, B.; Fino, D. Citrus waste as feedstock for bio-based products recovery: Review on limonene case study and energy valorization. Bioresour. Technol. 2016, 214, 806–815. [Google Scholar] [CrossRef] [PubMed]
- Volpe, M.; Panno, D.; Volpe, R.; Messineo, A. Upgrade of citrus waste as a biofuel via slow pyrolysis. J. Anal. Appl. Pyrolysis 2015, 115, 66–76. [Google Scholar] [CrossRef]
- Boukroufa, M.; Boutekedjiret, C.; Petigny, L.; Rakotomanomana, N.; Chemat, F. Bio-refinery of orange peels waste: A new concept based on integrated green and solvent free extraction processes using ultrasound and microwave techniques to obtain essential oil, polyphenols and pectin. Ultrason. Sonochem. 2015, 24, 72–79. [Google Scholar] [CrossRef] [PubMed]
- Sharma, K.; Mahato, N.; Cho, M.H.; Lee, Y.R. Converting citrus wastes into value-added products: Economic and environmently friendly approaches. Nutrition 2017, 34, 29–46. [Google Scholar] [CrossRef]
- Ferreira-Leitão, V.; Gottschalk, L.M.F.; Ferrara, M.A.; Nepomuceno, A.L.; Molinari, H.B.C.; Bon, E.P.S. Biomass Residues in Brazil: Availability and Potential Uses. Waste Biomass-Valorization 2010, 1, 65–76. [Google Scholar] [CrossRef]
- Pourbafrani, M.; McKechnie, J.; MacLean, H.L.; Saville, B.A. Life cycle greenhouse gas impacts of ethanol, biomethane and limonene production from citrus waste. Environ. Res. Lett. 2013, 8, 015007. [Google Scholar] [CrossRef]
- Baht, R. Sustainability challenges in the valorization of agri-food wastes and by-products. In Valorization of Agri-Food Wastes and By-Products: Recent Trends, Innovations and Sustainability Challenges; Bhat, R., Ed.; Academic Press: London, UK, 2021; pp. 1–27. [Google Scholar] [CrossRef]
- Pourbafrani, M.; Forgács, G.; Horváth, I.S.; Niklasson, C.; Taherzadeh, M.J. Production of biofuels, limonene and pectin from citrus wastes. Bioresour. Technol. 2010, 101, 4246–4250. [Google Scholar] [CrossRef]
- Cerón-Salazar, I.; Cardona-Alzate, C. Evaluación del proceso integral para la obtención de aceite esencial y pectina a partir de la cáscara de naranja. Ing. Cienc. 2011, 7, 65–86. [Google Scholar]
- Dávila, J.A.; Rosenberg, M.; Cardona, C.A. Techno-economic and Environmental Assessment of p-Cymene and Pectin Production from Orange Peel. Waste Biomass-Valorization 2015, 6, 253–261. [Google Scholar] [CrossRef]
- Lohrasbi, M.; Pourbafrani, M.; Niklasson, C.; Taherzadeh, M.J. Process design and economic analysis of a citrus waste biorefinery with biofuels and limonene as products. Bioresour. Technol. 2010, 101, 7382–7388. [Google Scholar] [CrossRef]
- Murali, R.; Karthikeyan, A.; Saravanan, R. Protective Effects ofd-Limonene on Lipid Peroxidation and Antioxidant Enzymes in Streptozotocin-Induced Diabetic Rats. Basic Clin. Pharmacol. Toxicol. 2012, 112, 175–181. [Google Scholar] [CrossRef]
- Tan, X.; Chua, K.; Ram, M.R.; Kuppusamy, U. Monoterpenes: Novel insights into their biological effects and roles on glucose uptake and lipid metabolism in 3T3-L1 adipocytes. Food Chem. 2016, 196, 242–250. [Google Scholar] [CrossRef]
- Viuda-Martos, M.; Ruiz-Navajas, Y.; Fernández-López, J.; Pérez-Álvarez, J.A. Chemical Composition of Mandarin (C. reticulata L.), Grapefruit (C. paradisi L.), Lemon (C. limon L.) and Orange (C. sinensis L.) Essential Oils. J. Essent. Oil Bear. Plants 2009, 12, 236–243. [Google Scholar] [CrossRef]
- Pfaltzgraff, L.A. The Study and Development of an Integrated and Additive-Free Waste Orange Peel Biorefinery. Ph.D. Thesis, University of York, York, UK, 2014. [Google Scholar]
- Wooley, R.J.; Putsche, V. Technical Report: Development of an ASPEN PLUS Physical Property Database for Biofuels Components. Available online: https://www.nrel.gov/docs/legosti/old/20685.pdf (accessed on 22 October 2018).
- Marsiglia-Lopez, D.; Ramirez-Uribe, M.; Gonzalez-Delgado, A.; Ojeda-Delgado, K.; Sanchez-Tuiran, E. Computer-aided economic evaluation of pectin extraction from cocoa pod husk (Theobroma cacao L.). Contemp. Eng. Sci. 2017, 10, 1493–1500. [Google Scholar] [CrossRef]
- Casas-Orozco, D.; Villa, A.L.; Bustamante, F.; González, L.-M. Process development and simulation of pectin extraction from orange peels. Food Bioprod. Process. 2015, 96, 86–98. [Google Scholar] [CrossRef]
- Al-Rubaye, H.; Karambelkar, S.; Shivashankaraiah, M.M.; Smith, J.D. Process Simulation of Two-Stage Anaerobic Digestion for Methane Production. Biofuels 2017, 10, 181–191. [Google Scholar] [CrossRef]
- Zema, D.A.; Fòlino, A.; Zappia, G.; Calabrò, P.S.; Tamburino, V.; Zimbone, S.M. Anaerobic digestion of orange peel in a semi-continuous pilot plant: An environmentally sound way of citrus waste management in agro-ecosystems. Sci. Total. Environ. 2018, 630, 401–408. [Google Scholar] [CrossRef]
- Negro, V.; Ruggeri, B.; Fino, D.; Tonini, D. Life cycle assessment of orange peel waste management. Resour. Conserv. Recycl. 2017, 127, 148–158. [Google Scholar] [CrossRef]
- Puig-Arnavat, M.; Bruno, J.C.; Coronas, A. Review and analysis of biomass gasification models. Renew. Sustain. Energy Rev. 2010, 14, 2841–2851. [Google Scholar] [CrossRef]
- Baruah, D. Modeling of biomass gasification: A review. Renew. Sustain. Energy Rev. 2014, 39, 806–815. [Google Scholar] [CrossRef]
- Darmawan, A.; Hardi, F.; Yoshikawa, K.; Aziz, M.; Tokimatsu, K. Enhanced Process Integration of Entrained Flow Gasification and Combined Cycle: Modeling and Simulation Using Aspen Plus. Energy Procedia 2017, 105, 303–308. [Google Scholar] [CrossRef]
- Prestipino, M.; Chiodo, V.; Maisano, S.; Zafarana, G.; Urbani, F.; Galvagno, A. Hydrogen rich syngas production by air-steam gasification of citrus peel residues from citrus juice manufacturing: Experimental and simulation activities. Int. J. Hydrogen Energy 2017, 42, 26816–26827. [Google Scholar] [CrossRef]
- Arabkhalaj, A.; Ghassemi, H.; Markadeh, R.S. Thermodynamic evaluation of integrated gasification combined cycle: Comparison between high-ash and low-ash coals. Int. J. Energy Res. 2016, 40, 1638–1651. [Google Scholar] [CrossRef]
- Sánchez, L.E. Avaliação de Impacto Ambiental: Conceitos e Métodos, 3rd ed.; Oficina de Textos: São Paulo, Brazil, 2006. [Google Scholar]
- Salami, S.C.S. Avaliação dos Aspectos e Impactos Ambientais dos Laboratórios da Universidade Tecnológica Federal do Paraná, Campus Campo Mourão, Como Ferramenta para a Elaboração de um Modelo de Sistema de Gestão. Bachelor’s Thesis, Universidade Tecnológica Federal do Paraná, Campo Mourão, Brazil, 2013. [Google Scholar]
- Oliveira, J.M.d.S.M.; Silva, R.G. Aspectos e Impactos Ambientais de um Laboratório de Biologia. HOLOS 2016, 8, 368. [Google Scholar] [CrossRef][Green Version]
- Potrich, A.L.; Teixeira, C.E.; Finotti, A.R. Avaliação de impactos ambientais como ferramenta de gestão ambiental aplicada aos resíduos sólidos do setor de pintura de uma indústria automotiva. Estud. Tecnol. Eng. 2007, 3, 162–175. [Google Scholar]
- Seiffert, M.E.B. Environmental impact evaluation using a cooperative model for implementing EMS (ISO 14001) in small and medium-sized enterprises. J. Clean. Prod. 2008, 16, 1447–1461. [Google Scholar] [CrossRef]
- Ultra International B.V. Available online: https://ultranl.com/products/orange-oil-brazil/ (accessed on 29 July 2019).
- Aliba. Available online: https://portuguese.alibaba.com/g/orange-d-limonene.html?src=sem_ggl&cmpgn=236969195&adgrp=19537176635&fditm=&tgt=dsa-19959388920&locintrst=&locphyscl=1001773&mtchtyp=b&ntwrk=g&device=c&dvcmdl=&creative=160710790250&plcmnt=&plcmntcat=&p1=&p2=&aceid=&positi (accessed on 29 July 2019).
- Pharmacompass. Available online: https://www.pharmacompass.com/price/pectin (accessed on 29 July 2019).
- Chembid. Available online: https://www.chembid.com/en/results/3/?q=pectin&filterCurrency=usd (accessed on 29 July 2019).
- Alibaba. Available online: https://www.alibaba.com/showroom/pectin+price+1kg.html?fsb=y&IndexArea=product_en&CatId=&SearchText=pectin+price+1kg&isGalleryList=G (accessed on 29 July 2019).
- Globalpetrolprices. Brazil Electricity Prices. Available online: https://www.globalpetrolprices.com/Brazil/electricity_prices/ (accessed on 29 July 2019).
- Milanez, A.Y.; Guimarães, D.D.; Maia, G.B.S.; Souza, J.A.P.; Lemos, M.L.F. Biogás de resíduos agroindustriais: Panorama e perspectivas. BNDES Setorial 2018, 47, 221–276. [Google Scholar]
- Cutrale. Available online: https://www.cutrale.com.br/farelo.xhtml (accessed on 29 July 2019).
- MFRural. Available online: https://www.mfrural.com.br/produtos/2-182/nutricao-animal-polpa-citrica (accessed on 29 July 2019).
- Galvagno, A.; Prestipino, M.; Zafarana, G.; Chiodo, V. Analysis of an Integrated Agro-waste Gasification and 120kW SOFC CHP System: Modeling and Experimental Investigation. Energy Procedia 2016, 101, 528–535. [Google Scholar] [CrossRef]
- Solarte-Toro, J.C.; Chacón-Pérez, Y.; Cardona-Alzate, C.A. Evaluation of biogas and syngas as energy vectors for heat and power generation using lignocellulosic biomass as raw material. Electron. J. Biotechnol. 2018, 33, 52–62. [Google Scholar] [CrossRef]
- The Oxford Institute for Energy Studies. Available online: https://www.oxfordenergy.org/publications/biogas-significant-contribution-decarbonising-gas-markets/ (accessed on 29 July 2019).
- Tetra Pak. Available online: https://orangebook.tetrapak.com/chapter/fruit-processing (accessed on 22 October 2018).
- Caparra, P.; Foti, F.; Scerra, M.; Sinatra, M.; Scerra, V. Solar-dried citrus pulp as an alternative energy source in lamb diets: Effects on growth and carcass and meat quality. Small Rumin. Res. 2007, 68, 303–311. [Google Scholar] [CrossRef]
- Feedipedia. Available online: https://www.feedipedia.org/search/node/orange (accessed on 8 August 2019).
Disclaimer/Publisher’s Note: The statements, opinions and data contained in all publications are solely those of the individual author(s) and contributor(s) and not of MDPI and/or the editor(s). MDPI and/or the editor(s) disclaim responsibility for any injury to people or property resulting from any ideas, methods, instructions or products referred to in the content. |
© 2023 by the authors. Licensee MDPI, Basel, Switzerland. This article is an open access article distributed under the terms and conditions of the Creative Commons Attribution (CC BY) license (https://creativecommons.org/licenses/by/4.0/).