Article

Heterogeneity Analysis of Industrial Structure Upgrading on Eco-Environmental Quality from a Spatial Perspective: Evidence from 11 Coastal Provinces in China

1
School of Economics and Management, Shanghai Ocean University, Shanghai 201306, China
2
School of International Economics and International Relations, Liaoning University, Shenyang 110036, China
*
Author to whom correspondence should be addressed.
Sustainability 2023, 15(21), 15236; https://doi.org/10.3390/su152115236
Submission received: 21 July 2023 / Revised: 14 October 2023 / Accepted: 17 October 2023 / Published: 25 October 2023

Abstract

:
Upgrading the industrial structure and improving the quality of the ecological environment are important strategic steps to realize the modernization of China. Based on the panel data of 11 provinces (municipalities) in China’s coastal areas from 2010 to 2019, this paper uses the spatial Dubin model and the threshold effect model to study the impact of industrial structure upgrading on eco-environmental quality. The results show that the influence of industrial structure upgrading on ecological environment quality has a positive “U”-shaped distribution. Based on the spatial econometric model, it is found that the rationalization of industrial structure and the optimization of industrial structure have spatial spillover effects on the ecological environment quality, and the influence of the rationalization of industrial structure and the optimization of industrial structure on the ecological environment quality of the surrounding area is positive “U”-shaped and inverted “U”-shaped, respectively. Based on the threshold model, it is found that industrial structure rationalization has a small effect on the ecological environment’s quality when the degree of scientific and technological innovation is low. When scientific and technological innovation reaches a certain threshold, industrial structure rationalization has a significant effect on the quality of the ecological environment. In addition, from a regional perspective, the influence of industrial structure rationalization in the East China Sea and the South China Sea and industrial optimization in the Bohai-Yellow Seas on the eco-environmental quality of the surrounding areas has a positive “U”-shaped distribution, while the influence of the optimization of industrial structure in the South China Sea on the eco-environmental quality of the surrounding areas has an inverted “U”-shaped curve on the left side.

1. Introduction

The United Nations Environment Conference in 2012 marked the beginning of an era that elevated environmental issues to the same level of importance as peace, poverty, health, and security. The Fifth United Nations Environment Conference held in 2022 highlighted the key role of natural ecology in achieving the Sustainable Development Goals, and ecological and environmental issues were once again recognized as key global issues. As a key factor affecting the quality of the ecological environment, industrial structure changes have a trackable impact on the ecological environment. During the Industrial Revolution, when heavy industry was the main industry, developed countries such as the United Kingdom, the United States, Germany, and Japan had environmental pollution problems one after another, such as haze weather caused by a large amount of soot pollution and aquatic life poisoning and death caused by river pollution. However, with the further adjustment of economic development and industrial structure, the environmental problems of the developed countries were partially solved.
According to the Petty–Clark law of industrial structure upgrading, the general law can be summarized according to the distribution of the employed population in the three industries; that is, with economic development and the improvement of people’s national income, the labor force will gradually transfer to higher industries [1,2]. Then, based on this theory, American economist Simon Smith Kuznets further studied the industrial structure theory based on the trend of labor transfer and proposed that under the premise of continuous growth of national income, the evolution trend of industrial structure would eventually transform the industrial structure into a pattern of “tertiary industry—secondary industry—primary industry” and drew the “Environmental Kuznets Curve” (EKC). He believes that when the level of economic development of a country is low, the degree of environmental pollution is relatively light, but with the increase in per capita income, environmental pollution goes from low to high, and the degree of environmental deterioration is aggravated with economic growth. When economic development reaches a certain level, that is to say, a critical point or “turning point”, with further increase in per capita income, environmental pollution turns from high to low, the degree of environmental pollution gradually slows down, and environmental quality gradually improves [3,4,5,6].
At present, China’s economic development has shifted from the stage of high-speed development to the stage of high-quality development, with the GDP growth rate adjusted from 14.2% in 2007 to 3% in 2022. Economic development places more emphasis on quality development, and industrial structure upgrading is an important way to achieve high-quality economic growth [7,8]. The upgrading of industrial structure not only refers to the transformation of industrial structure from primary industry to secondary industry and then to tertiary industry but also measures the upgrading quality of the industrial structure by analyzing the rationalization and the optimization of industrial structure. The rationalization of industrial structure here refers to the fact that the industrial structure in each period of economic development fits the comparative advantage of the region, avoids or reduces distortion, promotes the coordinated development of industries, and obtains the maximum competitive advantage and economic surplus. On one hand, it reflects the degree of coordination among industries; on the other hand, it should also reflect the degree of effective utilization of resources [1,9]. The upgrading of industrial structure shows that, on the continuous spectrum of economic development, various subjects promote the upgrading of factor endowment structure through the reinvestment of economic surplus. And based on the upgrading of factor endowment, the upgrading of industrial structure is promoted according to the situation.
The rationalization and optimization of industrial structures have different impacts on the environment. The rationalization of industrial structure achieves reasonable allocation and dynamic equilibrium through the flow of production factors between industries and the interaction between different industries. Make the industrial structure in a relatively reasonable state of adjustment. And when the industrial structure adjustment direction gradually gets close to clean industry, it will significantly improve the ecological environment. On one hand, the influence of industrial structure upgrading on ecological environment quality is manifested by the transition from labor-intensive industries to capital-intensive industries and finally to technology-intensive industries; on the other hand, it is manifested in the transfer process of the industry itself to high value-added, high technology, high intensification, and high processing, both of which can reduce the degree of environmental pollution.
At present, a large number of studies have confirmed the existence of the “Environment Kuznets Curve” between economic development and the environment in China, but there are still insufficient studies on the non-linear relationship between industrial structure upgrading and the ecological environment. As a region of rapid economic development, the study of ecological and environmental problems in coastal areas (coastal areas in this paper refer to areas with coastline, including mainland coastline and island coastline. Coastal areas in Chinese Mainland include 11 provincial administrative units, namely Liaoning Province, Hebei Province, Tianjin City, Shandong Province; Jiangsu Province, Shanghai City, Zhejiang Province, Fujian Province; Guangdong Province, Guangxi Province, and Hainan Province) helps to clarify the relationship between the economy and the environment. And coastal areas have been studied as an independent research sample. For example: in Sanzida Murshed’s sensitivity survey on climate hazards in the coastal zone of Bangladesh, the area with coastline was taken as the coastal zone of Bangladesh and divided into the western, central, and eastern coasts [10]. And Emilio Laino used 10 European coastal cities (Sligo, Dublin, Vilanova i la Geltrú, Benidorm, Oarsoaldea, Oeiras, Massa, Piran, Gdańsk, Samsun) as a research sample to study extreme climate change hazards and the impacts on European coastal cities [11]. At the same time, the coastal areas are the representative areas of China’s rapid economic development. With its advantages of geographical location and innate natural endowments, the industrial structure is rapidly adjusted in the process of reform and opening up. The analysis of the relationship between industrial structure and ecological environment in this region can provide experience for the improvement of ecological environments in other regions of China and provide a good model for coastal developing countries around the world. Therefore, 11 provinces and cities in coastal areas of China were taken as research samples to analyze the spatial spillover effect of industrial structure upgrading on ecological environment quality through the spatial Dubin model. According to their adjacent sea areas, the provinces were divided into the Bohai-Yellow Sea, East China Sea, and South China Sea to analyze the regional heterogeneity of the impact of industrial structure upgrading on eco-environmental quality. At the same time, based on the threshold effect model, the non-linear influence of industrial structure rationalization and industrial structure optimization on ecological environment quality is analyzed when technological innovation is taken as the threshold variable.
The contributions of this paper are as follows: (1) evaluate the eco-environmental quality index of 11 provinces and cities in coastal areas and comprehensively analyze the impact of industrial structure upgrading on eco-environmental quality; (2) it is more persuasive to use the rationalization and optimization of industrial structure as indicators to measure industrial structure upgrading; (3) the spatial Dubin model analysis was used to consider the spatial spillover effect, which improved the accuracy of the impact of industrial structure upgrading on ecological environment quality; (4) taking scientific and technological innovation as the threshold variable, the non-linear influence between industrial structure upgrading and ecological environmental quality can be studied more comprehensively.
This article is divided into the following parts: Section 1 introduces China’s industrial structure and ecological environment background. Section 2 introduces a literature review of the relationship between industrial structure upgrading and the ecological environment. Section 3 provides the methods and data, the application conditions of SDM, and the threshold model. Section 4 describes the relevant empirical analysis and further discusses the impact of industrial structure upgrading on ecological environment quality and the effect of technological innovation as the threshold variable on the relationship between them. Section 5 summarizes the main conclusions and policy implications of this study.

2. Literature Review

At present, the research on the relationship between industrial structure and the ecological environment is mainly divided into two aspects: considering the spatial spillover effect and not considering the spatial spillover effect.
In the study without considering the spatial spielen effect, the impact of industrial structure upgrading on the ecological environment is mainly manifested as follows:
In the early stages of economic development, the industrial structure is dominated by labor-intensive industries such as textiles, clothing, food and beverage, and other light industries, which produce a low degree of pollution. After a certain amount of accumulation, the heavy chemical industry, which represents the most intensive production, begins to develop rapidly. The most representative industries are the chemical industry, the petroleum industry, and the manufacturing industry. With the development of these industries, fossil energy is used as the raw material, and environmental pollution becomes more and more serious [4,12]. Finally, with the improvement of scientific and technological levels, new materials, new energy, new technology, and other scientific and technological innovation achievements are applied to the production, manufacturing, and consumption of products. This not only provides a driving force for the upgrading of the industrial structure but also promotes industrial transformation [13].
With the deepening and development of science and technological innovation, the development of high-end secondary and tertiary industries will be promoted. This kind of industry is mainly a high-value-added service industry and has the characteristics of low energy consumption and less pollution. Although the tangible products produced in the service have a negative impact on the ecological environment compared with the secondary industry, the ecological environment is still improved. At the same time, scientific and technological innovation reduces the dependence of traditional production development modes on resources and the environment by promoting the innovation of production technology and forming the front-end prevention of ecological and environmental pollution [14,15,16,17]. In addition, technical support for the restoration and improvement of the ecological environment is provided through the promotion of the use of environmentally friendly technologies and equipment to provide end-of-pipe management of polluting discharges and gradually alleviate the pressure of environmental problems [18,19]. Moreover, technological progress in the production process can not only promote economic growth but also deeply affect the relationship between people and the ecological environment [20].
Scholars have conducted empirical studies from the perspectives of water pollution [21,22], industrial waste emissions [23], carbon dioxide emissions [24,25,26], energy consumption [27], and air pollution emission efficiency [28] and found that industrial structure optimization has a significant improvement effect on pollutant emission reduction. At the same time, some scholars have verified the non-linear relationship between industrial structure upgrading and ecological environment quality. With the increase in the proportion of secondary industry, Wei (2020) and Wang (2021) showed that there was a non-linear relationship between industrial structure upgrading and carbon dioxide emission through the analysis of the PTR (panel threshold regression) model and that it changed with time to varying degrees [29,30]. Zhang (2010) made a quantitative evaluation of the overall ecological impact of the change in industrial structure in Chongqing from 1997 to 2008, and the results showed that since the establishment of Chongqing in 1997, the industrial structure of Chongqing has experienced two significant changes, and IEIMIS (integrated eco-environmental influence modulus of industrial structure) showed an approximate “U”-shaped curve, which first decreased and then increased and fluctuated within a certain range [31]. Meanwhile, Zheng and Peng (2020) found that the influence mechanism of industrial structure on nitrogen oxide and PM2.5 pollution is divided into three stages and that on sulfur dioxide pollution is divided into two stages. Reducing the proportion of secondary industry output to GDP can significantly reduce NOx and SO2 pollution. Industrial structure can change the impact of economic development on air pollution [32].
As various elements of industrial structure flow with each other in space, it is also very important to study the impact of industrial structure upgrades on the quality of the ecological environment in space. The gradient economic theory proposed by Gangna and Myrdal in 1957 provides theoretical support for the spatial spillover effect of industrial structure upgrading [1].
In the early stages of economic development, due to the polarization effect, the elements of the industrial structure continue to flow to the high-gradient areas with superior geographical location and rapid economic development, which promotes the rapid upgrading of the local industrial structure and accelerates the development of the local economy. With the enhancement of the polarization effect, the marginal benefit of local factors of production decreases further as the supply of production factors increases continuously. In order to maintain their competitive advantages, high-gradient areas will provide capital investment and technical support to low-gradient areas to form product bases in this region and thus develop industries in low-gradient areas [33]. In this process, the polarization effect weakens and the diffusion effect strengthens and even exceeds the polarization effect. While labor-intensive industries and heavily polluting industries “outflow” to low-gradient areas, high-gradient areas will also promote the development of tourism and service industries in low-gradient areas and the upgrading of industrial structures in low-gradient areas. Therefore, based on the above theories, the factors of industrial structure upgrading have spatial fluidity and a spatial spillover effect, but the impact results of such a spatial spillover effect remain to be studied.
The spatial spillover effect of industrial structure upgrading on ecological environment quality is mainly shown as follows: First, due to the agglomeration effect and correlation effect of industrial structure upgrading, in order to realize industrial structure upgrading and industrial chain integrity in this region based on economic benefits and industrial efficiency, industrial structure upgrading in neighboring areas will be driven to change, which will affect the speed and direction of industrial transformation in neighboring areas, promote industrial structure upgrading in neighboring areas [34], and further affect the ecological environment quality of neighboring areas. Secondly, the improvement of the ecological environment’s quality in this region will have an exemplary effect on the surrounding areas. The upgrading of industrial structures in this region will have a positive impact on the ecological environment and improve its quality. In order to avoid the inflow of pollution factors from neighboring regions, this region will implement some regulatory policies to force neighboring regions to optimize heavy polluting industries and reduce pollutant emissions. At the same time, ecological environment quality gradually becomes a consideration factor affecting the flow of human capital. In order to avoid the outflow of human capital and attract more human capital inflows, the quality of the local ecological environment will also be improved in neighboring regions due to the inflow demand of production factors [35] as shown in Figure 1.
Through empirical analysis, scholars have found that industrial structure upgrading not only reduces regional carbon emission intensity but also reduces carbon emission intensity in surrounding areas [36]. The rationalization of industrial structure can inhibit haze pollution in surrounding areas [37], and the haze pollution in one region will aggravate the haze pollution in surrounding areas. The industrial structure dominated by heavy industry will exacerbate haze pollution and further exacerbate the spatial spillover of haze pollution [38]. Industrial structure upgrading can coordinate with foreign direct investment to promote green development, and the spatial spillover effect of industrial structure upgrading is more obvious [39]. Industrial structure upgrading can significantly improve ecological efficiency and generate a significant positive spatial spillover effect [40].

3. Methods and Data

3.1. Model Setting

3.1.1. Basic Model

According to the characteristics of panel data, in order to study the impact of industrial structure upgrading and scientific and technological innovation on ecological environment quality, the two-way fixed-effect panel model is constructed as follows:
Y i t = β 0 + β 1 I S R i t + β 2 I S U i t + β 3 T e c h i t + β i C o n t r o l s i t + μ i + v t + ε i t
In Equation (1), Y i t represents the explained variable, and in this paper, Y i t is the ecological environmental quality index; I S R i t and I S U i t are the core explanatory variables, respectively, the rationalization index of industrial structure and the optimization index of industrial structure; C o n t r o l s i t represents control variables in the model; μ i and v t , respectively, represent the individual and time fixed effects in the model; ε i t is the random disturbance term.

3.1.2. Spatial Econometric Model

(1)
Construction of spatial econometric model
The environmental quality of the province is not only affected by its own economic development but also by the environmental quality of the surrounding areas. This is due to the fact that environmental pollution has strong spatial correlations, and the geographical upgrading of industrial structure will further strengthen the spatial correlation of ecological environmental quality. Therefore, in order to test the spatial spillover effect of the rationalization and optimization of industrial structure, a spatial econometric model is constructed.
At the same time, in order to verify the non-linear relationship between industrial structure upgrading and eco-environmental quality, we select the quadratic curve analysis method adopted by the classical environmental Kuznets curve and introduce the square term of industrial structure rationalization and industrial structure upgrading into the spatial econometric model to analyze the non-linear relationship between industrial structure upgrading and eco-environmental quality.
Y i t = ρ ω Y i t + β 1 I S R i t + β 2 I S U i t + β 3 I S R 2 i t + β 4 I S U 2 i t + β i C o n t r o l s i t + γ 1 ω I S R i t + γ 2 ω I S U i t + γ 3 ω I S R 2 i t + γ 4 ω I S U 2 i t + γ i ω C o n t r o l s i t + μ i + v t + ε i t
In Equation (2), ρ is the spatial autocorrelation coefficient, γ 1 ω I S R i t , γ 2 ω I S U i t , γ 3 ω I S R 2 i t , γ 4 ω I S U 2 i t , and γ i ω C o n t r o l s i t are, respectively, the rationalization of industrial structure, the optimization of industrial structure, the rationalization of industrial structure squared term, the optimization of industrial structure squared term, and the spatial lag term of control variables. ω is the geospatial weight matrix constructed by using the inverse distance square and reciprocal.
(2)
Construction of spatial weight matrix
Due to the mutual influence of industrial structure and ecological environment between regions, various elements are constantly flowing. The closer the distance is, the faster the flow is, and the more elements are flowing. Conversely, factor mobility decreases with geographical distance. Meanwhile, in order to avoid too small data, this paper introduces the inverse distance square to construct the spatial weight matrix, which is expressed as:
ω = 1 / d i j 2 i j 0 i = j
In Equation (3), d i j is the linear distance between the capitals of two provinces, ( 1 / d i j ) 2 is the square of the inverse linear distance between the capitals of two provinces. And the weight and the linear distance between the capitals of two provinces have an inverse relationship; the closer the distance between the capitals, the greater the weight; conversely, the farther the distance between the capitals, the smaller the weight.
(3)
Threshold effect model
Based on the panel data threshold model developed by Hansen [41], in order to further investigate whether industrial structure upgrading has a threshold effect of scientific and technological innovation on ecological environmental quality, this paper assumes that there is a double threshold, and the model is set as follows:
Y i t = θ C o n t r o l s i t + β 1 I S R i t × I T e c h θ 1 + β 2 I S R i t × I θ 1 T e c h θ 2 + + β m + 1 I S R i t × I T e c h > θ m + ε i t
where, I denotes the schematic function on the rationalization of industrial structure of the explanatory variable I S R i t , T e c h denotes the level of science and technology innovation, and θ is the different threshold values.
Y i t = θ C o n t r o l s i t + β 1 I S U i t × I T e c h θ 1 + β 2 I S U i t × I θ 1 T e c h θ 2 + + β m + 1 I S U i t × I T e c h > θ m + ε i t
where, I represents the indicative function of the upgrading of the explanatory variable industrial structure, I S U i t represents the level of scientific and technological innovation, and θ represents different threshold values.

3.2. Variable Selection

3.2.1. Explained Variables

(1)
Construction of index system
At present, there are PSR (pressure–state–response) and DPSIR (driving–pressure–state–impact–response) models. The Organization for Economic Cooperation and Development (OECD) and the United Nations Environment Programme (UNEP) jointly proposed the pressure–state–response framework model. The purpose is for environmental policy development. The index system is constructed from three levels of pressure, state, and response. The pressure level mainly reflects the pressure caused by human activities on the ecological environment; the state level mainly reflects the natural state of ecological environment quality; and the response level mainly reflects the beneficial interference of human activities on the ecological environment. By constructing the PSR framework, scholars analyzed regional eco-environmental quality (EEQ) [42], the ecological health status of mangroves [43], the ecological environment status of wetlands [44], and the ecological environment status of cities [45].
With the development of the PSR model, the DPSIR model has become widely used. DPSIR constructs an index system from driving force, pressure, state, influence, and response. Compared with the PSR model, the DPSIR model adds a driving force layer and an influence layer, and the index system is constructed in a more comprehensive way. The DPSIR model is widely used in the evaluation of sustainable development in society and ecosystems [46,47,48,49,50,51,52]. Since the ecological environment quality in this paper only covers the ecosystem level and does not involve the evaluation of sustainable development, the PSR model is selected to construct the ecological environment quality index system.
At the pressure level, per capita industrial wastewater discharge, general industrial solid waste production, sulfur dioxide emission per unit of GDP, carbon dioxide emission per unit of GDP, and nitrogen and oxygen emission per unit of GDP are selected as specific indicators. At the state level, per capita water resources, forest coverage, per capita park green space, and per capita household garbage removal volume were selected as specific indicators. At the response level, the proportion of harmless treatment rate of household garbage, urban sewage treatment rate, proportion of nature reserve area in the area under jurisdiction, comprehensive utilization of general industrial solid waste, and proportion of afforestation area in the area under jurisdiction are selected as specific indicators (see Table 1).
(2)
Evaluation index standardization and weight determination
Due to the diversity of data types, range standardization is adopted for dimensionless processing of the selected data to eliminate the impact caused by unit inconsistency. Due to the difference in indicator tendency, positive normalization and negative normalization were used, respectively. The entropy weighting method was used to determine the weight of each index, and the weight results are shown in Table 1.

3.2.2. Upgrading the Industrial Structure

The upgrading of industrial structure can be understood as the process of industrial structure evolving from a low level to a high level. In this process, the change of industrial structure is generally manifested in the improvement of labor productivity, the increase in product added value, and the generation of newer and more advanced industrial forms. And the evolution of industrial structure upgrading process is generally manifested in the transition from labor-intensive industries to capital-intensive industries and ultimately evolve into technology-intensive industries, in which the proportion of primary industry and secondary industry continues to decline, and the proportion of tertiary industry continues to rise.
In this paper, the upgrading level of industrial structure is measured by the rationalization and optimization of industrial structure. The rationalization of industrial structure refers to the aggregation quality between industries, which reflects both the degree of coordination between industries and the degree of effective utilization of resources. In this paper, the adjusted deviation index of industrial structure is used to measure the rationalization degree of industrial structure [53]. The optimization of industrial structure is another measure of the upgrading of industrial structure, which is manifested by the change in industrial proportion relationship and the improvement in labor productivity. Therefore, the proportional relationship of industrial structure and the product of standardized labor productivity are taken as the measurement index for the optimization of industrial structure [54]. The larger the value, the higher the level of industrial structure, and vice versa.

3.2.3. Threshold Variable

This paper selects scientific and technological innovation as the threshold variable to study whether there is a threshold effect of scientific and technological innovation on the impact of industrial structure upgrading on ecological environment quality. In this paper, the science and technology innovation index is measured by the capital–labor ratio, in which the capital stock is the stock of fixed assets of industrial enterprises above a designated size and the labor input is expressed by the number of jobs at the end of each province.

3.2.4. Control Variables

Based on previous studies on influencing factors of ecological environment quality, four aspects are mainly considered in the selection of control variables [55,56,57,58,59,60]. First, population quality, measured by the average number of students per 100,000 population, has an impact on the quality of the ecological environment. The higher the population quality, the greater the awareness of ecological environment protection and the greater the demand for a better ecological environment, thus having a positive impact on the quality of the ecological environment. Second, the degree of urbanization is measured by the proportion of the urban population. The larger the proportion of urban population, the higher the degree of urbanization and the greater the impact on ecological environment quality. Third, the degree of foreign trade is measured by the amount of import and export of goods; the higher the value, the higher the degree of foreign trade, and vice versa. Fourth is the government intervention. Measured by the proportion of the government’s general budget expenditure in GDP, the impact of government intervention on the quality of the ecological environment is mainly reflected in the restoration of the damaged ecological environment and the behavior of intervention to destroy the ecological environment.

3.3. Sources of Data

(1)
In terms of sample selection:
There are 14 coastal provinces in China, but due to the fact that Hong Kong, Macao, and Taiwan belong to different systems from the mainland, which distorts the spatial effect of the actual identification, only 11 coastal provinces other than Hong Kong, Macao, and Taiwan are considered. Meanwhile, in order to avoid the impact of the extreme events of the COVID-19 epidemic on economic development and to ensure the accuracy of the research results, the data in this paper are selected only up to 2019 (the COVID-19 epidemic outbreak occurs at the end of 2019 and the beginning of 2020). In addition, in order to better observe the temporal evolution of ecological quality, 10 years of data from each province are therefore selected.
(2)
Sources of data:
The data in this paper are derived from the China Statistical Yearbook, the China Environmental Statistical Yearbook, the EPS database, and provincial statistical yearbooks from 2010 to 2019. The data selected in this article are all annual summary data for each province, so there is no sampling issue involved.
Table 2 shows the descriptive statistics of each index in the 11 provinces (municipalities) in coastal areas from 2010 to 2019.

4. Results

4.1. Baseline Regression Results

4.1.1. Full Sample Analysis

According to the characteristics of panel data, this paper uses the F test and Hausman test to select the model for the impact of the rationalization and optimization of industrial structure on ecological environment quality. The test results show that the p-values under the F test and Hausman test are both 0.0000, so the fixed-effect model is selected. Table 3 shows the baseline regression results under the dual fixed-effect model.
From the result of benchmark regression, the rationalization of industrial structure has no significant effect on eco-environmental quality, but the optimization of industrial structure has a significant positive non-linear effect on eco-environmental quality. Moreover, the coefficient of the optimization of industrial structure squared term is 0.2652, the relationship between them presents a positive “U”-shaped distribution, and the inflection point value is 0.6107. This means that when the optimization of industrial structure index exceeds 0.6107, the optimization of industrial structure has a significant effect on the ecological environment’s quality. The adjustment of industrial structure and the improvement of labor productivity can promote the improvement of ecological environment quality.
Among the control variables, the degree of urbanization and government intervention have positive effects on the quality of the ecological environment quality, and the degree of urbanization has a stronger effect on the quality of the ecological environment, but scientific and technological innovation, population quality, and foreign trade have no significant impact on the quality of the ecological environment.

4.1.2. Selection of Spatial Econometric Models

First, the spatial correlation test of the comprehensive evaluation index of eco-environmental quality of 11 provinces (autonomous regions and municipalities) in coastal areas was conducted, and the results are shown in Table 4. Among them, from 2010 to 2019, Moran’s I of the comprehensive evaluation index of ecological environment quality were all positive and passed the significance test at the 5% level except in 2019. Therefore, a spatial effect existed, and a spatial econometric model could be used.
Second, since the spatial Durbin model is a model with more general significance and extension scope than the spatial lag model and spatial error model, Wald and LR tests are conducted on the spatial Durbin model, and the results are shown in Table 5. Since the statistics of Wald-spatial-lag and LR-spatial-lag are significant at the 1% level, respectively, the null hypothesis is rejected. Therefore, the spatial Dubin model cannot be reduced to a spatial lag model or a spatial error model. This paper selects the spatial Dubin model for analysis. The spatial Dubin model includes four forms: time fixed, individual fixed, time individual bidirectional fixed, and random effect. The specific form should be determined according to the results of the Hausman test and joint significance test. According to the test results in Table 5, the spatial Durbin model with fixed time is finally selected for analysis.

4.1.3. Analysis of Spatial Econometric Regression Results

Table 6 shows the regression results under the spatial Dubin model, in which the spatial rho is the spatial correlation coefficient of eco-environmental quality and is significant in the 5% confidence interval. It shows that the ecological environment’s quality has a spatial effect and can be affected by the surrounding area.
Since the estimated coefficient in the spatial model cannot reflect the full influence of the independent variable on the dependent variable and is only effective at the direction and significance levels, the influence of the independent variable should be further decomposed into direct effects and indirect effects. Among them, the direct effect includes the direct impact and feedback effect of regional industrial structure upgrading on eco-environmental quality. The “feedback effect“ refers to the fact that the eco-environmental quality of the region affects the eco-environmental quality of the surrounding region, which in turn affects the eco-environmental quality of the region. The indirect effect is the effect of the upgrading of the industrial structure on the ecological environment quality of the surrounding area.
Through the decomposition of the spillover effect, it is concluded that the influence of industrial structure rationalization on the ecological environment quality of the region and the surrounding area is non-linear, with a positive “U”-shaped distribution, and the industrial structure rationalization coefficients are 0.2151 and 0.6009, respectively. Therefore, compared with the impact of industrial structure rationalization on the ecological environment quality of the region, it has a deeper impact on the ecological environment quality of the surrounding area, and the effect is more obvious. The influence of industrial structure optimization on eco-environment quality in the region has a positive “U”-shaped distribution with an inflection point of 0.4990. However, the influence of the optimization of industrial structure in the region on eco-environment quality in the surrounding region presents an inverted “U”-shaped distribution with an inflection point of 0.7234, which means that when the industrial structure optimization index in the region exceeds 0.7234, it has a negative impact on the surrounding ecological environment.
The quality of the population and the degree of government intervention can obviously improve the ecological environment quality of the surrounding area, which has passed the significance level test. However, the impact of urbanization and foreign trade on the quality of the surrounding ecological environment is negative. The higher the degree of urbanization and foreign trade, the less the improvement effect on the surrounding ecological environment quality is, and the impact of scientific and technological innovation on the regional ecological environment quality is negative.

4.2. Threshold Effect Test

The spatial econometric test found that there is a spatial spillover effect of industrial structure upgrading on eco-environmental quality and a positive non-linear effect of industrial structure rationalization and industrial structure advancement on eco-environmental quality, but whether this positive effect is sustainable and determination of the degree of the positive effect need to be further studied. As an important driving factor of industrial structure upgrading, whether the degree of scientific and technological innovation that can promote industrial structure upgrading has a positive impact on ecological environment quality needs to be tested. In this paper, the Boostrap method was used to repeatedly draw samples 300 times, and science and technology innovation was used as the threshold variable to test the threshold effect on the rationalization of industrial structure and the advanced industrial structure, respectively. The results are shown in Table 7 and Table 8.
The single threshold test and the double threshold test of industrial structure rationalization both pass the 1% significance level test, indicating that there is a double threshold effect of industrial structure rationalization at the 1% confidence level, and the threshold values are estimated to be 5.9790 and 6.0539, respectively, by applying the principle of least squared residuals. However, the single threshold test and the double threshold test of advanced industrial structure do not pass the 5% significance level test, so there is no threshold effect of advanced industrial structure. However, both the single threshold test and the double threshold test for the advanced industrial structure fail the 5% significance level test, so there is no threshold effect for the advanced industrial structure.
According to Table 9, it can be seen that the impact of industrial structure rationalization on eco-environmental quality still shows non-linear characteristics after taking science and technology innovation as the threshold variable. Specifically, when the index of scientific and technological innovation is lower than 5.9790, the rationalization of industrial structure has a positive impact on the quality of ecological environment, and its influence coefficient is 0.1123; when scientific and technological innovation is further raised to cross the threshold value of 5.9790, the impact of industrial structure rationalization on the quality of ecological environment is more significant and deepens, and its influence coefficient is 0.5184. However, when the index of science and technology innovation rises to 6.0539, the impact of industrial structure rationalization on ecological environment quality is still positive but weakened, which means that the role of science and technology innovation in the positive impact of industrial structure rationalization on ecological environment quality is limited and that other factors are needed to further enhance the impact of industrial structure rationalization on ecological environment quality.
The reason for this is that when the degree of scientific and technological innovation is lower than the first threshold, the rationalization of industrial structure tends to be improved more by adjusting resource allocation, improving production efficiency, enhancing economic efficiency, and other economic aspects. And when science and technology innovation crosses the first threshold and is between the two thresholds, the development of science and technology innovation makes the industrial structure more rational by further adjusting resource utilization, optimizing resource allocation, improving product quality, and greening the production process, and this stage has a more significant improvement effect on ecological environment quality. When the development of science and technology innovation exceeds the second threshold, the driving effect of science and technology innovation on the rationalization of industrial structure for the improvement of ecological and environmental quality decreases, science and technology innovation cannot sustainably provide continuous improvement motivation, and other factors are needed to further stimulate. And the specific driving mechanism needs to be studied.
When scientific and technological innovation crosses the first threshold value and falls between the two thresholds, the development of scientific and technological innovation can further adjust the utilization of resources, optimize the allocation of resources, improve the quality of products, and make the production process green and environmentally friendly, so as to make the industrial structure more reasonable. In this stage, the ecological environment’s quality will be improved more significantly. When the development of scientific and technological innovation exceeds the second threshold value, the driving effect of scientific and technological innovation on the rationalization of industrial structure and the improvement of ecological environment quality declines, and scientific and technological innovation cannot continue to provide the driving force, so it needs to be further stimulated by other factors, and the specific driving mechanism needs to be studied.

4.3. Regional Heterogeneity Analysis

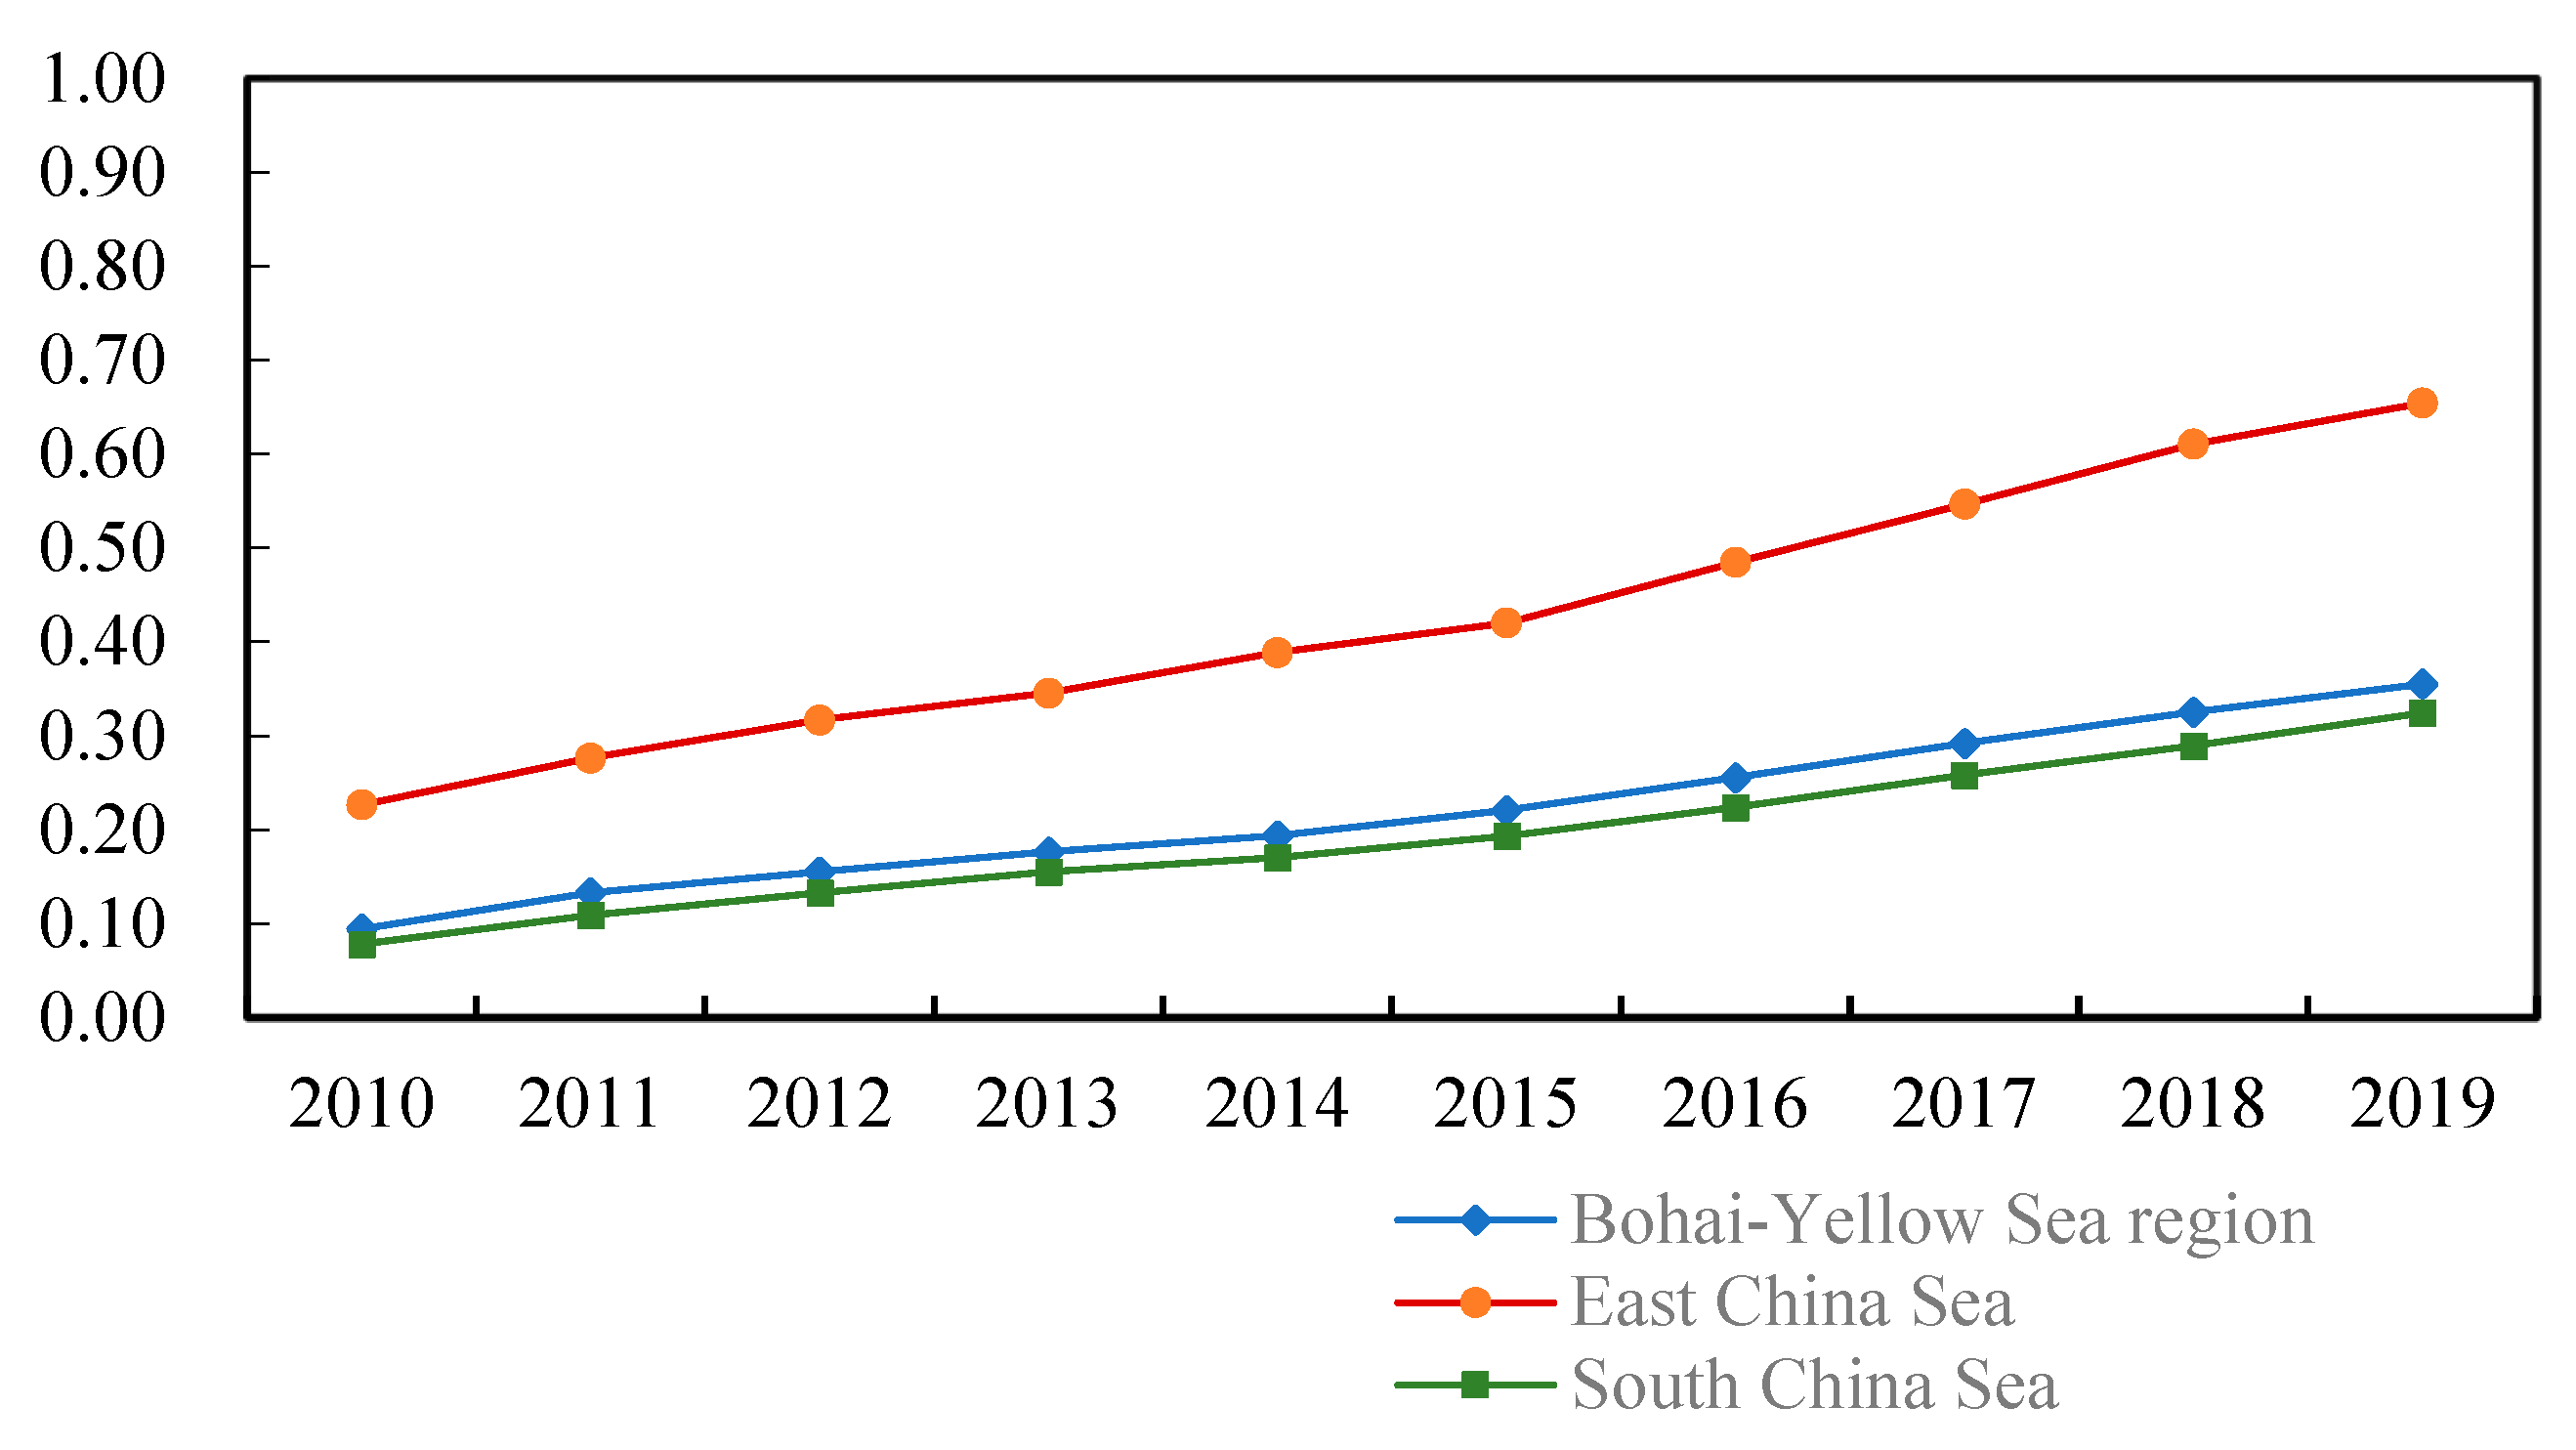
4.3.1. Industrial Structure Upgrading Heterogeneity Analysis

China’s sea area is vast, and there are differences in industrial structure status and ecological environment quality in different adjacent areas. Therefore, 11 coastal provinces are divided into the Bohai-Yellow Sea, the East China Sea, and the South China Sea according to their adjacent waters, and the upgrading of industrial structures and the differences in ecological environment quality in different areas are analyzed. The Bohai-Yellow Sea areas include the Liaoning Province, Hebei Province, Tianjin City, and Shandong Province; the East China Sea includes the Jiangsu, Shanghai, Zhejiang, and Fujian provinces; and the South China Sea region includes Guangdong, Guangxi, and Hainan provinces.
As can be seen from Figure 2, the rationalization degree of the industrial structure in the East China Sea is the highest, followed by that in the Bohai-Yellow Sea, and that in the South China Sea is the lowest. In 2013, the industrial structure rationalization degree of the Bohai-Yellow Sea area showed an obvious rising trend and gradually narrowed the gap with the East China Sea area. The rationalization of industrial structure in the South China Sea is on the rise, but the rationalization degree is at a low level, and further adjustment of the industrial structure is needed. The rationalization degree of the industrial structure in the East China Sea region is in a steady rising stage.
In Figure 3, the East China Sea has the highest level of the industrial structure optimization, followed by the Bohai-Yellow Sea, followed by the South China Sea. The industrial structure optimization level of the East China Sea is on the rise. Compared with the rationalization of the industrial structure, the industrial structure of the optimization level still has a large space for development. The industrial structure optimization of the Bohai-Yellow Sea and the South China Sea has the same trend, and the level of the optimization is similar, but there is a big gap compared with the East China Sea. The two regions need to adjust the industrial layout, develop the tertiary industry, and expand the proportion of the tertiary industry. The East China Sea region is composed of Jiangsu, Shanghai, Zhejiang, and Fujian. The industrial structure of this region is adjusted rapidly, and the proportion of tertiary industry is significant, among which the industrial chains of Shanghai and Jiangsu are strongly correlated. The spatial radiation effect of the industrial structure promotes the rationalization and optimization of industrial structure of Jiangsu and Zhejiang. The provinces in the Bohai-Yellow Sea area mainly include the Liaoning Province, Hebei Province, Tianjin City, and Shandong Province. The industrial structure of this area has a large proportion of heavy industry. In the adjustment of industrial structure, economic development should be taken into account, resource allocation should be adjusted, and the rationalization of industrial structure should be further strengthened. The provinces in the South China Sea mainly include the Guangdong Province, Guangxi Province, and Hainan Province. The industrial structures of the Guangdong Province and Hainan Province have been developing and becoming more and more rationalized and optimized, but the adjustment of their industrial structures has not effectively promoted the adjustment of Guangxi Province’s industrial structure layout.

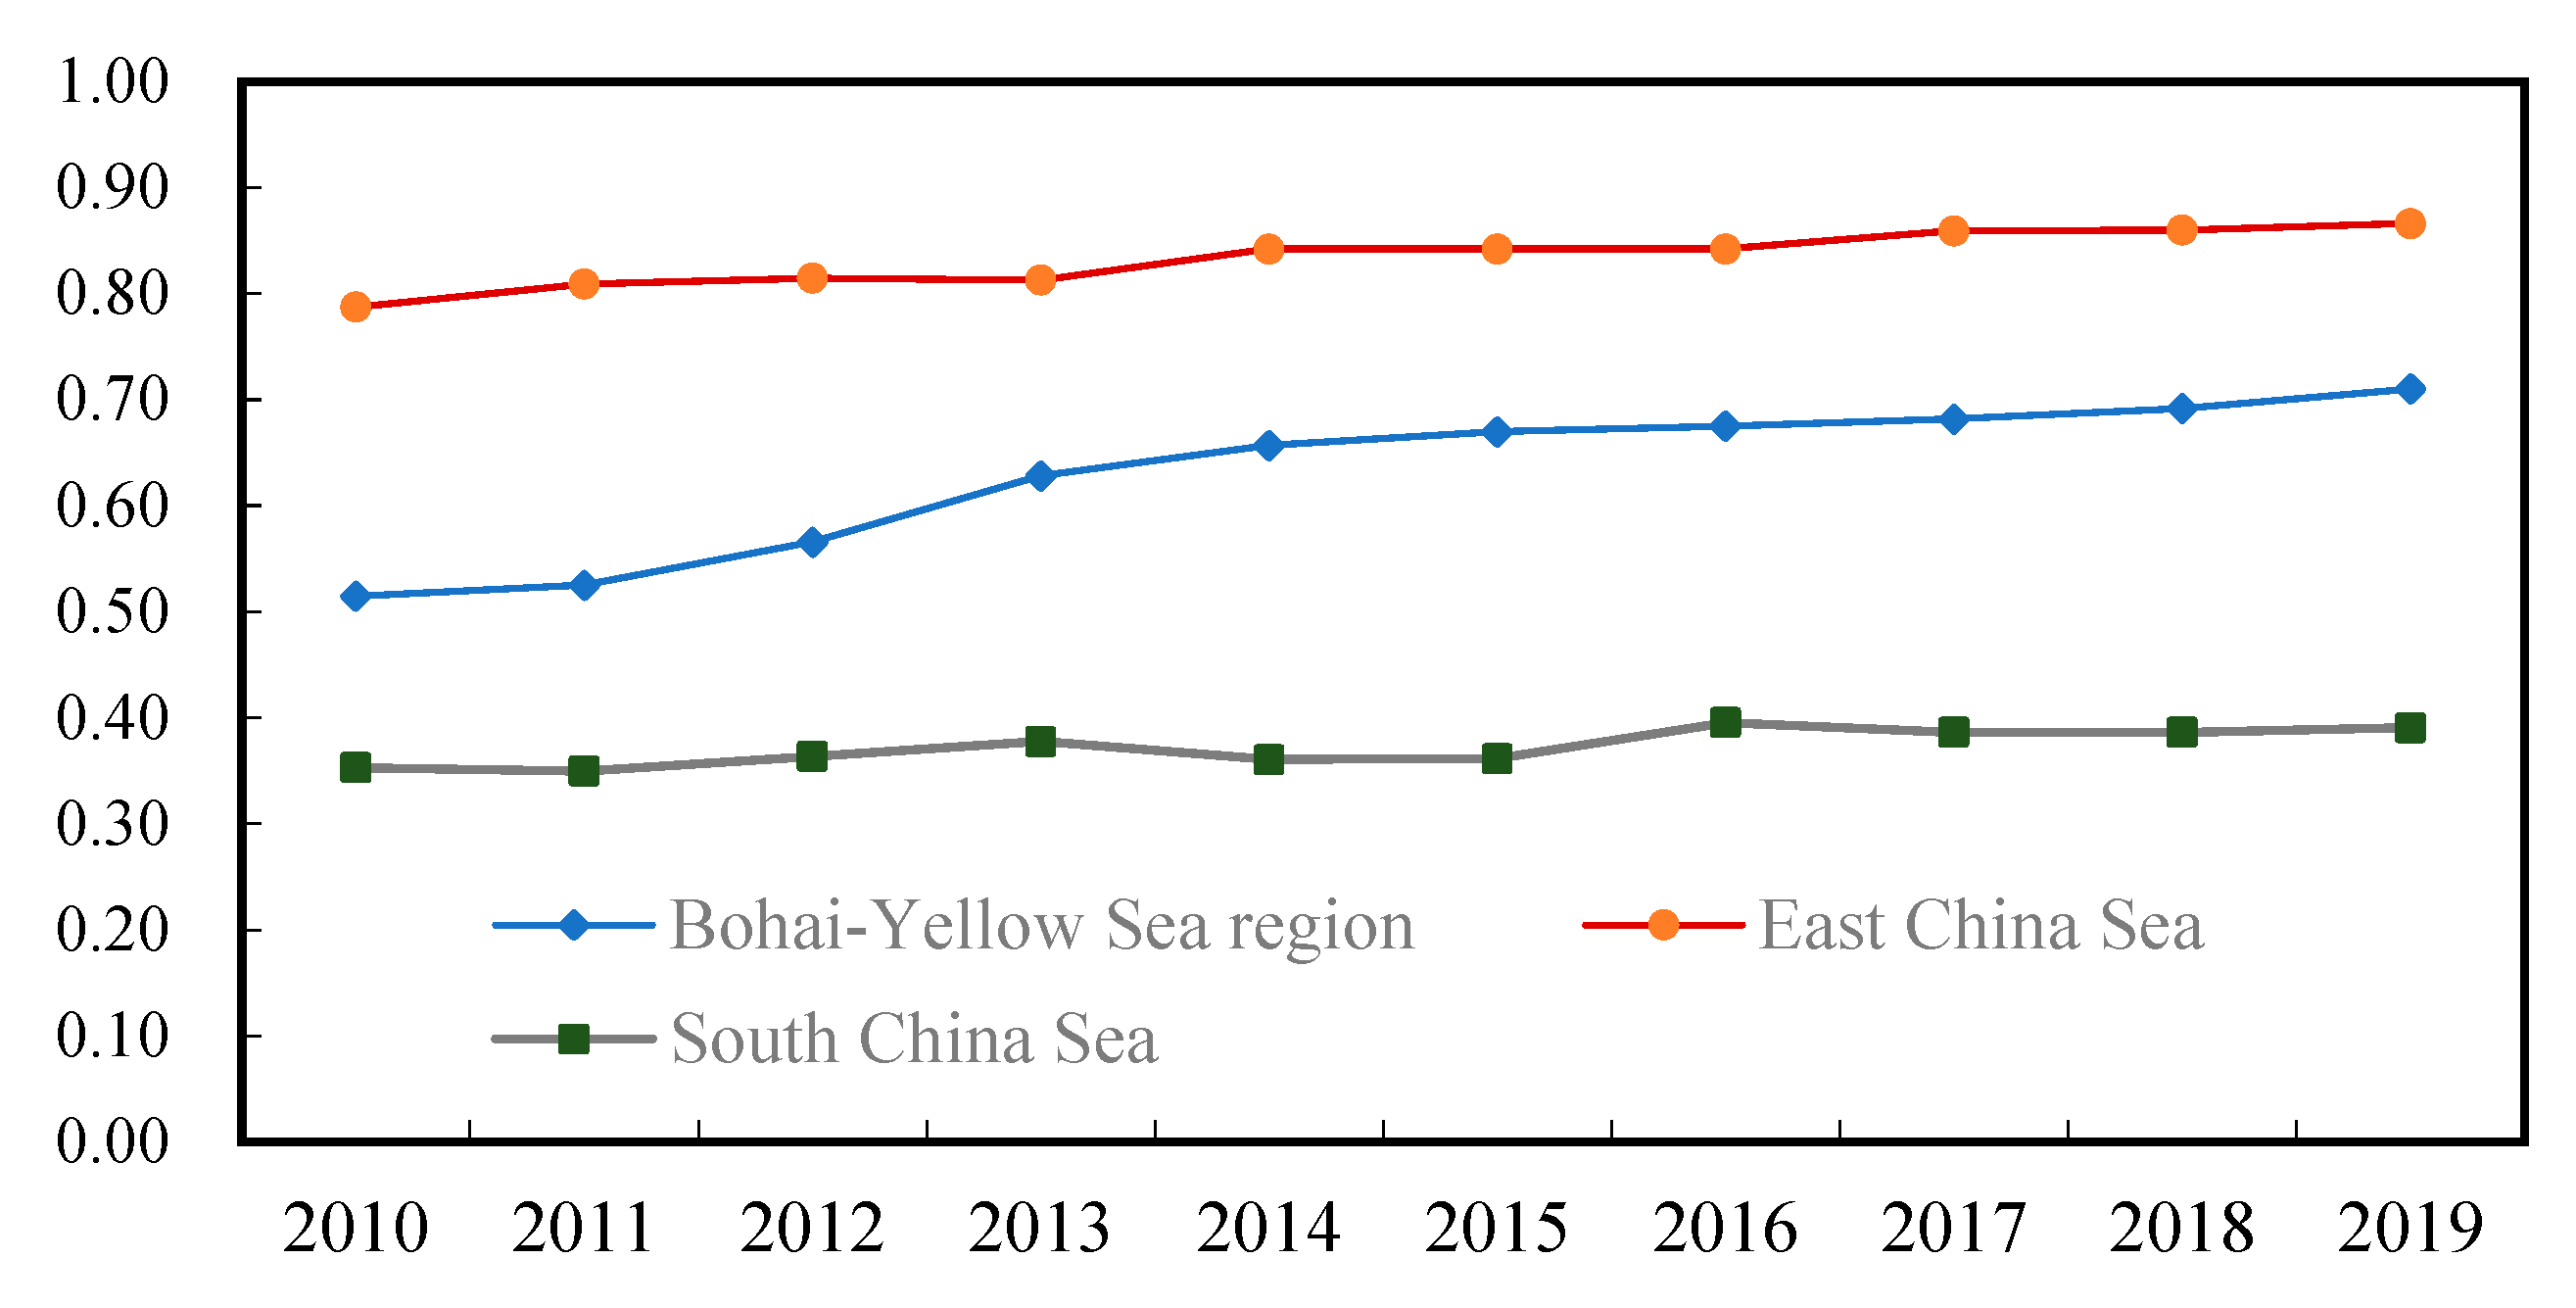
4.3.2. Spatial and Temporal Evolutionary Characteristics of Ecological Environmental Quality

Arcgis 10.6 was used to visualize the ecological environment quality index of 11 provinces (regions and cities) in the coastal region, and the results are shown in Figure 4. It is found that the ecological environment quality of Guangdong Province, Guangxi Province, and Hainan Province in the South China Sea region is better compared with the Bohai-Yellow Sea region and the East China Sea region, among which the ecological environment quality of Hainan Province is in a higher quality state from 2010 to 2019, and no deterioration trend has occurred. The less polluting industries, such as heavy industries in Hainan Province, protect the ecological environment to a large extent, and the development of tourism in recent years has not caused damage or pollution to the environment. The ecological quality of Guangdong Province and Guangxi Province is similar, but the ecological quality of Guangxi Province is higher than that of Guangdong Province. The rapid development of industry in Guangdong Province in recent years has caused some pressure on the ecological environment, but the overall trend is that the ecological environment is still improving. Among the provinces in the East China Sea region, the ecological environment quality of Fujian Province is relatively better than the other three provinces, but there are fluctuations up and down; the ecological environment quality of Zhejiang Province is second, and the ecological environment quality indexes of Jiangsu Province and Shanghai City are close to that of Zhejiang Province, but the ecological environment of all three provinces keeps developing for the better. Among the provinces adjacent to the Bohai-Yellow Sea region, the ecological environment quality of Tianjin is worse compared to other provinces, but it has been improving in recent years; the ecological environment quality of Liaoning Province and Shandong Province has been converging, and the ecological environment quality of Shandong Province has improved more; the ecological environment quality of Hebei Province has improved more substantially in 2018, and the implementation of the “Opinions on Comprehensively Strengthening Ecological Environmental Protection and Resolutely Fighting the Battle of Pollution Prevention and Control Opinions” played a greater role, and in 2019, it became the best province in the Bohai-Yellow Sea region in terms of ecological and environmental quality.

4.3.3. Analysis of the Decomposition Results of Spatial Effects in Each Region

The spatial effects of industrial structure upgrading on ecological and environmental quality in the Bohai-Yellow Sea regions, the East China Sea regions, and the South China Sea region were studied, respectively, and the results are shown in Table 10.
The results show that: the rationalization of industrial structure in the East China Sea region has a significant positive non-linear effect on the ecological environment quality of the region and the surrounding areas. It has a positive “U”-shaped distribution with inflection points of 0.8505 and 0.8838, respectively. The rationalization of industrial structure in the East China Sea region needs to reach a high degree of reasonableness to have a significant effect on the improvement of ecological environment quality; the impact of the rationalization of industrial structure in the South China Sea region on the ecological environment quality of the surrounding areas is positively “U”-shaped with an inflection point of 0.4026. However, the rationalization of industrial structures in the Bohai-Yellow Sea regions has no significant impact on the ecological environment quality. However, the rationalization of industrial structure in the Bohai-Yellow Sea region has no significant effect on the ecological environment quality. In the South China Sea region, the rationalization degree is lower than that of the Bohai-Yellow Sea region, but the industrial layout of the South China Sea region has fewer heavy industries. Although the rationalization degree is weaker, its ecological environment quality is more sensitive to the rationalization of industrial structure.
The optimization of industrial structure in the Bohai-Yellow region has a significant non-linear influence on the ecological environment quality of the region and the surrounding areas, with a positive “U”-shaped distribution; the non-linear influence of the optimization of industrial structure on the ecological environment quality in the South China Sea region is inverted “U”-shaped, with an inflection point of 1.49. However, the index of industrial structure optimization in this paper is between 0 and 1. Therefore, the impact of industrial optimization on ecological environment quality in the South China Sea region lies to the left of the inflection point, implying that the optimization of industrial structure in the region has a significant improvement effect on ecological environment quality. However, the industrial structure optimization in the East China Sea region does not have a significant effect on the improvement of ecological and environmental quality. Among them, it may be due to the fact that the industrial structure optimization of the East China Sea region has reached a certain threshold, and the optimization degree of its industrial structure can no longer contribute to the improvement of ecological and environmental quality.
As for the control variables, there is a significant positive impact of technological innovation in the East China Sea region on the ecological environment quality of the surrounding areas and no significant improvement of the ecological environment quality in this region; however, there is a negative impact of technological innovation in the South China Sea region on the ecological environment quality of both this region and the surrounding areas. The main objective of improving science and technology innovation capacity in the South China Sea region is to expand productivity and promote economic development, not to improve environment. In terms of population quality and urbanization, the improvement of population quality and urbanization in the Bohai-Yellow Sea region has a significant positive effect on the ecological environment quality of the region, but the spatial effect of urbanization in the South China Sea region and the Bohai-Yellow Sea region is not conducive to the improvement of ecological environment quality in the surrounding areas. The degree of foreign trade in the Bohai-Yellow Sea region and the South China Sea region has a significant negative effect on the ecological environment quality of the region, and the stronger the degree of foreign trade, the stronger the negative effect on the ecological environment quality, and there is a negative spatial spillover effect on the degree of foreign trade in the South China Sea region. Government intervention in the East China Sea region can improve the ecological environment quality in the region and the surrounding areas, and there is a spatial spillover effect, but government intervention in the South China Sea region fails to effectively improve the ecological environment quality.

5. Discussion and Conclusions

It is our long-term responsibility to improve the quality of the ecological environment. Upgrading the industrial structure plays an important and positive role as a driving force for improving the quality of the ecological environment. In this paper, 11 provinces (autonomous regions and municipalities) in coastal areas are taken as the research object, and theoretical and empirical analysis is carried out. The results show that:
(1)
According to the baseline regression results, the influence of industrial structure rationalization on ecological environment quality is not significant, but the influence of industrial structure optimization on ecological environment quality has a positive “U”-shaped distribution; that is, the industrial structure optimization index plays a promoting role in the improvement of ecological environment quality after passing the inflection point.
(2)
By introducing the spatial factor, it is found that the spatial spillover effect of industrial structure rationalization has a positive “U”-shaped distribution on the ecological environment quality of the surrounding area, and the specific influence result depends on the degree of industrial structure rationalization. However, the industrial structure optimization has an inverted “U”-shaped distribution on the ecological environment quality of the surrounding area. When the industrial structure optimization index exceeds 0.7234, the industrial structure optimization has a negative effect on the ecological environment quality of the surrounding area.
(3)
Based on the threshold effect analysis of scientific and technological innovation, when the level of scientific and technological innovation is underdeveloped, the rationalization of industrial structure has a threshold effect on the improvement of ecological environment quality, and the rationalization of industrial structure has a limited effect on the improvement of ecological environment quality in the long run with insufficient power. However, when the scientific and technological innovation exceeds the threshold value, the rationalization of industrial structure has a more far-reaching positive effect on the ecological environment quality, and the rationalization of industrial structure can cooperate with the scientific and technological innovation to promote the improvement of ecological environment quality.
(4)
Based on regional heterogeneity, the spatial measurement test was carried out in the Bohai-Yellow Sea, the East China Sea, and the South China Sea, respectively, and it was found that the influence of industrial structure rationalization in the East China Sea and the South China Sea on the eco-environmental quality of the surrounding areas had a positive “U”-shaped distribution. The influence of industrial structure optimization on eco-environmental quality in the Bohai-Yellow Sea area has a positive “U”-shaped distribution. Although the non-linear effect of industrial structure optimization on eco-environmental quality in the South China Sea is inverted “U”-shaped, the specific effect is the left branch of the inverted “U-shaped” curve, which means that the industrial structure optimization in the region has a significant improvement effect on eco-environmental quality.
The following recommendations are made:
Firstly, according to conclusion 1, in order to promote the improvement of ecological environment quality without considering the influence of spatial effect, the degree of advanced industrial structure should be continuously improved. The government reduces the operating costs of high-tech enterprises by adopting policies such as taxes and targeted subsidies to high-tech enterprises. This will ensure that more high-tech enterprises operate well and drive the industry to more advanced transformation.
Secondly, according to conclusion 2, under the consideration of the influence of spatial effect, the rationalization of local industrial structure will be enhanced by solving the overcapacity and timely adjusting of the unreasonable industrial structure. In the stage of industrial structure adjustment, the demise of old industries and the emergence of new industries are inevitably accompanied, which will lead to problems such as employee unemployment. The government needs to do a good job in appeasing the unemployed employees and provide timely skills training for the unemployed employees to ensure that the rationalization of industrial structure does not lead to waves of unemployment.
At the same time, the upgrading effect of industrial structure among regions will also lead to the improvement of ecological environment quality in the surrounding areas. Therefore, the neighboring regions should realize industrial linkage, form a regional industrial chain, and jointly realize industrial structure upgrading, which will promote the improvement of ecological environment quality.
Finally, strengthen scientific and technological innovation to provide inexhaustible power support for the improvement of ecological environment quality. The government improves the ability of scientific and technological innovation by assisting enterprises to carry out scientific and technological innovation, formulating incentive policies for high-tech talents, increasing investment in scientific and technological innovation, raising the proportion of scientific and technological innovation funds in GDP, increasing financial support for high-tech industries, and guiding enterprises to carry out innovative research and development.

Author Contributions

X.Z.: Conceptualization, Formal Analysis, Writing—Original Draft, Methodology; Z.C.: Supervision, Visualization, Funding; C.T.: Resources, Software; G.L. Writing—Review & Editing. All authors have read and agreed to the published version of the manuscript.

Funding

This research was funded by the Guangdong Education Science Planning Project, grant number 2023GXJK120; Guangdong Youth Research Project, grant number 2022GJ005; Guangdong Philosophy and Social Science Youth Project, grant number GD22YGL19; Guangdong Provincial Ordinary University Characteristic Innovation Project, grant number 2023WCSCX060.

Institutional Review Board Statement

Not applicable.

Informed Consent Statement

Not applicable.

Data Availability Statement

Some or all data and models that support the findings of this study are available from the corresponding author upon reasonable request.

Conflicts of Interest

The authors declare no conflict of interest.

References

  1. Colin, C. The Conditions of Economic Progress; Macmillan & Co., Ltd.: London, UK, 1940. [Google Scholar]
  2. Petty, W. Political Arithmetick. In McMaster University Archive for the History of Economic Thought; McMaster University: Hamilton, ON, Canada, 1690. [Google Scholar]
  3. Freire, F.d.S.; da Silva, N.O.; de Oliveira, V.R.F. Economic growth and greenhouse gases in Brazilian States: Is the environmental Kuznets curve applicable hypothesis? Environ. Sci. Pollut. Res. 2023, 30, 44928–44942. [Google Scholar] [CrossRef] [PubMed]
  4. Grossman, G.M.; Krueger, A.B. Economic Growth and the Environment*. Q. J. Econ. 1995, 110, 353–377. [Google Scholar] [CrossRef]
  5. Hussain, M.N.; Li, Z.; Yang, S. Heterogeneous effects of urbanization and environment Kuznets curve hypothesis in Africa. Nat. Resour. Forum 2023, 47, 317–333. [Google Scholar] [CrossRef]
  6. Mahmood, H.; Furqan, M.; Hassan, M.S.; Rej, S. The Environmental Kuznets Curve (EKC) Hypothesis in China: A Review. Sustainability 2023, 15, 6110. [Google Scholar] [CrossRef]
  7. Hu, L.; Wang, J.; Feng, L. An Empirical Study of the Rationalization of Industrial Structure and Quality of Economic Growth in China: 1978–2012. In Proceedings of the 2013 International Conference on Management (ICM 2013), Penang, Malaysia, 10–11 June 2013; pp. 813–819. [Google Scholar]
  8. Xu, Y.; Lee, C.C. Research on the Impact of China’s Industrial Structure Change on Economic Growth and Fluctuation Based on Agricultural Development. In Proceedings of the 2019 4th International Conference on Mechanical, Control and Computer Engineering (ICMCCE), Hohhot, China, 24–26 October 2019; pp. 862–8623. [Google Scholar]
  9. Kuznets, S. Quantitative Aspects of the Economic-Growth of Nations.3. Industrial Distribution of Income and Labor-Force by States, United-States, 1919–1921 to 1955. Econ. Dev. Cult. Chang. 1958, 6, 1–128. [Google Scholar] [CrossRef]
  10. Sanzida, M.; Amy, L.G.; Md Ashraful, I.; Wang, X.H.; David, J.P. Assessing sensitivity to climate-related disasters in the context of a developing country: Evidence from the coastal region of Bangladesh. Int. J. Disaster Risk Reduct. 2023, 97, 104023. [Google Scholar]
  11. Emilio, L.; Gregorio, I. Extreme climate change hazards and impacts on European coastal cities: A review. Renew. Sustain. Energy Rev. 2023, 184, 113587. [Google Scholar]
  12. Zhu, L.Y.; Hao, Y.; Lu, Z.N.; Wu, H.T.; Ran, Q.Y. Do economic activities cause air pollution? Evidence from China’s major cities. Sustain. Cities Soc. 2019, 49, 101593. [Google Scholar] [CrossRef]
  13. Xie, R.H.; Teo, T.S.H. Green technology innovation, environmental externality, and the cleaner upgrading of industrial structure in China—Considering the moderating effect of environmental regulation. Technol. Forecast. Soc. Change 2022, 184, 122020. [Google Scholar] [CrossRef]
  14. Fernandez, Y.F.; Lopez MA, F.; Blanco, B.O. Innovation for sustainability: The impact of R&D spending on CO2 emissions. J. Clean. Prod. 2018, 172, 3459–3467. [Google Scholar]
  15. Kanagaraj, J.; Senthilvelan, T.; Panda, R.C.; Kavitha, S. Eco-friendly waste management strategies for greener environment towards sustainable development in leather industry: A comprehensive review. J. Clean. Prod. 2015, 89, 1–17. [Google Scholar] [CrossRef]
  16. Khatri, A.; Peerzada, M.H.; Mohsin, M.; White, M. A review on developments in dyeing cotton fabrics with reactive dyes for reducing effluent pollution. J. Clean. Prod. 2015, 87, 50–57. [Google Scholar] [CrossRef]
  17. Xu, L.; Fan, M.T.; Yang, L.L.; Shao, S. Heterogeneous green innovations and carbon emission performance: Evidence at China’s city level. Energy Econ. 2021, 99, 105269. [Google Scholar] [CrossRef]
  18. Dogan, E.; Inglesi-Lotz, R. The impact of economic structure to the environmental Kuznets curve (EKC) hypothesis: Evidence from European countries. Environ. Sci. Pollut. Res. 2020, 27, 12717–12724. [Google Scholar] [CrossRef]
  19. Murphy, J.; Gouldson, A. Environmental policy and industrial innovation: Integrating environment and economy through ecological modernisation. Geoforum 2000, 31, 33–44. [Google Scholar] [CrossRef]
  20. Zhigang, P.; Xiaohong, W.; Rui, G. Associated Analysis of Technological Progress, Economy and Ecological Environment. In Proceedings of the 2012 24th Chinese Control and Decision Conference (CCDC), Taiyuan, China, 23–25 May 2012; pp. 3893–3896. [Google Scholar]
  21. Bu, J.; Zhang, S.; Wang, X.; Li, C.; Wang, X.; Liu, Q.; Xu, X.; Wang, X. Study on the influence of industrial structure optimization on water environment and economy: A case study of Changzhou city. Front. Earth Sci. 2023, 10, 961299. [Google Scholar] [CrossRef]
  22. Wang, X.; Zhao, D.; Xu, Y. Threshold Effect of Industrial Structure Upgrading on Water Environment Pollution in China. J. Coast. Res. 2020, 115, 518–521. [Google Scholar] [CrossRef]
  23. Feng, H.; Zeng, M.; Tian, G. Impact of Upgrading of Geo-Industrial Structure on Economy and Environment. Ekoloji 2018, 27, 1793–1799. [Google Scholar]
  24. Cheng, Z.H.; Li, L.S.; Liu, J. Industrial structure, technical progress and carbon intensity in China’s provinces. Renew. Sustain. Energy Rev. 2018, 81, 2935–2946. [Google Scholar] [CrossRef]
  25. Tian, X.; Chang, M.; Shi, F.; Tanikawa, H. How does industrial structure change impact carbon dioxide emissions? A comparative analysis focusing on nine provincial regions in China. Environ. Sci. Policy 2014, 37, 243–254. [Google Scholar] [CrossRef]
  26. Zhang, J.; Jiang, H.Q.; Liu, G.Y.; Zeng, W.H. A study on the contribution of industrial restructuring to reduction of carbon emissions in China during the five Five Year Plan periods. J. Clean. Prod. 2018, 176, 629–635. [Google Scholar] [CrossRef]
  27. Mi, Z.F.; Pan, S.Y.; Yu, H.; Wei, Y.M. Potential impacts of industrial structure on energy consumption and CO2 emission: A case study of Beijing. J. Clean. Prod. 2015, 103, 455–462. [Google Scholar] [CrossRef]
  28. Wang, K.L.; Miao, Z.; Zhao, M.S.; Miao, C.L.; Wang, Q.W. China’s provincial total-factor air pollution emission efficiency evaluation, dynamic evolution and influencing factors. Ecol. Indic. 2019, 107, 105578. [Google Scholar] [CrossRef]
  29. Wang, Q.; Wang, L.L. The nonlinear effects of population aging, industrial structure, and urbanization on carbon emissions: A panel threshold regression analysis of 137 countries. J. Clean. Prod. 2021, 287, 125381. [Google Scholar] [CrossRef]
  30. Wei, W.; Zhang, M. The non-linear impact of industrial structure on CO2 emissions in China. Appl. Econ. Lett. 2020, 27, 576–579. [Google Scholar] [CrossRef]
  31. Zhang, J.F.; Deng, W. Industrial Structure Change and Its Eco-environmental Influence since the Establishment of Municipality in Chongqing, China. In Proceedings of the International Conference on Ecological Informatics and Ecosystem Conservation. (ISEIS 2010), Beijing, China, 27–29 August 2010; Volume 2, pp. 517–526. [Google Scholar]
  32. Zheng, Y.; Peng, J.C.; Xiao, J.Z.; Su, P.D.; Li, S.Y. Industrial structure transformation and provincial heterogeneity characteristics evolution of air pollution: Evidence of a threshold effect from China. Atmos. Pollut. Res. 2020, 11, 598–609. [Google Scholar] [CrossRef]
  33. Gunnar, M. Economic Theory and Underdeveloped Regions; Harper & Row: New York, NY, USA, 1957. [Google Scholar]
  34. Sunanta, S. Globalising the Thai ‘high-touch; industry: Exports of care and body work and gendered mobilities to and from Thailand. J. Ethn. Migr. Stud. 2020, 46, 1543–1561. [Google Scholar] [CrossRef]
  35. Men, K.; Sun, H.; Kou, M. Global Value Chains and Spatial Spillovers of Economic Growth-Based on the Perspective of Participation and Status Index in Global Value Chain. Sustainability 2022, 14, 15518. [Google Scholar] [CrossRef]
  36. Dietz, T.; Rosa, E.A.; York, R. Environmentally Efficient Well-Being: Rethinking Sustainability as the Relationship between Human Well-being and Environmental Impacts. Hum. Ecol. Rev. 2009, 16, 114–123. [Google Scholar]
  37. Shi, B.; Wang, R.; Zhe, R.; Zhai, Z. Spatial spillover effect of industrial structure upgrading on carbon emission intensity: Panel data evidences from Beijing, China. Front. Environ. Sci. 2022, 10, 963960. [Google Scholar] [CrossRef]
  38. Wang, L.; Jiang, S.; Xu, H. Reexamining the Impact of Industrial Structure on Haze Pollution Based on the Yangtze River Delta. Atmosphere 2021, 12, 613. [Google Scholar] [CrossRef]
  39. Chen, S.M.; Zhang, Y.; Zhang, Y.B.; Liu, Z.X. The relationship between industrial restructuring and China’s regional haze pollution: A spatial spillover perspective. J. Clean. Prod. 2019, 239, 115808. [Google Scholar] [CrossRef]
  40. Xu, S.; Zhou, Y. OFDI, Industrial Structure Upgrading and Green Development-Spatial Effect Based on China’s Evidence. Sustainability 2023, 15, 2810. [Google Scholar] [CrossRef]
  41. Hansen, B.E. Threshold effects in non-dynamic panels: Estimation, testing, and inference. J. Econom. 1999, 93, 345–368. [Google Scholar] [CrossRef]
  42. Boori, M.S.; Choudhary, K.; Paringer, R.; Kupriyanov, A. Eco-environmental quality assessment based on pressure-state-response framework by remote sensing and GIS. Remote Sens. Appl. Soc. Environ. 2021, 23, 100530. [Google Scholar] [CrossRef]
  43. Wang, Y.-T.; Wang, Y.-S.; Wu, M.-L.; Sun, C.-C.; Gu, J.D. Assessing ecological health of mangrove ecosystems along South China Coast by the pressure–state–response (PSR) model. Ecotoxicology 2021, 30, 622–631. [Google Scholar] [CrossRef]
  44. Wang, Y.-S.; Lou, Z.-P.; Sun, C.-C.; Sun, S. Ecological environment changes in Daya Bay, China, from 1982 to 2004. Marine Pollut. Bull. 2008, 56, 1871–1879. [Google Scholar] [CrossRef]
  45. Karbalaei Saleh, S.; Amoushahi, S.; Gholipour, M. Assessment, Spatiotemporal ecological quality assessment of metropolitan cities: A case study of central Iran. Environ. Monit. Assess. 2021, 193, 305. [Google Scholar] [CrossRef]
  46. Agramont, A.; van Cauwenbergh, N.; van Griesven, A.; Craps, M. Integrating spatial and social characteristics in the DPSIR framework for the sustainable management of river basins: Case study of the Katari River Basin, Bolivia. Water Int. 2022, 47, 8–29. [Google Scholar] [CrossRef]
  47. Bell, S. DPSIR = A Problem Structuring Method? An exploration from the “Imagine” approach. Eur. J. Oper. Res. 2012, 222, 350–360. [Google Scholar] [CrossRef]
  48. Carr, E.R.; Wingard, P.M.; Yorty, S.C.; Thompson, M.C.; Jensen, N.K.; Roberson, J. Applying DPSIR to sustainable development. Int. J. Sustain. Dev. World Ecol. 2007, 14, 543–555. [Google Scholar] [CrossRef]
  49. Gari, S.R.; Newton, A.; Icely, J.D. A review of the application and evolution of the DPSIR framework with an emphasis on coastal social-ecological systems. Ocean. Coast. Magement 2015, 103, 63–77. [Google Scholar] [CrossRef]
  50. Iannucci, C.; Munafo, M.; Sambucini, V. Towards Environmental Analytics: DPSIR as a System of Systems. In Advances and New Trends in Environmental Informatics: Stability, Continuity, Innovation; Springer: New York, NY, USA, 2017; pp. 357–368. [Google Scholar]
  51. Lewison, R.L.; Rudd, M.A.; Al-Hayek, W.; Baldwin, C.; Beger, M.; Lieske, S.N.; Jones, C.; Satumanatpan, S.; Junchompoo, C.; Hines, E. How the DPSIR framework can be used for structuring problems and facilitating empirical research in coastal systems. Environ. Sci. Policy 2016, 56, 110–119. [Google Scholar] [CrossRef]
  52. Martins, J.H.; Camanho, A.S.; Gaspar, M.B. A review of the application of driving forces—Pressure—State—Impact—Response framework to fisheries management. Ocean. Coast. Manag. 2012, 69, 273–281. [Google Scholar] [CrossRef]
  53. Theil, H. Economics and Information Theory; North-Holland: Amsterdam, The Netherlands, 1967; Volume 25. [Google Scholar]
  54. Chenery, H.B.; Robinson, S.; Syrquin, M.; Feder, S. Industrialization and Growth; Oxford University Press: New York, NY, USA, 1986. [Google Scholar]
  55. Ma, Y.; Zhu, F.; Wang, K. Research on Environmental Regulation Influence in Shandong Province Regional Economic Development. Adv. Mater. Res. 2012, 524, 3241–3244. [Google Scholar] [CrossRef]
  56. Men, X.-H.; Jin, H.-H. On Population, Resource and Environment in China. In Proceedings of the 2013 International Conference on Public Administration (9TH), VOL II, Cape Town, South Africa, 31 October–2 November 2013; pp. 1071–1081. [Google Scholar]
  57. Tao, A. Environment quality in China: Influential factors analysis based on grey relation theory. In Manufacture Engineering and Environment Engineering, VOLS 1 AND 2; WIT Transactions on Engineering Sciences: Southampton, UK, 2014; Volume 84, pp. 847–851. [Google Scholar]
  58. Wang, D.; Deng, S. Analysis of Shijiazhuang Urbanization Effect on the Ecological Environment. In Proceedings of the Aasri International Conference on Industrial Electronics and Applications (IEA 2015), London, UK, 27–28 June 2015; Volume 2, pp. 535–538. [Google Scholar]
  59. Yang, B.; Li, C.-G.; Liu, Q.; An, X.-L.; Destech Publicat, I.N.C. Study on the Coupling Development Path of New Urbanization and Ecological Environment in Guizhou Province. In Proceedings of the International Conference on Mathematics, Modelling and Simulation Technologies and Applications (MMSTA 2017), Beijing, China, 21–22 May 2017; Volume 215, pp. 556–559. [Google Scholar]
  60. Ye, F.; He, Y.; Yi, Y.; Quan, Y.; Deng, Y. Promotion of environmental regulation on the decoupling of marine economic growth from marine environmental pollution-based on interprovincial data in China. J. Environ. Plan. Manag. 2022, 65, 1456–1482. [Google Scholar] [CrossRef]
Figure 1. Mechanism of spatial spillover effect of industrial structure upgrading on ecological environment quality.
Sustainability 15 15236 g001
Figure 2. The rationalization trend of industrial structure in different regions from 2010 to 2019.
Sustainability 15 15236 g002
Figure 3. The trend of industrial structure optimization in different regions from 2010 to 2019.
Sustainability 15 15236 g003
Figure 4. Eco-environmental quality of provinces in 2010, 2013, 2016, and 2019. Note: The top-left map is the result in 2010, the top-right map is the result in 2013, the bottom-left map is the result in 2016, and the bottom-right map is the result in 2019. The above map is based on the standard map with the review number GS (2020) 4619 downloaded from the standard map service website of the National Bureau of Surveying, Mapping and Geographic Information, and the base map is not modified.
Sustainability 15 15236 g004
Table 1. Construction of ecological environment quality index system.
Target LayerGuideline LayerIndicator LayerWeightsConvergence
Eco-environmental quality indexEcological and environmental pressureIndustrial wastewater discharge per capita (tons/person)0.0131Negative
General industrial solid waste generation (million tons)0.0210Negative
Carbon dioxide emissions per unit of GDP (tons/billion yuan)0.0075Negative
Industrial sulfur dioxide emissions per unit of GDP (tons/billion yuan)0.0069Negative
Nitrogen and oxygen emissions per unit of GDP (tons/billion yuan)0.0124Negative
Ecosystem statusPer capita water resources (m3/person)0.1534Positive
Forest cover (%)0.0889Positive
Park green space per capita (m2/person)0.0361Positive
Per capita domestic waste removal volume (tons/person)0.0444Positive
Ecological responseHarmless disposal rate of domestic waste (%)0.0110Positive
Urban sewage treatment rate (%)0.0075Positive
Nature reserve area as a percentage of the jurisdictional area (%)0.2205Positive
General industrial solid waste comprehensive utilization volume (million tons)0.0980Positive
Total afforestation area as a percentage of jurisdictional area (%)0.2793Positive
Source: China Environment Statistical Yearbook 2010–2019.
Table 2. Statistical description of the sample data variables.
VariablesUnitNumber of SamplesAverage ValueStandard DeviationMinimum ValueMaximum
Value
E 11100.26050.10400.11410.5505
I S R 11100.66160.25530.00011.0000
I S R 2 11100.50230.28930. 00011.0000
I S U 11100.28800.19360.00011.0000
I S U 2 11100.12010.17460.33341.0000
T e c h 10,000 Yuan/person1106.61825.31040.633423.0001
ln P o p People1109.79140.20289.365710.1525
U R %11064.723512.670640.00089.6000
ln T r a d e Billion1107.43771.21074.64169.4581
G o v %11018.26996.148610.582235.0089
Table 3. Baseline regression results.
VariablesE
I S R −0.1068
I S R 2 0.0156
I S U −0.3239 *
I S U 2 0.2652 *
T e c h −0.0004
l n P o p 0.1147
U R 0.0098 **
l n ( T r a d e ) −0.0115
G o v 0.0053 ***
cons−1.3770 *
R 2 0.4461 ***
F21.69 ***
Note: ***, **, and * indicate that the corresponding coefficient values are significant at the 1%, 5%, and 10% levels, respectively.
Table 4. Table of Moran index of ecological quality during 2010–2019.
YearMoranZ-Valuep-Value
20100.2352.1690.030 **
20110.2032.3800.017 **
20120.3322.5420.011 **
20130.3062.7130.007 ***
20140.3082.6980.007 ***
20150.4092.8850.004 ***
20160.2992.4220.015 **
20170.3743.1030.002 ***
20180.3112.8230.005 ***
2019−0.0200.4260.670
Note: *** and **, indicate that the corresponding coefficient values are significant at the 1% and 5% levels, respectively.
Table 5. Spatial econometric model tests.
Dependent VariableHausman TestJoint Significance TestModel Degradation Test (LR)Wald Test
Dual, IndividualDouble, TimeSDM, SARSDM, SEMSDM, SARSDM, SEM
E169.12 ***19.87 ***84.17 ***35.51 ***29.38 ***44.01 ***33.05 ***
Note: ***, indicates that the corresponding coefficient values are significant at the 1% levels, respectively.
Table 6. SDM regression results.
VariablesMainWxDirect EffectIndirect EffectsTotal Effect
I S R −0.1975
(−1.54)
−0.2445
(−0.69)
−0.1836
(−1.54)
−0.1478
(−0.48)
−0.3314
(−0.94)
I S R 2 0.2810 **
(2.13)
0.8006 **
(2.40)
0.2151 *
(1.95)
0.6009 **
(2.12)
0.8160 **
(2.35)
I S U −0.2327
(−1.17)
2.1988 ***
(4.50)
−0.4172 *
(−1.86)
1.9465 ***
(4.08)
1.5293 ***
(3.31)
I S U 2 0.2837 **
(2.42)
−1.4687 ***
(−4.50)
0.4181 ***
(3.08)
−1.3454 ***
(−4.32)
−0.9273 ***
(−3.05)
T e c h −0.0040 ***
(−2.99)
0.0005
(0.26)
−0.0044 **
(−0.36)
0.0017
(0.99)
−0.0026
(−1.44)
l n P o p 0.0640
(0.70)
0.4232 ***
(3.02)
0.0105
(0.09)
0.3685 **
(2.47)
0.3790 ***
(3.93)
U R 0.0061
(1.48)
−0.51 ***
(−5.08)
0.011 **
(2.49)
−0.0456 ***
(−4.82)
−0.0345 ***
(−3.78)
l n ( T r a d e ) −0.0246
(−0.69)
−0.1194 ***
(−2.68)
−0.0134
(−0.36)
−0.0965 **
(−1.96)
−0.1099 ***
(−3.80)
G o v 0.0032
(1.54)
0.0094 ***
(2.81)
0.0024
(1.09)
0.0071 **
(2.34)
0.0095
(3.39)
Spatial Rho−0.2965 **
(−5.59)
Sigma2_e(Variance)0.0001 ***
(7.34)
Note: ***, **, and * indicate that the corresponding coefficient values are significant at the 1%, 5%, and 10% levels, respectively.
Table 7. Industrial structure rationalization threshold test.
Number of ThresholdsF-Statisticp-Value1% Critical Value5% Critical Value10% ThresholdThreshold
Single threshold15.040.003 ***12.66109.11208.06505.9790
Double threshold111.910.000 ***19.781016.457012.3606.0539
Note: ***, indicates that the corresponding coefficient values are significant at the 1% levels, respectively.
Table 8. Industrial structure optimization threshold test.
Number of ThresholdsF-Statisticp-Value1% Critical Value5% Critical Value10% ThresholdThreshold
Single threshold1.420.6634.7093.6163.0815.9790
Double threshold6.170.0707.7536.5505.7987.8016
Table 9. Estimation results of the panel threshold model for industrial structure rationalization.
VariablesE
I S R 2 ( T e c h ≤ 5.9790)0.1123 *
(1.84)
I S R 2 (5.9790 ≤ T e c h ≤ 6.0539)0.5184 ***
(10.38)
I S R 2 (6.0539 ≤ T e c h )0.1232 *
(2.05)
_cons0.1808 ***
(4.57)
Note: *** and * indicate that the corresponding coefficient values are significant at the 1% and 10% levels, respectively.
Table 10. Results of spatial effects by region.
VariablesBohai-Yellow Sea RegionEast China Sea RegionSouth China Sea Region
Direct EffectIndirect EffectsDirect EffectIndirect EffectsDirect EffectIndirect Effects
I S R 1.5184
(1.58)
2.2004
(0.93)
−8.5827 **
(−2.05)
−25.6722 *
(−1.90)
−0.2001
(−0.79)
−0.7100 *
(−1.83)
I S R 2 −1.5929
(−1.41)
3.4656
(1.43)
5.0454 **
(2.14)
14.5241 *
(1.96)
0.2681
(0.89)
0.8817 **
(2.14)
I S U 0.8869
(0.51)
−7.8434 *
(−1.72)
−0.2466
(−1.46)
−0.8577
(−1.52)
0.0660
(0.19)
1.5488 ***
(3.71)
I S U 2 7.7533 *
(1.73)
29.5748 ***
(2.84)
0.0012
(0.07)
0.04615
(0.93)
0.0592
(0.53)
0.5179 ***
(−3.78)
T e c h −0.0143
(−1.16)
−0.0152
(−0.69)
0.0106
(1.10)
0.05287
(1.30)
−0.0181
(−1.32)
0.0394 ***
(−2.69)
l n P o p 0.7018
(1.48)
4.5820 ***
(3.33)
0.2343
(1.02)
0.4144
(0.93)
0.2612
(1.01)
−0.423
(−0.08)
U R 0.0212 ***
(3.38)
−0.0365 **
(−1.98)
0.01660
(1.10)
0.0499
(1.30)
0.0075
(1.11)
−0.0035 **
(−2.94)
l n ( T r a d e ) −0.4329 *
(−1.82)
0.0635
(0.18)
−0.0704
(−0.46)
−0.3861
(−0.42)
−0.1363 **
(2.55)
−0.0720
(−1.16)
G o v −0.0084
(−1.23)
0.0192
(1.61)
0.0196 **
(2.02)
0.03426
(1.54)
0.0052
(1.18)
−0.0099 **
(-2.16)
Note: ***, **, and * indicate that the corresponding coefficient values are significant at the 1%, 5%, and 10% levels, respectively.
Disclaimer/Publisher’s Note: The statements, opinions and data contained in all publications are solely those of the individual author(s) and contributor(s) and not of MDPI and/or the editor(s). MDPI and/or the editor(s) disclaim responsibility for any injury to people or property resulting from any ideas, methods, instructions or products referred to in the content.

