Article

Enrichment of Microbial Consortium with Hydrogenotrophic Methanogens for Biological Biogas Upgrade to Biomethane in a Bubble Reactor under Mesophilic Conditions

by
Apostolos Spyridonidis
1,
Ioanna A. Vasiliadou
1,2,
Panagiota Stathopoulou
3,
Athanasios Tsiamis
3,
George Tsiamis
3 and
Katerina Stamatelatou
1,*
1
Department of Environmental Engineering, Democritus University of Thrace, Vas. Sofias 12, GR-67132 Xanthi, Greece
2
Department of Chemical Engineering, University of Western Macedonia, GR-50100 Kozani, Greece
3
Laboratory of Systems Microbiology and Applied Genomics, Department of Sustainable Agriculture, University of Patras, G. Seferi 2, GR-30131 Agrinio, Greece
*
Author to whom correspondence should be addressed.
Sustainability 2023, 15(21), 15247; https://doi.org/10.3390/su152115247
Submission received: 7 September 2023 / Revised: 17 October 2023 / Accepted: 18 October 2023 / Published: 25 October 2023
(This article belongs to the Special Issue Anaerobic Environmental Biotechnology and Sustainability II)

Abstract

:
The biological upgrading of biogas to simulate natural gas properties contributes to the sustainable establishment of biogas technology. It is an alternative technology to the conventional physicochemical methods applied in biomethane plants and has been studied mainly in thermophilic conditions. Developing an enriched culture for converting the CO2 of biogas to CH4 in mesophilic conditions was the subject of the present study, which could facilitate the biological process and establish it in the mesophilic range of temperature. The enrichment took place via successive dilutions in a bubble bioreactor operated in fed-batch mode. The methane percentage was recorded at 95.5 ± 1.2% until the end of the experiment. The methane production rate was 0.28–0.30 L L−1 d−1 following the low hydrogen loading rate (1.2 ± 0.1 L L−1 d−1) applied to avoid acetate accumulation. Hydrogenotrophic methanogens, Methanobrevibacter sp., were identified at a proportion of 97.9% among the Archaea and 60% of the total population of the enriched culture. Moreover, homoacetogens (Sporomusa sp.) and acetate oxidizers (Proteiniphilum sp.) were also detected, indicating that a possible metabolic pathway for CH4 production from CO2 is via homoacetogenesis and syntrophic acetate oxidation, which kept the acetate concentration at a level of 143 ± 13 mg L−1. It was found that adding NaHCO3 was adequate to sustain the pH at 8.25.

1. Introduction

Anaerobic digestion (AD) is one of the most popular treatment technologies for wastes with high organic content, promoting sustainability via environmental protection and agricultural recycling and providing a renewable fuel, i.e., biogas [1]. Biogas is mainly composed of methane (50–70%) and carbon dioxide (30–50%), but also contains traces of other gases, such as hydrogen sulfide (H2S). Biogas enrichment in methane results in biomethane production (above 95% in CH4) that resembles natural gas (NG) and can be injected into the NG network or used in compressed/liquid form for vehicle fuel. The resemblance of biomethane to NG offers multiple advantages: utilization of the existing NG infrastructure (pipeline and refuel station networks) and end-user assets (power generation, domestic heating/cooling, and transportation). During the last decade, the European biomethane sector has been developing rapidly; its production has grown from 0.5 billion cubic meters in 2011 to 3.5 billion cubic meters in 2021 [2], while by 2025, it is clear that biomethane could cover a significant portion of the surging demand [3].
The potential of the biomethane substitute for NG promotes independence from NG providers, makes energy more affordable since it is cheaper than NG, leads to greenhouse gas (GHG) emission reduction and contributes to effective waste management by considering any form of organic waste as a resource [4]. However, economic sustainability relies on further cost reduction (to be feasible even in undeveloped countries) and revenues for which government incentives (e.g., subsidies or feed-in tariffs) play a crucial role [5]. Promoting sustainability necessitates that incentives be carefully designed to protect land usage for food production, encourage decentralized biomethane plants to grow by exploiting local resources [6], and develop industrial symbiosis models for effective resource sharing [5,7,8]. Moreover, the social aspect of the green energy transition via biomethane and biomethane production at the local level are crucial factors encouraging the formation of biomethane communities [5] in proportion to the energy communities already established at the European level [9].
Biomethane is currently produced via physicochemical methods. Alternatively, biogas can be upgraded biologically under mild temperature and pressure conditions without chemicals, resulting in further promotion of the sustainability of the AD process [10]. During the biological upgrading of biogas, H2 (Equation (1)), which should be provided from an external source, serves as an electron donor used by hydrogenotrophic methanogens (that belong to Archaea) in order to reduce the CO2 present in biogas to CH4 [11,12]. In this way, almost all carbon contained in the organic wastes is utilized, offering an option of utmost importance to exploit all available carbon from biomass, the demand, and therefore, the price of which, increases due to the increasing numbers of biogas plants [10,13]. Moreover, the biological upgrading of biogas increases renewable energy production, and the CO2 in the biogas is sequestrated. The sustainability of the process depends on the form of energy used to produce the hydrogen. In this sense, H2 should be produced using renewable energy, e.g., via water electrolysis powered by the residual electricity from windmills or solar panels. Hydrogen compression, as an energy-intensive process, can be problematic [14], so its direct use for CO2 reduction to methane is an alternative to hydrogen storage. In addition, this method delivers the surplus energy from wind turbines or photovoltaic modules via the new “power to gas” technology (P2G) [15,16,17]. Therefore, biogas upgrade via hydrogenation offers multiple benefits such as developing flexible sustainable energy systems and relieving the high stress on biomass supply, which have rather a long-term impact on the future of anaerobic digestion [10,13].
4 H 2 + C O 2 C H 4 + H 2 O Δ G ° = 130   kJ   mol 1
Biogas upgrade can be achieved either in situ or ex situ. Regarding the in situ method, biogas upgrade and AD are coupled and occur inside the AD reactor, but have several drawbacks leading to pH increase and potential volatile fatty acid (VFA) accumulation. On the other hand, ex situ biogas upgrade takes place in a separate reactor fed on biogas and H2 [17,18]. The ex situ method is more appealing due to its simplicity; the degradation of organic matter is achieved separately in the AD reactor, making both processes more efficient [19,20,21].
Ex situ biogas bio-upgrade has been extensively studied to optimize crucial operating parameters, such as pH, temperature, hydrogen loading rate, gas recirculation rate, etc. [22,23,24,25,26]. Another critical factor is the microbial community structure developed during the process. It is possible for acetate to be produced by homoacetogens (Equation (2)). Therefore, in addition to the hydrogenotrophic methanogens that convert H2 and CO2 into CH4, acetoclastic methanogens (converting acetate to methane, Equation (3)) have also been identified [27,28].
4 H 2 + 2 C O 2 C H 3 C O O H + 2 H 2 Δ G ° = 75.4   kJ   mol 1
C H 3 C O O H C H 4 + C O 2 Δ G ° = 55   kJ   mol 1
The synthesis of the prevailing microbial consortium depends on the initial microbial seed used for the bioreactor’s inoculation and the operating conditions [29,30]. Usually, the inoculum comes from AD full-, pilot- or lab-scale bioreactors [19,23,31]. Most studies focusing on ex situ bio-upgrade reactors reported that hydrogenotrophic methanogens represented less than 10% of the total microbial community [11,13,19].
The high microbial diversity in the initial inoculum cannot be sustained during the operation of biomethanation reactors since they are fed only on CO2 and H2 [30,32,33]. Generally, it has been pointed out that the rich microbial diversion in the inoculum can enhance methane productivity, minimizing acetate accumulation [34].
In addition to hydrogenotrophic methanogens, homoacetogenic species, such as Moorella thermoacetica, Thermoanaerobacter kivui, and Acetobacterium woodi, belonging to the phylum Firmicutes have also been identified in biogas upgrade reactors [13,19,29,32]. It is possible for homoacetogenesis to happen (Equation (2)), and acetate is then transformed to CH4 (Equation (3)) [29]. The development of homoacetogenic species during the bio-upgrade process may increase the concentration of acetate, reducing the pH to inhibitory levels (pH < 6.5) and the biomethanation efficiency [13,35]. On the other hand, acetotrophic methanogens have rarely been identified [32], while syntrophic acetate-oxidizing bacteria (SAOB) seem to play a key role in the process, converting the acetate back to H2 and CO2 [25].
Establishing archaeal communities in a biomethanation system could help avoid interference from microorganisms not involved in methanogenesis. To our knowledge, no studies of biological biogas upgrading report the hydrogenotrophic Archaea as the predominant microorganisms due to the operating conditions applied for enrichment [19,27,29]. Most studies focus on thermophilic biomethanation. The reported proportions of the microbial communities established are derived from cultivation-independent methods and express the relative abundance, which does not reveal the active microorganisms. Therefore, the present study aimed to enrich a microbial consortium with hydrogenotrophic methanogens in mesophilic conditions by depleting the microorganisms that were not evolved in biomethane production through successive dilution cycles. The effect of the initial hydrogen concentration in each fed-batch cycle and the pH adjustment strategies were studied to enhance the metabolic pathway of hydrogenotrophic methanogenesis. A cultivation-independent approach was applied to assess the impact of the operating conditions on the microbial community dynamics. Different time points were chosen for 16S rDNA NGS (next-generation sequencing) profiling to describe the relative abundance of phyla/genera of Bacteria and Archaea. Thanks to these molecular methods, such as NGS, it is currently widely understood that microbial species might be very diverse depending on the conditions, and the predominance of different phyla/genera can significantly impact the stability and efficiency of the processes.

2. Materials and Methods

2.1. Inoculum and Nutrient Media Preparation

The inoculum used for the start-up of the bioreactor was in a slurry form and was taken from a full-scale anaerobic digester treating agro-industrial wastes, such as cow and chicken manure and corn silage, under mesophilic operating conditions. The slurry biomass was sieved through a 2 mm sieve to remove the large particles before inoculation. It contained volatile solids (VS) at a concentration of 31.07 gVS L−1 and was added in a nutrient medium (protocol ATCC 2601) at a ratio of 30% v/v, according to Kougias et al. [29], excluding NaHCO3 to avoid the abiotic production of CO2. The nutrient medium composition is reported in the Supplementary Materials (Table S1).

2.2. Experimental Setup

A borosilicate glass column (internal diameter: 5.5 cm, height: 105 cm) with a working volume of 2 L and a gas phase of 0.92 L was used for the biomethanation process. The ratio of the column height to its cross-section was approximately equal to 16:1. The reactor was filled with 2 L of diluted biomass in the nutrient medium (Table 1) and was sparged with N2 to remove air. The bioreactor was operated in fed-batch mode at 39 ± 1 °C. A gas mixture (ca. 9 L) consisting initially of 59.7% v/v H2, 24.2% v/v CH4, and 16.2% v/v CO2 was stored in a gas-tight aluminum bag and used to feed the bioreactor. The volumetric ratio of H2:CO2 (3.7:1) was lower than the stoichiometric ratio (4:1) to provide a slight surplus of CO2 to secure the complete consumption of H2. The ratio of CH4 to CO2 resembled the biogas composition (1.5/1 or 60:40). On the 15th day, the feeding gas mixture was diluted with N2 to avoid acetate accumulation. Therefore, the new composition was changed to N2:H2:CH4:CO2 = 50.0:29.8:12.2:8.0 and kept until the experiment’s end. The effluent gas was mixed with the feeding gas in the gas-tight aluminum and was pumped to the bottom of the bioreactor via a commercial stone diffuser at a rate of 4 L LReactor−1 h−1 (Figure 1). As soon as H2 and CO2 were consumed, the aluminum bag was refilled with a fresh gas mixture. The enrichment of the microbial consortium with hydrogenotrophic methanogens was achieved through successive dilution cycles. At the end of each cycle, the mixed liquor was removed and diluted with a fresh nutrient medium at a ratio of 1:2 (mixed liquor from the reactor/nutrient medium) from start-up until the 28th day. Each dilution cycle lasted 9–10 days until the VSS concentration decreased to 0.27 g L−1 (28th day). After the 28th day, each dilution cycle lasted until the VSS concentration in the bioreactor increased to 0.5 g L−1, and the dilution ratio became 1:1.

2.3. Analytical Methods and Calculations

Total solid (TS), total suspended solid (TSS), volatile solid (VS), and volatile suspended solid (VSS) concentrations were determined according to standard methods [36] The electrical conductivity and pH were measured via an electrical conductivity meter (Crinson CM 35) and a pH meter from HANNA Instruments (HI 83141, HANNA instruments Hellas, Athens, Greece), respectively. The concentration of volatile fatty acids (VFAs) was determined via a gas chromatograph equipped with a Flame Ionization Detector (FID), using helium as a carrier gas, according to [37]. The composition of the gas mixture was analyzed using a gas chromatograph equipped with a Thermal Conductivity Detector (TCD) using argon as a carrier gas to achieve high precision in the hydrogen measurement. An isothermal temperature program at 100 °C was applied, while the temperature at the injector and the detector was set at 210 °C. Finally, the gas volume produced was determined by adopting the displacement principle of an equivalent liquid volume.
The CH4 production rate (L L−1 d−1) was determined based on Equation (4), where CH4,eff (L L−1 d−1) and CH4,in (L L−1 d−1) are the effluent and influent rates of CH4, respectively.
C H 4 , p r o d u c e d = C H 4 , e f f C H 4 , i n
The H2 utilization efficiency (%) was calculated according to Equation (5), where H2,in (L L−1 d−1) and H2,eff (L L−1 d−1) are the influent and effluent rates of H2, respectively. The CO2 utilization efficiency (%) was similarly calculated.
η H 2 = H 2 . i n H 2 , e f f H 2 , i n · 100

2.4. DNA Extraction and 16S rDNA Amplification

Samples (three replicates) from the mixed liquor of the bioreactor were collected on day 0 (start-up inoculum), 15 (2nd dilution), 135 (8th dilution), and 171 (end of the experiment). They were stored at −20 °C. The DNA extraction from each sample was performed using a commercial Kit (HigherPurity Soil DNA Isolation Kit, Canvax Reagents SL, Valladolid, Spain). The quantity and quality of the extracted DNAs were analyzed using a Q5000 micro-volume UV-Vis spectrophotometer (Quawell Technology, San Jose, CA, USA). DNA samples were stored in Eppendorf tubes at −20 °C until further analysis.
16S rDNA amplification was performed in triplicate using a KAPA Taq Polymerase kit (Roche, Basel, Switzerland). The hypervariable V3-V4 region of the bacterial 16S rRNA gene was amplified using MiSeq universal primers 341F and 805R [38]. The final volume of the reaction was 25 μL and it contained KAPA Taq Buffer (10×) at a final concentration of 1×, dNTP mix solution (200 μM each), forward and reverse primer solutions (0.4 μM), 0.5 U of KAPA Taq DNA polymerase (5 U/μL), ≤100 ng from the template DNA solution, and sterile deionized water. The amplification protocol included 3 min of incubation at 95 °C followed by 35 cycles of 95 °C for 30 s, 55 °C for 30 s, and 72 °C for 1 min, and a final 3 min extension at 72 °C. Targeted variable regions (V3–V5) of the archaeal 16S rRNA gene were amplified with the MiSeq primer pair 519F and 915R [38]. The mastermix was performed as mentioned above, and the protocol was as follows: 3 min denaturation at 95 °C; 35 cycles of 95 °C for 20 s, 57 °C for 15 s and 72 °C for 45 s, and 3 min of the final elongation step at 72 °C. Negative and positive controls were always measured at the same time.
The resulting PCR products were separated in 1.5% (w/v) agarose gel in TAE buffer (40 mM Tris-acetate, 1 mM EDTA), while the amplification product (approximately 550 bp) was visualized using Bio-Rad’s Gel Doc XR+ system. The desired amplicons were purified from unincorporated primers and nucleotides with a 20% PEG, 2.5 M NaCl solution, and centrifuged at 14,000× g for 20 min [39]. The precipitate was washed twice with 125 μL of a 70% v/v ethanol solution and centrifuged at 14,000× g for 10 min. The dried precipitates were suspended in 15 μL of sterile deionized water, and the concentration was measured using a Q5000 micro-volume UV–Vis spectrophotometer (Quawell Technology, San Jose, CA, USA).

2.5. Library Preparation and Illumina MiSeq Sequencing

The purified PCR amplicons, diluted up to 10 ng/μL, were used as templates for further amplification, to include the indexes (barcodes), as well as the Illumina adaptors, in a 50 μL volume containing 5 μL KAPA Taq buffer 10×, 0.4 μL dNTPs (25 mM), 0.2 μL of KAPA Taq DNA polymerase, 5 μL of the forward index primer (10 μM), 5 μL of the reverse index primer (10 μM), 2 μL of the cleaned PCR product diluted up to 10 ng/μL, and 32.4 μL of sterile deionized water. The combinatorial use of index primers resulted in unique samples pooled and sequenced on one Illumina MiSeq run. The indexed amplicons were cleaned using the NucleoMag NGS (next-generation sequencing) clean-up and size selection kit (Macherey-Nagel, Düren, Germany), according to the manufacturer’s recommendations. From all samples examined, the indexed amplicons were mixed in an equimolar ratio (8 nM), and the sequencing was performed by Macrogen using a 2 × 300 bp pair-end kit on a MiSeq platform. The raw reads were deposited into the NCBI Sequence Read Archive database (accession number: PRJNA993457).

2.6. Bioinformatics Analysis

Raw sequencing reads were demultiplexed and converted to FASTQ, and the Illumina adapters were trimmed using Illumina standard algorithms. The bioinformatics analysis was performed using a combination of USEARCH v.11 [40] and Qiime2 distribution 2019.1 [41]. Paired-end reads were assembled and trimmed by length using the usearch -fastq_mergepairs command. The quality of assembled sequences was improved using -fastq_filter, followed by the -fastx_uniques command to detect unique read sequences and their frequencies. Then, assembled reads were clustered into operational taxonomic units (OTUs) at 97% sequence similarities using the cluster_otus command based on the UPARSE algorithm [42]. Crosstalk errors were identified and filtered using the -uncross command based on the UNCROSS2 algorithm [43]. Taxonomy was assigned to the representative sequences of the OTUs in Qiime2 based on the BLAST+ algorithm [44] and searching against the SILVA 138 release database [45] with a 0.91% identity as the cutoff.
Alpha diversity indexes included richness (Chao1), diversity (Simpson and Shannon), dominance (Berger–Parker), and evenness (Pielou), which reflect the diversity of individual samples. These indexes were calculated using the “vegan” R package [46] and were plotted using the “ggplot2” R Package [47]. Pairwise ANOVA was used to identify significant differences in alpha diversity indices between groups.
Between samples, diversity was calculated based on the Generalized UniFrac distance [48] using the GUniFrac R package [49]. Principal coordinate analysis (PCoA) was performed on the resulting dissimilarity matrix. Statistically significant differences between samples were identified via permutational multivariate analysis of variance (PERMANOVA) [50] using 999 permutations. PCoA analyses and PERMANOVA test were performed using PRIMER version 6, and PERMANOVA+ was used for PRIMER routines [51,52]. A p-value < 0.05 was considered indicative of statistical significance.

3. Results

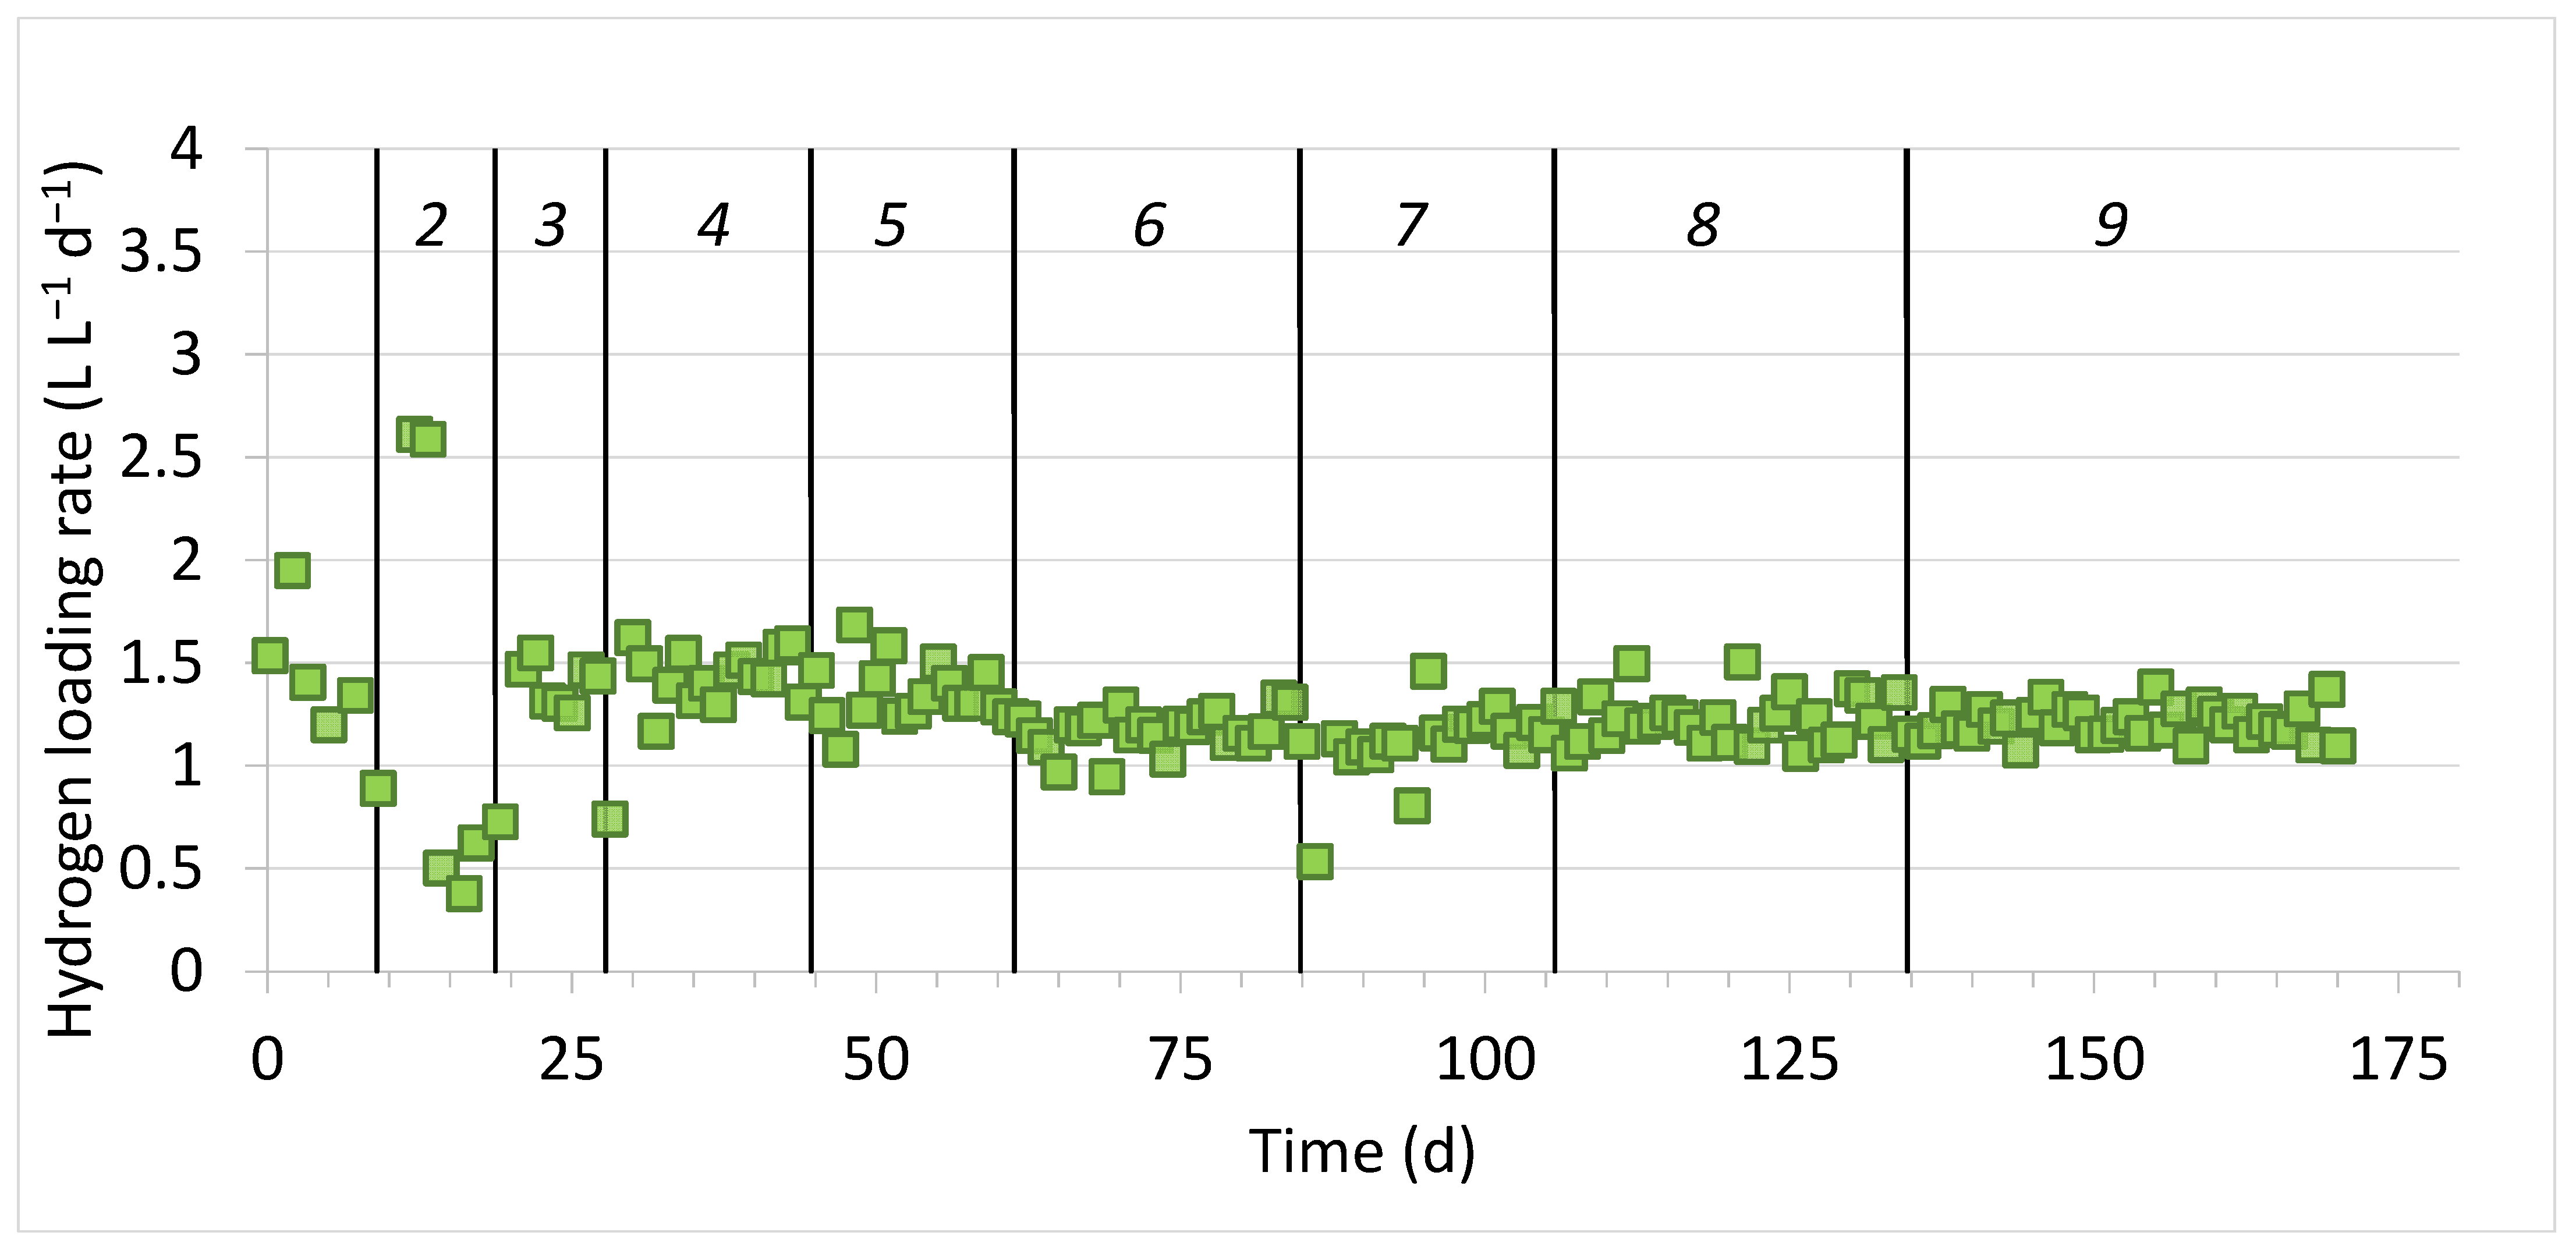
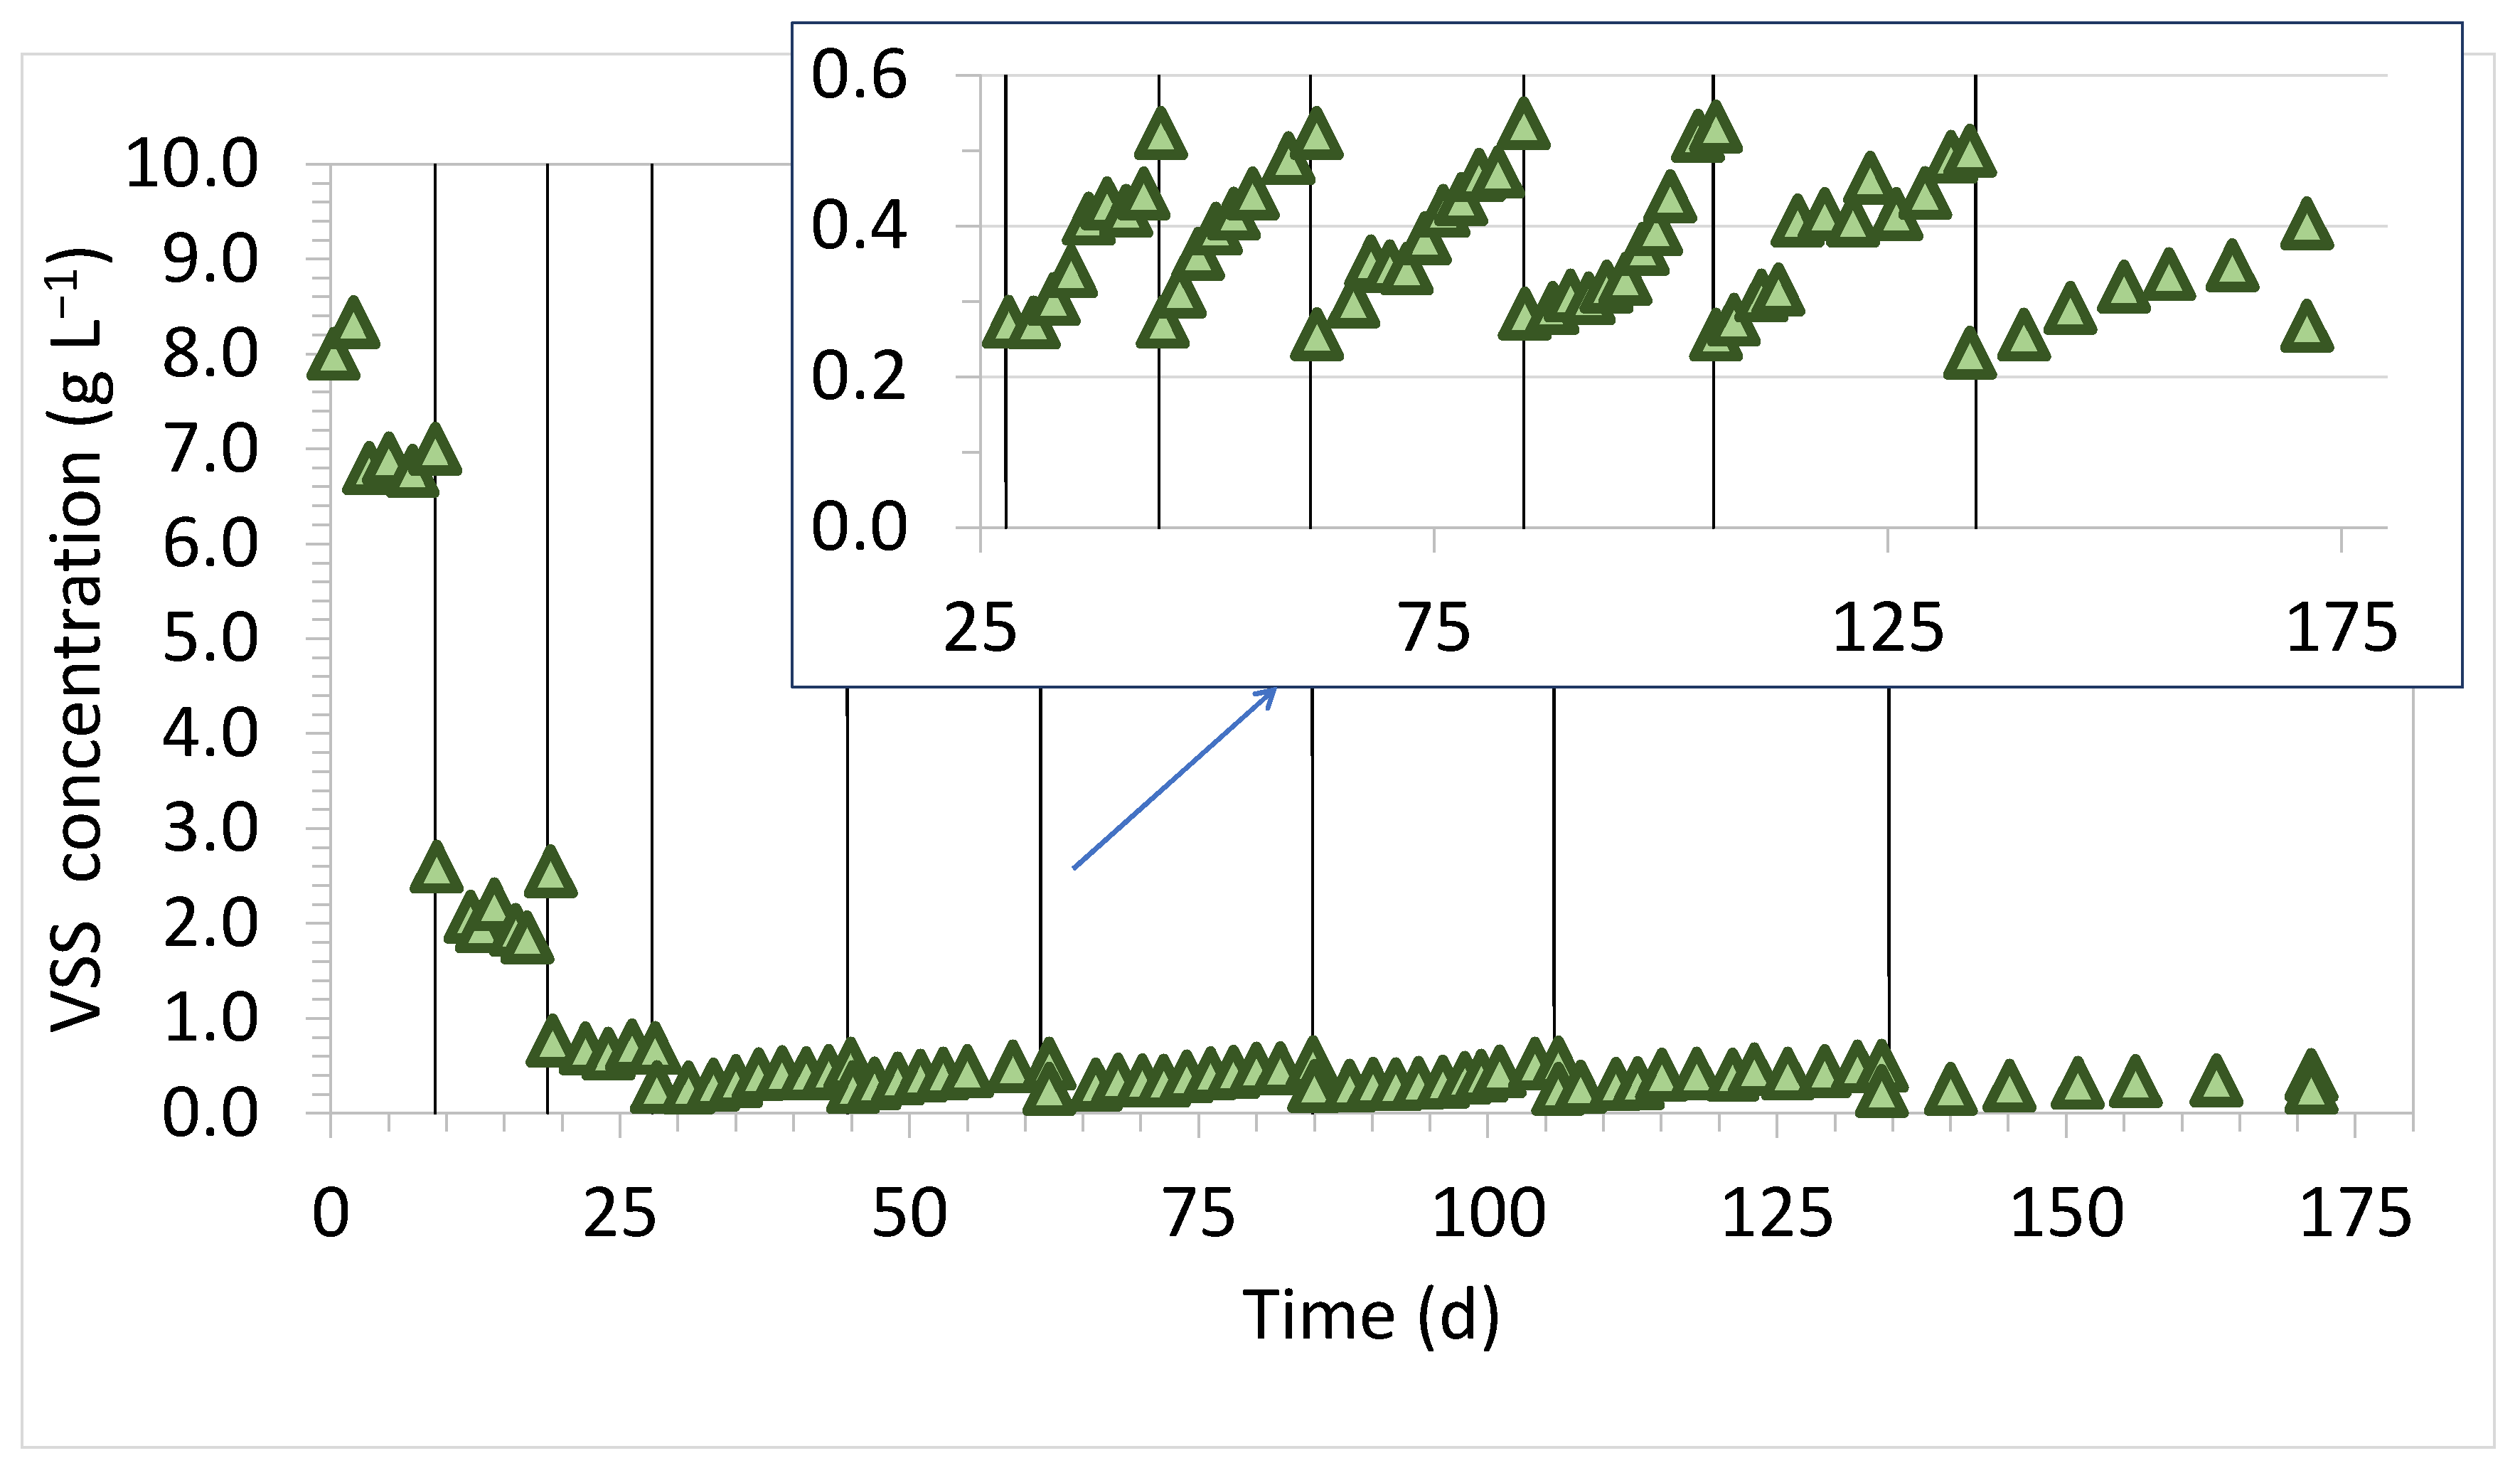
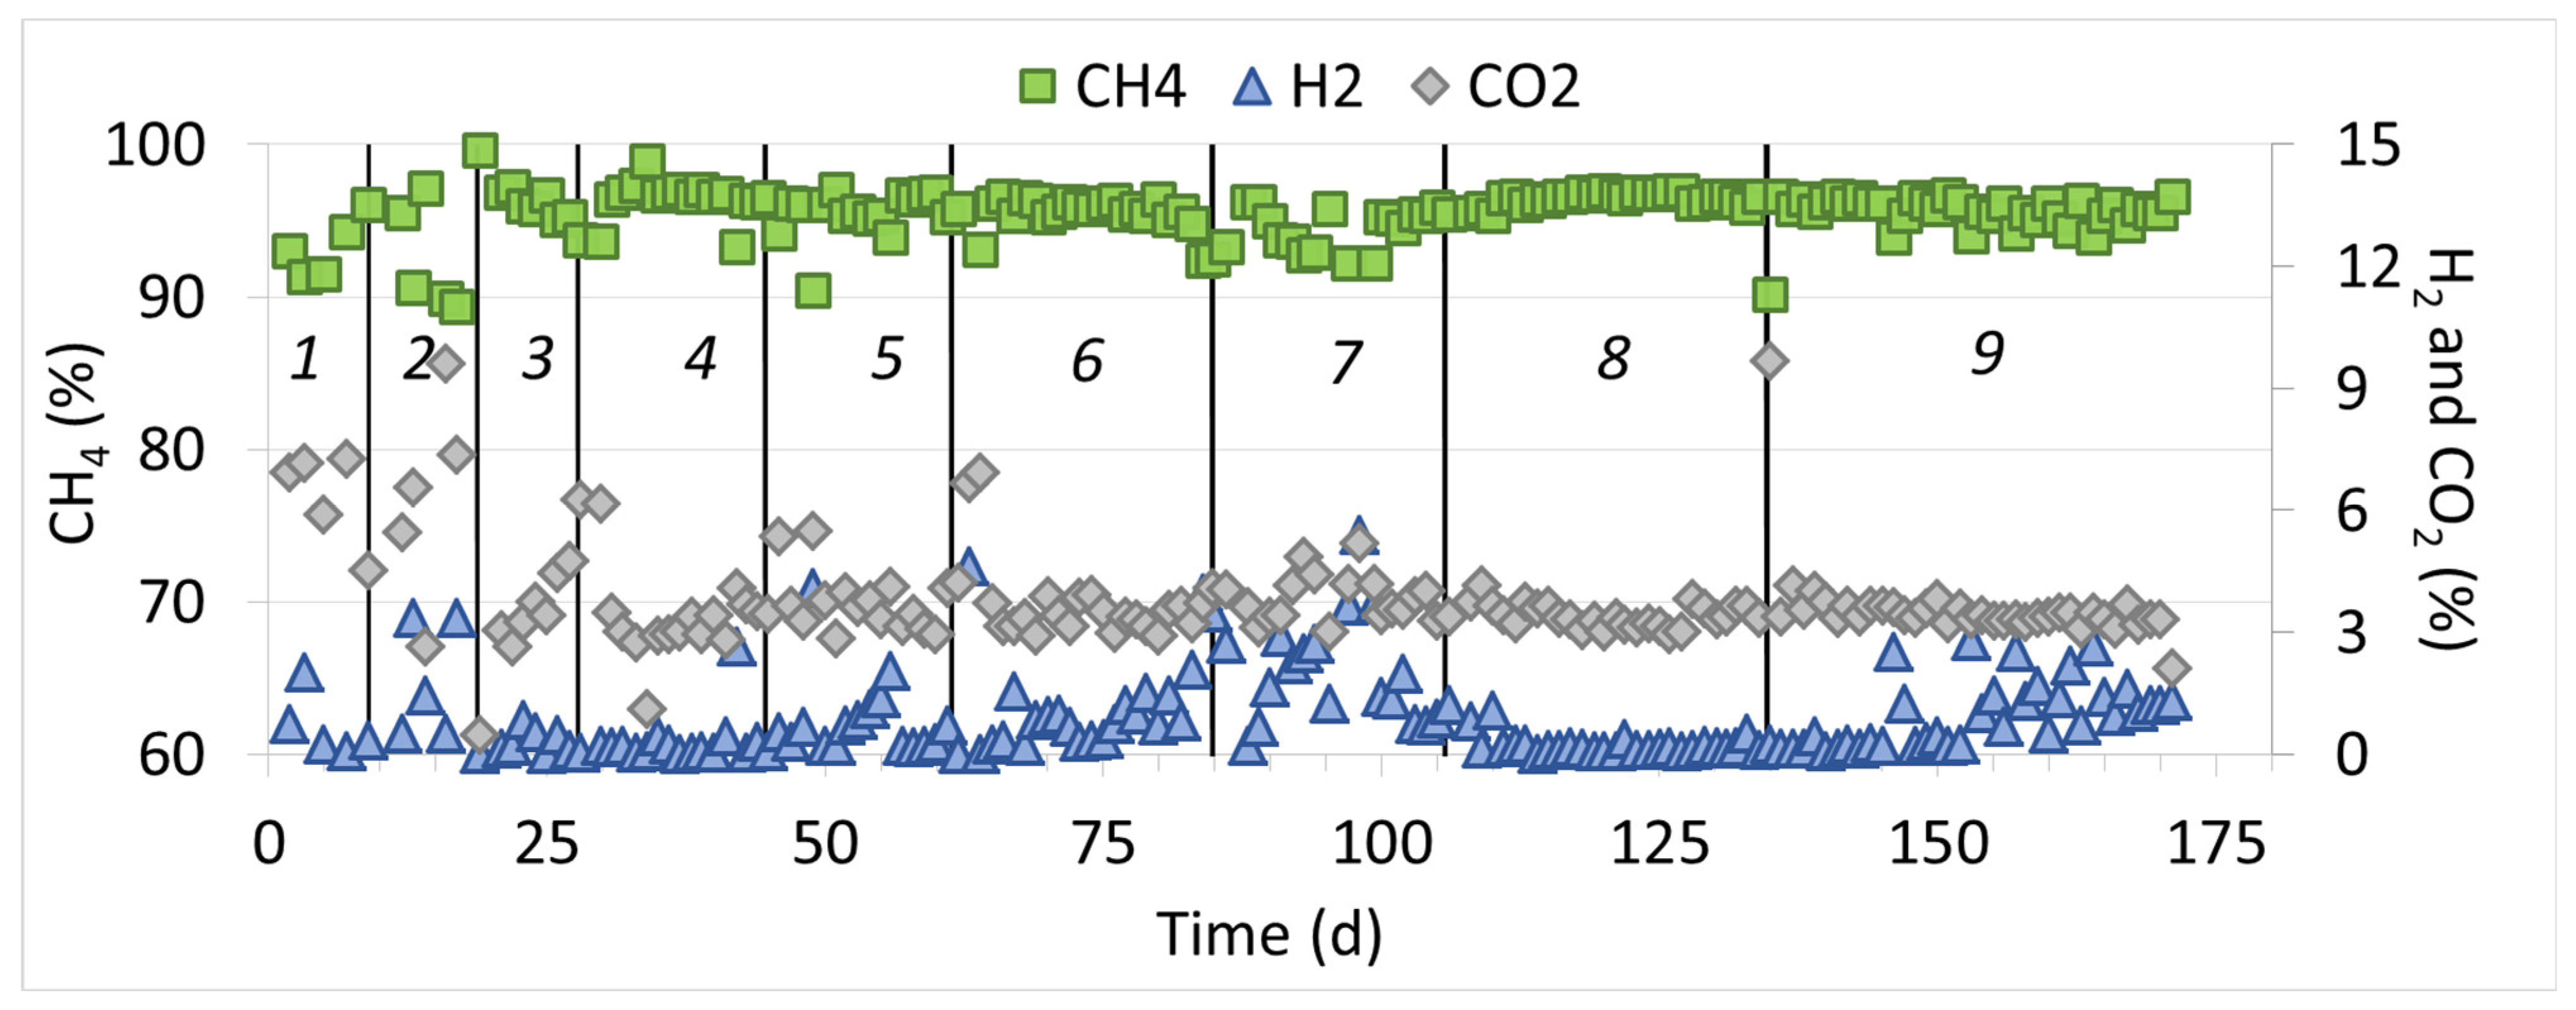
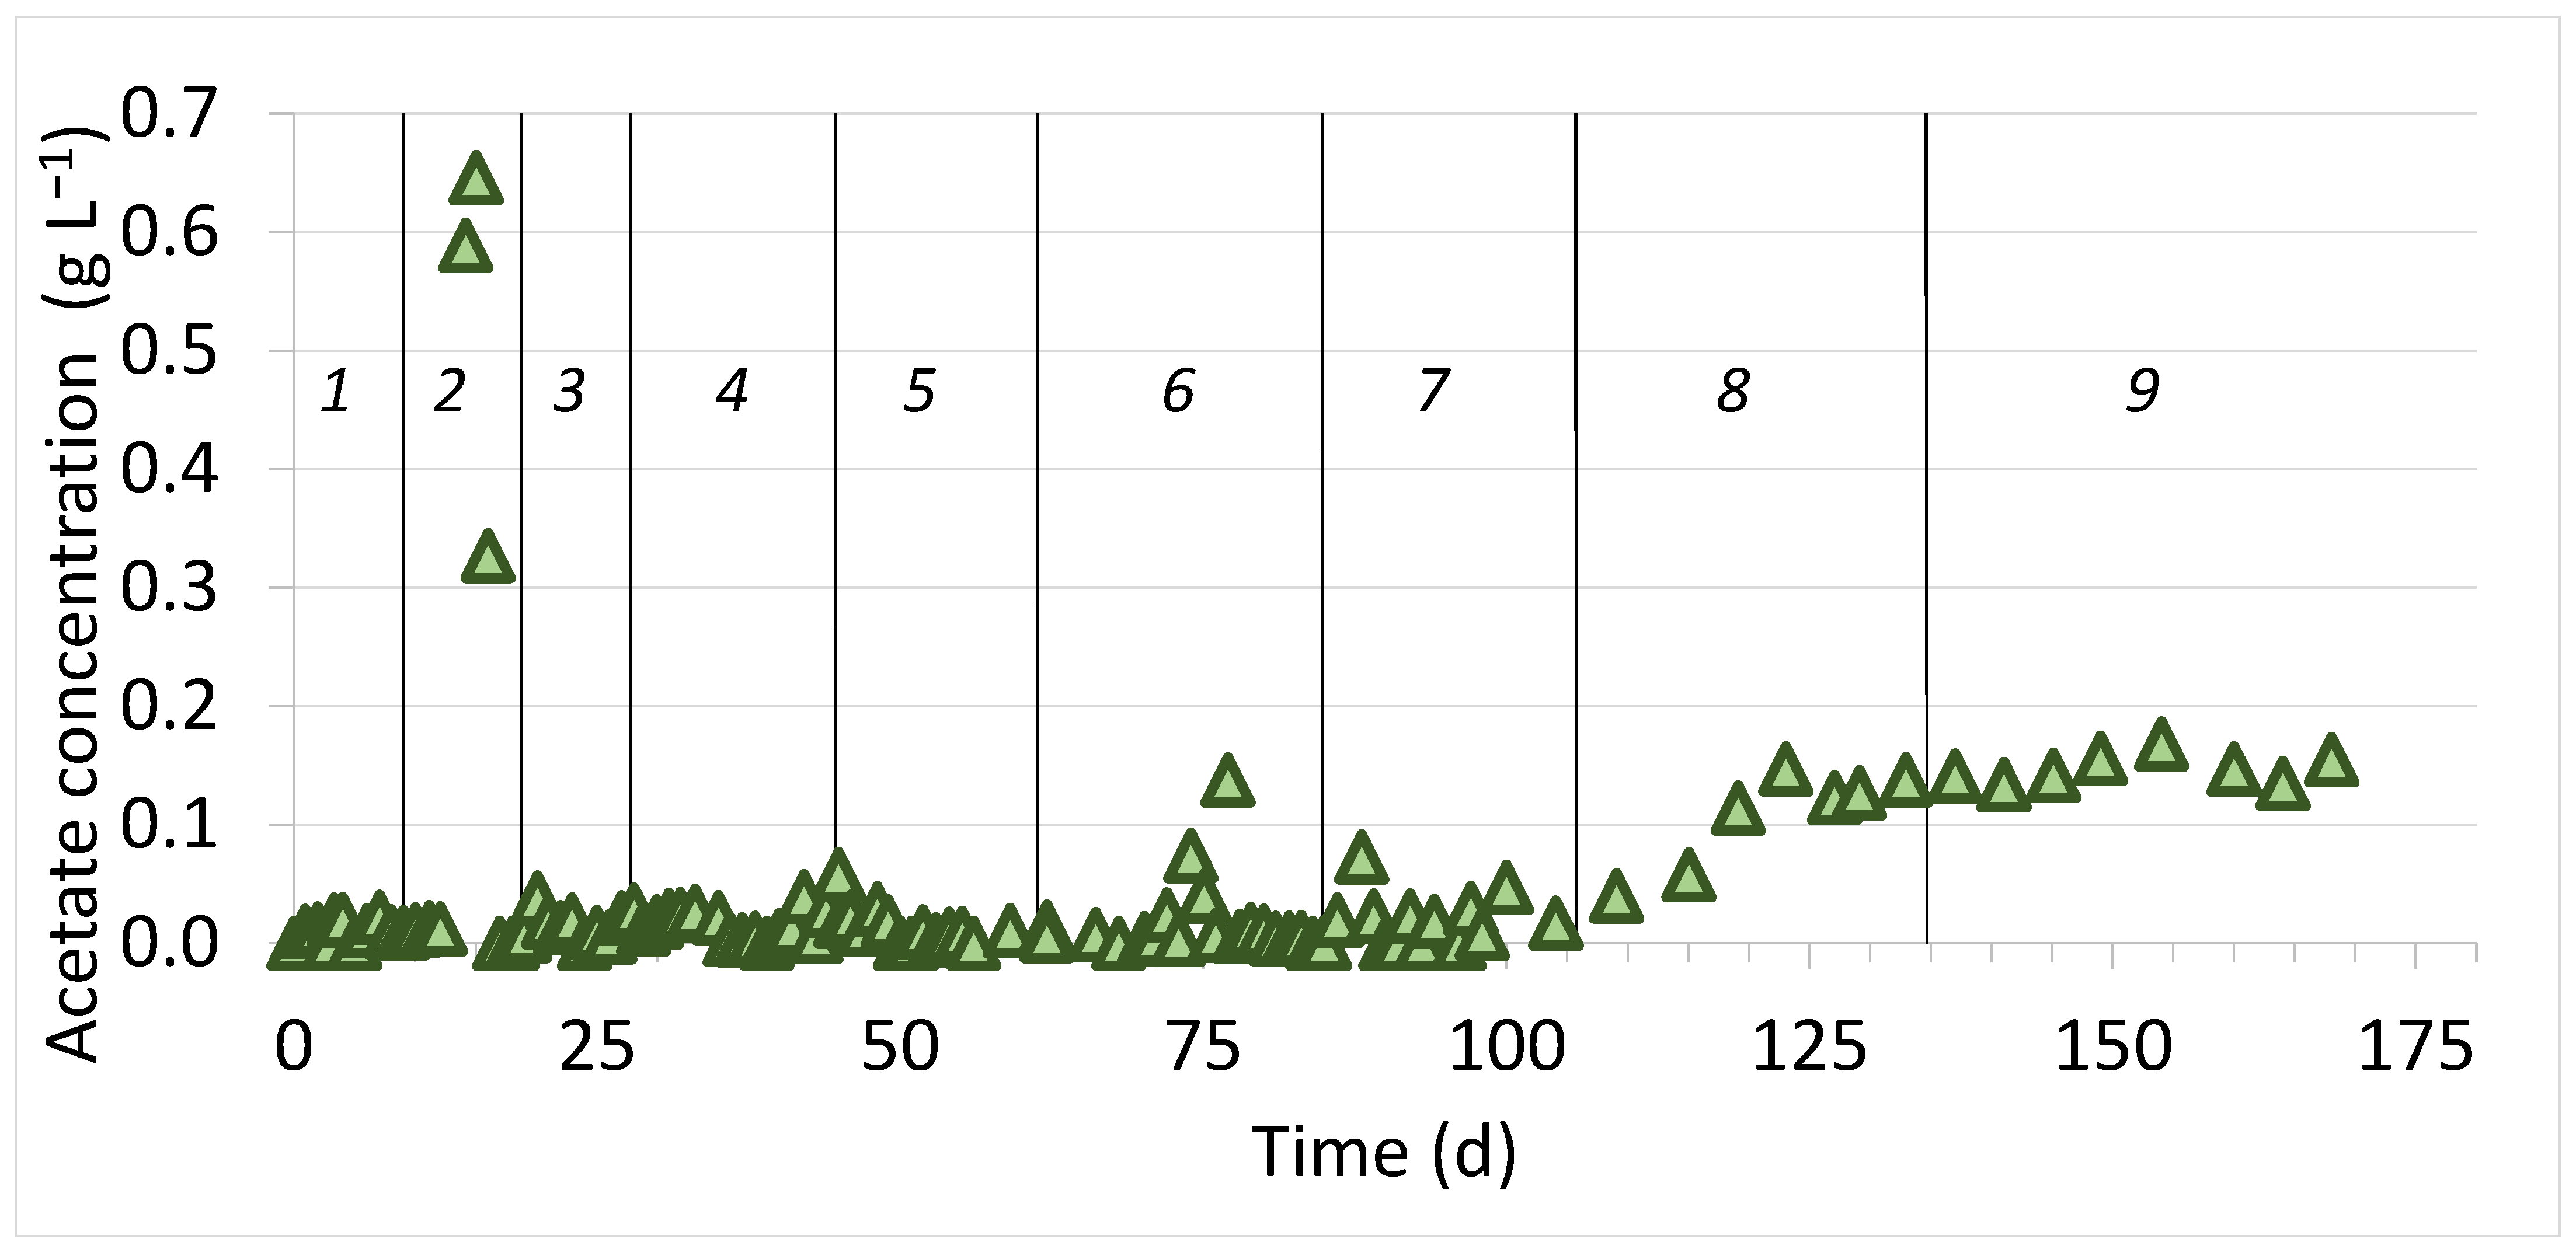
3.1. Bioreactor’s Performance

The bioreactor operated under a fed-batch mode while fed on a gas mixture containing synthetic biogas and hydrogen. The hydrogen was present at a slightly lower ratio (i.e., 3.7:1) than stoichiometrically required (i.e., 4:1) to secure its complete conversion. The synthetic biogas was at typical composition (CH4:CO2 = 60:40). Therefore, the composition of the three-part gas mixture entering the bioreactor was H2-59.7:CH4-24.2:CO2-16.2. The feeding mixture was inserted into the bioreactor at atmospheric pressure since the exit gas was recirculated via the feeding gas-tight aluminum bag (Figure 1). Gas recirculation provided mixing, bringing the gas in contact with the microorganisms growing in suspension in the liquid. When the hydrogen was below 3%, the gas mixture was removed and replaced with a fresh feeding mixture. As a result, the hydrogen loading rate (HLR) and the gas retention time (GRT) varied, as depicted in Figure 2 and Figure 3, respectively. Initially, the variation was more intense due to technical issues during the start-up of the bioreactor and the non-acclimatized methanogens to high concentrations of H2. The GRT applied varied within a typical range of 2–16 h while the HLR was close to the lower limit of the typical range of 1–8 L L−1 d−1 [11]. Since, in most cases, the hydrogen content of the gas mixture at the end of each fed-batch cycle was below 0.5%, the duration of each cycle could be shorter if the starting of each fed-batch cycle did not occur manually. However, automation, which could result in lower GRT levels and higher HLR values, was not possible in this experimental setup.
The dilution (vertical lines in Figure 4) resulted in an abrupt decrease in the VSS concentration. From the fourth dilution cycle onwards, the operation of the fed-batch bioreactor continued until the VSS concentration reached 0.5 g L−1. As the enrichment proceeded through the successive dilution cycles, the VSS increase rate was slower (Table 2), probably due to the prevalence of the methanogens, which are slow-growing microorganisms [53]. Moreover, it was noticed that the color of solids in the bioreactor changed from dark brown to off-white towards the end of the experiment. The bioreactor walls were covered quickly with biomass despite it being washed off at every dilution cycle. However, only the suspended VSS could be sampled and measured. Therefore, the actual concentration of the volatile solids (suspended and attached to the wall) was higher than depicted in Figure 4.
During the enrichment process, the H2 conversion achieved was high (99.5 ± 0.6%). Initially, the percentage of CH4 in the gas mixture at the end of the fed-batch operation was 93.2 ± 2.0 (Figure 5). During the second dilution cycle, the acetate started to accumulate, reaching a concentration as high as 700 mg L−1 (15th day) (Figure 6). The acetate accumulation was attributed to the high H2 concentration (59.7%) entering the bioreactor at the beginning of each fed-batch cycle. Therefore, in order to enhance the growth of hydrogenotrophic methanogens and to reduce acetic acid accumulation, H2 concentration in the feed was decreased to 29.8% by adding pure nitrogen (N2) to the feeding gas (N2:H2:CH4:CO2 = 50.0:29.8:12.2:8.0). It should be noted that in order to directly compare the results before and after adding the N2 to the gas mixture, the percentages of H2, CH4, and CO2 in the gas effluent were calculated by subtracting the N2, considering that it is inert and does not participate in the process. Therefore, Figure 5 depicts the composition of the three-part gas mixture (CH4, CO2, H2). Comparing the CH4 produced under high and low H2 concentrations in the feed shows that feeding H2 at low concentrations increased the CH4 percentage from 93.2 ± 2.0 to 95.5 ± 1.2% (Table 3), while the acetate concentration decreased (Figure 6). During the eighth dilution cycle, the acetate started to accumulate again and stabilized at 143 ± 13 mg L−1 without affecting the conversion of CO2 to CH4. Table 3 shows the high standard deviation of the average CH4 production rate and the H2 and CO2 utilization efficiencies during the second cycle.
pH significantly affects the bio-upgrade process [10], with an optimum range of 7–8. As shown in Figure 7, the pH remained constant for 28 days until the fourth dilution cycle (8.21 ± 0.18). Since no buffer agent was added to the reactor (e.g., NaHCO3), the successive dilution cycles led to a gradual decrease in the bioreactor’s buffering capacity. As a result, the pH decreased to 6.89 on the 104th day of operation (end of the seventh dilution cycle). In order to prevent any further pH drop below 6.5, which would severely affect microbial activity [54], NaOH was added daily (1 N, 0.5 mL per d). Even though the pH was kept constant (7.15 ± 0.15) until the 135th day (end of the eighth dilution cycle), a gradual accumulation of acetic acid was observed (Figure 6). To avoid adding NaOH daily and check if NaOH addition caused the acetate accumulation, NaHCO3 was included in the nutrient medium, as proposed initially by Kougias et al. (2017) [29]. Therefore, NaHCO3 was added once at the beginning of the ninth dilution cycle with the nutrient medium at a concentration of 1.56 g L−1. The pH rose to 8.27 ± 0.14, which was maintained until the end of the experiment. However, the pH rise due to NaHCO3 addition did not cause a decrease in the acetic acid concentration, which remained as high as almost 150 mg L−1. The presence of acetate indicated that a new balance had been established in the bioreactor. Moreover, the NaHCO3 addition did not affect the CO2 level in the gas effluent.

3.2. Prokaryotic Community Composition

Upon applying Illumina high-throughput sequencing of 16S rRNA gene amplicons, the bacterial and archaeal community composition and diversity of four critical points during the enrichment experiment were examined. The first sample was taken at the beginning of the experiment (inoculum). The second sample was taken on the 14th day (second dilution cycle) when the acetate was accumulated, indicating that homoacetogenesis may have occurred. The third sample was taken on the 135th day (eighth dilution cycle) when the acetic acid increased again. The fourth sample was taken at the end of the experiment (171st day) to assess whether the pH adjustment via NaHCO3 could affect the microbial community.
The microbial community during start-up was composed mainly of bacteria, accounting for an average of 70.6% (±13.2) of the total prokaryotic population, while the remaining 29.3% (±13.2) was attributed to Archaea (Figure S1). The bacterial population was found to decrease over time in response to the adaptation of the microbial communities to different environmental factors. On the contrary, Archaea, confirming their crucial role in biogas production, were present as a notable and stable fraction (>54%) of the mature reactor microbiome. The Bacteria/Archaea ratio varied during the adaptation process, with a ratio of ~0.5 in the third sample (135th day).
After sequencing and quality filtering, the bacterial reads were divided into 92 OTUs. Based on a 97% sequence similarity, these OTUs were classified into 13 phyla, 21 classes, 31 orders, 47 families, and 68 genera (Figure S2). Regarding the number of identified archaeal taxa, 15 OTUs were observed, accounting for 86.5% of the relative abundance in all the samples. These were classified into three phyla, five classes, five orders, five families, and seven genera (Figure S2).

3.2.1. Analysis of Bacterial 16S rRNA Sequences

The bacterial community of the four samples obtained was significantly different and changed over time, as the PCoA and PERMANOVA analyses indicated (PERMANOVA; p < 0.05) (Figure S3). Based on the numbers of alpha diversity indices, the four time points were characterized by different species richness and diversity. In general, the first two samples (inoculum and second dilution cycle) revealed statistically higher bacterial species richness and evenness than the other locations (ACE, Chao1, Shannon) (Figure S4). More specifically, based on the Shannon score, the fourth sample (171st day) had statistically lower bacterial diversity than all three of the other samples. Based on the relative abundance of the different species making up the sample richness (Simpson), the inoculum and the sample taken on the 135th day were similar and were significantly different from the other two samples that exhibited lower values.
The most abundant phylum in the inoculum and second dilution cycle was Firmicutes (>70%), followed by Bacteroidota. This finding was the opposite in the last two samples (135th day and 170th day), with Bacteroidota becoming the dominant phylum. Moreover, in the last two samples, Proteobacteria seem to gain a relative abundance percentage (Figure S5). At the class level, Clostridia was the most dominant species for the first 15 days, and then, Bacteroidia were found to be more abundant in the last two samples. Additionally, for the last two samples, Negativicutes, Gammaproteobacteria, and Cloacimonadia revealed increased relative abundances compared to the first samples (Figure S5).
At the genus level, the bacterial community composition varied between the first two and the last samples, where the inoculum on the 15th day was mainly dominated by Fastidiosipila (Firmicutes), while the samples of 135th day and 170th day were mainly dominated by Proteiniphilum (Bacteroidota). Interestingly, the members of Firmicutes, such as Calidicoprobacter, Fastidiosipila, HN.HF0106, MBA03, Paeniclostridium, Romboutsia, and Sentimentibacter, observed to have similar relative abundances in the first two samples, totally disappeared in the last two samples, where Sporomusa and Gracillibacter were the only representatives, but had lower total percentages (Figure 8). In the sample of day 135, the second most abundant OTUs were W27 (Cloacimonadota), followed by Sporomusa (Firmicutes), Sulfurospirillum (Campilobacterota), Thauera (Proteobacteria), and JGI.0000069.P22 (Patescibacteria). Most of them were not detected in the rest of the samples. Continuing and highlighting the bacterial diversity of the samples, the community of the last sample (170th day) included Lentimicrobium (Bacteroidota) and LNR.A2.18 (Cloacimonadota), also undetectable at all the other time points.

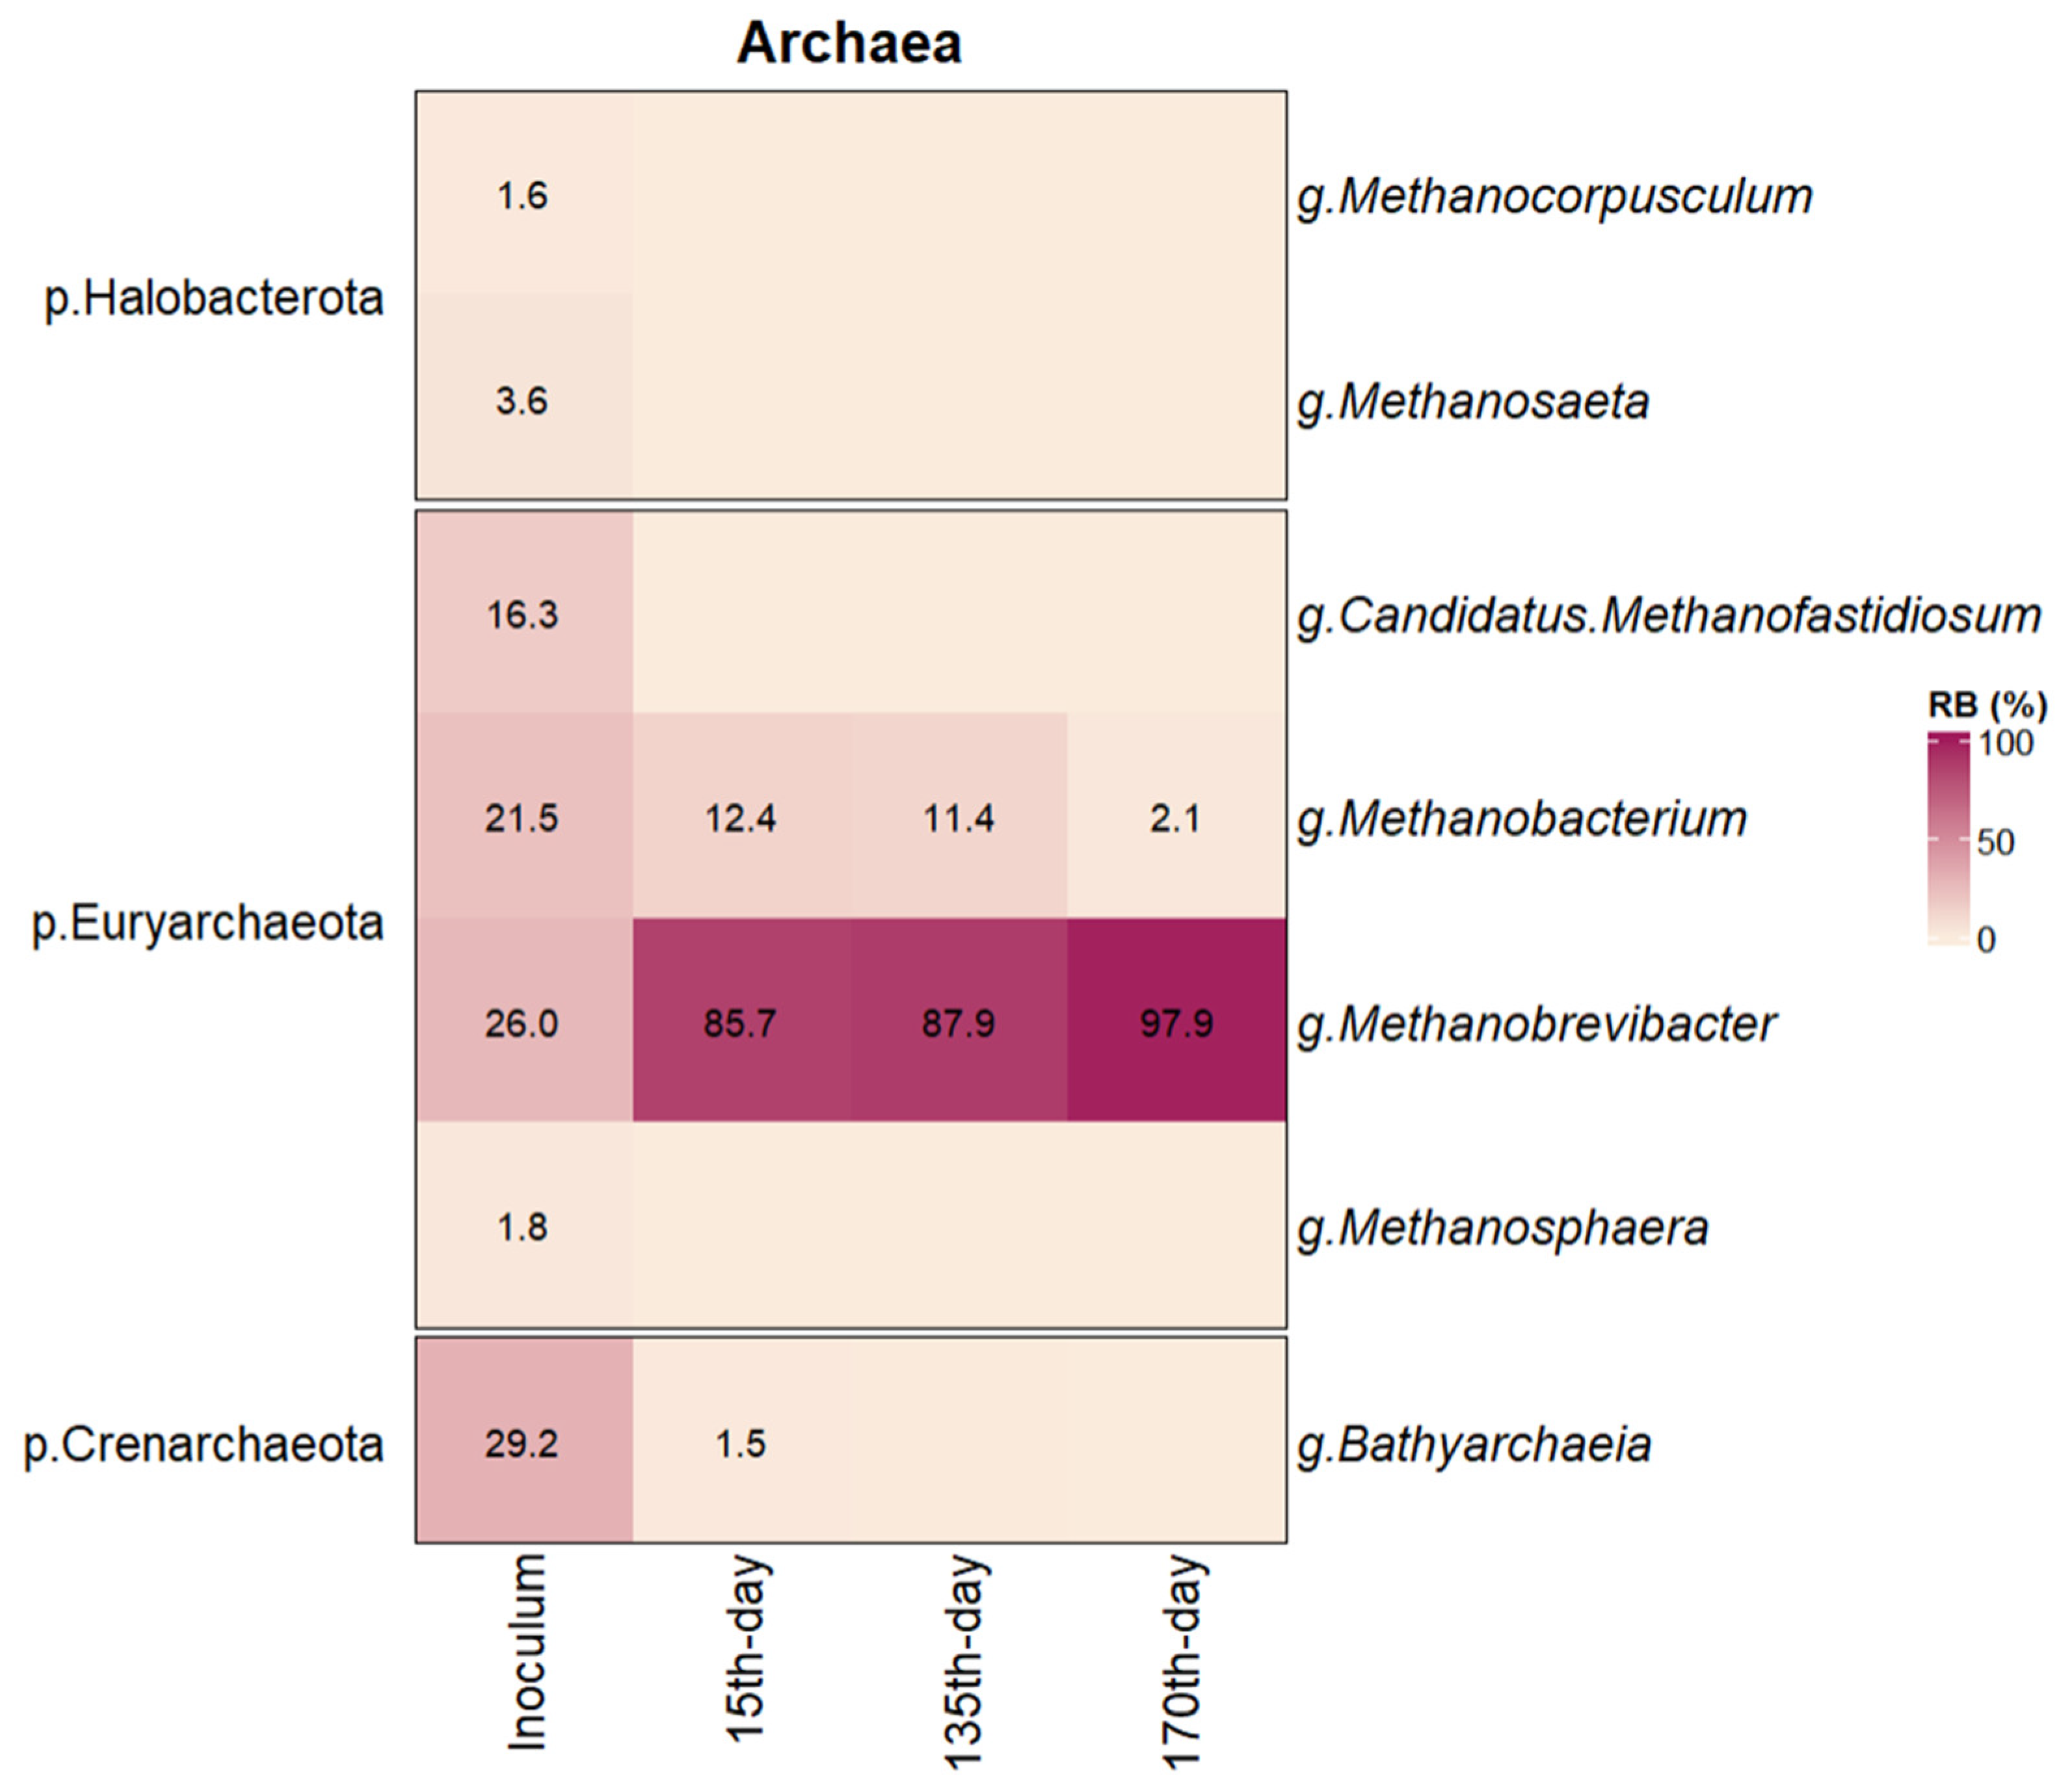
3.2.2. Analysis of Archaeal 16S rRNA Sequences

The archaeal microbial community of the first sample was considerably different from that in the rest of the samples. At the same time, no significant difference was observed among the other samples, as indicated by the PERMANOVA and PCoA analyses, meaning that the enrichment procedure dramatically influenced the microbiome of the bioreactor, even from the beginning (Figure S6). The alpha diversity analysis showed higher species richness and evenness in the first sample (inoculum). The ACE and Chao1 indices of the intermediate samples (15th and 135th days) showed high deviation (Figure S7). Moreover, the substantially lowest archaeal diversity in the fourth sample (taken on the 170th day) was indicated by all four indices (15th and 135th day).
The most abundant phylum in the inoculum was Euryarchaeota (approximately 70%), along with Crenarcheota (Figure S8). Euryarchaeota was further increased in the following samples, while Crenarcheota and Halobacterota, although present in the inoculum, were not detected in the final sample (170th day). At the class level, Methanobacteria was the most dominant species across all samples (Figure S8). The relative abundance analysis of the inoculum showed that Bathyarchaeia, Thermococci, and Methanosarcinia were also present at significant levels. However, these classes were not identified in the sample obtained on the 170th day, with Methanobacteria being the only detected class.
The dominant genera in the inoculum were Bathyarchaeia, Methanobrevibacter, Methanobacterium, and Candidatus Methanofastidiosum (Figure 9). In the following samples, Methanobrevibacter increased rapidly, accounting for 85.7% and 97.9% of the archaeal population on the 15th day and 170th days, respectively. On the contrary, the genera Bathyarchaeia, Candidatus Methanofastidiosum, Methanosaeta, Methanosphaera, and Methanocorpusculum were not detected in the last two samples. Similarly, the relative abundance of Methanobacterium decreased from 21.5% (inoculum) to 2.1% (170th day).

4. Discussion

The Euryarchaeota population (which includes the methanogen species) dramatically increased on the 14th day (second dilution cycle), accounting for 55% of the total population, on average. The shift from bacterial to archaeal dominance can be attributed to the composition of the feed (consisting of hydrogen and carbon dioxide as the energy and carbon sources, respectively), which facilitated the growth of hydrogenotrophic Archaea, and the successive dilutions, which gradually depleted the non-hydrogenotrophic microorganisms. The higher relative abundance of Euryarchaeota is related to the elevated Methanobrevibacter sp. population (85.7% of the archaeal population), while Methanobacterium sp. were significantly reduced (12.4%). Euryarchaeota’s relative abundance was further elevated, reaching 62% of the total microbial community average at the end of the experiment. The high percentage of Euryarchaeota in the total population contradicts the findings of other researchers who reported that the Euryarchaeota accounted for less than 10% of the total population [11,13,19,29]. However, in those cases, digestate was used as a nutrient medium and was regularly introduced into the biomethane reactors. As a result, the typical AD microbial consortium was also added into the bioreactors via digestate. Nevertheless, Dupnock et al. [31], who also used a synthetic nutrient medium as in the present study, reported that the phylum Euryarchaeota was present in a lower proportion (27% of the total microbial population) compared to our findings. Moreover, other studies that found Methanobacterium sp. was the prevalent genus within the Archaea population [19,25], while in the present study, Methanobacterium sp. gradually decreased and Methanobacterium sp. and the Methanobrevibacter sp. was the predominant genus (97.9%) on the 170th day. An explanation for this may be the temperature range used to conduct the experiments; Asimakopoulos et al. [55] found that Methanobrevibacter dominated the mesophilic bioreactors (as in the present study), while Methanothermobacter dominated the thermophilic bioreactors during syngas fermentation.
Acetate was produced along with methane, and this agrees with other studies having detected acetate as well [11,19,56,57]. Indeed, the injection of H2 into the biomethanation reactor stimulates the growth of homoacetogens, which also use the same substrates as the hydrogenotrophic methanogens [13,29]. Agneessens et al. [58] noticed that a high concentration of H2 shifts its conversion into acetate by the homoacetogens (Equation (2)). On the other hand, they also concluded that a lower H2 concentration favors its consumption into methane by hydrogenotrophic methanogens (Equation (1)). In the present work, the negative effect of the high H2 concentration in the feed was verified, since acetate rapidly increased to approximately 700 mg L−1 (15th day), with a tendency to build up further. Thus, to promote the growth of hydrogenotrophic methanogens and mitigate the proliferation of homoacetogens, the feeding medium was diluted with N2 gas to decrease the concentration of H2 by half (29.8%). Lowering the H2 concentration in the feeding medium caused an immediate decrease in the acetate concentration, which was kept at negligible levels until the 109th day (eighth dilution cycle). However, in the eighth cycle, the acetate concentration increased again. Microbial analysis of samples taken within the eighth and ninth dilution cycles (on the 135th and 170th days, respectively) indicated the presence of homoacetogenic Sporomusa sp. The metabolic pathway of homoacetogenesis has already been encountered in other biogas upgrade studies [27]; however, different species have been associated with it, such as Acetobacterium woodi, Thermoanaerobacter kivui, and Moorella thermoacetica (previously known as Clostridium thermoaceticum) [19,29]. It should be noted that these biogas upgrade studies were performed under thermophilic conditions, whereas the present work was conducted under mesophilic conditions. It is worth mentioning that Sporomusa sp. has been reported by Munoz and Philips [57] to have the lowest threshold values compared to Clostridium and Acetobacterium sp., indicating their potential to compete for H2, even at low hydrogen partial pressure.
Interestingly, the acetate concentration remained stable at 143 ± 13 mg L−1 without any tendency to accumulate further (Figure 6). The steady acetate concentration indicates that either methane production also occurred via acetoclastic methanogenesis (Equation (3)) or acetate was oxidized again to H2 and CO2 by syntrophic acetate oxidizing bacteria [29]. Since no acetoclastic methanogens were detected in either sample, acetoclastic methanogenesis was not the most probable scenario. The second scenario of acetate oxidation back to H2 and CO2 is a possible explanation, since there was an increase in the relative abundance of Proteiniphilum sp. from negligible levels to 41% of the total bacterial population at the end of the experiment. Even though Proteiniphilum sp. are known to be fermentative bacteria [59], Feng et al. [60] found that they are also able to oxidize acetate. The shift from acetoclastic methanogenesis to syntrophic acetate oxidation (SAO) coupled with hydrogenotrophic methanogenesis has been observed in cases of inhibition of acetoclastic methanogens. Such cases include the stress induced by high ammonia concentration [60,61], high butyrate concentration [62], and high organic loading rate [63]. The co-existence of hydrogenotrophic methanogens (e.g., Methanobacterium), homoacetogens (e.g., Sporomusa), and SAO (e.g., Spirochaetaceae) has also been reported elsewhere (e.g., syngas fermentation [64]).
Neither the homoacetogen Sporomusa sp. nor the acetate-oxidizing Proteiniphilum sp. was present in the inoculum. On the other hand, Firmicutes and Bacteroidetes, responsible for the fermentation of sugars and amino acids to fatty acids, present in the inoculum, have already been identified at a similar abundance in mesophilic biogas reactors [65,66]. In terms of Archaea in the inoculum, hydrogenotrophic methanogens were present at almost 50% of the total Archaea population of the inoculum, while Methanosaeta sp., which were the only acetoclastic methanogens, were identified at only 3.6%. However, it was expected that acetoclastic methanogens would be found in abundance, since 70% of the methane in biogas is due to acetoclastic and not hydrogenotrophic methanogenesis in most anaerobic bioreactors [53]. Surprisingly, Candidatus Methanofastidiosum sp., capable of producing methane via methylated thiol reduction [67], were also present (16.3%). These uncultured species are mostly encountered under extreme environmental conditions, although lately, they have also been found in anaerobic digesters [68]. Therefore, the anaerobic digester, which the inoculum came from, produced methane predominantly via hydrogenotrophic methanogenesis and the reduction of sulfur organic compounds. The inoculum also contained Bathyarchaeia sp. at an appreciable level (29.2%). Bathyarchaeia sp. have been associated with the fermentation of hemicellulose and cellulose [69], and their presence is possible, since the inoculum came from a biogas reactor fed on corn silage, among other feedstocks.
The reactor was operated in fed-batch mode, which is convenient for achieving enrichment, which was the aim of the present study. It seems that the microorganisms’ exposure to high H2 levels after feeding favored acetate accumulation in the second cycle (Figure 6). The addition of N2 as a dilution medium to the feeding gas mixture decreased the H2 concentration but also decreased the H2 loading rate and, consequently, kept the CH4 production rate at low levels (0.28–0.30 L L−1 d−1; Table 3) compared to the values of 0.70–0.82 L L−1 d−1 recorded in thermophilic bubble column reactors operated continuously under three-fold higher hydrogen loading rates [11]. However, the utilization efficiencies of H2 and CO2 were as high as in Bassani et al., 2017 [11] (99 to 100%). It is interesting to note that the CH4 production rate remained unaffected by the dilutions and the decrease in the VSS rate (Table 2), indicating that active microorganisms were partially quantified via VSS suspended in the bubble reactor, and the attached biomass on the surfaces (walls, immerging tubes in the column) may have contributed to CH4 production. A typical barrier encountered in bubble column reactors is low H2 solubility in water, and this may be overcome through efficient diffusers [13] or the application of hydrodynamic cavitation [56] for the formation and dissolution of fine gas bubbles into the aqueous phase. A methane production rate up to 2.05 L L−1 d−1 has been recorded with a high CH4 percentage in an outlet biomethane mixture (99.5%) [56]. However, the energy consumption required should be also be taken into account.
The pH level in this study gradually decreased from 8.3 to 6.8 until the 100th day (Figure 7), probably because of the slight acetate accumulation (Figure 6) and the dissolution of CO2 into the liquid phase. similar trend of pH was observed in the study of Giuliano et al. [56], who operated a bubble column reactor for ex situ biomethanation, where the pH was decreased from 8.85 to 7.46 within 26 days of operation. In the present work, since no buffer agent was added via the nutrient medium, the pH could not remain stable, even though the pH of the nutrient medium added in each dilution cycle was adjusted to 7. The pH of the liquid phase was manually controlled daily at approximately 7 to prevent further decrease. The addition of NaHCO3 at the beginning of the last dilution cycle led to a sudden pH increase from approximately 7 to 8.25, which remained stable until the end. The pH level recorded in the last cycle agrees with most ex situ biogas upgrade studies, which report the pH to be within the range of 8.2–8.5 [11,70]. The high pH values can be correlated with the digestate or cattle manure used as nutrient sources, known for their high buffer capacity [13,29]. In any case, pH did not affect the biomethanation efficiency and the effluent gas mixture’s high CH4 content.
Finally, the enriched culture turned to an off-white powdered solid mixture that tended to attach rapidly to the walls. Using this culture in heterogeneous bioreactors (e.g., trickling filters) is expected to result in a short start-up duration and efficient continuous operation in mesophilic conditions. Further studies are necessary to establish a methanation process with a high rate to promote mesophilic biological biogas upgrade as an alternative to more energy-intensive technologies, such as thermophilic or physicochemical biogas upgrade.

5. Conclusions

An enrichment strategy using successive dilution cycles was applied in this work to obtain a microbial culture rich in hydrogenotrophic methanogens, Methanobrevibacter sp., at a proportion of 97.9% among the Archaea and 60% of the total population. Besides hydrogenotrophic methanogenesis, homoacetogens (Sporomusa sp.) and acetate oxidizers (Proteiniphilum sp.) were also detected, which justified the presence of acetate at a relatively stable level (143 ± 13 mg L−1) as a result of its production via homoacetogenesis and concomitant consumption via syntrophic acetate oxidation. The enriched culture, increasing from approximately 0.25 to 0.5 g VSS L−1 in each cycle, was capable of converting biogas to biomethane (95.5 ± 1.2%) in mesophilic conditions and was not affected by changes in the pH, which varied from 6.8 to 8.2. The enriched culture obtained will be further used to operate continuous heterogeneous bioreactors for ex situ biomethanation as an alternative to thermophilic or physicochemical biogas upgrade.

Supplementary Materials

The following supporting information can be downloaded at: https://www.mdpi.com/article/10.3390/su152115247/s1, Figure S1: Prokaryotic community composition in the domain level; Figure S2: Number of identified bacterial (A) and archaeal (B) taxa of all samples; Figure S3: Principal coordinates analysis (PCoA) of bacterial community compositions. The individual samples are color-coordinated according to the sampling time point; Figure S4: Alpha-diversity indices for bacterial communities in 4 different time points. The interquartile range (IQR) is represented by boxes, the median is represented by a line within the boxes, and samples are represented by dots (* 0.01 < p < 0.05, ** p ≤ 0.01); Figure S5: Relative abundance of the bacterial populations at the phylum (A) and class level (B); Figure S6: Principal coordinates analysis (PCoA) of archaeal community compositions. The individual samples are color-coordinated according to the sampling time point Figure S7: Alpha-diversity indices for archaeal communities in 4 different time points. The interquartile range (IQR) is represented by boxes, the median is represented by a line within the boxes, and samples are represented by dots (* 0.01 < p < 0.05, ** p ≤ 0.01). Figure S8: Relative abundance of the archaeal populations at the phylum (A) and class level (B). Table S1: Nutrient medium composition.

Author Contributions

Conceptualization, A.S. and K.S.; methodology, A.S., I.A.V., A.T., P.S., G.T. and K.S.; software, A.T., P.S. and G.T.; investigation, A.S.; data curation, A.S. and K.S.; writing—original draft preparation, A.S.; writing—review and editing, A.S., I.A.V., A.T., P.S., G.T. and K.S.; visualization, A.S. and P.S.; supervision, K.S.; project administration, K.S.; funding acquisition, A.S. All authors have read and agreed to the published version of the manuscript.

Funding

This research work was supported by the Hellenic Foundation for Research and Innovation (HFRI) under the HFRI PhD Fellowship grant (Fellowship Number: 1585).

Institutional Review Board Statement

Not applicable.

Informed Consent Statement

Not applicable.

Data Availability Statement

All the data that support the findings of this study are available from NCBI under BioProject PRJNA993457.

Conflicts of Interest

The authors declare no conflict of interest. The funders had no role in the design of the study; in the collection, analyses, or interpretation of the data; in the writing of the manuscript; or in the decision to publish the results.

References

  1. Luo, G.; Angelidaki, I. Co-Digestion of Manure and Whey for in Situ Biogas Upgrading by the Addition of H2: Process Performance and Microbial Insights. Appl. Microbiol. Biotechnol. 2013, 97, 1373–1381. [Google Scholar] [CrossRef] [PubMed]
  2. EBA 2022; EBA Statistical Report 2022. EBA: Brussels, Belgium, 2022.
  3. EBA 2016; EBA Biomethane in Transport 2016. EBA: Brussels, Belgium, 2016.
  4. EBA 2023. Brussels, Belgium. Available online: https://www.Europeanbiogas.Eu/Benefits/#growth-Potential (accessed on 14 October 2023).
  5. D’Adamo, I.; Sassanelli, C. A Mini-Review of Biomethane Valorization: Managerial and Policy Implications for a Circular Resource. Waste Manag. Res. 2022, 40, 1745–1756. [Google Scholar] [CrossRef] [PubMed]
  6. Taifouris, M.; Martín, M. Towards Energy Security by Promoting Circular Economy: A Holistic Approach. Appl. Energy 2023, 333, 120544. [Google Scholar] [CrossRef]
  7. D’Adamo, I.; Ribichini, M.; Tsagarakis, K.P. Biomethane as an Energy Resource for Achieving Sustainable Production: Economic Assessments and Policy Implications. Sustain. Prod. Consum. 2023, 35, 13–27. [Google Scholar] [CrossRef]
  8. Padi, R.K.; Douglas, S.; Murphy, F. Techno-Economic Potentials of Integrating Decentralised Biomethane Production Systems into Existing Natural Gas Grids. Energy 2023, 283, 128542. [Google Scholar] [CrossRef]
  9. Kupiec, B. Directive (EU) 2018/2001 of the European Parliament and of the Council of 11 December 2018 on the Promotion of the Use of Energy from Renewable Sources. Off. J. Eur. Union 2018. [Google Scholar]
  10. Angelidaki, I.; Treu, L.; Tsapekos, P.; Luo, G.; Campanaro, S.; Wenzel, H.; Kougias, P.G. Biogas Upgrading and Utilization: Current Status and Perspectives. Biotechnol. Adv. 2018, 36, 452–466. [Google Scholar] [CrossRef]
  11. Bassani, I.; Kougias, P.G.; Treu, L.; Porté, H.; Campanaro, S.; Angelidaki, I. Optimization of Hydrogen Dispersion in Thermophilic Up-Flow Reactors for Ex Situ Biogas Upgrading. Bioresour. Technol. 2017, 234, 310–319. [Google Scholar] [CrossRef]
  12. Tsapekos, P.; Treu, L.; Campanaro, S.; Centurion, V.B.; Zhu, X.; Peprah, M.; Zhang, Z.; Kougias, P.G.; Angelidaki, I. Pilot-Scale Biomethanation in a Trickle Bed Reactor: Process Performance and Microbiome Functional Reconstruction. Energy Convers. Manag. 2021, 244, 114491. [Google Scholar] [CrossRef]
  13. Ghofrani-Isfahani, P.; Tsapekos, P.; Peprah, M.; Kougias, P.; Zhu, X.; Kovalovszki, A.; Zervas, A.; Zha, X.; Jacobsen, C.S.; Angelidaki, I. Ex-Situ Biogas Upgrading in Thermophilic up-Flow Reactors: The Effect of Different Gas Diffusers and Gas Retention Times. Bioresour. Technol. 2021, 340, 125694. [Google Scholar] [CrossRef]
  14. Jürgensen, L.; Ehimen, E.A.; Born, J.; Holm-Nielsen, J.B. Utilization of Surplus Electricity from Wind Power for Dynamic Biogas Upgrading: Northern Germany Case Study. Biomass Bioenergy 2014, 66, 126–132. [Google Scholar] [CrossRef]
  15. Alitalo, A.; Niskanen, M.; Aura, E. Biocatalytic Methanation of Hydrogen and Carbon Dioxide in a Fixed Bed Bioreactor. Bioresour. Technol. 2015, 196, 600–605. [Google Scholar] [CrossRef] [PubMed]
  16. Ashraf, M.T.; Yde, L.; Triolo, J.M.; Wenzel, H. Optimizing the Dosing and Trickling of Nutrient Media for Thermophilic Biomethanation in a Biotrickling Filter. Biochem. Eng. J. 2021, 176, 108220. [Google Scholar] [CrossRef]
  17. Thapa, A.; Park, J.-G.; Yang, H.-M.; Jun, H.-B. In-Situ Biogas Upgrading in an Anaerobic Trickling Filter Bed Reactor Treating a Thermal Post-Treated Digestate. J. Environ. Chem. Eng. 2021, 9, 106780. [Google Scholar] [CrossRef]
  18. Ashraf, M.T.; Sieborg, M.U.; Yde, L.; Rhee, C.; Shin, S.G.; Triolo, J.M. Biomethanation in a Thermophilic Biotrickling Filter—pH Control and Lessons from Long-Term Operation. Bioresour. Technol. Rep. 2020, 11, 100525. [Google Scholar] [CrossRef]
  19. Porté, H.; Kougias, P.G.; Alfaro, N.; Treu, L.; Campanaro, S.; Angelidaki, I. Process Performance and Microbial Community Structure in Thermophilic Trickling Biofilter Reactors for Biogas Upgrading. Sci. Total Environ. 2019, 655, 529–538. [Google Scholar] [CrossRef]
  20. Jensen, M.B.; Strübing, D.; De Jonge, N.; Nielsen, J.L.; Ottosen, L.D.M.; Koch, K.; Kofoed, M.V.W. Stick or Leave—Pushing Methanogens to Biofilm Formation for Ex Situ Biomethanation. Bioresour. Technol. 2019, 291, 121784. [Google Scholar] [CrossRef]
  21. Tang, Q.; Xu, J.; Liu, Z.; Huang, Z.; Zhao, M.; Shi, W.; Ruan, W. Optimal the Ex-Situ Biogas Biological Upgrading to Biomethane and Its Combined Application with the Anaerobic Digestion Stage. Energy Sources Part Recovery Util. Environ. Eff. 2021, 43, 2147–2159. [Google Scholar] [CrossRef]
  22. Lee, J.C.; Kim, J.H.; Chang, W.S.; Pak, D. Biological Conversion of CO2 to CH4 Using Hydrogenotrophic Methanogen in a Fixed Bed Reactor. J. Chem. Technol. Biotechnol. 2012, 87, 844–847. [Google Scholar] [CrossRef]
  23. Rachbauer, L.; Voitl, G.; Bochmann, G.; Fuchs, W. Biological Biogas Upgrading Capacity of a Hydrogenotrophic Community in a Trickle-Bed Reactor. Appl. Energy 2016, 180, 483–490. [Google Scholar] [CrossRef]
  24. Wahid, R.; Horn, S.J. The Effect of Mixing Rate and Gas Recirculation on Biological CO2 Methanation in Two-Stage CSTR Systems. Biomass Bioenergy 2021, 144, 105918. [Google Scholar] [CrossRef]
  25. Ghofrani-Isfahani, P.; Tsapekos, P.; Peprah, M.; Kougias, P.; Zervas, A.; Zhu, X.; Yang, Z.; Jacobsen, C.S.; Angelidaki, I. Ex-Situ Biogas Upgrading in Thermophilic Trickle Bed Reactors Packed with Micro-Porous Packing Materials. Chemosphere 2022, 296, 133987. [Google Scholar] [CrossRef] [PubMed]
  26. Sieborg, M.U.; Jønson, B.D.; Ashraf, M.T.; Yde, L.; Triolo, J.M. Biomethanation in a Thermophilic Biotrickling Filter Using Cattle Manure as Nutrient Media. Bioresour. Technol. Rep. 2020, 9, 100391. [Google Scholar] [CrossRef]
  27. Thapa, A.; Park, J.-G.; Jun, H.-B. Enhanced Ex-Situ Biomethanation of Hydrogen and Carbon Dioxide in a Trickling Filter Bed Reactor. Biochem. Eng. J. 2022, 179, 108311. [Google Scholar] [CrossRef]
  28. Tsapekos, P.; Alvarado-Morales, M.; Angelidaki, I. H2 Competition between Homoacetogenic Bacteria and Methanogenic Archaea during Biomethanation from a Combined Experimental-Modelling Approach. J. Environ. Chem. Eng. 2022, 10, 107281. [Google Scholar] [CrossRef]
  29. Kougias, P.G.; Treu, L.; Benavente, D.P.; Boe, K.; Campanaro, S.; Angelidaki, I. Ex-Situ Biogas Upgrading and Enhancement in Different Reactor Systems. Bioresour. Technol. 2017, 225, 429–437. [Google Scholar] [CrossRef]
  30. Figeac, N.; Trably, E.; Bernet, N.; Delgenès, J.-P.; Escudié, R. Temperature and Inoculum Origin Influence the Performance of Ex-Situ Biological Hydrogen Methanation. Molecules 2020, 25, 5665. [Google Scholar] [CrossRef]
  31. Dupnock, T.L.; Deshusses, M.A. High-Performance Biogas Upgrading Using a Biotrickling Filter and Hydrogenotrophic Methanogens. Appl. Biochem. Biotechnol. 2017, 183, 488–502. [Google Scholar] [CrossRef]
  32. Fenske, C.F.; Kirzeder, F.; Strübing, D.; Koch, K. Biogas Upgrading in a Pilot-Scale Trickle Bed Reactor—Long-Term Biological Methanation under Real Application Conditions. Bioresour. Technol. 2023, 376, 128868. [Google Scholar] [CrossRef]
  33. Ebrahimian, F.; Bernardini, N.D.; Tsapekos, P.; Treu, L.; Zhu, X.; Campanaro, S.; Karimi, K.; Angelidaki, I. Effect of Pressure on Biomethanation Process and Spatial Stratification of Microbial Communities in Trickle Bed Reactors under Decreasing Gas Retention Time. Bioresour. Technol. 2022, 361, 127701. [Google Scholar] [CrossRef]
  34. Logroño, W.; Kluge, P.; Kleinsteuber, S.; Harms, H.; Nikolausz, M. Effect of Inoculum Microbial Diversity in Ex Situ Biomethanation of Hydrogen. Bioengineering 2022, 9, 678. [Google Scholar] [CrossRef] [PubMed]
  35. Latif, M.A.; Mehta, C.M.; Batstone, D.J. Influence of Low pH on Continuous Anaerobic Digestion of Waste Activated Sludge. Water Res. 2017, 113, 42–49. [Google Scholar] [CrossRef] [PubMed]
  36. Standard Methods for the Examination of Water and Wastewater, 20th ed.; American Public Health Association/American Water Works Association/Water Environment Federation: Washington DC, USA, 1999.
  37. Spyridonidis, A.; Skamagkis, T.; Lambropoulos, L.; Stamatelatou, K. Modeling of Anaerobic Digestion of Slaughterhouse Wastes after Thermal Treatment Using ADM1. J. Environ. Manag. 2018, 224, 49–57. [Google Scholar] [CrossRef] [PubMed]
  38. Klindworth, A.; Pruesse, E.; Schweer, T.; Peplies, J.; Quast, C.; Horn, M.; Glöckner, F.O. Evaluation of General 16S Ribosomal RNA Gene PCR Primers for Classical and Next-Generation Sequencing-Based Diversity Studies. Nucleic Acids Res. 2013, 41, e1. [Google Scholar] [CrossRef] [PubMed]
  39. Ntougias, S.; Polkowska, Ż.; Nikolaki, S.; Dionyssopoulou, E.; Stathopoulou, P.; Doudoumis, V.; Ruman, M.; Kozak, K.; Namieśnik, J.; Tsiamis, G. Bacterial Community Structures in Freshwater Polar Environments of Svalbard. Microbes Environ. 2016, 31, 401–409. [Google Scholar] [CrossRef]
  40. Edgar, R.C. Search and Clustering Orders of Magnitude Faster than BLAST. Bioinformatics 2010, 26, 2460–2461. [Google Scholar] [CrossRef]
  41. Bolyen, E.; Rideout, J.R.; Dillon, M.R.; Bokulich, N.A.; Abnet, C.C.; Al-Ghalith, G.A.; Alexander, H.; Alm, E.J.; Arumugam, M.; Asnicar, F.; et al. Reproducible, Interactive, Scalable and Extensible Microbiome Data Science Using QIIME 2. Nat. Biotechnol. 2019, 37, 852–857. [Google Scholar] [CrossRef]
  42. Edgar, R.C. UPARSE: Highly Accurate OTU Sequences from Microbial Amplicon Reads. Nat. Methods 2013, 10, 996–998. [Google Scholar] [CrossRef]
  43. Edgar, R.C. UNCROSS2: Identification of Cross-Talk in 16S rRNA OTU Tables. BioRxiv 2018, 400762. [Google Scholar]
  44. Camacho, C.; Coulouris, G.; Avagyan, V.; Ma, N.; Papadopoulos, J.; Bealer, K.; Madden, T.L. BLAST+: Architecture and Applications. BMC Bioinform. 2009, 10, 421. [Google Scholar] [CrossRef]
  45. Quast, C.; Pruesse, E.; Yilmaz, P.; Gerken, J.; Schweer, T.; Yarza, P.; Peplies, J.; Glöckner, F.O. The SILVA Ribosomal RNA Gene Database Project: Improved Data Processing and Web-Based Tools. Nucleic Acids Res. 2012, 41, D590–D596. [Google Scholar] [CrossRef] [PubMed]
  46. Oksanen, J.; Blanchet, F.G.; Kindt, R.; Legendre, P.; Minchin, P.; O’Hara, B.; Simpson, G.; Solymos, P.; Stevens, H.; Wagner, H. Vegan: Community Ecology Package, R Package Version 2.1-2; 2015. Available online: https://CRAN.R-project.org/package=vegan (accessed on 14 October 2023).
  47. Wickham, H. Ggplot2: Elegant Graphics for Data Analysis; Use R! Springer International Publishing: Berlin/Heidelberg, Germany, 2016; ISBN 978-3-319-24275-0. [Google Scholar]
  48. Chen, J.; Bittinger, K.; Charlson, E.; Hoffmann, C.; Lewis, J.; Wu, G.; Collman, R.; Bushman, F.; Li, H. Associating Microbiome Composition with Environmental Covariates Using Generalized UniFrac Distances. Bioinforma. Oxf. Engl. 2012, 28, 2106–2113. [Google Scholar] [CrossRef] [PubMed]
  49. Chen, J.; Zhang, X.; Yang, L. GUniFrac: Generalized UniFrac Distances, Distance-Based Multivariate Methods and Feature-Based Univariate Methods for Microbiome Data Analysis. R Package Version 1.3. (Internet). Available online: https://CRAN.R-project.org/package=GUniFrac (accessed on 14 October 2023).
  50. Anderson, M. A New Method for Non-Parametric Multivariate Analysis of Variance. Austral Ecol. 2001, 26, 32–46. [Google Scholar] [CrossRef]
  51. Clarke, K.; Gorley, R.N. PRIMER v6: User Manual/Tutorial; PRIMER-E: Plymouth, UK, 2006; Volume 29, pp. 1060–1065. [Google Scholar]
  52. Anderson, M.; Gorley, R.N.; Clarke, K. PERMANOVA+ for Primer: Guide to Software and Statistical Methods; PRIMER-E: Plymouth, UK, 2008. [Google Scholar]
  53. Rittmann, B.E.; McCarty, P.L. Environmental Biotechnology: Principles and Applications; McGraw-Hill Education: New York, NY, USA, 2018; ISBN 978-1-260-44059-1. [Google Scholar]
  54. Chen, Y.; Cheng, J.J.; Creamer, K.S. Inhibition of Anaerobic Digestion Process: A Review. Bioresour. Technol. 2008, 99, 4044–4064. [Google Scholar] [CrossRef]
  55. Asimakopoulos, K.; Łężyk, M.; Grimalt-Alemany, A.; Melas, A.; Wen, Z.; Gavala, H.N.; Skiadas, I.V. Temperature Effects on Syngas Biomethanation Performed in a Trickle Bed Reactor. Chem. Eng. J. 2020, 393, 124739. [Google Scholar] [CrossRef]
  56. Giuliano, A.; Cellamare, C.M.; Chiarini, L.; Tabacchioni, S.; Petta, L. Evaluation of the Controlled Hydrodynamic Cavitation as Gas Mass Transfer System for Ex-Situ Biological Hydrogen Methanation. Chem. Eng. J. 2023, 471, 144475. [Google Scholar] [CrossRef]
  57. Laura, M.; Jo, P. No Acetogen Is Equal: Strongly Different H2 Thresholds Reflect Diverse Bioenergetics in Acetogenic Bacteria. Environ. Microbiol. 2023, 25, 2032–2040. [Google Scholar] [CrossRef]
  58. Agneessens, L.M.; Ottosen, L.D.M.; Andersen, M.; Berg Olesen, C.; Feilberg, A.; Kofoed, M.V.W. Parameters Affecting Acetate Concentrations during In-Situ Biological Hydrogen Methanation. Bioresour. Technol. 2018, 258, 33–40. [Google Scholar] [CrossRef]
  59. Hahnke, S.; Langer, T.; Koeck, D.E.; Klocke, M. Description of Proteiniphilum saccharofermentans sp. nov., Petrimonas mucosa sp. nov. and Fermentimonas caenicola gen. nov., sp. nov., Isolated from Mesophilic Laboratory-Scale Biogas Reactors, and Emended Description of the Genus Proteiniphilum. Int. J. Syst. Evol. Microbiol. 2016, 66, 1466–1475. [Google Scholar] [CrossRef]
  60. Feng, G.; Zeng, Y.; Wang, H.-Z.; Chen, Y.-T.; Tang, Y.-Q. Proteiniphilum and Methanothrix Harundinacea Became Dominant Acetate Utilizers in a Methanogenic Reactor Operated under Strong Ammonia Stress. Front. Microbiol. 2023, 13, 1098814. [Google Scholar] [CrossRef]
  61. Li, M.-T.; Rao, L.; Wang, L.; Gou, M.; Sun, Z.-Y.; Xia, Z.-Y.; Song, W.-F.; Tang, Y.-Q. Bioaugmentation with Syntrophic Volatile Fatty Acids-Oxidizing Consortia to Alleviate the Ammonia Inhibition in Continuously Anaerobic Digestion of Municipal Sludge. Chemosphere 2022, 288, 132389. [Google Scholar] [CrossRef] [PubMed]
  62. Nikitina, A.A.; Kallistova, A.Y.; Grouzdev, D.S.; Kolganova, T.V.; Kovalev, A.A.; Kovalev, D.A.; Panchenko, V.; Zekker, I.; Nozhevnikova, A.N.; Litti, Y.V. Syntrophic Butyrate-Oxidizing Consortium Mitigates Acetate Inhibition through a Shift from Acetoclastic to Hydrogenotrophic Methanogenesis and Alleviates VFA Stress in Thermophilic Anaerobic Digestion. Appl. Sci. 2023, 13, 173. [Google Scholar] [CrossRef]
  63. Sun, Z.; He, J.; Yu, N.; Chen, Y.; Chen, Y.; Tang, Y.; Kida, K. Biomethane Production and Microbial Strategies Corresponding to High Organic Loading Treatment for Molasses Wastewater in an Upflow Anaerobic Filter Reactor. Bioprocess Biosyst. Eng. 2023, 46, 1033–1043. [Google Scholar] [CrossRef] [PubMed]
  64. Cheng, G.; Gabler, F.; Pizzul, L.; Olsson, H.; Nordberg, Å.; Schnürer, A. Microbial Community Development during Syngas Methanation in a Trickle Bed Reactor with Various Nutrient Sources. Appl. Microbiol. Biotechnol. 2022, 106, 5317–5333. [Google Scholar] [CrossRef]
  65. Kampmann, K.; Ratering, S.; Kramer, I.; Schmidt, M.; Zerr, W.; Schnell, S. Unexpected Stability of Bacteroidetes and Firmicutes Communities in Laboratory Biogas Reactors Fed with Different Defined Substrates. Appl. Environ. Microbiol. 2012, 78, 2106–2119. [Google Scholar] [CrossRef]
  66. Murillo-Roos, M.; Uribe-Lorío, L.; Fuentes-Schweizer, P.; Vidaurre-Barahona, D.; Brenes-Guillén, L.; Jiménez, I.; Arguedas, T.; Liao, W.; Uribe, L. Biogas Production and Microbial Communities of Mesophilic and Thermophilic Anaerobic Co-Digestion of Animal Manures and Food Wastes in Costa Rica. Energies 2022, 15, 3252. [Google Scholar] [CrossRef]
  67. Vanwonterghem, I.; Evans, P.N.; Parks, D.H.; Jensen, P.D.; Woodcroft, B.J.; Hugenholtz, P.; Tyson, G.W. Methylotrophic Methanogenesis Discovered in the Archaeal Phylum Verstraetearchaeota. Nat. Microbiol. 2016, 1, 16170. [Google Scholar] [CrossRef]
  68. Agrimonti, C.; Visoli, G.; Ferrari, G.; Sanangelantoni, A.M. Comparison of Bacterial And Archaeal Microbiome In Two Bioreactors Fed With Cattle Sewage And Corn Biomass. Waste Biomass Valor. 2021, 13, 4533–4547. [Google Scholar] [CrossRef]
  69. Maus, I.; Rumming, M.; Bergmann, I.; Heeg, K.; Pohl, M.; Nettmann, E.; Jaenicke, S.; Blom, J.; Pühler, A.; Schlüter, A.; et al. Characterization of Bathyarchaeota Genomes Assembled from Metagenomes of Biofilms Residing in Mesophilic and Thermophilic Biogas Reactors. Biotechnol. Biofuels 2018, 11, 167. [Google Scholar] [CrossRef]
  70. Bassani, I.; Kougias, P.G.; Treu, L.; Angelidaki, I. Biogas Upgrading via Hydrogenotrophic Methanogenesis in Two-Stage Continuous Stirred Tank Reactors at Mesophilic and Thermophilic Conditions. Environ. Sci. Technol. 2015, 49, 12585–12593. [Google Scholar] [CrossRef] [PubMed]
Figure 1. Biogas upgrade reactor’s configuration.
Sustainability 15 15247 g001
Figure 2. Hydrogen loading rate during the enrichment of the microbial consortium. 1, 2, …, 9: successive dilution cycles of the mixed liquor. The vertical lines show when the dilution took place.
Sustainability 15 15247 g002
Figure 3. Gas retention time during the enrichment of the microbial consortium. 1, 2, …, 9: successive dilution cycles of the mixed liquor. The vertical lines show when the dilution took place.
Sustainability 15 15247 g003
Figure 4. Concentration of the VSS suspended in the bioreactor during the successive dilution cycles with the nutrient medium. The graph on the top right zooms into the framed part of the main graph. 1, 2, …, 9: successive dilution cycles of the mixed liquor. The vertical lines show when the dilution cycle took place.
Sustainability 15 15247 g004
Figure 5. Proportion of CH4, H2, and CO2 in the three-part gas mixture at the end of each fed-batch cycle. 1, 2, …, 9: successive dilution cycles of the mixed liquor. The vertical lines show when the dilution took place.
Sustainability 15 15247 g005
Figure 6. Acetate concentration in the bioreactor during the successive dilution cycles with the nutrient medium. 1, 2, …, 9: successive dilution cycles of the mixed liquor. The vertical lines show when the dilution took place.
Sustainability 15 15247 g006
Figure 7. pH variation in the bioreactor during the successive dilution cycles with the nutrient medium. 1, 2, …, 9: successive dilution cycles of the mixed liquor. The vertical lines show when the dilution took place.
Sustainability 15 15247 g007
Figure 8. Heat map of bacterial genera and phyla identified at four different time points.
Sustainability 15 15247 g008
Figure 9. Heat map of archaeal genera and phyla identified at four different time points.
Sustainability 15 15247 g009
Table 1. Characterization of the reactor’s start-up.
ParametersValue
pH8.11
Conductivity (mS/cm @25 °C)11.8
Total Suspended Solids, TSS (g L−1)11.23
Volatile Suspended Solids, VSS (g L−1)8.33
Table 2. VSS increase rate in the bioreactor in each dilution cycle.
Dilution CycleVSS Increase Rate (mg VSS d−1)
1-
2-
3-
414.92
514.73
612.25
712.35
88.73
94.63
Table 3. Bioreactor’s performance.
Dilution CycleH2 Loading Rate L L−1 d−1Output Gas Composition * (%)CH4 Production Rate (L L−1 d−1)nH2 (%)nCO2 (%)
CH4CO2H2
11.5 ± 0.393.2 ± 2.06.3 ± 1.20.7 ± 0.80.32 ± 0.0799.5 ± 0.683.9 ± 3.2
22.6 ± 0.193.7 ± 4.35.3 ± 3.31.5 ± 1.50.29 ± 0.1899.0 ± 1.085.9 ± 9.4
31.4 ± 0.195.8 ± 1.13.9 ± 1.20.3 ± 0.30.27 ± 0.0699.8 ± 0.288.7 ± 3.8
41.4 ± 0.196.4 ± 1.33.3 ± 1.00.3 ± 0.60.28 ± 0.0699.7 ± 0.690.3 ± 2.5
51.4 ± 0.295.4 ± 1.63.7 ± 0.80.8 ± 1.00.30 ± 0.0499.3 ± 0.989.4 ± 3.4
61.2 ± 0.195.4 ± 1.23.7 ± 1.01.2 ± 1.20.27 ± 0.0499.0 ± 1.089.3 ± 3.1
71.1 ± 0.294.4 ± 1.43.8 ± 0.62.0 ± 1.30.27 ± 0.0498.4 ± 1.188.8 ± 2.2
81.2 ± 0.196.4 ± 0.53.3 ± 0.30.2 ± 0.30.29 ± 0.0499.8 ± 0.290.1 ± 0.8
91.2 ± 0.195.5 ± 1.23.5 ± 1.10.9 ± 0.80.28 ± 0.0299.3 ± 0.789.5 ± 2.4
* The N2 used for decreasing the H2 concentration in the feeding medium was excluded from the calculations.
Disclaimer/Publisher’s Note: The statements, opinions and data contained in all publications are solely those of the individual author(s) and contributor(s) and not of MDPI and/or the editor(s). MDPI and/or the editor(s) disclaim responsibility for any injury to people or property resulting from any ideas, methods, instructions or products referred to in the content.

