Article

Renovation of an Academic Building’s Envelope, Lighting, and Air Conditioning System According to Thailand Building Energy Code for Energy Consumption Reduction

by
Pathomthat Chiradeja
1,
Surakit Thongsuk
2,
Santipont Ananwattanaporn
2 and
Atthapol Ngaopitakkul
2,*
1
Faculty of Engineering, Srinakharinwirot University, Bangkok 10110, Thailand
2
School of Engineering, King Mongkut’s Institute of Technology Ladkrabang, Bangkok 10520, Thailand
*
Author to whom correspondence should be addressed.
Sustainability 2023, 15(21), 15298; https://doi.org/10.3390/su152115298
Submission received: 20 August 2023 / Revised: 17 September 2023 / Accepted: 25 September 2023 / Published: 26 October 2023

Abstract

:
This study evaluated the feasibility of building renovation with regard to the aspects of economy and energy. An academic building located in Bangkok, Thailand was selected for a case study. Four sub-systems, namely, the building envelope, lighting system, air conditioning unit, and electrical system, were renovated. From the energy perspective, Thailand’s Building Energy Code was used as an evaluating standard, and the BEC software (Version 2.6.0) was employed for the calculations. The economic feasibility of the renovation was determined on the basis of the internal rate of return and discounted payback period. It was demonstrated that the renovation can result in a reduction in the annual energy consumption of the entire building by up to 55.44%. In regards to economic feasibility, the renovation project can achieve a payback period of 4.98 years with 20.89% IRR. In addition, the renovation of a building can lead to spare capacity of the transformer for electric vehicle charger loads. Thus, the renovation of an old building into an energy-efficient building in compliance with building code can afford benefits both in terms of electricity consumption reduction and decreased energy cost for the project owner and provide opportunity for the building to support future load.

1. Introduction

The rising global demand for electricity has become one of the key challenges given the inter-relatedness among various seemingly independent factors such as environmental impact, economic growth, and energy independence. According to the data from the International Energy Agency (IEA), energy usage by buildings has been significantly rising as the global economy and population are still growing. Thus, energy efficiency in the building sector is evolving to be an essential aspect, and its enhancement is increasingly considered key to reducing energy demand and mitigating climate change. The report notes that energy efficiency measures could reduce global energy demand by up to 20% by 2040. The IEA provides the latest global energy outlook in its “World Energy Outlook 2022” report [1]. The building sector energy consumption accounted for 132 EJ in 2021 or accounted for 30% of total global final energy consumption. However, there is a significant potential for improvements of the energy efficiency in the building sector through the introduction of insulation; efficient lighting equipment and heating, ventilation, and air conditioning (HVAC) systems; and power generated from renewable energy. The IEA estimates that energy efficiency measures could reduce energy consumption in buildings by up to 50% by 2050.
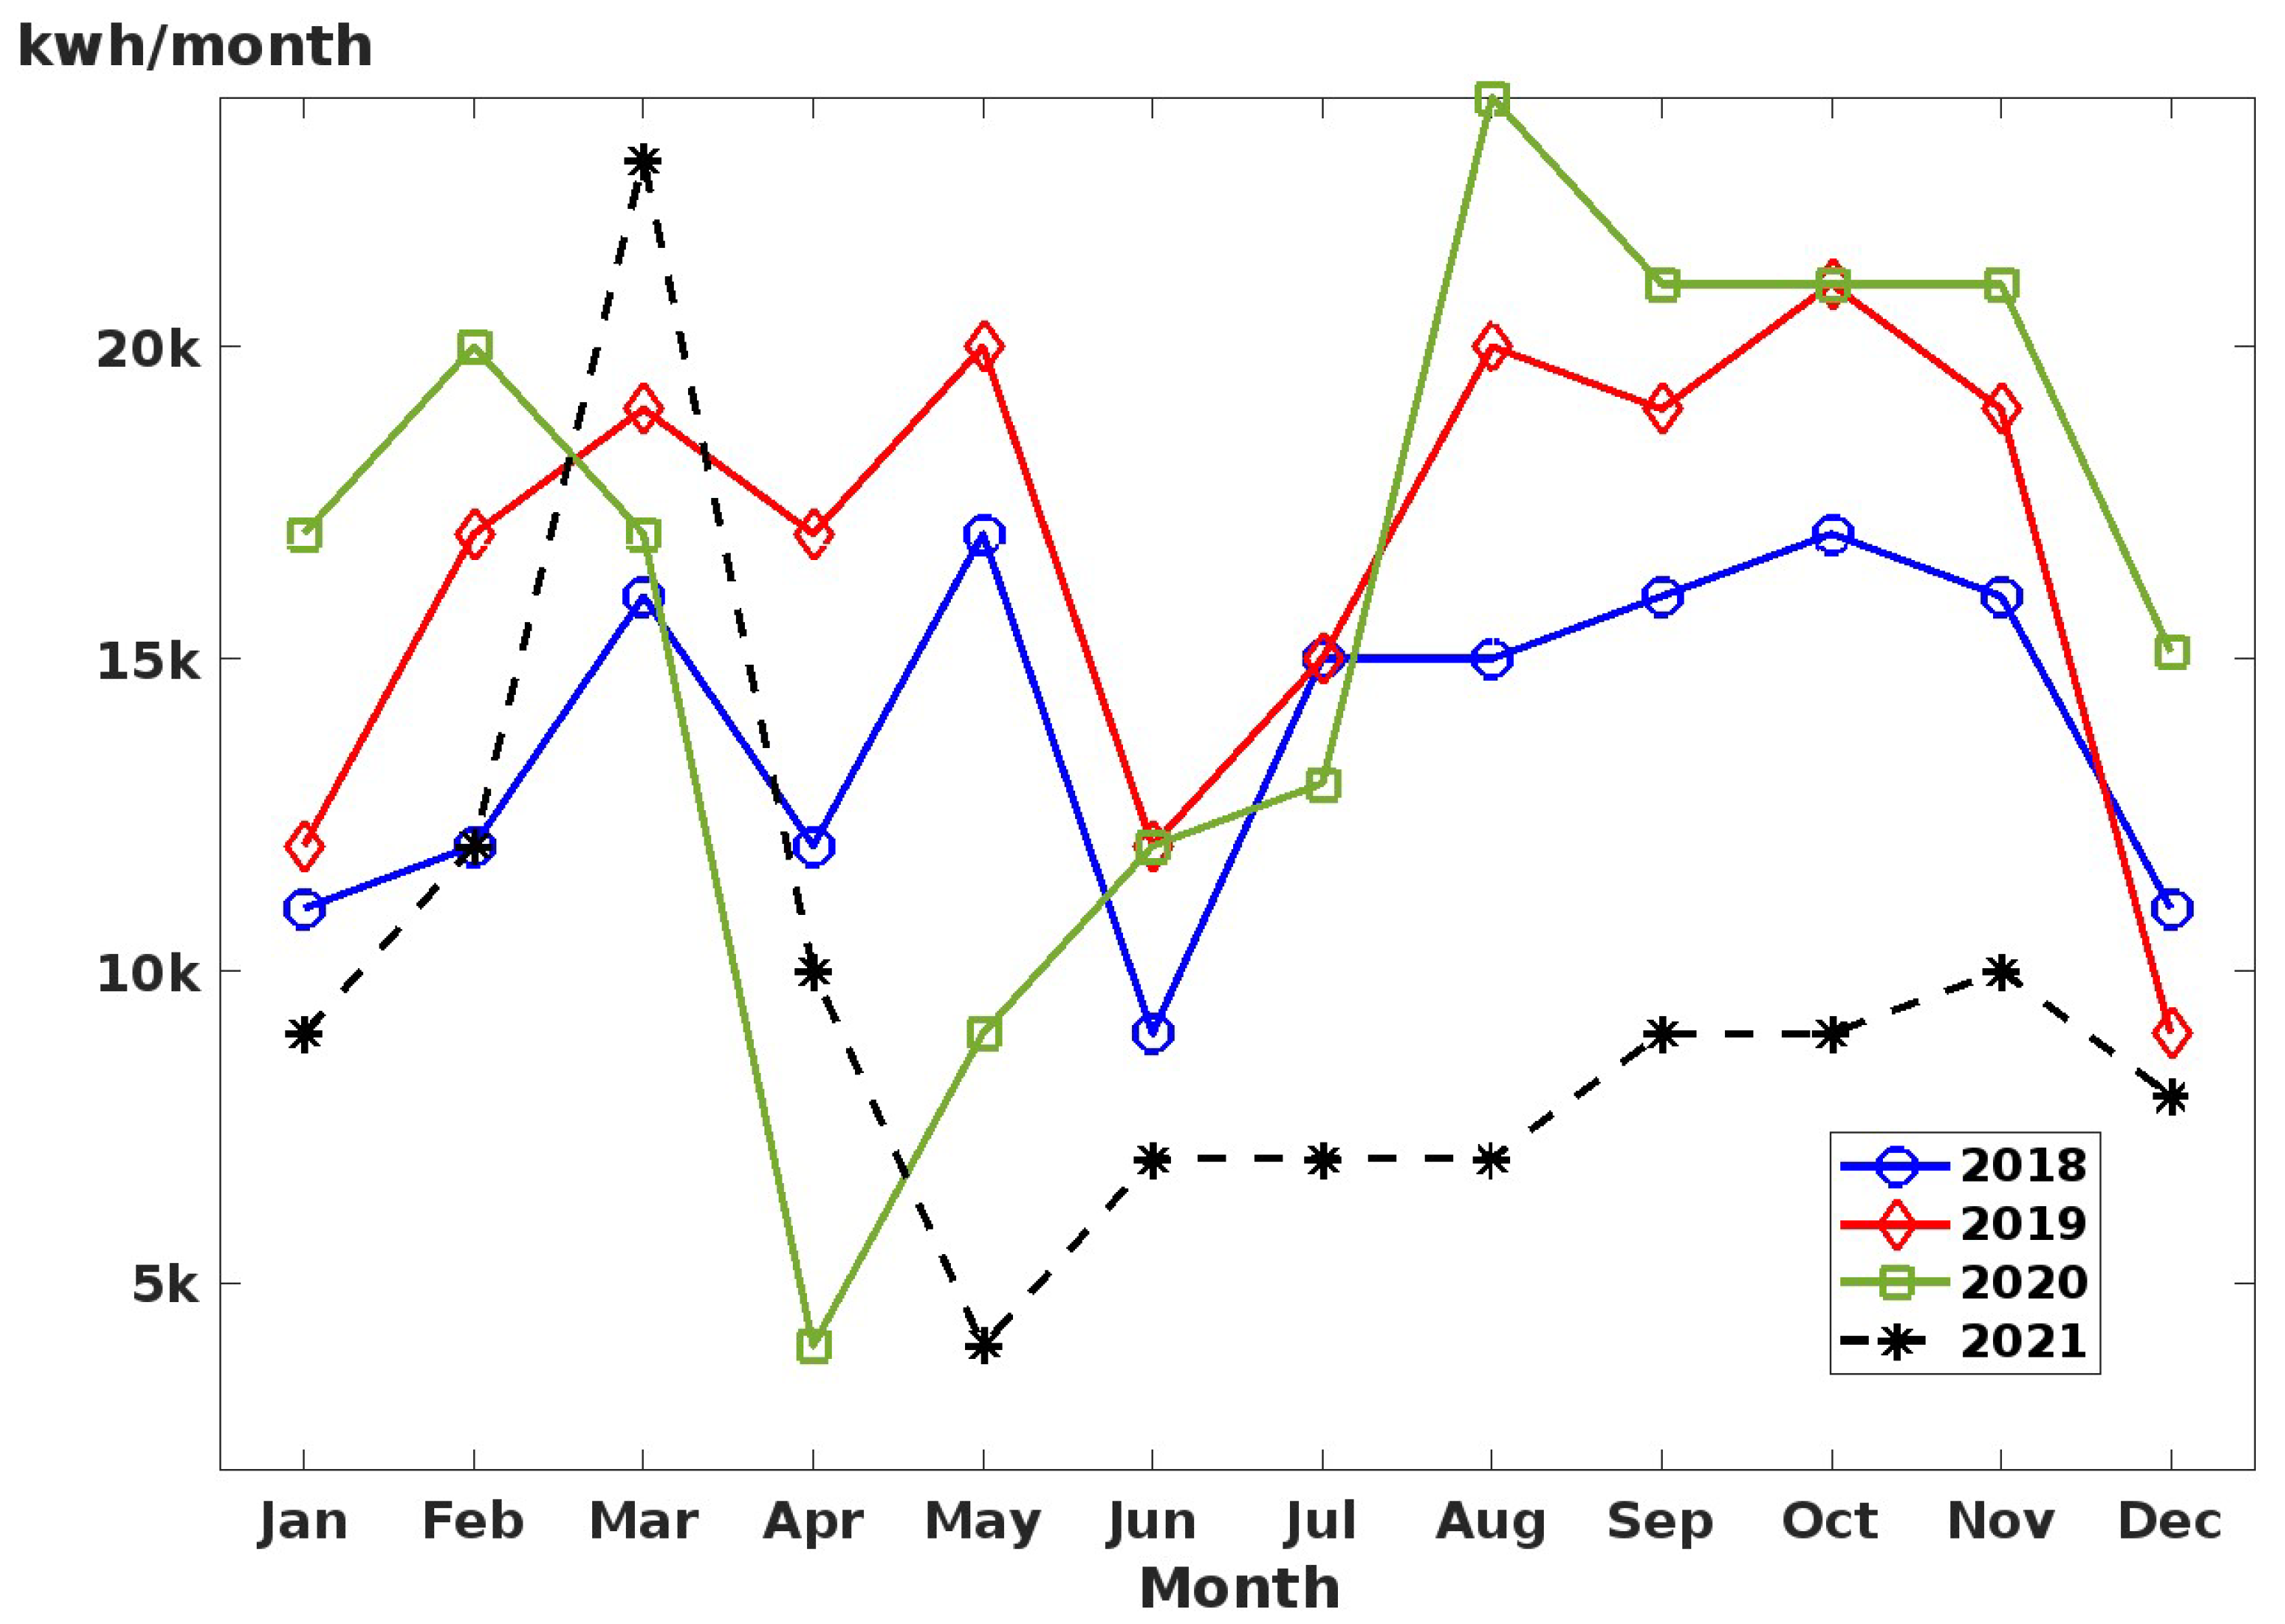
An example building was selected from the monthly energy usage statistics of the period of 2018–2021 (Figure 1). The energy usage profile indicates that this academic building has a usage pattern that resembles the academic year of an undergraduate student with the highest peak in April and May, owing to the following summer period. Energy usage has been constantly growing between 2018 and 2020. However, the value suddenly dropped in 2021 because of the COVID-19 pandemic, which resulted in lockdowns and a period of working from home. This reduction in energy usage has been steadily recovering to pre-COVID-19 levels and is forecast to rise further. In addition, the energy price will be much higher in the future as a result of inflation and conflicts. Thus, improvements in the building’s energy efficiency are one of the issues that needs to be addressed to achieve the energy initiative set by government policy.
In the case of Thailand, the Energy Policy and Planning Office (EPPO) of Thailand’s Ministry of Energy launched the Thailand Integrated Energy Blueprint (TIEB) [2] in 2014, which combined five short-term plans aimed at achieving sustainable growth of the country. Regarding The Energy Efficiency Plan 2018-2037 (EEP 2018) [3], the plan expected energy saving by 1166 ktoe or a 2% proportion of the final energy consumption reduction by applying building energy code to new buildings. Thailand’s Building Energy Code (BEC) came from the ministerial regulations, derived from the “Energy Conservation and Promotion Act. B.E. 1992” [4]. The BEC’s aim is to enforce the building in specific categories that have a total area of more than 2000 m2 to consider energy efficiency design and use of high-efficiency equipment during the initial state of the project. Ministerial Regulation in 2009 [5] has set minimum energy efficiency criteria for different building aspects consisting of the building envelope, lighting, air conditioning, water heating, renewable energy, and whole building energy consumption. Compliance with the BEC is mandatory for all newly constructed buildings and buildings that undergo significant renovations, and non-compliance can result in no approval for the construction or opening of the building. In addition, the BEC also aim to develop the code further in the future by tightening the standard according to newer technology, which will force the newer project to adhere to higher standards ranging from BEC in 2019 to High-Performance Standard (HEPS) in 2025, Economic Building (ECON) in 2031, and finally to Zero Energy Building (ZEB) in 2036.
In order to improve building energy efficiency, the largest aspect of the building that affects energy usage is the envelope system. The combining energy efficiency measuring a building envelope in aspects of WWR, shading, glazing, and insulation can achieve annual average energy savings by 35% [6]. The thermal performance and optimal thickness of the insulator material has been taken into consideration for a residential building, which provides a ratio that best performs in terms of energy saving [7]. Adding the AI-driven model to optimize the combination of material and components for a building envelope can increase energy savings by an additional 7.52% in cost and 8.48% in energy [8]. In arid and semi-arid climates, the annual cooling load can be reduced by 26% with the building envelope renovation [9]. The policy also presented an important role in setting the criteria for the newly constructed building to be applied. In an Italy case study, the regulatory bodies adjusted the level of the heat transfer coefficient depending on the climate zone [10]. A multifamily building’s renovation can save the energy range from 8.8% to 74.8% depending on the modern heating system [11]. For an academic building, the renovation process for the building envelope in a hot climate can also achieve energy savings by 54% with a payback period of around 5.5 years [12]. Different renovation techniques can provide large-scale energy savings ranging between project characteristics, which can reduce energy approximately by 50% [13]. The renovation process for an existing old apartment building can involve renovating into minimum energy performance but still not the level of a near zero energy building (nZEB) [14]. The technical, environmental, economic, and social feasibility of renovating a building into nZEB has been addressed [15]. A building renovation on different aspects such as air conditioning, lighting, equipment, etc., with additional PV installed demonstrated an energy reduction of 46% [16].
The BEC is an essential tool for improving a building’s energy efficiency. It provides minimum requirements for designing, constructing, and operating new and existing buildings to ensure energy efficiency and the judicious use of energy resources. A prior study used microdata from the American Community Survey (ACS) to evaluate the effects of building energy codes on energy cost. The data on the adoption of the building codes showed that energy codes were effective in decreasing household electricity expenses. Energy cost and climate are the main influences on energy efficiency and they also have a statistically consequential effect on energy use [17]. An example of the guideline that adopted building energy codes and delivers their potential benefits is discussed [18]. The suggestion for the outlines of building codes in countries such as Finland, Norway, Sweden, and Russia is introduced [19]. The innovations are a valuable tool to improve building energy codes. The consequences of virtual inspections include time and financial savings [20]. Therefore, the BEC is crucial for improving the energy efficiency of the building sector. It provides guidelines and standards that must be followed to ensure that a building is designed, constructed, and operated with energy efficiency in mind. By complying with BEC requirements, buildings can reduce their energy consumption and associated costs, lower greenhouse gas emissions, and improve occupant comfort and health.
An economic analysis can support determining the most effective and financially feasible solutions for improving a building’s energy efficiency by evaluating the costs and benefits of implementing energy-efficient technologies and strategies. An examination of existing residential buildings’ renovation in Ghana into net-zero energy buildings (NZEBs) by using energy efficiency and renewable energy sources found that the payback period for a renewable energy able to meet the remaining energy needs is estimated to be 6–10 years according to [21]. A life cycle cost analysis (LCCA) evaluates the economic feasibility of different energy conservation scenarios and measures. Results show that a phased retrofitting approach could result in significant energy savings and emission reductions with a reasonable payback period [22]. The passive measures for building renovations showing maximum energy-saving potential can be achieved by combining different building envelope technology. The recommended retrofitting combination can achieve a 51.8% primary energy reduction and a discounted payback period (DPP) of 18 years [23]. Examining an economic assessment of the energy regarding apartment buildings’ renovation shows that tax revenues from building renovation can achieve a cost-effective status [24]. Economic assessment of the proposed strategies for making a university building a ZEB defines retrofitting strategies that reduce the building’s energy consumption by 18.02% [25]. In summary, economic assessment plays an important part in energy efficiency by comprehensively analyzing the costs and benefits associated with different energy efficiency measures. Moreover, it makes it possible to identify the most cost-effective energy efficiency measures and facilitates the development of a financially viable plan for achieving NZEBs.
The objective of this research was to evaluate the feasibility of the renovations of old buildings into energy conservation buildings that comply with Thailand’s BEC by considering three aspects: building envelope, lighting, and air conditioning system. The BEC software was used to evaluate the energy performance of both the original and renovation cases. In addition, economic indicators were used to determine the feasibility of the building renovation. The main contributions of this study are as follows:
  • The thermal characteristics of the envelope material components considered for the renovation were studied to determine their efficiency in terms of thermal transfer in order to determine suitable material components from the aspects of efficiency and economy.
  • An economic feasibility analysis was performed on each sub-system in order to provide the project owner with options for building renovations, which are specific to sub-sections.
  • The renovation of the building was found to be capable of reducing the building peak load and providing additional spare power capacity from the original transformer to support future loads, such as electric vehicle (EV) chargers.
The rest of this paper is structured as follows: In Section 2, Thailand’s BEC is discussed. Details of simulated buildings and the case study used in this research are displayed in Section 3. A building code evaluation of both the current building and the renovated case is demonstrated in Section 4. Next, Section 5 details an analysis of the feasibility of renovating buildings for project owners on the basis of economic indicators, and Section 6 presents a discussion on the additional benefits of building renovations. Finally, the conclusions are summarized in Section 7. A nomenclature list is provided in the final section.

2. Building Energy Code

Thailand’s BEC is designed for nine types of buildings, both newly constructed and retrofitted, with a total area of more than 2000 m2, and evaluates the energy aspect of the building. This standard categorizes buildings into three groups depending on the operating hours. The first group consists of buildings that are operated for an average of 8 h/day and consist mainly of buildings used for education and offices (Group 1). The second group are buildings that are operated for an average of 12 h/day and consist of theatres, convention halls, entertainment buildings, and department stores (Group 2). The final group are buildings that are operated for an average of 24 h/day and consist of hotels, hospitals, and condominiums (Group 3). There are six aspects that are generally assessed, namely the building envelope, lighting system, air conditioning system, hot water system, renewable energy system, and whole building energy consumption.
Regarding the envelope system, the BEC uses the overall thermal transfer value (OTTV) and the roof thermal transfer value (RTTV) as indicators for determining the efficiency of the materials used. First, the heat transfer coefficient for the material used in the building envelope is calculated by using the material thermal resistance, which comes from the thermal conductivity and thickness of material by using Equations (1) and (2). The heat transfer coefficient of the building envelope will then be used to determine the thermal transfer of each individual section of the building by using Equations (3) and (4). Finally, the amount of heat passing through the areas of the wall or roof for the entire building is calculated by combining the OTTV and RTTV for each section in the weight distributed manner as displayed in Equations (5) and (6).
R T = R o + Δ x k + R i
U w , r , f = 1 R T
O T T V i = U W 1 W W R T D e q + U f W W R Δ T + W W R S H G C S C E S R
R T T V i = U r 1 S R R T D e q + U f S S R Δ T + S S R S H G C S C E S R
O T T V = A w 1 O T T V 1 + A w 2 O T T V 2 + . . . + A w i O T T V i A w 1 + A w 2 + . . . + A w i
R T T V = A w 1 R T T V 1 + A w 2 R T T V 2 + . . . + A w i R T T V i A w 1 + A w 2 + . . . + A w i
The standard only evaluates the wall or roof areas that directly connect with the environment and rooms with air conditioning units. The calculation methodology based on the external thermal value from the environment can contribute to the cooling load of the air conditioning unit through the area with the air conditioning unit and thus affect the energy consumption of the entire building. BEC maximum allowance values for OTTV and RTTV for each of the building types are summarized in Table 1.
With regard to the lighting system, the building code evaluates only the energy efficiency of the building and not the lighting quality, which is considered in a separate law. The calculation of the energy efficiency is based on the light power density (LPD), which is the ratio between the total energy usage of a building and the building floor area. However, parking lots are not included in the calculation owing to their low lighting requirement as they may skew the lighting efficiency result. BEC sets the maximum lighting power density for a working area to indicate the performance of the lighting system according to different building categories, as summarized in Table 1.
Regarding air conditioning systems, the building code distinguishes between split-type units and central-type units. A large proportion of small-size buildings mainly use split-type air conditioning systems because of constraints in the budget and installation area. For a split-type air conditioning system, BEC evaluates the performance of each individual unit. In the case of one of the units failing the standard, it is assumed that all units in the building fail. Before the standard revision, the coefficient of performance was used as an indicator. Currently, the seasonal energy efficiency ratio (SEER) is the value that is used to evaluate split-type air conditioning units. The code categorizes split-type air conditioning units into fixed speed and variable speed (inverter) because of the different performances of different technologies. The SEER value is tied to the “label no. 5” standard developed by the Electricity Generating Authority of Thailand (EGAT) for electric appliances in Thailand. So, any building that has split-type air conditioning units with the label no. 5 marks will automatically pass the energy code. For the size of an air conditioning unit with a fixed speed around 8000 W, SEER higher than 12.85 is compliant with the standard and the unit; from 8000 to 12,000 W, a unit with SEER higher than 12.40 is compliant. For an air conditioning unit with variable speed, SEER around 15.00 for a unit size of 8000 W and SEER around 14.00 for a unit size up to 12,000 W are compliant with building code.
With regard to a hot water system, the energy code evaluates only the efficiency of the boiler and the coefficient of performance (COP) in case of a heat pump. The standard does not include the energy usage of hot water systems in the whole building energy calculation. Thus, hot water systems are evaluated separately for both pathways. In the case of renewable energy, the annual energy generated can directly support the whole building energy consumption. The building code based the calculation of whole building energy usage on three parts as shown in Equation (7). First, the energy usage in the air conditioning systems can be calculated by combining the cooling load from the building envelope, lighting, equipment, occupants, and air ventilation. The second part is energy usage from the lighting system and equipment. Finally, the electrical energy is generated from renewable sources that provide a direct subsidy to whole building energy consumption.
E p a = i = 1 n A w i O T T V i C O P i + A r i ( R T T V i ) C O P i + A i C l ( L P D i ) + C e ( E Q D i ) + 130 C o ( O C C U i ) + 24 C v ( V E N T i ) C O P i η h + i = 1 n A i ( L P D i + E Q D i ) η h ( P V E + H E E + O R E )
In order to comply with BEC, the building code provides two pathways in order to allow the project owner to have leeway in their design of the building. The first pathway consists of passing the sub-system evaluation involving the building envelope, lighting, air conditioning, and hot water system. The second pathway is used in case the sub-system does not comply with building code, and the whole building energy usage and hot water system will be under evaluation instead. The pathway for compliance with BEC can be summarized as shown in the diagram from Figure 2.
The detail of BEC software is the program that was designed and approved by the Ministry of Energy, Thailand. This is the calculation model based on the cooling load and OTTV, which is similar to DOE-2.1E software from the United States Department of Energy with the database referencing the detail from the Department of Alternative Energy Development and Efficiency (DEDE) [26]. The main functionality of the software is the evaluation of a building in the aspects of envelope systems, lighting system, air conditioning system, hot water generation system, renewable energy, and whole building energy consumption in accordance with Thailand Building Energy Code. The limitation of the software is the calculation of lighting quality, the calculation of renewable energy, and building with complex functionality, which require additional software for simulation [27].

3. Building Selection and Renovation Process

A building that has criteria for both area types that falls under Jurisdiction of Thailand Building Energy Code but not in compliance with the code due to the construction period that pre-dated the law was selected as a case study. The building, with characteristics similar to other commonly built buildings in the same category, was also taken into consideration to provide widely applicable results. The study process consisted of selecting the case study building for simulation. The floor plan of the building was used to extract the amount of lighting equipment and air conditioning units, and the components of walls, the roof, and windows. The data from the current building were evaluated using BEC software in order to determine whether each sub-system complies with building code. For the building envelope, the thermal transfer analysis on the current material used in the original building was simulated using COMSOL Multiphysics software. After that, the different material with a better thermal characteristic was evaluated in terms of the thermal transfer analysis and was selected as a renovation case. For the lighting system, the amount of equipment could be directly counted from the floor plan and the energy efficiency could be evaluated by using the BEC software. To renovate the lighting system, DIALux software (version 4.13) was used to simulate the replacement software to assess whether it can provide similar lighting quality to the current one. The efficiency of an air conditioning unit could be individually calculated and a better-efficiency unit could be selected for replacement. After the renovation process is completed, the building will be subject to another BEC evaluation in order to confirm that all sub-systems are in compliance with building code. Finally, the cost of the overall renovation process and the cash flow from energy cost reduction were calculated to determine the project feasibility. In addition, an increasing transformer spare power capacity result from load reduction could be used to support future loads. The overall process of the study can be summarized in a diagram as shown in Figure 3.

3.1. Case Study Building

The case study building was modelled after the main lecture building in the Department of Civil Engineering, School of Engineering, King Mongkut’s Institute of Technology Ladkrabang, Thailand. The building has four stories with a total floor area of 3062 m2 and consists of one auditorium, lecture rooms, laboratories, and office space for staff and lecturers. This building was constructed in 1992 before the approval of energy conservation and is on the list for renovation. The building has a floor area of more than 2000 m2, which is within the criteria for building code evaluation. In addition, this building was constructed with similar characteristics to many education-type buildings in Thailand during that time period. Thus, the renovation proposal conducted regarding the case study building can be widely applicable to other building with similar aging and characteristics. Therefore, it was selected as a case study for the evaluation and renovation to achieve energy conservation according to Thailand’s BEC. The floor plan of the entire building is shown in Figure 4.
A single line diagram of the case study building is shown in Figure 5. The electrical load of the current building is supplied with power from a 250 kVA transformer through a main distribution board via a main feeder with 12 × 150, G-50 mm2 on a cable tray. The main circuit breaker consists of three poles with 400 AT before the power is fed through the distribution board onto each floor with a 160 AT circuit breaker and 4 × 95, G-10 mm2. The renovation includes the lighting and air conditioning units, which were replaced with newer technology with higher efficiency and lower power requirements. While the transformer is still the original unit, the connected load on each distribution board can be reduced and additional capacity can be provided for future loads or the size of the circuit breaker can be changed.

3.2. Building Envelope

In order to evaluate the energy efficiency of the materials and components used in the building envelope (i.e., both the wall and roof), simulations were performed using COMSOL Multiphysics 5.6. The thermal transfer characteristics of the components of both the original construction material and the possible renovation material were evaluated. Regarding the original building, the components of the materials used in the building envelope consist of dry clay blocks with cement plaster. The thermal characteristics of the materials and a component diagram are summarized in Table 2.
The model of the original wall used in the case study was simulated using COMSOL Multiphysics 5.6. A simulation of the thermal transfer between the exterior and interior surface temperature throughout the daytime period was performed and the result is shown in Figure 6. The false-color diagram shows that the exterior heat can penetrate through the material without resistance, which results in a high interior surface temperature. The current material used in the building envelope consists of the plaster and dry clay brick, which has high thermal conductivity and result in a high heat transfer coefficient. This thermal characteristic directly affects the OTTV of the building envelope.
To renovate the wall section of the building envelope with more energy-efficient materials, three types of material components were used and the thermal transfer simulation result was used to determine the material component with the highest efficiency. A diagram of the material component used in the renovation and the thermal characteristics of the material are shown in Table 3.
The simulation result in terms of heat transfer at 14 h for each wall material and component renovation case studies are shown in Figure 7. The false-color diagram shows that under a similar exterior surface temperature condition, the renovating material can reduce heat transfer into the building. The thermal transfer from the environment encounters the resistance on the fiberglass insulation layer, which has the lowest thermal conductivity and a heat transfer coefficient being about three times reduced compared to the original material. Thus, the interior surface temperature in all three renovation case studies is significantly reduced to a similar level. On the other hand, an additional component such as the gypsum board or autoclaved aerated concrete can only provide little reduction in thermal transfer in comparison with fiberglass insulation. This results in little differentiation in interior surface temperature for the renovated envelope in the case studies.
Figure 8 shows the results of plotting the obtained surface temperatures of both the exterior and interior of the original wall and the various renovated roof cases throughout a day. The results show that the original wall has a lower thermal resistance, resulting in a higher temperature inside the building. In regards to the renovation case, the interior temperatures are reduced significantly in all three cases because of the additional fiberglass insulation that decreases the thermal transmittance of the wall. A material such as a gypsum board provides an additional reduction in thermal transfer but not on the same scale as a fiberglass insulator. So, the wall material and component of renovation case 1 were selected as the wall-type envelope replacement due to easier installation and a slightly different efficiency in comparison with other cases.
For the roof section of the envelope, the material used in the original building roof consists of a metal sheet with an air gap acting as an insulator before a gypsum board connected to an air-conditioned space. A simplified diagram of the current roof material and its thermal properties are listed in Table 4.
A model of the original roof in the case study was simulated using COMSOL Multiphysics 5.6. The simulation was conducted similarly to the one for the wall by calculating the thermal transfer between the exterior and interior surface temperatures throughout a day. The results are shown in Figure 9.
The false-color analysis results indicate that the heat transfer into the building encounters the air gap, which acts as the thermal resistance due to lower thermal conductivity. Thus, the temperature for the interior surface is lower compared to the wall. Even though the air gap acts as a thermal resistance, it is still not enough, especially since the area where the air gap is thin due to the metal sheet has better thermal conductivity and the gypsum board does not provide significant thermal resistance. So, the RTTV for the original roof was still high and a renovation of the rooftop was necessary. The overall exterior and a diagram of the renovated roof material components used in the building envelope and its thermal specifications are shown in Table 5.
The simulation result in terms of heat transfer at 14 h for each roof material and component renovation case studies are shown in Figure 10. The result in terms of the false-color analysis shows that at a similar exterior surface temperature condition, the renovating material can significantly reduce heat transfer into the building except for case 2, which only replaces the metal sheet with roof tile. The thermal conductivity reduction in comparison with the metal sheet is not enough to provide case 2 with a better heat transfer coefficient due to the small thickness of the material. The renovation cases with an additional fiberglass insulator, which are case 1 and case 3, can affect the interior surface temperature in the two renovation case studies with a fiberglass insulator. This results from better thermal conductivity from the fiberglass insulator and it can resist heat transfer better than the air gap.
The results of plotting the obtained surface temperatures for both the exterior and interior of the original roof and various renovated roof cases are shown in Figure 11. The results show that the original roof has a lower thermal resistance, which results in a higher temperature inside the building. After the renovation, the interior temperature was significantly reduced for the cases with an addition of fiberglass insulation, which decreases the thermal transmittance of the roof. A material such as a roof tile provides an additional reduction in thermal transfer but not on a scale similar to the fiberglass insulator. So, the roof material and component of renovation case 1 were selected as the roof-type envelope replacement due to easier installation with only the addition of a fiberglass insulator and the efficiency is in an acceptable range.

3.3. Lighting System

With regard to a lighting system, Thailand’s BEC only evaluates the LPD value for the lighting installed for a building with the exclusion of a parking lot. Thus, external software such as DIALux was used to simulate the lighting quality on the working plane. The details of the lighting equipment used in the case study building, shown in Table 6, indicate that the original lighting used in the case study building consisted of fluorescent lamps, which is an old technology with a low efficiency and low lighting power density.
The results from the lighting simulation using DIALux software in the aspect of isolux curves on the example room are shown in Figure 12. Based on the simulation, the currently used fluorescent lighting achieved an average illuminance on the working plane of 410 lux, which is within the labor standard value range for lighting quality for an office space at around 300–500 lux. For the renovation case, the LED lighting replacement achieved higher average illuminance on the working plane in comparison with the fluorescent lighting with a value around 472 lux. In addition, the minimum illuminance value is also increased, which in turn improved uniformity. However, the power requirement for the LED lighting is significantly lower, which results in less energy consumption and increased efficiency in the lighting system.

3.4. Air Conditioning System

With regard to an air conditioning unit, the BEC evaluated the efficiency of each individual air conditioning unit. The building inspection found that the currently used air conditioning unit is a fixed-speed split-type air conditioning system. Details of the currently used air conditioning system and the replacement unit are shown in Table 7.
Evidently, the currently used air conditioning unit of the fixed speed type has a low efficiency because the unit was purchased before the new energy conservation standard was implemented. Thus, an inverter-type split-type air conditioning unit was chosen as a replacement in order to significantly improve the efficiency and reduce the energy usage of the building.

4. Energy Evaluation

The original building does not have a hot water system or renewable energy system. So, the BEC evaluated only four main systems: the building envelope system, lighting system, air conditioning system, and whole building energy consumption. The results from the BEC evaluation are shown in Table 8.
The table indicates that the currently used building has an efficiency for OTTV of 79.724 W/m2 and RTTV of 23.117 W/m2, which is lower than the standard compliance at 50 W/m2 and 10 W/m2 for OTTV and RTTV, respectively. The reason for this is that the case study building was constructed during a time in which energy evaluation was not required and the energy perspective was not taken into consideration during the design phase. Therefore, the material used for the walls, windows, and roof have a low thermal efficiency. Furthermore, the currently used lighting is fluorescent lighting. The efficacy in terms of the power consumption per area is a bit high but it still complies with the building code with an LPD of 9.88 w/m2. For the air conditioning system, the original unit that came with the building has a low energy efficiency owing to the outdated technology. The average SEER value for the air conditioning unit is 4.39 BTU/h/W, which is significantly lower than the standard allowance because of the age of the air conditioning unit and its technology. Thus, the case study building does not pass this part of the BEC evaluation. When pathway two is evaluated, the evaluated building is observed to have a higher energy consumption than the reference building. Therefore, the case study building does not pass pathway two either; thus, the building fails to comply with the BEC.
During renovation, the envelope materials, lighting system, and air conditioning unit were replaced. The building is subject to re-evaluation using BEC software in compliance with Thailand’s BEC. The results of the renovated building from the BEC evaluation are shown in Table 9.
Evidently, after renovating the envelope system, the energy usage of the entire building was significantly reduced. This is attributable to a reduction in the thermal transfer from the environment, which is the main contribution to the cooling load of the air conditioning system. In addition, the replacement LED lighting system has a significantly higher efficacy. Thus, the LPD of the renovated building was reduced by half compared with the original case study building. The renovated building passes the BEC in both pathways one and two. Thus, the renovated building is compliant with the building code.
However, the evaluation of a building only from an energy perspective may not be sufficient to convince project owners to renovate the building. Thus, the economic perspective must be taken into consideration in order to provide project owners with feasible plans for renovations.

5. Economic Evaluation

Several economic parameters can be used to determine the feasibility of the project owner investing in building renovation. In this research, two economic indicators consisting of DPP and IRR were selected as determined factors for feasibility to invest in building renovation. IRR is the parameter that measures the rate at which the discounted cash flow from the retrofitted project equals the initial investment. The value takes the NPV into consideration, which can be calculated by using Equation (8). So, the IRR is the discount rate that NPV will be zero as shown in Equation (9). The payback period is a commonly used parameter to determine the length of time required for the initial investment to be recouped through cash inflows. Thus, the DPP takes the NPV into account during the calculation of the cash flow process, which is displayed in Equation (10).
N P V = i = 1 n C i ( 1 + r ) i C 0
0 = N P V = i = 1 n C i ( 1 + I R R ) i C 0
D P P = ln ( 1 1 C 0 × r C i ) ÷ ln ( 1 + r )
An evaluation process of the economic feasibility of the building renovation projects used can be conducted by using an economic indicator to determine the cash flow that can be achieved after initial investment into building renovation. The material cost and labor cost data for building renovations are taken from the Comptroller General’s Department (CGD) [28]. For the electricity price, the (MEA) for meter type 4 of a government building was used as reference data [29]. To renovate the building envelope, the material and labor cost can be summarized as shown in Table 10. The exchange rate using in calculation is 35 Thai Baht to 1 USD.
The details of the equipment and labor costs for replacing the lighting system and the air conditioning system in the building are summarized in Table 11. Regarding the lighting system, the cost for LED luminaire that will be used as a replacement varies on the wattage of the luminaire. For the air conditioning system, the equipment cost for an air conditioning unit is dependent on the capacity of the unit. However, the labor cost for replacement of the luminaire and air conditioning unit is calculated on the point basis. Thus, the labor cost will be fixed according to CGD.
The economic feasibility of a building renovation can be determined by calculating the initial investment cost and positive cash flow from energy cost reduction. The energy cost for the building can be calculated with electricity cost from MEA by using the time of use tariff rate (TOU tariff). The current price is 4.3297 baht per kWh or USD 0.14 per kWh [29]. For the economic data, the interest rate that will be used to calculate the present value is 1.75% according to the Bank of Thailand [30]. The results in terms of the net energy savings from the BEC software in the case of a building renovation and energy cost savings can be summarized as shown in Table 12. The annual cash flow from the retrofit project over 10 years is shown in detail in Table 13.
From annual cash flow, the initial investment cost in year 0 is around USD 100 k from the equipment and labor cost for the renovation project. The positive cash flow comes from annual energy cost saving, which is around USD 20k per year. The results of an economic evaluation show that the net present value for the 10-year time project is USD 86,015. The economic indicators from the study show that the proposed building renovation can achieve DPP within 4.98 years and has an IRR value of 20.89%. This indicator shows that the renovation project is feasible and an attractive indicator is achieved. This result demonstrates that renovating an entire building according to BEC can achieve both building energy reduction and decreased project owner energy cost over the project life-time.

6. Renovation Side Benefits

After renovating a building, the currently used transformer would have additional spare power capacity as a result of the reduction in the energy consumption by the whole building. The load table for the building main distribution board both for the original and renovation case can be summarized as shown in Table 14.
From the load table, the total connected load connected with the main distribution board was reduced from 389.477 kVA to 349.171 kVA after building renovation. This results in an increased spare capacity of 40.573 kVA without transformer replacement. Thus, future loads, such as those of electric vehicle chargers, can be accommodated in order to support the raising number of EV cars in the future.
In order to renovate buildings to support future loads such as those of electric vehicles, the load and circuit breaker on the first floor were rearranged to provide spare capacity for the EV chargers, which were connected to the first-floor distribution board in the renovation case as shown in Table 15. The load table for the first-floor distribution board and the results on the load show that 21 kVA chargers can be installed on the first floor without any changes to the circuit breaker or cables being necessary.
It can be seen that additional benefits of building renovation with newer technology require less power demand. Thus, an original transformer can provide room to support newer load. As the case study has an original transformer (3 phase 250 kVA) with renovation, the load demand of the building can be reduced by 13 kVA (each phase), which is around a 5.5% reduction compared to the original building. So, the additional EV charger was selected as the AC charger on the first floor due to limitation of the original transformer. On the other hand, renovating the building with large-scale load demand can provide much more leeway in the additional power transformer capacity. So, the additional charging unit or DC charger, which require higher power demand, can be installed for the building.

7. Conclusions

This study aimed to propose building renovation in compliance with the Thailand Building Energy Code. The results demonstrate that the energy efficiency of the envelope system has a significant impact on the energy consumption of the entire building. In addition, the lighting and air conditioning system with old and outdated technology also impact energy usage in the building. In the case of the building envelope, the thermal transfer from the environment has a direct impact on the cooling load, which also directly contributes to the energy usage of the air conditioning system. With regard to the lighting system, replacing the originally installed fluorescent system with an LED system with similar lighting qualifications can reduce the energy usage of the lighting system. Thus, the original building does not comply with building code on both pathways. So, the building renovation for each sub-system consisting of the envelope system, lighting system, and air conditioning system has been conducted.
After evaluation with BEC, it was shown that the LPD of the case with lighting replacement can be reduced significantly compared with the original case study building. For the air conditioning system, the newer variable-speed-type air conditioning unit provides greater efficiency with SEER significantly higher than the allowance value. By changing the opaque component with additional fiber insulation in the case of walls and a metal sheet roof with a high-performance label fiber insulation in the case of the roof, the OTTV and RTTV were reduced significantly. The result of the renovation of each sub-system in the aspect of energy and economics can be summarized as shown in Table 16.
From the table, it was found that the net renovation cost of all sub-systems in the case study building was USD 96,355.01. The reduction in the total energy consumption of the building was 145.019 kWh/year, which can save energy with USD 20,302.62 per year. Based on economic calculations, it was found that the payback period of this project is 4.98 years and that the IRR is 20.89%. However, renovating sub-systems individually may provide greater return on investment with a lesser payback period but in this case, the building has issues with building code compliance. So, the entire building needs to be addressed in the renovation process. The result from the building renovation demonstrated that changing the envelope can achieve significant reduction in whole building energy consumption due to decreasing cooling load, while renovating an entire building can prove additional side benefits from power demand reduction in the transformer that can provide spare capacity for future loads in the building. This whole renovation process taken under an economic analysis still displayed the feasibility and attractive economic indicator for the project owner and investment.
The result from the renovation process demonstrated that redesigning the building in compliance with building code can reduce energy usage and achieved return on investment from energy cost reduction. This renovation process proposed in this research can be applied to other buildings (both office- and educational-type buildings), which have similar operating hours and building code criteria. However, the building code based many factors on the topology and climate of Thailand as a reference, and some renovation recommendations may apply only to buildings located in a tropical climate. In future work, the relation between envelope material and thermal transfer with an aspect of the impact on cooling load needs to be further evaluated. The usage of renewable energy and presence of future load can be further explored. In addition, the sensitivity analysis on the economic parameter needs to be addressed in order to evaluate the renovation process in every aspect.

Author Contributions

Conceptualization, S.A. and P.C.; methodology, S.T.; software, S.A.; validation, A.N. and P.C.; formal analysis, S.T.; investigation, S.T.; resources, P.C. and A.N.; data curation, S.T.; writing—original draft preparation, S.A. and S.T.; writing—review and editing, A.N.; visualization, S.T.; supervision, A.N.; project administration, P.C.; funding acquisition, P.C. All authors have read and agreed to the published version of the manuscript.

Funding

This research was funded by the Srinakharinwirot University Research Fund.

Institutional Review Board Statement

Not applicable.

Informed Consent Statement

Not applicable.

Data Availability Statement

Data sharing is not applicable.

Conflicts of Interest

The authors declare no conflict of interest.

Nomenclature

R T Total thermal resistance of the envelope component(m2·°C)/w
R o Thermal resistance of exterior air film(m2·°C)/w
R i Thermal resistance of interior air film(m2·°C)/w
Δ x Material thicknessm
k Material thermal conductivity(W/m·K)
O T T V Total overall thermal transfer value of external walls with air-conditioned spacew/m2
O T T V i Overall thermal transfer value of external walls on section iw/m2
R T T V Total roof thermal transfer value with air-conditioned spacew/m2
R T T V i Roof thermal transfer value of roof on section iw/m2
W W R Window-to-wall ratio-
S R R Skylight-to-roof ratio-
T D e q Differential of equivalent temperature°C
U w Heat transfer coefficient for opaque materialw/(m2·°C)
U f Heat transfer coefficient for transparent materialw/(m2·°C)
U r Heat transfer coefficient for roof materialw/(m2·°C)
Δ T Differential temperature between building interior and exterior°C
S H G C Solar heat gain coefficient-
S C Shading coefficient-
E S R Effective solar radiationw/m2
A w i Area of wall on section im2
A r i Area of roof on section im2
E p a Annual whole building energy consumptionkWh/yrs.
C O P i Coefficient of performance-
L P D i Lighting power density on area iw/m2
E Q D i Equipment power density on area iw/m2
O C C U i Average occupant on area iperson/m2
V E N T i Volume of air ventilation and leakagel/s/m2
η h Annual operating hourHrs.
C l Coefficient of thermal power contribution to cooling load from lighting system-
C e Coefficient of thermal power contribution to cooling load from equipment-
C o Coefficient of thermal power contribution to cooling load from occupant-
C v Coefficient of thermal power contribution to cooling load from ventilation-
P V E Annual power generated with photovoltaic energykWh/yrs.
H E E Annual heat to electrical energy exchangekWh/yrs.
O R E Annual power generated with other renewable energykWh/yrs.
N P V Net present valueUSD
I R R Internal rate of return%
D P P Discounted payback periodYrs.
C i Estimated net cash flow for period iUSD
C 0 Initial investmentUSD
r Discounted rate-
n Life-time of the projectYrs.

References

  1. International Energy Agency. World Energy Outlook 2022. Available online: https://www.iea.org/reports/world-energy-outlook-2022 (accessed on 1 October 2022).
  2. Traivivatana, S.; Wangjiraniran, W. Thailand Integrated Energy Blueprint (TIEB): One Step towards Sustainable Energy Sector. Energy Procedia 2019, 157, 492–497. [Google Scholar] [CrossRef]
  3. Energy Policy and Planning Office (EPPO), Ministry of Energy. Energy Efficiency Plan 2015–2036 (EEP 2015); Energy Policy and Planning Office (EPPO), Ministry of Energy: Bangkok, Thailand, 12 August 2015. [Google Scholar]
  4. Department of Alternative Energy Development and Efficiency. The Energy Conservation Promotion ACT B.E. 2535; The Energy Policy and Planning Office: Bangkok, Thailand, 2 April 1992. [Google Scholar]
  5. Department of Alternative Energy Development and Efficiency (DEDE). Ministerial Regulation Prescribing Standard, Criteria, and Energy Management Procedures In Designated Factories and Buildings, B.E. 2552; Department of Alternative Energy Development and Efficiency (DEDE): Bangkok, Thailand, 2009. [Google Scholar]
  6. Gupta, V.; Deb, C. Envelope design for low-energy buildings in the tropics: A review. Renew. Sustain. Energy Rev. 2023, 186, 113650. [Google Scholar] [CrossRef]
  7. Huang, J.; Wang, S.; Teng, F.; Feng, W. Thermal performance optimization of envelope in the energy-saving renovation of existing residential buildings. Energy Build. 2021, 247, 111103. [Google Scholar] [CrossRef]
  8. Long, L.D. An AI-driven model for predicting and optimizing energy-efficient building envelopes. Alex. Eng. J. 2023, 79, 480–501. [Google Scholar] [CrossRef]
  9. Vakilinezhad, R.; Khabir, S. Evaluation of thermal and energy performance of cool envelopes on low-rise residential buildings in hot climates. J. Build. Eng. 2023, 72, 106643. [Google Scholar] [CrossRef]
  10. Baglivo, C.; Congedo, P.M.; Malatesta, N.A. Building envelope resilience to climate change under Italian energy policies. J. Clean. Prod. 2023, 411, 137345. [Google Scholar] [CrossRef]
  11. Cholewa, T.; Balaras, C.A.; Nižetić, S.; Siuta-Olcha, A. On calculated and actual energy savings from thermal building renovations—Long term field evaluation of multifamily buildings. Energy Build. 2020, 223, 110145. [Google Scholar] [CrossRef]
  12. Ali, H.; Hashlamun, R. Envelope retrofitting strategies for public school buildings in Jordan. J. Build. Eng. 2019, 25, 100819. [Google Scholar] [CrossRef]
  13. Cho, K.; Yang, J.; Kim, T.; Jang, W. Influence of building characteristics and renovation techniques on the energy-saving performances of EU smart city projects. Energy Build. 2021, 252, 111477. [Google Scholar] [CrossRef]
  14. Hamburg, A.; Kuusk, K.; Mikola, A.; Kalamees, T. Realisation of energy performance targets of an old apartment building renovated to nZEB. Energy 2020, 194, 116874. [Google Scholar] [CrossRef]
  15. Holopainen, R.; Milandru, A.; Ahvenniemi, H.; Häkkinen, T. Feasibility Studies of Energy Retrofits–Case Studies of Nearly Zero-energy Building Renovation. Energy Procedia 2016, 96, 146–157. [Google Scholar] [CrossRef]
  16. Costa, J.F.W.; Amorim, C.N.D.; Silva, J.C.R. Retrofit guidelines towards the achievement of net zero energy buildings for office buildings in Brasilia. J. Build. Eng. 2020, 32, 101680. [Google Scholar] [CrossRef]
  17. Kellogg, K.A.; La Cumbre-Gibbs, N. The impact of state level residential building code stringency on energy consumption in the United States. Energy Build. 2023, 278, 112607. [Google Scholar] [CrossRef]
  18. Evans, M.; Roshchanka, V.; Graham, P. An international survey of building energy codes and their implementation. J. Clean. Prod. 2017, 158, 382–389. [Google Scholar] [CrossRef]
  19. Allard, I.; Nair, G.; Olofsson, T. Energy performance criteria for residential buildings: A comparison of Finnish, Norwegian, Swedish, and Russian building codes. Energy Build. 2021, 250, 111276. [Google Scholar] [CrossRef]
  20. Mott, A.; Delgado, A.; Evans, M. What, why and when to go virtual: An international analysis of early adopters of virtual building energy codes inspections. Energy Res. Soc. Sci. 2022, 94, 102874. [Google Scholar] [CrossRef]
  21. Ohene, E.; Hsu, S.-C.; Chan, A.P. Feasibility and retrofit guidelines towards net-zero energy buildings in tropical climates: A case of Ghana. Energy Build. 2022, 269, 112252. [Google Scholar] [CrossRef]
  22. Heidari, M.; Rahdar, M.H.; Dutta, A.; Nasiri, F. An energy retrofit roadmap to net-zero energy and carbon footprint for single-family houses in Canada. J. Build. Eng. 2022, 60, 105141. [Google Scholar] [CrossRef]
  23. Qu, K.; Chen, X.; Wang, Y.; Calautit, J.; Riffat, S.; Cui, X. Comprehensive energy, economic and thermal comfort assessments for the passive energy retrofit of historical buildings—A case study of a late nineteenth-century Victorian house renovation in the UK. Energy 2020, 220, 119646. [Google Scholar] [CrossRef]
  24. Hirvonen, J.; Saari, A.; Jokisalo, J.; Kosonen, R. Socio-economic impacts of large-scale deep energy retrofits in Finnish apartment buildings. J. Clean. Prod. 2022, 368, 133187. [Google Scholar] [CrossRef]
  25. Júnior, S.M.; Frandoloso, M.A.L.; Brião, V.B. Technical and economic feasibility study for a university zero energy building in Southern Brazil. Energy Build. 2023, 281, 112748. [Google Scholar] [CrossRef]
  26. Chirarattananon, S.; Taveekun, J. An OTTV-based energy estimation model for commercial buildings in Thailand. Energy Build. 2004, 36, 680–689. [Google Scholar] [CrossRef]
  27. Bright Management Consulting Co., Ltd. Promoting Energy Efficiency in Commercial Buildings (PEECB) Progress Report #2; Department of Alternative Energy Development and Efficiency: Bangkok, Thailand, 2013. [Google Scholar]
  28. Comptroller General’s Department. Material and Labour Cost for Fiscal Year 2562 B.E.; Comptroller General’s Department: Bangkok, Thailand, 2018. [Google Scholar]
  29. Metropolitan Electricity Authority. Electricity Tariffs Large General Service, Provincial Electricity Authority, Bangkok Thailand. Available online: https://www.mea.or.th/our-services/tariff-calculation/other/fsFTSa4DY (accessed on 5 September 2023).
  30. Bank of Thailand. Interest Rates in Financial Market. (2005-Present). Available online: https://www.bot.or.th/App/BTWS_STAT/statistics/BOTWEBSTAT.aspx?reportID=223&language=ENG (accessed on 2 August 2023).
Figure 1. Electricity consumption of an academic building.
Sustainability 15 15298 g001
Figure 2. Thailand Building Energy Code compliance pathway.
Sustainability 15 15298 g002
Figure 3. Diagram of the overall study process.
Sustainability 15 15298 g003
Figure 4. Building of the Department of Civil Engineering, School of Engineering, King Mongkut’s Institute of Technology Ladkrabang, Thailand: (a) floor plan; (b) SketchUp diagram.
Sustainability 15 15298 g004
Figure 5. Single line diagram of the case study building.
Sustainability 15 15298 g005
Figure 6. Thermal transfer of an original wall over 14 h.
Sustainability 15 15298 g006
Figure 7. Thermal transfer results for various types of renovated walls over 14 h: (a) renovated wall, case 1; (b) renovated wall, case 2; (c) renovated wall, case 3.
Sustainability 15 15298 g007aSustainability 15 15298 g007b
Figure 8. The thermal transfer results for various types of renovated wall throughout a day.
Sustainability 15 15298 g008
Figure 9. Simulation of thermal transfer in case of the original roof over 14 h.
Sustainability 15 15298 g009
Figure 10. Thermal transfer results for various types of renovated roofs over 14 h: (a) renovated roof, case 1; (b) renovated roof, case 2; (c) renovated roof, case 3.
Sustainability 15 15298 g010aSustainability 15 15298 g010b
Figure 11. The thermal transfer results of various types of renovated roofs throughout a day.
Sustainability 15 15298 g011
Figure 12. Illuminance of working plane of LED lighting replacement system and original system: (a) original lighting system; (b) replacement lighting system.
Sustainability 15 15298 g012
Table 1. BEC criteria for building envelope and lighting system.
Building TypesWall Thermal Transfer Value (W/m2)Roof Thermal Transfer Value (W/m2)Lighting Power Density (W/m2)
Group 1≤50≤1010
Group 2≤40≤811
Group 3≤30≤612
Table 2. Thermal characteristics of the materials and component diagram of an original wall.
Material of Original Wall
Thermal Conductivity of Material (W/m·K)Specific Heat of Material (kJ/kg·K)Density of Material (kg/m3)
Plaster0.8400.720 1860
Dry Clay Brick0.7900.807 1760
Composition of Original Wall
Layer of MaterialThickness of Material (m.)U-Value of Component (W/m2·K)
Sustainability 15 15298 i001Plaster0.00751.634
Dry Clay Brick0.07
Plaster0.0075
Table 3. Thermal characteristics of the material and component diagram used for each type of renovated wall.
Material of Original Wall
Thermal Conductivity of Material (W/m·K)Specific Heat of Material (kJ/kg·K)Density of Material (kg/m3)
Concrete Plaster0.3260.8401200
Plaster0.8400.7201860
Dry Clay Brick0.7900.8071760
Autoclaved Aerated Concrete0.4760.8401280
Fiberglass Insulation0.0420.96012
Gypsum Board0.2861.090800
Composition of Original Wall
Layer of MaterialThickness of Material (m.)U-Value of Component (W/m2·K)
Case 1Sustainability 15 15298 i002Plaster0.00750.534
Dry Clay Brick0.0700
Plaster0.0075
Fiberglass Insulation0.0650
Case 2Sustainability 15 15298 i003Plaster0.00750.516
Dry Clay Brick0.0700
Plaster0.0075
Gypsum Board0.0120
Fiberglass Insulation0.0650
Case 3Sustainability 15 15298 i004Concrete Plaster0.00750.507
Autoclaved Aerated Concrete0.0700
Concrete Plaster0.0075
Gypsum Board0.0120
Fiberglass Insulation0.0650
Table 4. Thermal characteristics of the materials and component diagram of roof.
Material of Original Wall
Thermal Conductivity of Material (W/m·K)Specific Heat of Material (kJ/kg·K)Density of Material (kg/m3)
Metal Sheet47.60078400.500
Air Gap0.0251.231006
Gypsum Board0.1918801.090
Composition of Original Wall
Layer of MaterialThickness of Material (m.)U-Value of Component (W/m2·K)
Sustainability 15 15298 i0051. Metal Sheet0.0031.412
2. Air Gap0.4
3. Gypsum Board0.01
Table 5. Thermal characteristics of the material and component diagram for each type of renovated roof.
Material of Original Wall
Thermal Conductivity of Material (W/m·K)Specific Heat of Material (kJ/kg·K)Density of Material (kg/m3)
Metal sheet47.6000.5007840
Concrete roof tiles0.9930.7902400
Air gap0.02510061.23
Fiberglass insulator0.0380.96012
Gypsum board0.1911.090880
Composition
Layer of MaterialThickness of Material (m.)U-Value of Component (W/m2·K)
Case 1Sustainability 15 15298 i0061. Metal Sheet0.030.215
2. Air Gap0.400
3. Fiberglass Insulation0.150
4. Gypsum Board0.03
Case 2Sustainability 15 15298 i0071. Concrete Roof Tiles0.0191.269
2. Air Gap0.400
3. Gypsum Board0.010
Case 3Sustainability 15 15298 i0081. Concrete Roof Tiles0.0190.203
2. Air Gap0.400
3. Fiberglass Insulator0.150
4. Gypsum Board0.010
Table 6. Specifications of lighting equipment used in the case study building.
Original Luminaire
LuminairePower Consumption (W)Number of LuminaireLuminous Efficacy (lm/W)Lumen per Tube (lm)
Fluorescent T528474 71.422000
Fluorescent T818 167 58.331050
Fluorescent T836 18 90.273250
Replacement Luminaire
LED Tube18474 116.662100
LED Tube14 167 120.001680
LED Tube2418 150.003600
Table 7. Illuminance of working plane of LED lighting replacement system and original system.
Currently Used Air Conditioning Unit
Type of Air Conditioning UnitCooling Capacity (BTU/h)Power Consumption (kW)SEER
(BTU/h/W)
Quantity
Fixed speed90000.70012.8508
12,0001.06511.26716
18,0001.57011.46040
Replacement Air Conditioning Unit
Variable speed90000.60024.008
12,0000.93022.5016
18,0001.47020.8140
Table 8. BEC compliance of the case study building.
Actual ValueStandardStatus
OTTV (W/m2)79.72450Failed
RTTV (W/m2)23.11710Failed
LPD (W/m2)9.8810Passed
SEER (BTU/h/W)4.3912.85Failed
Whole Building Energy (kWh/yr.)261,537.977184,820.745Failed
Table 9. BEC compliance of the renovated building.
Actual ValueStandardStatus
OTTV (W/m2)39.10550Passed
RTTV (W/m2)3.51010Passed
LPD (W/m2)5.0810Passed
SEER (BTU/h/W)23.40015.00Passed
Whole Building Energy (kWh/yr.)116,519.212184,820.745Passed
Table 10. Material and labor cost for building renovation with regard to the envelope.
Material NameMaterial Cost (USD/m2)Labor Cost
(USD/m2)
Total Installation Cost
(USD/m2)
Autoclaved aerated concrete 12.472.6015.07
Concrete plaster4.002.676.67
Gypsum board10.632.5013.13
Fiberglass insulator (5 mm)8.330.839.16
Fiberglass insulator (10 mm)16.670.8317.50
Table 11. The investment cost for equipment and installation of lighting systems and air conditioning system.
Lighting System
Amount of EquipmentEquipment Cost (USD)Labor Cost (USD)Total Installation Cost (USD)
LED Tube 18W4744.084.003829.92
LED Tube 14W1673.374.001230.79
LED Tube 24W184.834.00158.94
Total5219.65
Variable-Speed Air Conditioning Unit
9000 BTU/hrs8573.33128.005610.64
12,000 BTU/hrs16643.33128.0012,341.28
18,000 BTU/hrs40863.33128.0039,653.20
Total57,605.12
Table 12. Energy and economic result after building renovation.
Energy Consumption (Unit/yr)Electricity Cost (USD/yr)
Base case261,537.97736,615.31
Renovation 116,519.21216,312.68
Total savings145,018.76520,302.62
Table 13. Annual cash flow of the building renovation.
YearInitial Cost (USD)Energy Reduction (kWh/yrs.)Cost Saving (USD)Cash Flow
(USD)
Present Value
(USD)
Balance
(USD)
096,355.01(96,355.01)(96,355.01)(96,355.01)
1 1865.0820,302.6220,302.6219,904.53(76,450.48)
21865.0820,302.6220,302.6219,514.24(56,936.24)
31865.0820,302.6220,302.6219,131.61(37,804.62)
41865.0820,302.6220,302.6218,756.48(19,048.14)
51865.0820,302.6220,302.6218,388.71(659.43)
61865.0820,302.6220,302.6218,028.1517,368.71
71865.0820,302.6220,302.6217,674.6535,043.37
81865.0820,302.6220,302.6217,328.0952,371.46
91865.0820,302.6220,302.6216,988.3269,359.78
101865.0820,302.6220,302.6216,655.2286,015.00
Table 14. The main distribution board load table on both original and renovated building.
Circuit No.DescriptionOriginal Load (VA)Renovation Load (VA)
Phase APhase BPhase CPhase APhase BPhase C
1Floor 129,883 31,538
3 30,815 33,798
5 26,040 31,081
7Floor 248,008 34,468
9 47,908 39,934
11 47,934 35,776
13Floor 326,320 26,592
15 25,632 21,730
17 27,334 25,236
2Floor 425,368 22,464
4 26,518 21,050
6 27,984 25,504
8Spare
10Spare
12Spare
14Spare
16Spare
18Spare
Phase (VA)129,579130,873129,292115,062116,512117,597
Total (VA)389,744349,171
Table 15. The first-floor distribution board load table on both original and renovated building.
Circuit No.DescriptionOriginal Load (VA)Renovation Load (VA)
Phase APhase BPhase CPhase APhase BPhase C
1Central2995 2126
3Auditorium 7804 7154
5Laboratory 11,190 10,088
7Shop 111,940 9792
9Shop 2 7061 6516
11Spare
13Office4778 5228
15 4850 4265
17 4850 3635
2Office5200 4361
4 7000 3730
6 5900 5225
8Office4970 2698
10 4100 4800
12 4100 4800
14EV Charger 7333
16 7333
18 7333
Phase (VA)29,88330,81526,04031,53833,79831,081
Total (VA)86,73896,418
Table 16. An energy reduction and economic feasibility for each sub-system.
CaseEnergy Reduction
(kWh)
Energy Cost Reduction
(USD)
Initial Investment
(USD)
IRR (%)DPP (yrs.)
Building Envelope Roof 19,2532695.418995.2429.923.32
Building Envelope Wall55,1097715.2524,535.0031.413.14
Lighting System and Air Conditioning System77,98010,917.1962,824.7717.046.16
Entire Building145,01920,302.6296,355.0120.894.98
Disclaimer/Publisher’s Note: The statements, opinions and data contained in all publications are solely those of the individual author(s) and contributor(s) and not of MDPI and/or the editor(s). MDPI and/or the editor(s) disclaim responsibility for any injury to people or property resulting from any ideas, methods, instructions or products referred to in the content.

