Abstract
The demand for personalized lighting environments based on households is steadily increasing among users. This article proposes a novel intelligent control system for personalized lighting in home environments, aiming to automatically capture user information, such as homecoming time and light switching behavior, in order to train a model that intelligently regulates the lights for users. Facial recognition technology is employed by this system to identify users and record their lighting data. Subsequently, nine commonly used machine learning models were evaluated, revealing that the error back-propagation neural network algorithm exhibits excellent performance in time-series analysis. The BPNN weights were optimized using genetic algorithms, resulting in an improved coefficient of determination (R2) of 0.99 for turn-on time and 0.82 for turn-off time test sets. Furthermore, testing was conducted on data collection duration which demonstrated that even with only 20 time-series data collected from new users, the model still displayed exceptional performance in training prediction tasks. Overall, this system effectively identifies users and automatically adjusts the lighting environment according to their preferences, providing comfortable and convenient lighting conditions tailored to individual needs. Consequently, a broader goal of energy conservation and environmental sustainability can be achieved.
1. Introduction
It is generally known that the large proportion of energy consumption coming from lighting systems can, in some cases, contribute up to 40% of energy consumption [1]. Therefore, on one hand, the task of smart lighting is to meet energy saving requirements. On the other hand, with increasing demands for better living conditions, users need a lighting environment that not only meets visual health needs but also psychological health needs. Appropriate lighting can improve people’s visual comfort and health [2,3,4]. Color temperature, illumination, and light distribution have positive and negative effects on human emotions [5]. Furthermore, interactions with lighting factors greatly affect human comfort. It would be ideal to automatically adjust lighting settings for the different needs of individuals considering the different comfort sensitivities and usage habits of different users, which also meets the requirements of energy conservation.
Khoa et al. [6] proposed a framework that can be used for automated burglar alarm systems, guest attendance monitoring, and light switches with easy integration within a smart city. In this way, internet of things solutions can enable real-time monitoring and connections with central systems for automated burglar alarms. Kandasamy et al. [7] proposed an artificial neural network for modeling the lighting system and designed a controller based on this model and an internal model principle. Zarindast et al. [8] used user history data to understand user behavior. They built and trained prediction models within each cluster and aggregated results by analyzing the users’ daily logs, geographic locations, time, and distribution of usage information. Using behavioral records, Paulauskaite-Taraseviciene et al. [9] continuously optimized the prediction of user habits with a neural network data substitution algorithm based on a data similarity threshold. However, these intelligent lighting systems can only change the lighting environment for the preference of a single user and do not address the lighting needs of different individuals, different groups of hobbyists, or specific environments. In fact, it is difficult for a specific setting to meet the needs of everyone. By studying different human behaviors, visual functions, and visual psychologies, intelligent lighting will be used to develop more scientific, personalized, efficient, comfortable, and healthy lighting technologies, while also achieving the goal of energy conservation. Furthermore, this aligns with the sustainability aspect of intelligent lighting, which is considered one of its paramount objectives. It encompasses a comprehensive evaluation that not only addresses concerns, such as energy conservation and automated control, but also necessitates machine learning based on individual user behavior to continuously improve intelligent control performance through the continuous learning of user behavior analysis.
In order to identify users’ lighting preferences to make the next use prediction, the present paper proposes a personalized lighting system for different users in the home environment. The goal is to develop automated information systems that can collect data as inputs and use them for accurate predictions [10]. In artificial intelligence algorithms, the paper explores time-series prediction models for time-series features of users’ behavioral habits that are not dependent on external influences. It specifically finds patterns in the behaviors of users in switching lights on and off using models that are learned, trained, and then used for prediction applications, enabling results to be predicted more rapidly and lighting modules to be turned on or off at appropriate times. This study integrates facial recognition technology and modules such as Bluetooth to design a home lighting control system, utilizing user lighting usage data for model construction in order to learn and predict the lighting habits of different users. Firstly, classical machine learning algorithms were tested, revealing that back-propagation neural network (BPNN) performs well in time-series prediction. Subsequently, BPNN was designed and its weights were optimized using genetic algorithms to enhance the coefficient of determination. Finally, the developed model was deployed and evaluated within this system. In addition, this system allows users to provide negative feedback when dissatisfied with predicted results, enabling the re-inputting of data for further learning and prediction. Simultaneously, real-time facial recognition technology is employed to identify household users and establish a personalized lighting environment feedback mechanism based on their preferences. Furthermore, the system automatically adjusts the lighting environment according to individual user profiles.
Experiments conducted in a test bed environment demonstrated that this system effectively identifies users while accurately predicting and controlling personalized lighting patterns. Consequently, this sensorless intelligent lighting control system offers a tailored solution that caters to the user’s emotional needs while achieving energy savings across various scenarios.
2. Materials and Methods
2.1. The Working Framework of This Study
The schematic representation of this working framework can be observed in Figure 1. The system uses facial recognition technology to identify household users, and employs algorithms to predict users’ lighting habits (including which light to turn on and its level of illumination) based on historical data. It controls the lighting equipment in the entire home through built-in Bluetooth. The face collection terminal utilized facial recognition to capture distinct user tags, while the lighting information of various areas, including their activation and deactivation times, was subsequently recorded and stored in the database in chronological order. The model is trained by encoding user information to preserve the optimal model. Ultimately, automatic identification of area activation and deactivation times is conducted relying on the user tags recognized by the face collection terminal.
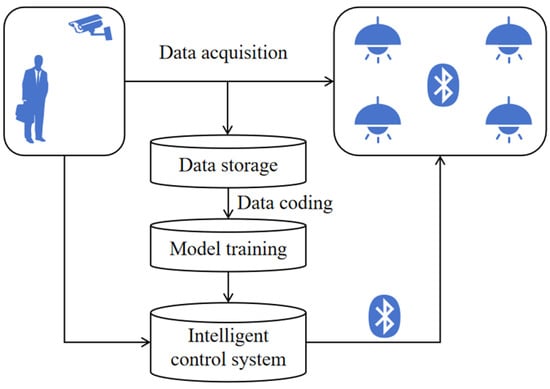
Figure 1.
The working framework of this study.
2.2. Face Recognition Module
Facial recognition is the process of matching facial images extracted from a static image with facial images stored in a database for identity recognition and user authentication [11]. The convolutional neural network is used not only to extract high-level features and to improve the expression ability of features, but also to integrate feature extraction, feature selection, and feature classification in the same model. Through end-to-end training, function optimization is applied to the whole to enhance the separability of features [12]. Given the wide use of convolutional neural networks or other neural network models in automatic image classification systems, high-level features can be automatically learned by hierarchical neural networks [13]. The proposed system uses the OpenCV cascade to identify faces, and the facial recognition model is stored on a Raspberry Pi computer. OpenCV is a computer vision library that enables the rapid building of complex applications.
Considering that the recognition process is an offline operation, we use a lightweight convolution neural network (CNN), reducing the number and layers of convolution kernels. Artificial neurons of convolutional neural networks can be covered by peripheral units in a certain range. The calculation cost is reduced by implementing pooling filtering for the feature mapping, and the mapping results are processed using an activation function [14].
The photographs of 13,000 faces are inputted into the system as a data set. The training program establishes a CNN with four convolution layers and resizes an image before it enters the network. Image enhancement is performed by setting the size of the randomly clipped image to less than 10% of the width and height of the original image. The convolution kernel of each convolution layer in the designed CNN has dimensions of 3 × 3 and the sliding step length is 1. The outputs of the first three convolutions are sampled by pooling the three layers. The 48 × 48 × 1 images are converted to 6 × 6 × 5 images through all convolution and output layers. The full convolution network uses the deconvolution layer to sample the feature map generated by the CNN such that it has the same size as the input image, for the prediction of the category of each pixel in the original image. All local information is extracted before the full connection layer is integrated to realize the classification. After the probability of various situations is output, the Softmax classifier is added for the probability distribution. The function of the designed network is recognition. The Softmax loss in the Softmax layer is expressed as [15,16]
where M is the number of samples in each training set, N is the number of categories. x and y represent the feature vector for sample i and the corresponding category marker. W and b are the weight matrix and bias vector of the last fully connected layer, respectively.
The performance of neural networks depends not only on their structures, but also on the activation functions used. Nonlinear functions are usually chosen to deal with complex problems [16]. The ELU activation function is used to activate neurons after convolution or pooling to pass to the next neural layer:
In deep learning, owing to a large number of training data, the training data are usually input in batches and a mini-batch method is used for training. In practical training, the original input image is a batch input. The deep feature network used in this paper adopts batch normalization to process the input data before the input into each convolution layer. Even deeper networks can maintain higher learning rates and alleviate the gradient disappearance problem.
2.3. Data Acquisition
The test bench intelligently predicted the use time of different users and independently adjusted the indoor environment. The system accepted the user’s perception in the form of negative feedback. Meanwhile, data for the time at which daily users turned lights on/off were collected. The collected data were stored in the system database to obtain the user’s lighting habits. In predicting the lighting operation, the system considered not only the operation in the current period of time but also that in the adjacent period.
The designed intelligent lighting system is applied to the home scenario and a standard laboratory workbench lighting module is applied to this scenario [17,18,19,20]. We use lighting modules at different positions to collect data, including bedrooms, kitchens, living rooms, and bathrooms. The specific module parameters are given in Table 1. To reduce energy use and avoid interference from other factors, participants could only operate the system when they needed to turn on a light. In the experiment, the time of turning on/off a light, the day of the week, the user ID, and the type of room in which the light was turned on/off were recorded.

Table 1.
Lighting module parameters.
2.4. Controller Design and Data Coding
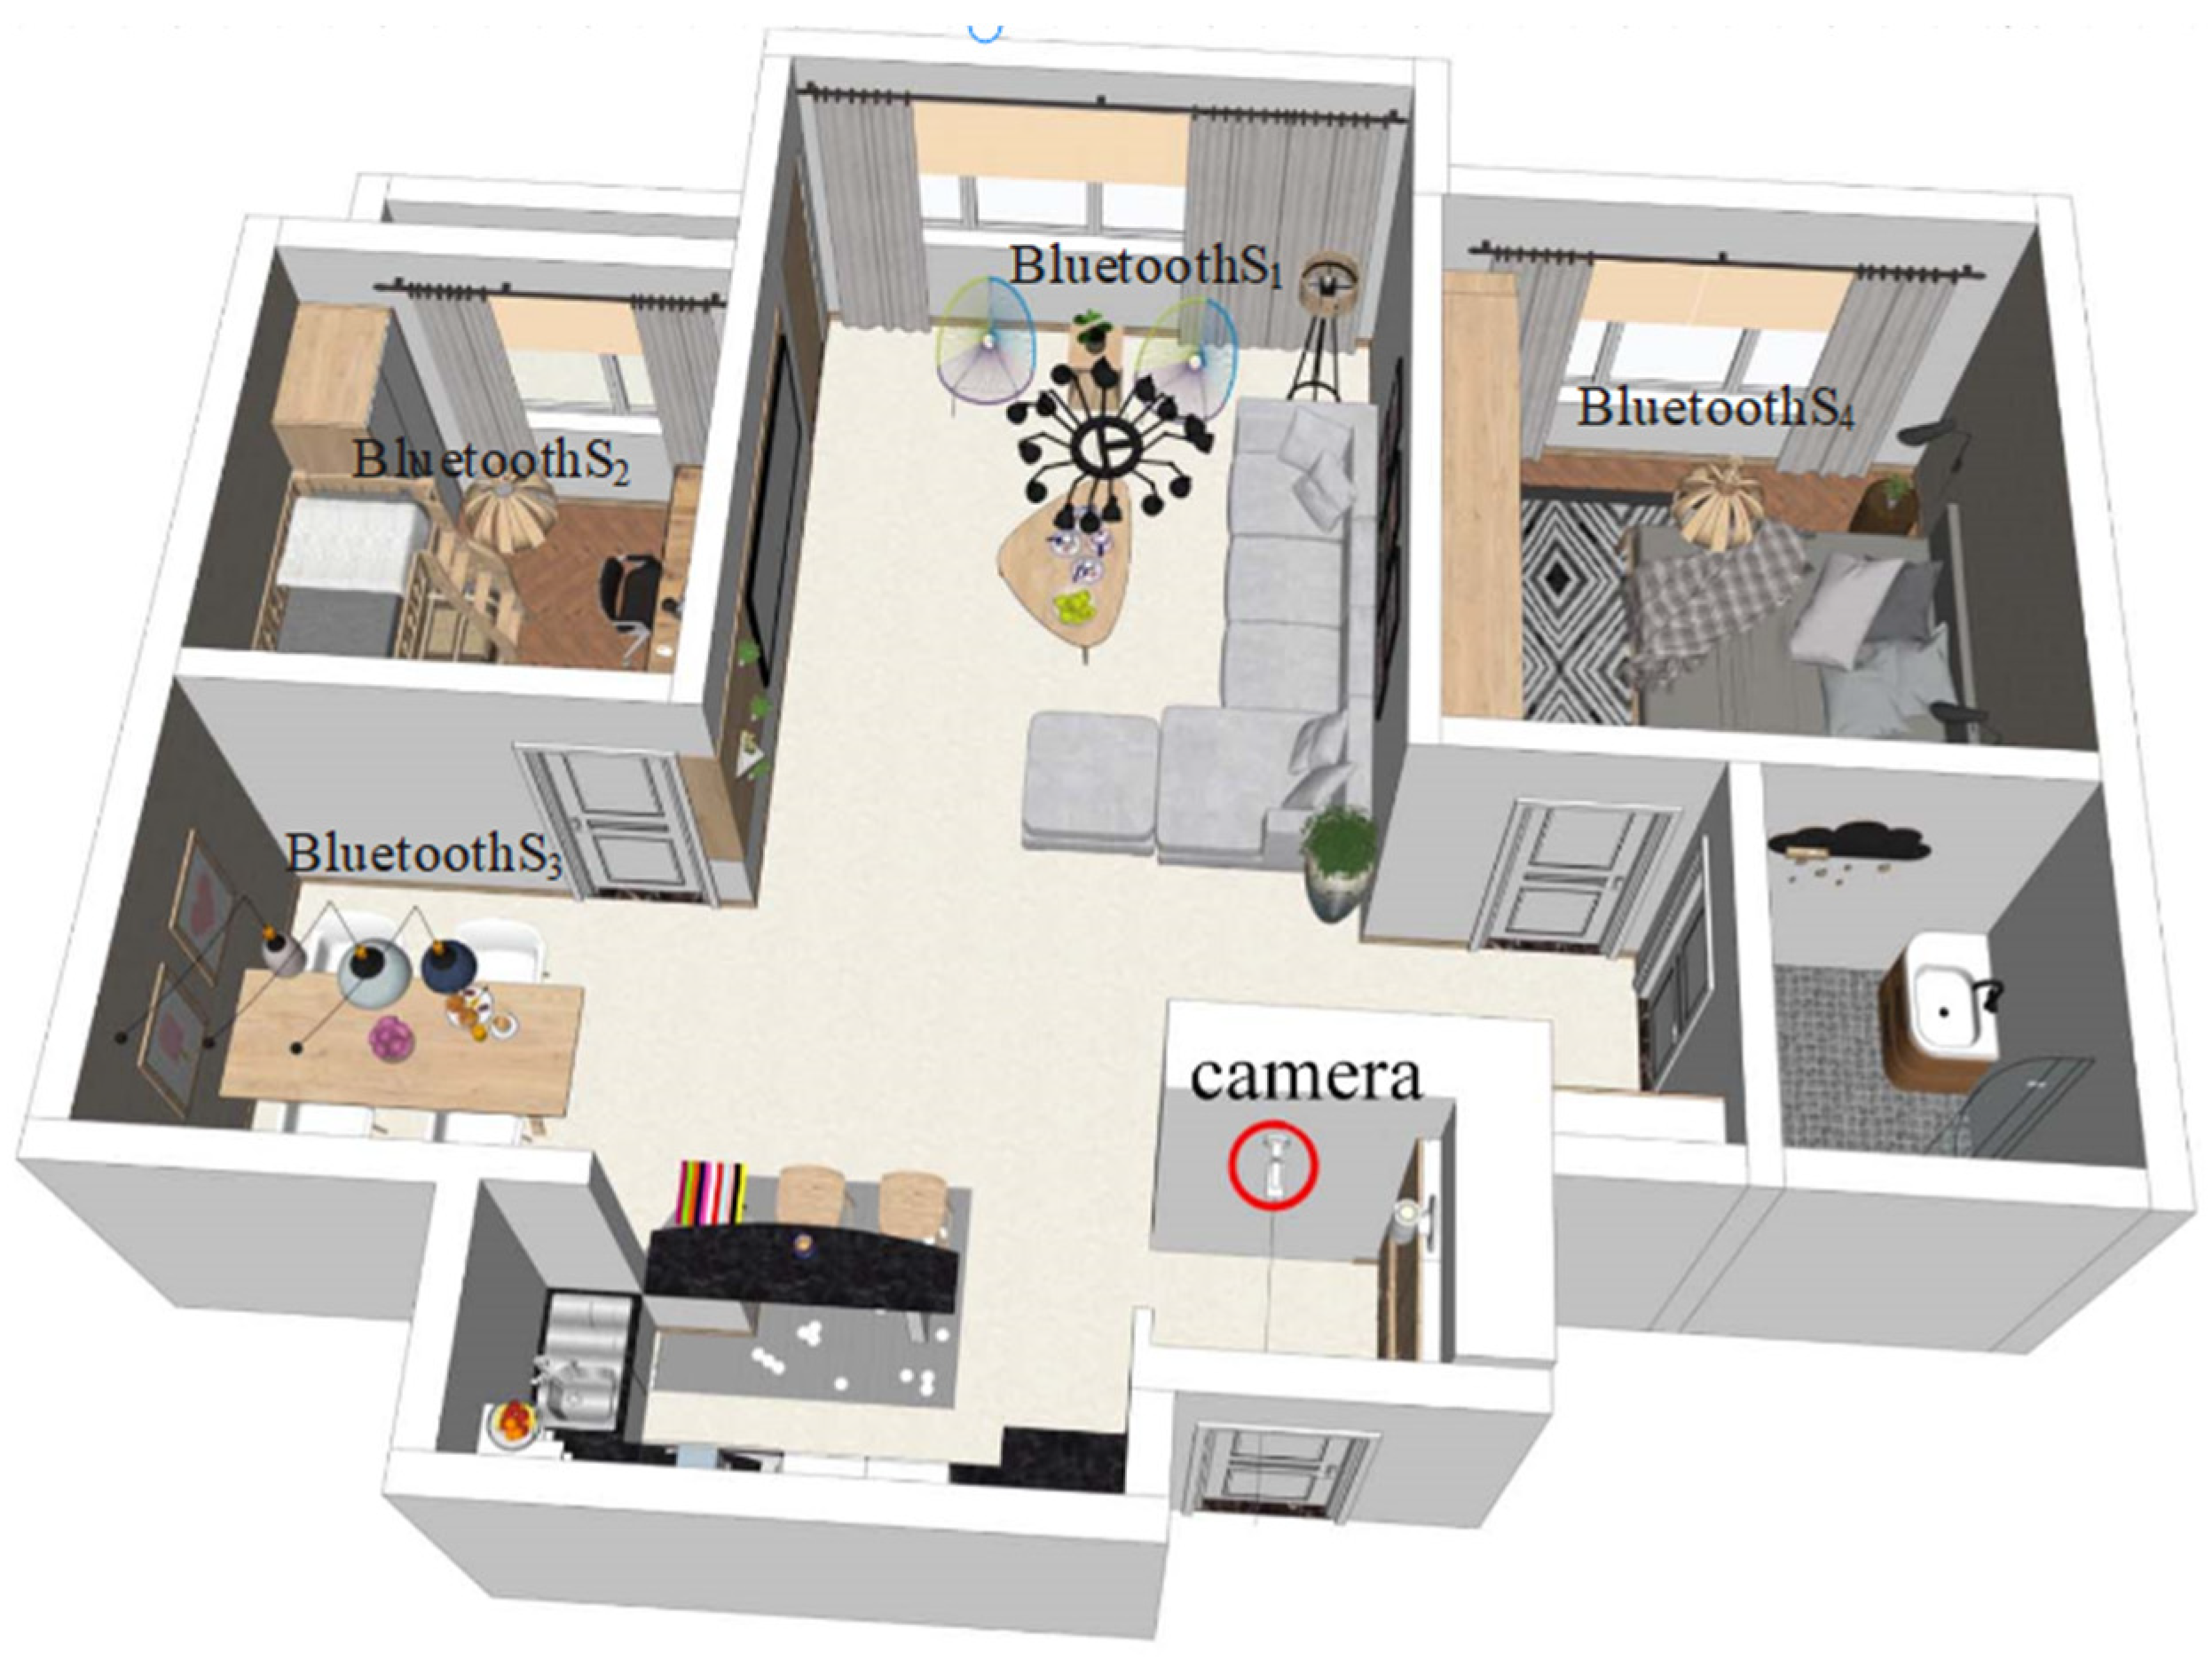
The proposed lighting control system was applied to a family setting. The layout of light sources is shown in Figure 2. The distribution of experimental lamps is considered reasonable [21,22]. Figure 2 also shows the layout of the four Bluetooth lighting modules, namely S1, S2, S3, and S4. All Bluetooth modules communicate with the control terminal, and the control terminal collects the data from the Bluetooth lighting module. The control terminal of the system is a Raspberry Pi, which is a small Linux computer. The control terminal analyzes the data and makes predictions using the algorithm and controls the Bluetooth lighting module.
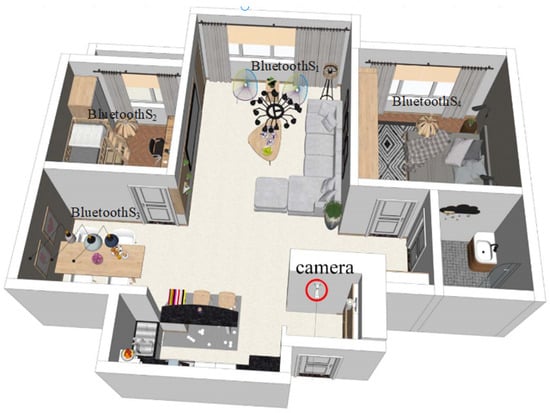
Figure 2.
Schematic of the system distribution and communication structure.
We built a lighting system application with a home as the scenario. When a user enters the home, a camera at the entrance of the house obtains the user’s facial information, which is transmitted to the Raspberry Pi central processing module. This module calculates and compares the acquired facial information with data in a database and outputs the result. The system recognizes the facial information. If the recognition result is a household user, the system calls the historical data of the lamps used by the user, uses the BP prediction algorithm to learn and train the data of the lamps used, and predicts the control time of the lamps. Compare the prediction results with the actual data. When the error is greater than the set error, the system will retrain the model to update the data and weight for further prediction. After the update, if the final error is less than the set error, the system converts the predicted results into commands to control the specific lighting module.
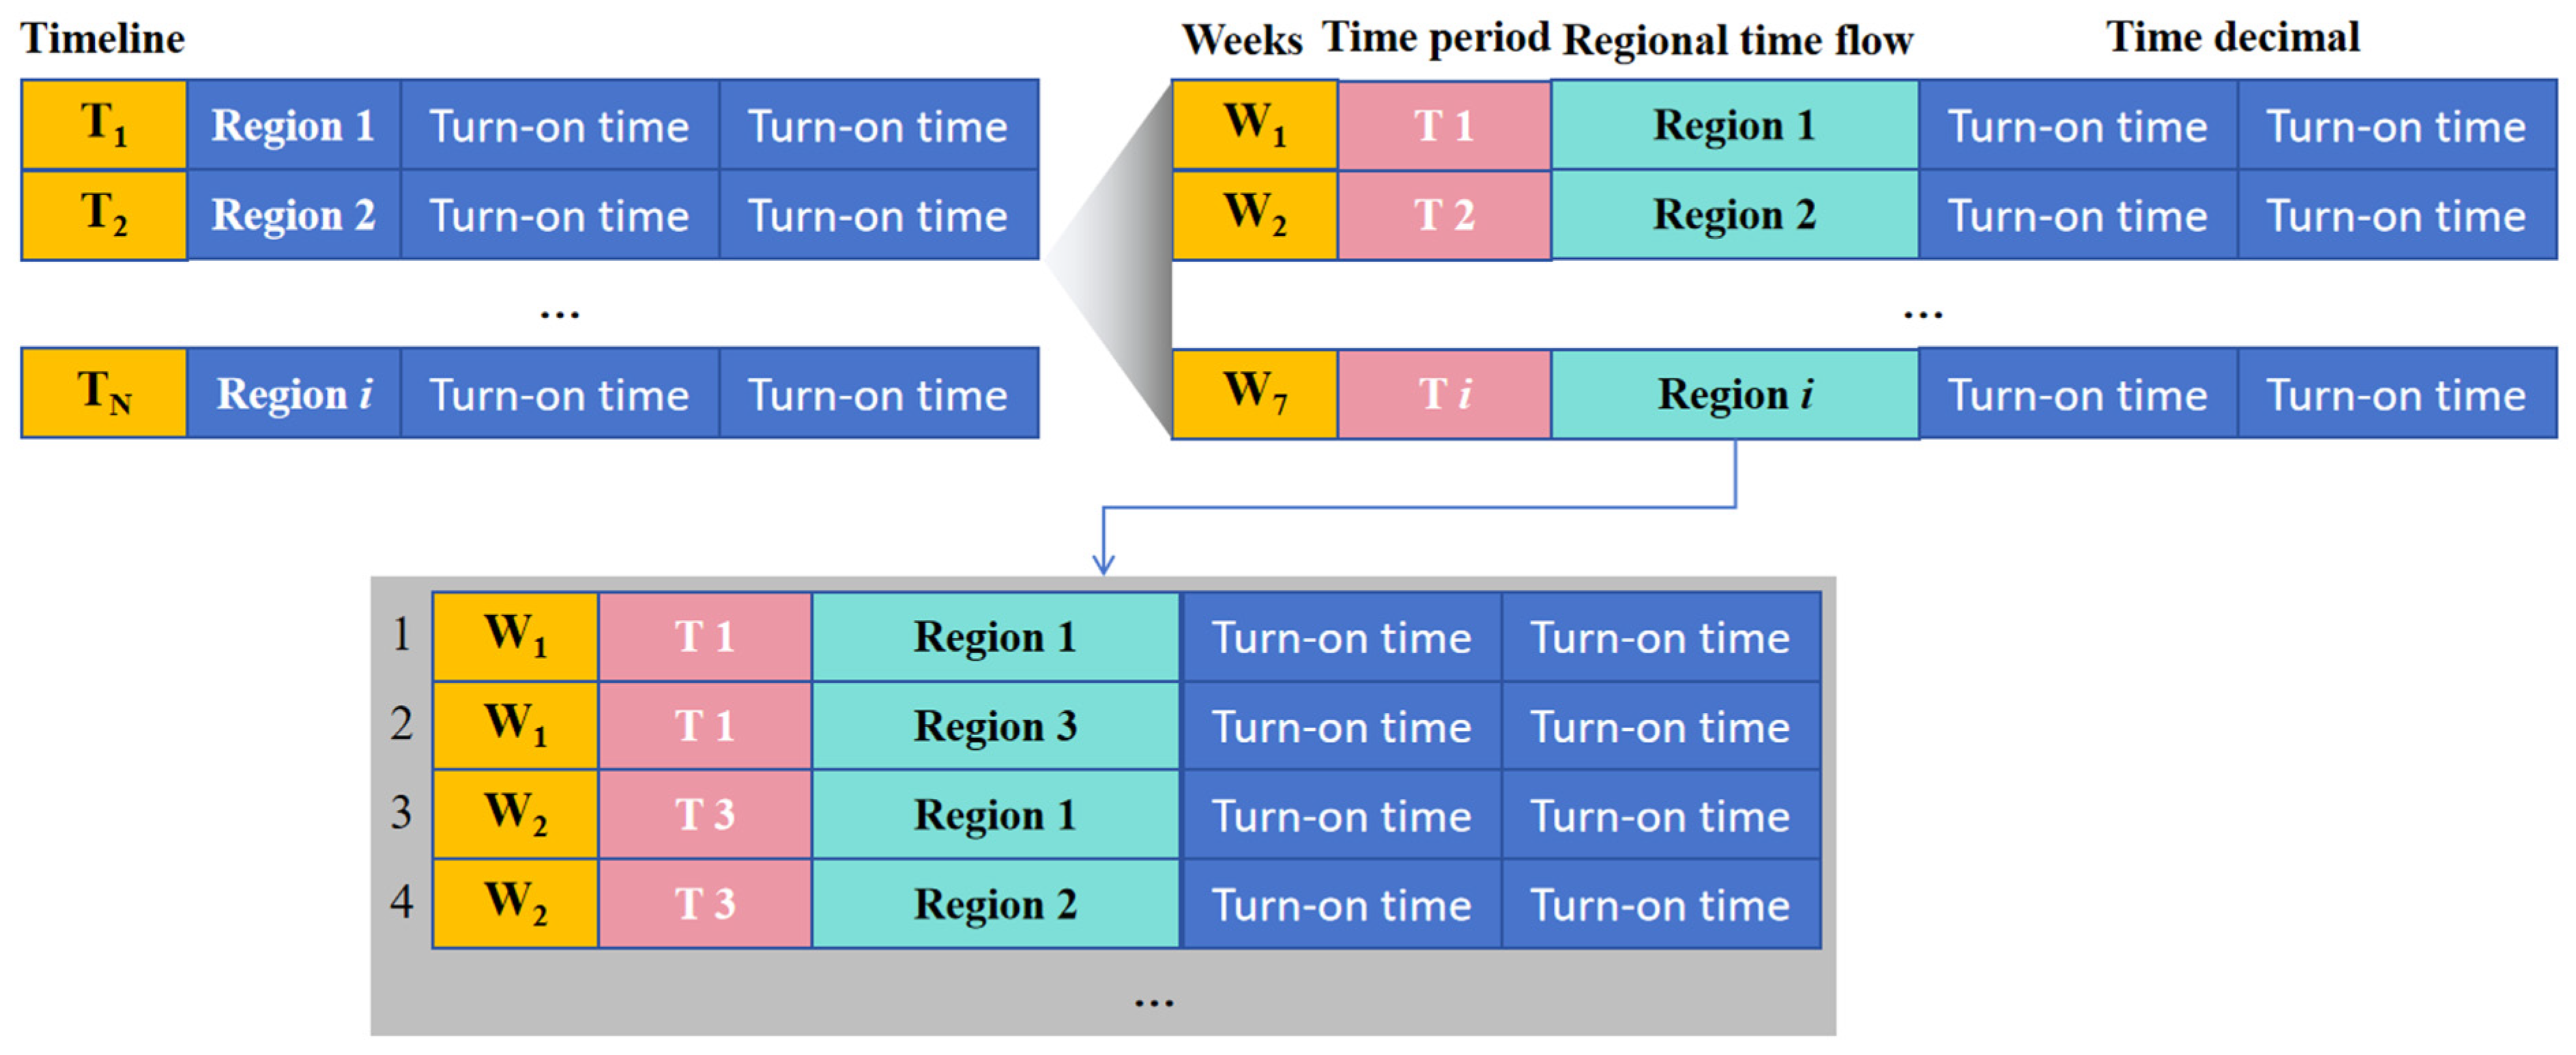
To enhance the effectiveness of model training, we encoded the collected data by partitioning time into two cycles: a weekly cycle represented by numbers 1 to 7 for Monday through Sunday, and a time period cycle divided into 48 intervals of 0.5 h each, representing the entire 24-h day. The region is transformed into a temporal flow of samples, while switch times are converted into decimal time as illustrated in Figure 3.
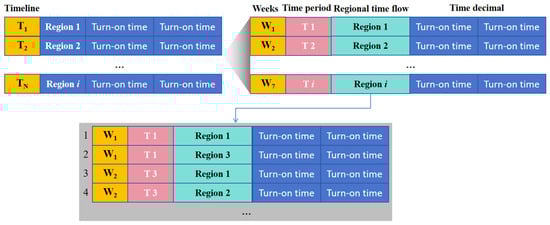
Figure 3.
Data coding diagram.
2.5. Model Evaluation Index
In this study, mean squared error (MSE), mean absolute error (MAE), and coefficient of determination (R2) were employed for model evaluation during the training process. MSE represents the average of squared differences between predicted values and true values. MAE quantifies the average distance between model predictions and actual sample values. R2 serves as a metric to assess the goodness-of-fit of regression models by indicating the proportion of data variance explained by the model, commonly utilized for comparing performance among different models. The formulas used to evaluate MSE, MAE, and R2 are as follows:
where f(xi), yi, represent predicted value, true value, and mean value, respectively.
3. Results
3.1. Model Preliminary Screening and Design
To obtain appropriate models, we evaluated nine commonly employed models (Table 2), namely random forest regression [23], decision tree regression [24], polynomial regression [25], support vector regression [26], ridge regression [27], lasso regression [28], elastic net regression [29], K-nearest neighbors regression [30], and BPNN regression. The training set and test set were divided in an 8:2 ratio for experimentation with a sample size of 200. The results demonstrated that all models exhibited satisfactory performance in predicting turn-on time with R2 values exceeding 0.8, except for the elastic net model which had a slightly lower but still above 0.95 R2 value. Moreover, MSE and MAE were also relatively small. However, the prediction accuracy for turn-off time was unsatisfactory. Among them, BPNN achieved a relatively good R2 result of 0.77. Furthermore, design optimization on BPNN revealed that it performed better with a single hidden layer consisting of nine neurons.
Table 2.
Model test index.
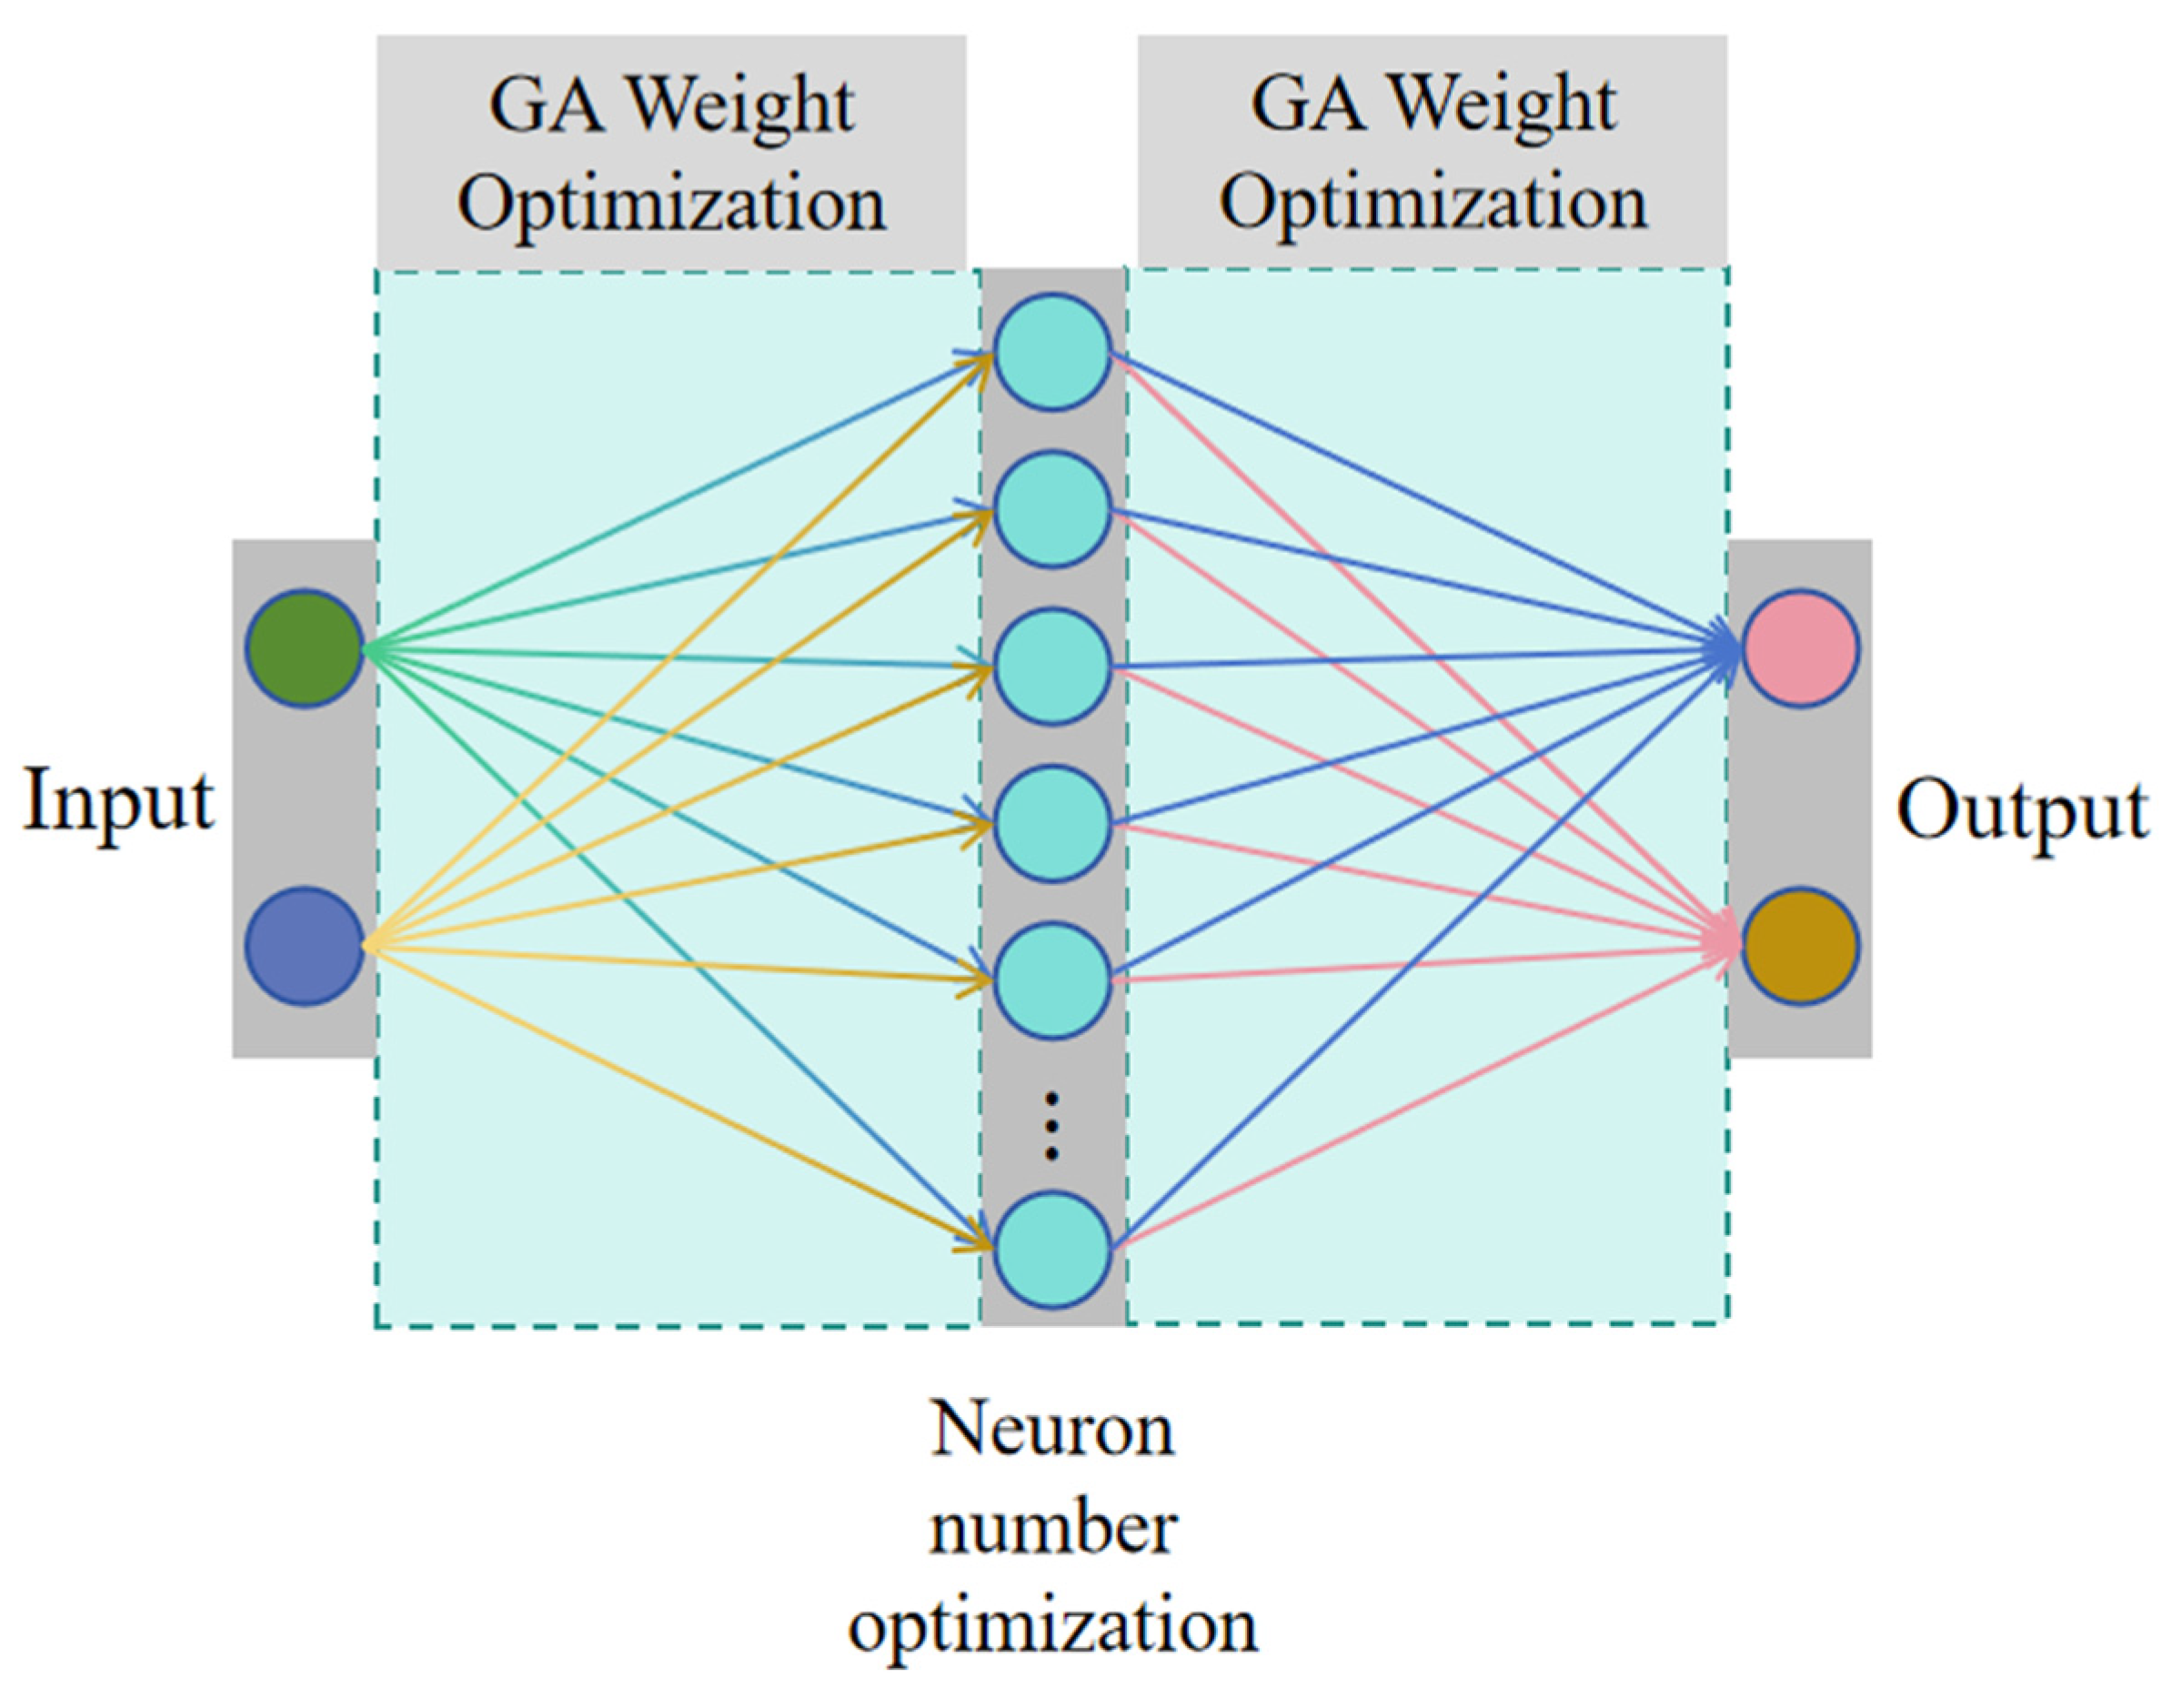
Subsequently, we developed a BPNN and observed superior performance when utilizing a single hidden layer comprising nine neurons. However, during the training process, BPNN employs a gradient descent-based approach to adjust the weights of the network with the aim of minimizing the error between the predicted and actual outputs. However, gradient-based methods can sometimes become trapped in local minima, leading to suboptimal solutions. Furthermore, to enhance its efficacy, we employed a genetic algorithm for weight optimization (Figure 4).

Figure 4.
Model GABPNN diagram.
Genetic algorithms (GA), inspired by the principles of natural selection and genetics, offer a stochastic global optimization approach that can overcome the limitations posed by gradient descent. The integration of GA for weight optimization in BPNN operates as follows:
Initialization: A population of potential solutions (chromosomes) is generated. In the context of BPNN, each chromosome represents a possible set of weights for the network.
Selection: Chromosomes are evaluated based on a fitness function, which is typically the inverse of the network’s error. The fitter chromosomes have a higher probability of being selected for reproduction.
Crossover (Recombination): Pairs of chromosomes are selected based on their fitness and are crossed over to produce offspring. This mimics the genetic recombination process, allowing for the exchange of genetic material (weights) between parent chromosomes.
Mutation: To maintain genetic diversity in the population and prevent premature convergence, mutations are introduced at a low probability. This involves making small, random changes to the weights in a chromosome.
Replacement: The offspring produced through crossover and mutation replace the older generation. This ensures that the population evolves towards better solutions over successive generations.
Termination: The algorithm continues iterating through the selection, crossover, mutation, and replacement processes until a stopping criterion is met, such as a predefined number of generations or a satisfactory fitness level.
By employing GA for BPNN weight optimization, the neural network can explore a broader solution space, enhancing its ability to find a global minimum for the error function. This hybrid approach amalgamates the fine-tuning capabilities of BPNN with the global search prowess of GA, yielding a robust and efficient model that is less susceptible to the pitfalls of local optima.
In the test, the R2 value increased to 0.82. Consequently, we implemented the system using a combined approach of GA and BPNN (GABPNN) for testing purposes.
3.2. Randomly Divided Test Set Testing
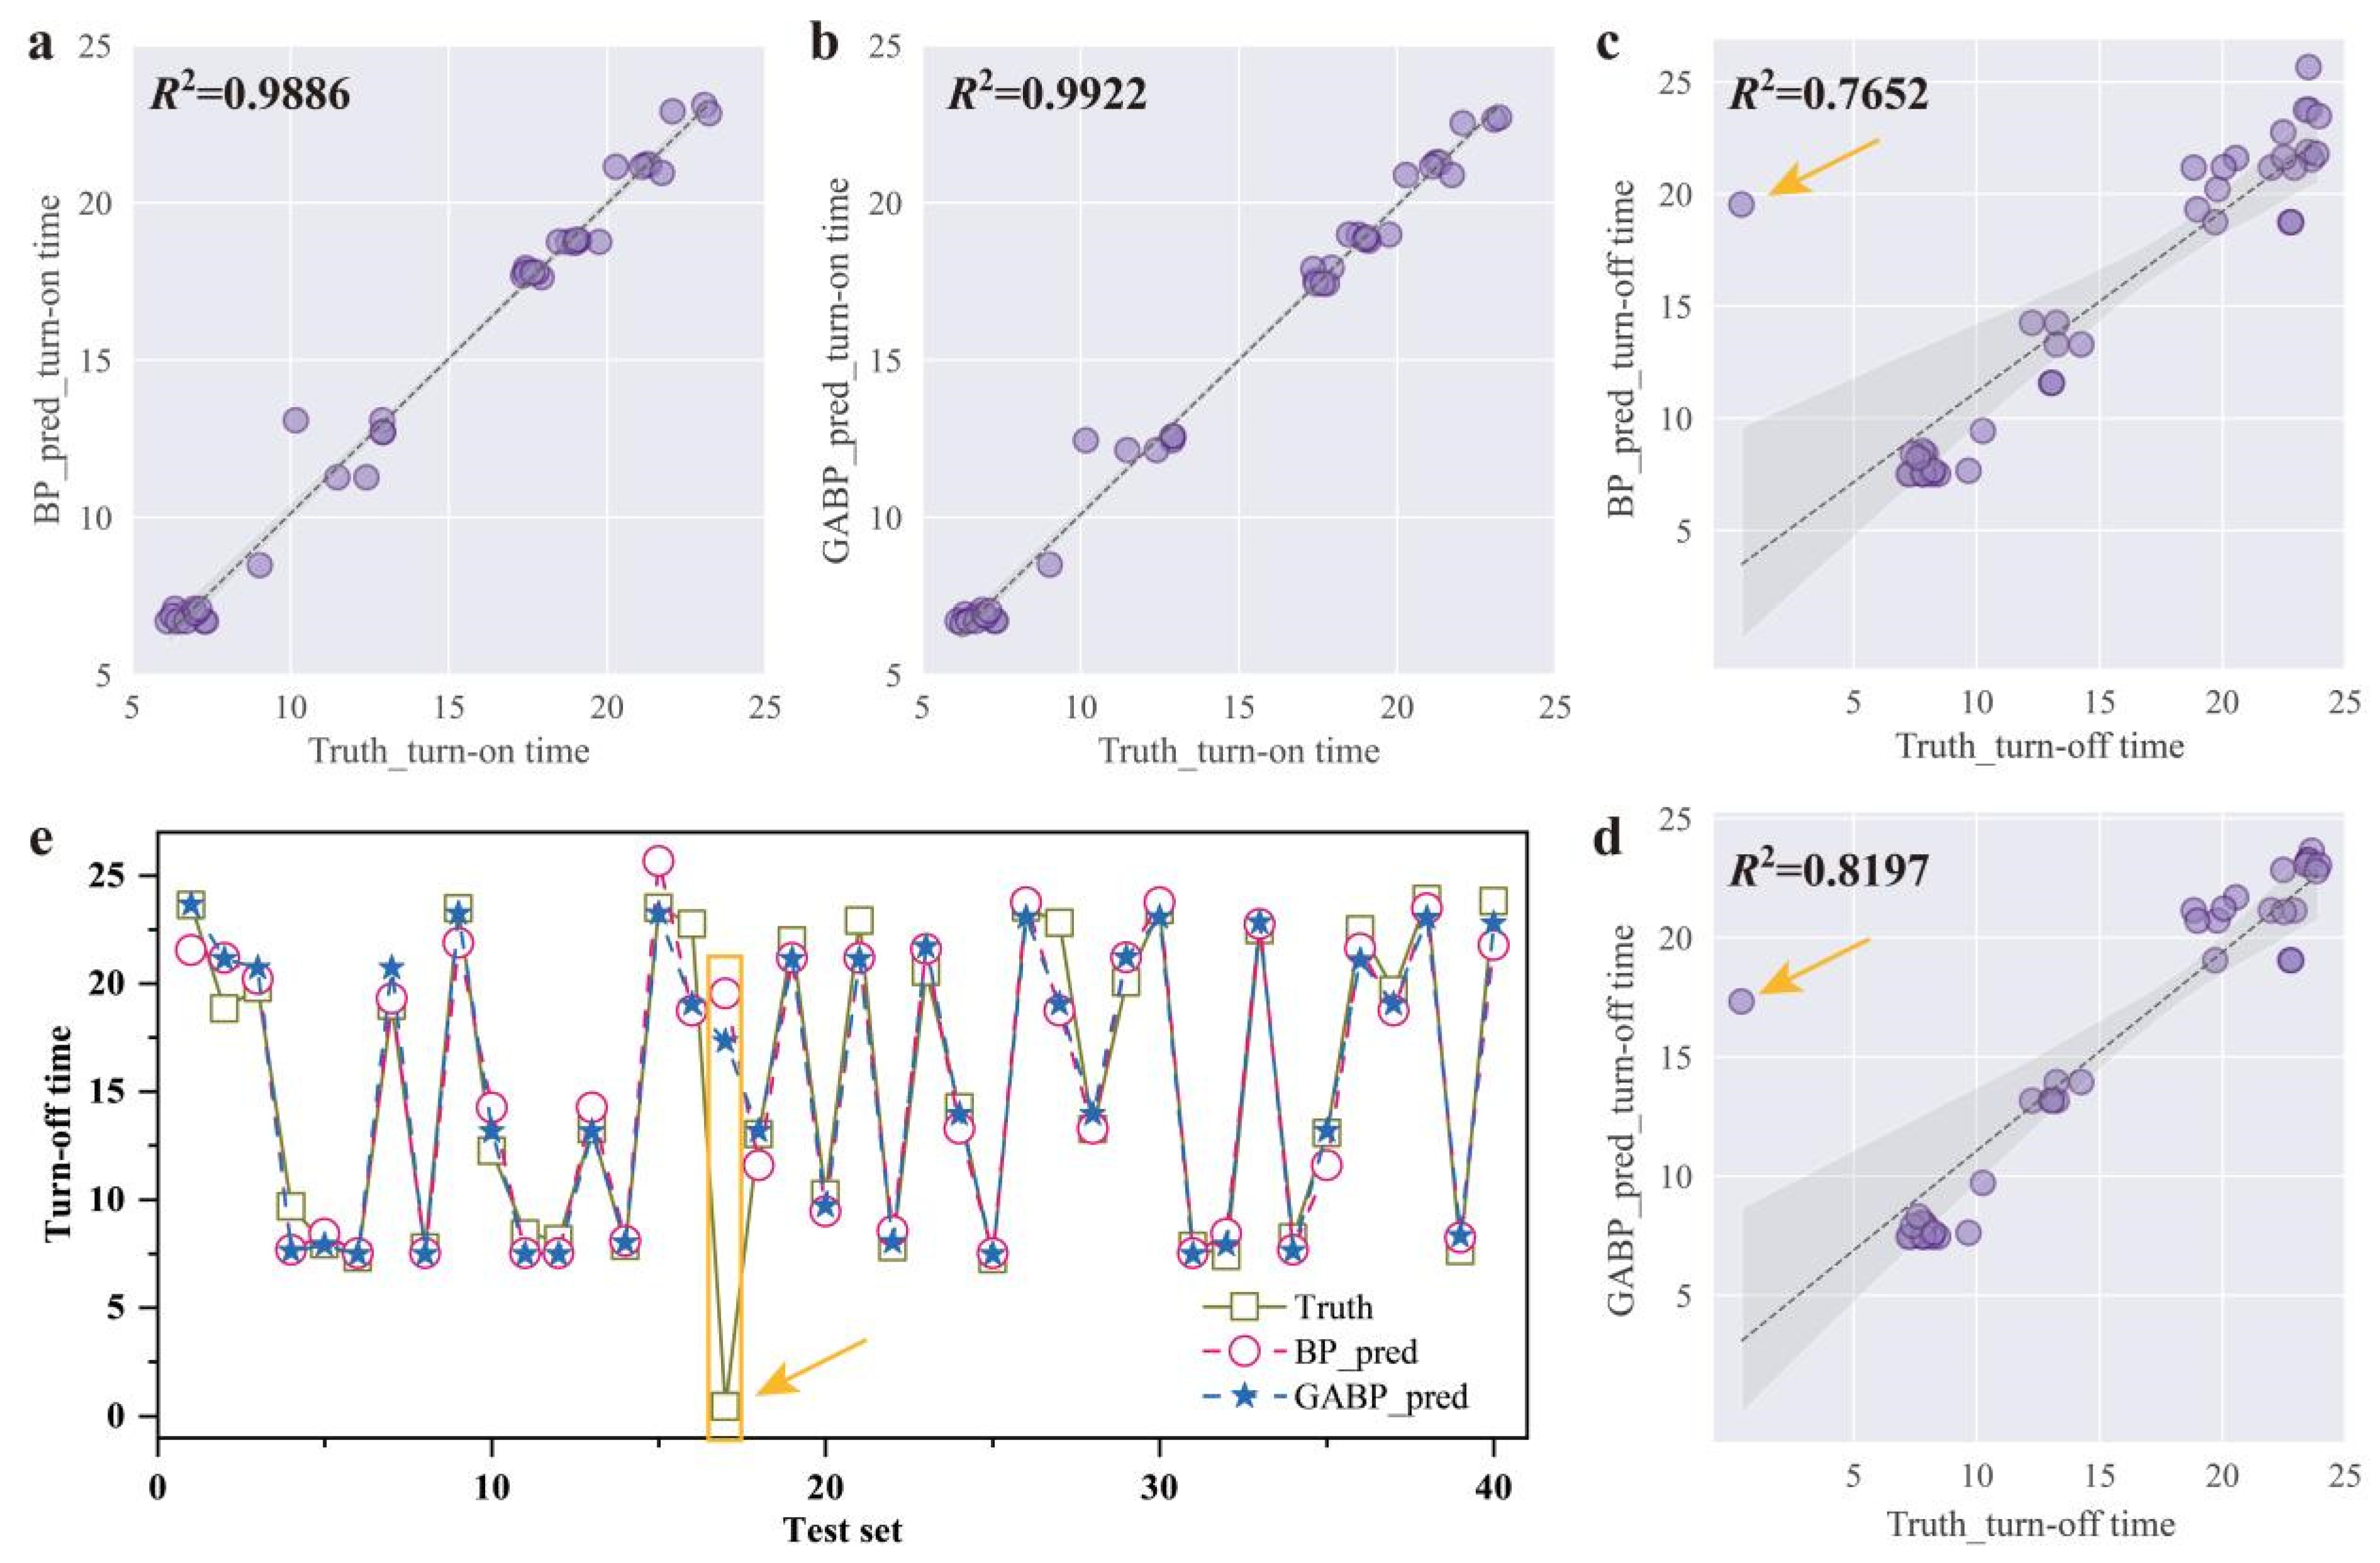
To assess the randomness of the model, we randomly partitioned the dataset into a testing set (20%) and a training set (80%). Regarding turn-on time, both BPNN and GABPNN exhibited similar performance with R2 values of 0.9886 (Figure 5a) and 0.9922 (Figure 5b), respectively. However, for turn-off time, GABPNN demonstrated an improvement of approximately 5% compared to BPNN, achieving R2 values of 0.8197 (Figure 5d) and 0.7652 (Figure 5c), respectively. Additionally, GABPNN showcased excellent predictive capability for neighboring time points (Figure 5e). Moreover, it outperformed BPNN in handling abrupt events as indicated by the yellow arrows in the Figure 5c,d and the yellow box in Figure 5e.
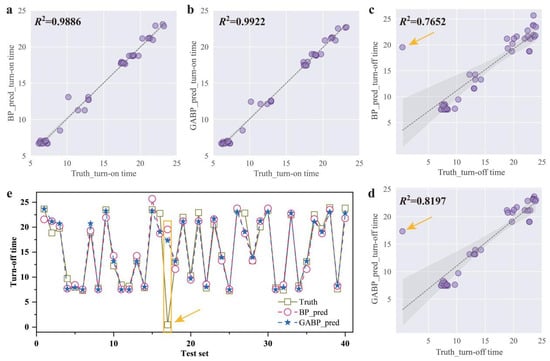
Figure 5.
Comparison of prediction results of GABPNN and BPNN. (a,b) The R2 values of BPNN and GABPNN for turn-on time, respectively. (c,d) The R2 values of BPNN and GABPNN for turn-off time, respectively. (e) The prediction results of GABPNN model for neighboring time points. The data points indicated by the yellow arrows and those enclosed within the boxes represent anticipated anomalies or abrupt deviations in the data.
3.3. Test Set Tests in Chronological Order
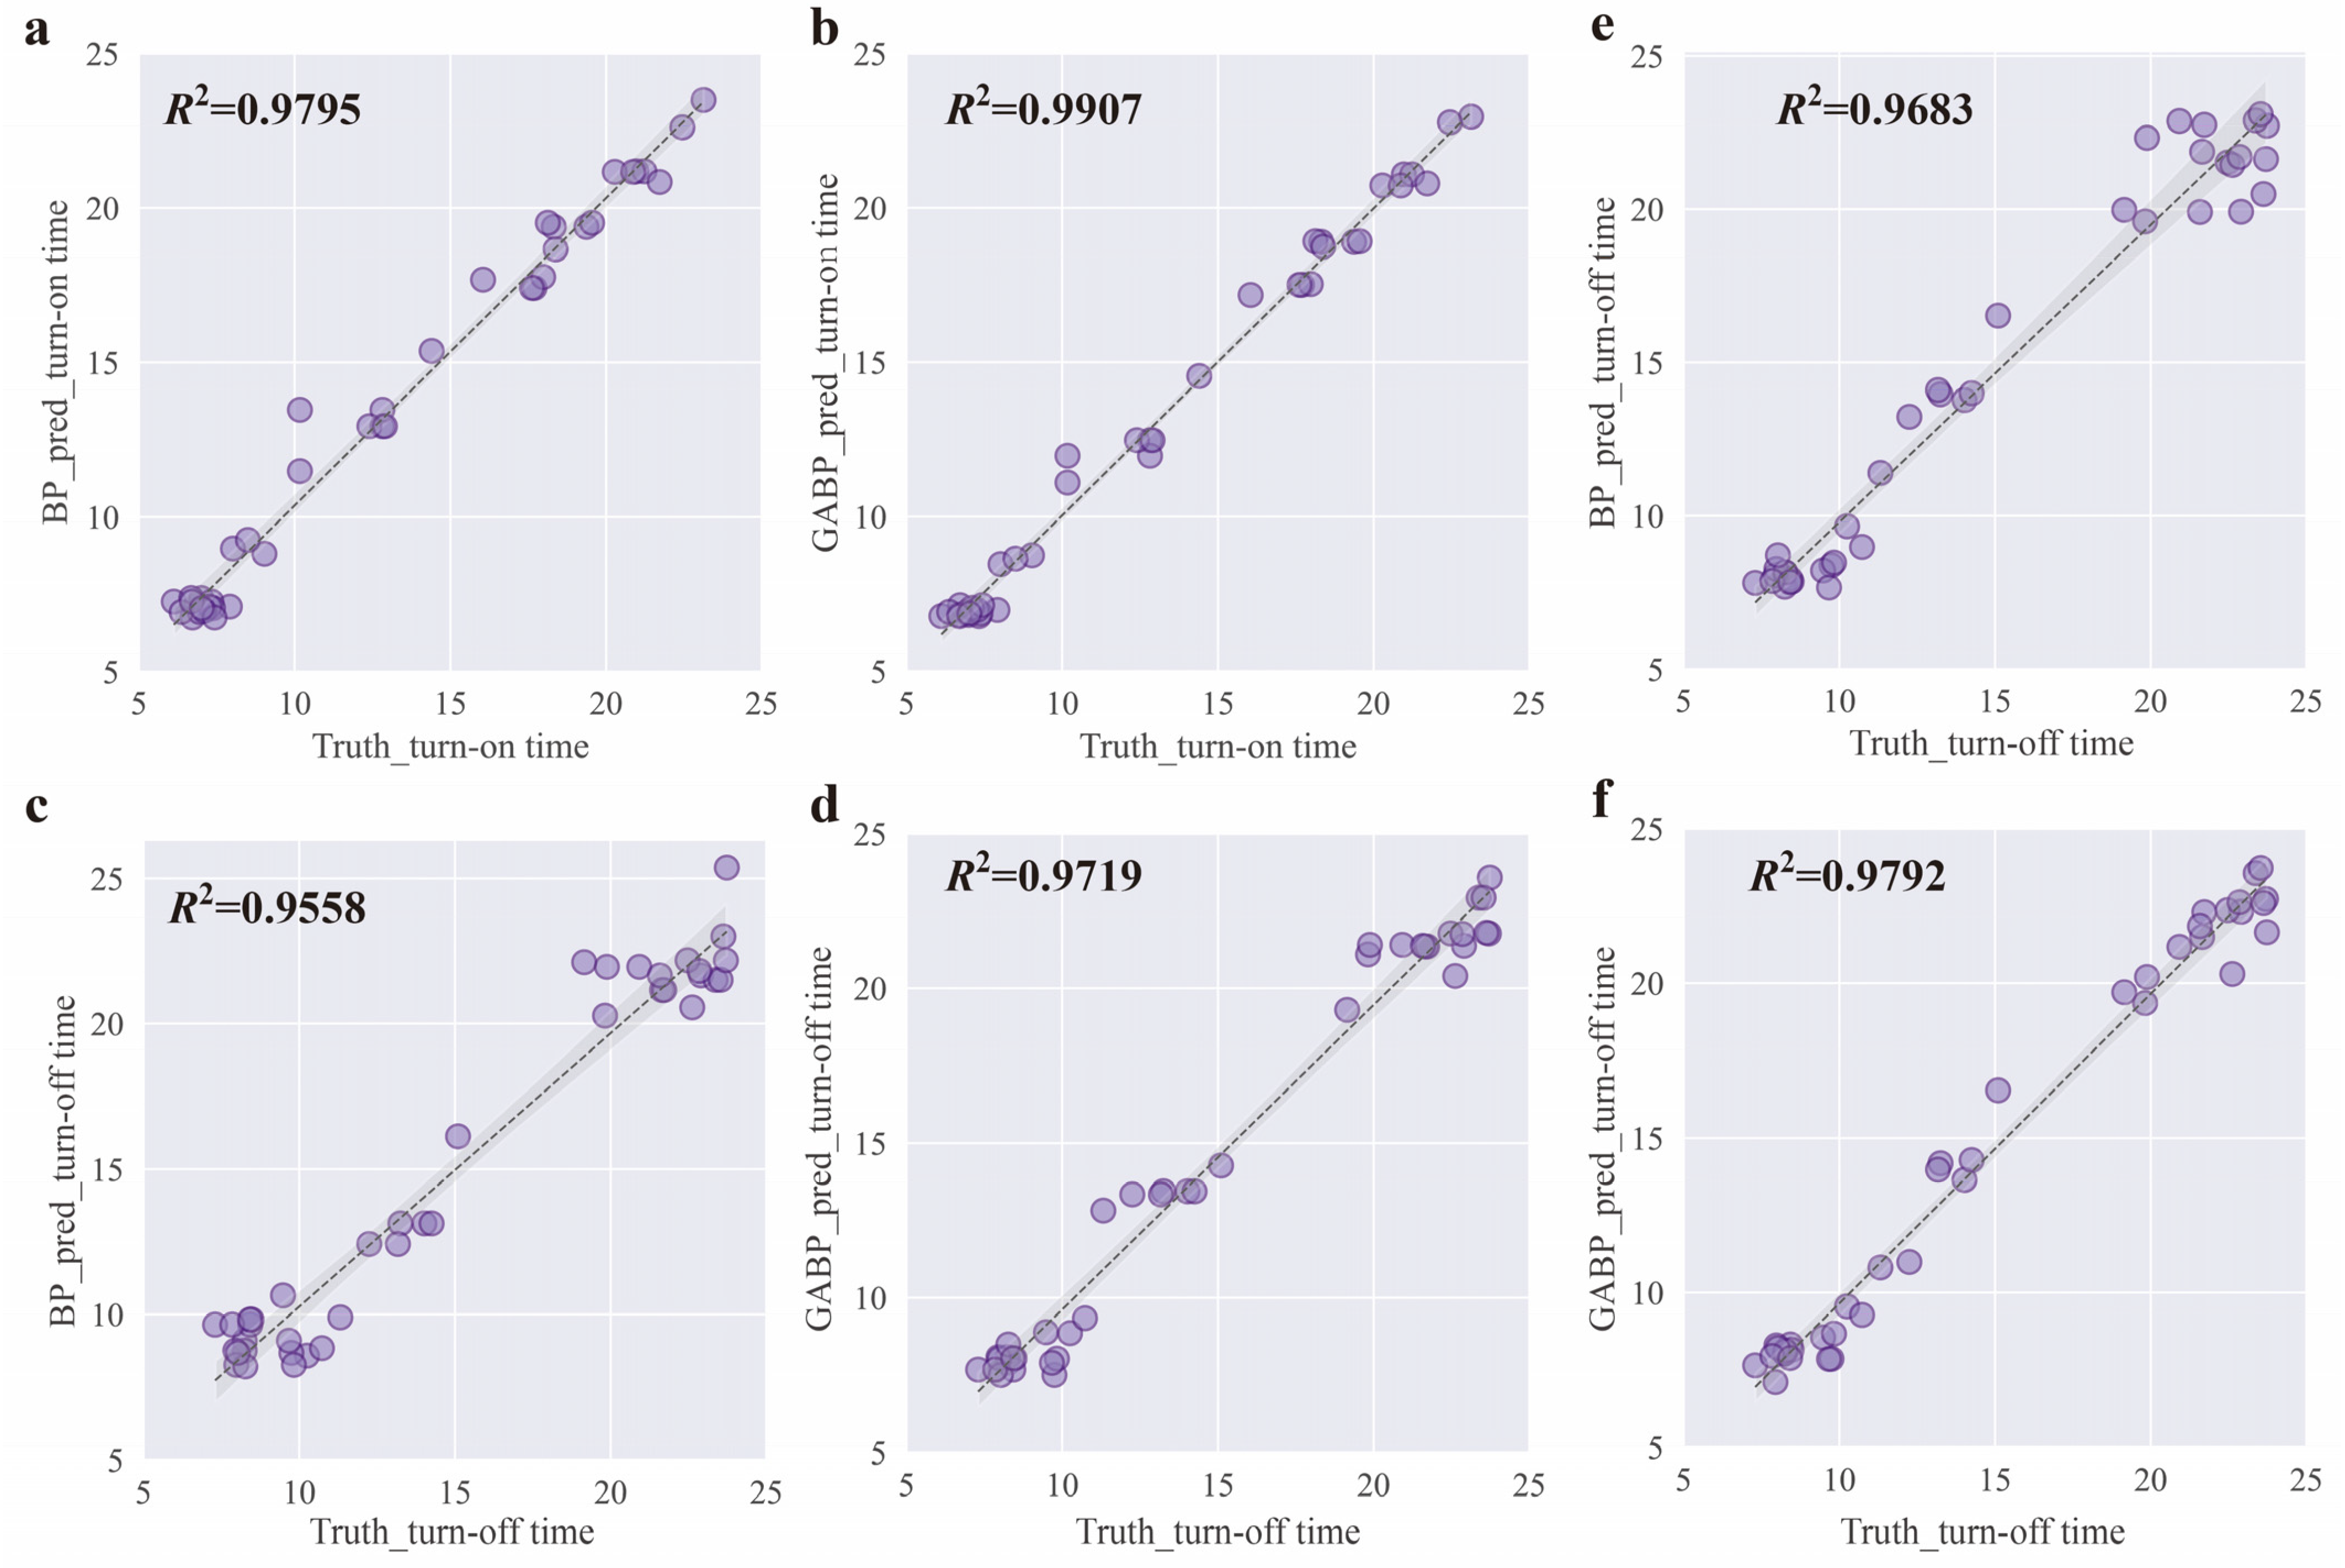
To evaluate the model’s performance in time-series analysis, we partitioned the latter 20% of data as the testing set and utilized the preceding 80% of data as the training set based on chronological order. Regarding turn-on time, both the BPNN model and the GABPNN model exhibited promising outcomes with R2 values of 0.9795 (Figure 6a) and 0.9907 (Figure 6b), respectively. Moreover, the predictive performance of the GABPNN model (R2 = 0.9719) slightly outperforms that of the BPNN model (R2 = 0.9558) during the process of turn-off time.. Furthermore, when incorporating predicted turn-on time into the original features during training models for predicting turn-off time, there was an enhancement in results with R2 values of 0.9683 for BPNN (Figure 6e) and 0.9792 for GABPNN (Figure 6f).
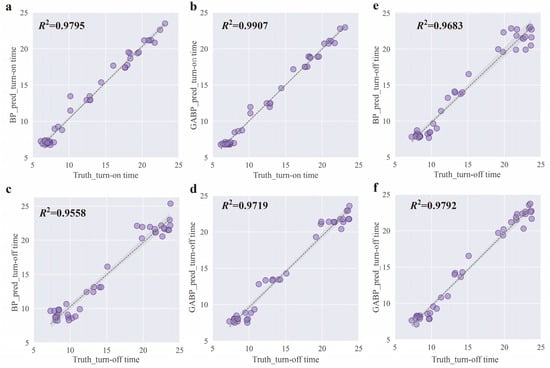
Figure 6.
In dividing the training set and the test set according to the time order of acquisition, the results of GABPNN and BPNN are compared. (a,b) R2 values for the prediction of turn-on time using the BPNN and GABPNN models, respectively. (c,d) R2 values for the prediction of turn-off time using the BPNN and GABPNN models, respectively. (e,f) The turn-off time prediction results by adding input features to the predicted turn-on time.
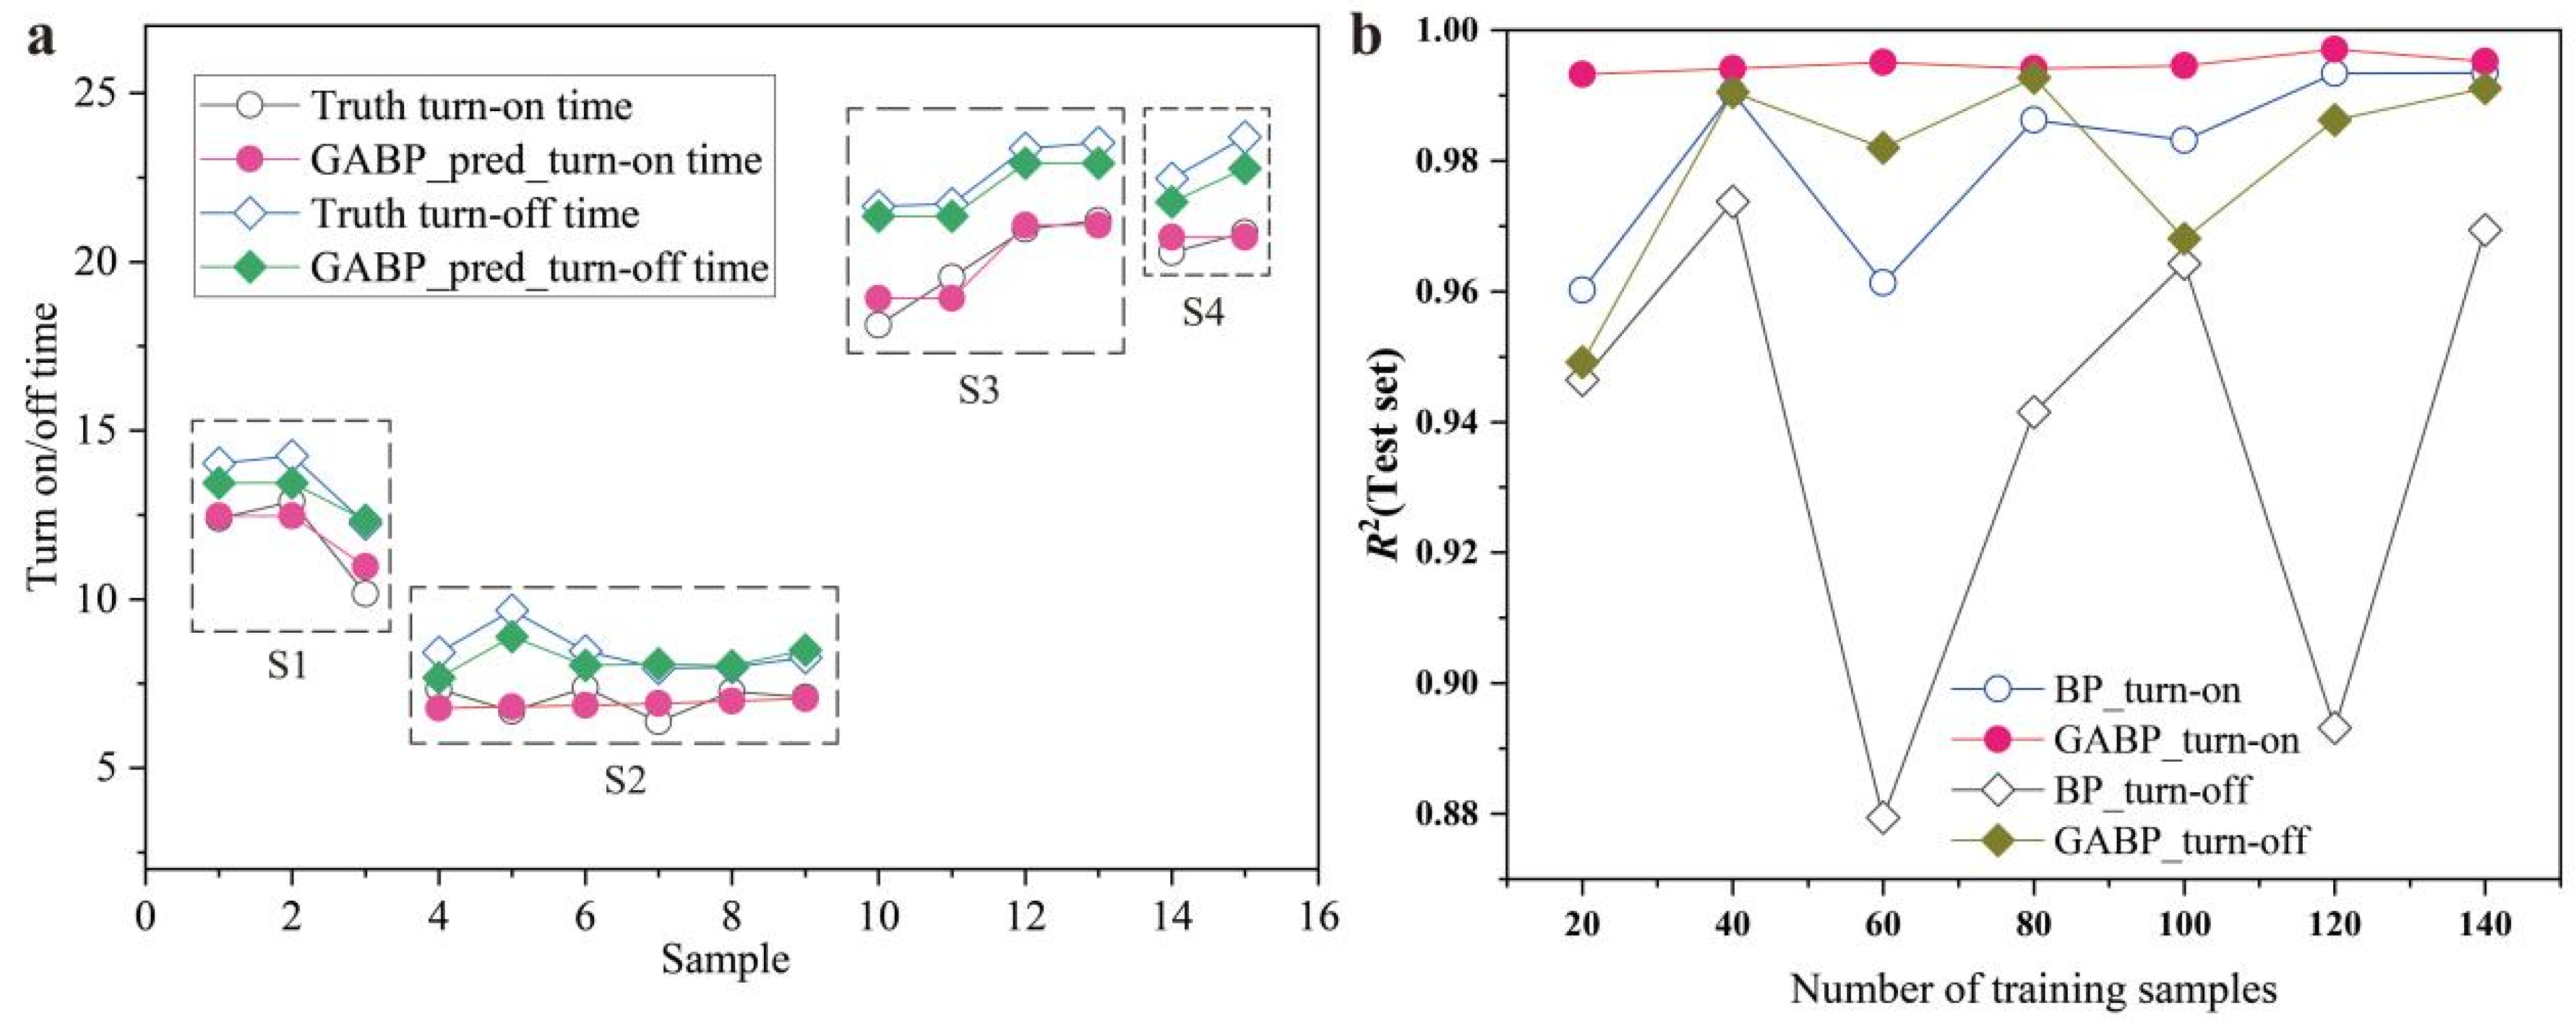
To observe the prediction performance in different regions, we extracted the test set prediction results of several distinct areas from the predicted outcomes (Figure 7a). Within the same time period, turn-on and turn-off trends were consistent across all regions and matched well with the predicted results. Additionally, to verify model adaptability towards data collection duration, we tested on sample sets consisting of 40, 60, 80, 100, 120, 140 and 160 sampling sequences, respectively. For each dataset type, a fixed number of 20 sequence data was used as the testing set while others were utilized for training purposes. The results showed that the model performed well in predicting effects even with only a training set of twenty sequence data (Figure 7b).
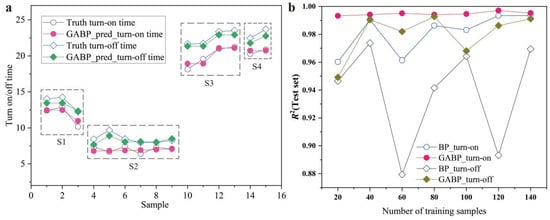
Figure 7.
(a) Test results for different regions and (b) test results for different numbers of training samples.
4. Conclusions
This study integrates OpenCV with face recognition and Bluetooth automatic control technology to achieve personalized information collection for user lighting. We evaluated nine classical machine learning models and found that BPNN performed exceptionally well in predicting time-series data. Specifically, the MSE, MAE, and R2 values for turn-on time were 0.41, 0.41, and 0.99 respectively; whereas for turn-off time, they were 11.16, 1.55, and 0.77 respectively. By optimizing the weights of BPNN using a genetic algorithm, we obtained significant improvements: the MSE, MAE, and R2 values for turn-on time were reduced to 0.28, 0.37, and 0.99 respectively; while for turn-off time, they decreased to 8.56, 1.24, and 0.82 respectively. In addition, GABPNN outperformed BPNN in various experiments including testing set division based on chronological order and varying training data quantity.
On this basis, a user-personalized lighting control system based on deep learning has been developed, which predicts the lighting time of different users based on their lighting habits and controls the lighting module in order to meet the different lighting requirements of different people. The system uses facial recognition technology to identify user identity and uses the BP algorithm to identify user lighting habits, providing a personalized lighting control system to ensure meeting each user’s lighting needs and achieving energy-saving effects. The main results of the study were as follows.
- (1)
- Lighting control based on habit prediction considers that different users have regular daily routines during the week. Sufficient data on the use of lamps by different users were collected and the BPNN algorithm obtained the next lamp use time of a user for the prediction and control of the lighting system.
- (2)
- Compared with the traditional manual control of lighting, the proposed system effectively reduces the manual operation control of users. The method is based on personal preferences, which not only allows for the development of optimal control strategies, but also effectively reduces energy consumption and provides users with comfortable and personalized services.
- (3)
- The proposed system is able to record the user’s lighting data in real time without relying on other factors and accurately predicts the lighting time according to the user’s individual preference for lighting. This intelligent and energy-saving lighting system thus realizes sensorless control of a multi-user environment.
- (4)
- In applications, if the result is not satisfactory to the user and the user retakes control of the lighting, the system reverses the control result to the Raspberry Pi database to form a new database. The new dataset is re-returned to the BP model for prediction and new actions are executed in the negative feedback process; e.g., controlling the lights on/off at the corresponding time in the next week and giving the time to turn on/off the lights.
- (5)
- Additionally, users can use mobile phones to operate the system in real-time. The new data are fed back to the database, and the new data set is used to predict which lamp will be turned on or off at the next moment. In the diagram, when the system has finished the learning and training to generate prediction results, it transmits the prediction results to the control module via Bluetooth. The control module receives the resulting command to operate the lighting module at the corresponding position.
Additionally, this study contributes to sustainability in the following ways. (a) Reduced Wastage: By capturing user information such as homecoming time and light switching behavior, the system can predict when lights should be turned on or off. This minimizes the instances where lights are left on unnecessarily, leading to energy savings. (b) Optimized Lighting: The use of Facial recognition technology to identify users and record their lighting data ensures that lighting is adjusted precisely to the needs of the occupants. This means lights are not brighter than they need to be, conserving energy. (c) Efficient Algorithms: The use of the BPNN algorithm, especially when optimized with genetic algorithms, ensures that the system operates efficiently. An efficient algorithm translates to quicker decisions and less computational power, further conserving energy. (d) Rapid Adaptation to New Users: The system’s ability to provide accurate predictions with only 20 time-series data points from new users means less “learning” time and quicker optimization of lighting conditions. This quick adaptation reduces periods of suboptimal lighting usage, which might otherwise waste energy.
In conclusion, while the primary objective of our research was to enhance user convenience and comfort, the intelligent control system indirectly promotes sustainability by ensuring that lighting is used more efficiently and effectively. Reducing energy consumption in household lighting can contribute to a broader goal of energy conservation and environmental sustainability.
Author Contributions
Conceptualization, Z.C. and J.Z.; software, J.Z. and Z.L.; formal analysis, J.Z. and Z.L.; investigation, J.Z., A.W. and W.W.; data curation, Z.L.; writing—original draft preparation, J.Z.; writing—review and editing, Z.L. and Z.C.; funding acquisition, Z.C. All authors have read and agreed to the published version of the manuscript.
Funding
This work was supported by Special Projects in Key Fields of Artificial Intelligence in Colleges and Universities of Guangdong Province (2019KZDZX1042).
Institutional Review Board Statement
Not applicable.
Informed Consent Statement
Not applicable.
Data Availability Statement
On behalf of all the authors, the corresponding author states that our data are available upon reasonable request.
Conflicts of Interest
The authors declare that they have no known competing financial interest or personal relationship that could appear to influence the work reported in this paper.
References
- Putrada, A.G.; Abdurohman, M.; Perdana, D.; Nuha, H.H. Machine Learning Methods in Smart Lighting Toward Achieving User Comfort: A Survey. IEEE Access 2022, 10, 45137–45178. [Google Scholar] [CrossRef]
- Pauley, S.M. Lighting for the human circadian clock: Recent research indicates that lighting has become a public health issue. Med. Hypotheses 2004, 63, 588–596. [Google Scholar] [CrossRef]
- Yoon, S.H.; Lee, K.S.; Cha, J.S.; Mariappan, V.; Lee, M.W.; Woo, D.G.; Kim, J.U. Indoor surveillance camera based human centric lighting control for smart building lighting management. Int. J. Adv. Cult. Technol. 2020, 8, 207–212. [Google Scholar]
- Al Horr, Y.; Arif, M.; Kaushik, A.; Mazroei, A.; Katafygiotou, M.; Elsarrag, E. Occupant productivity and office indoor environment quality: A review of the literature. J. Affect. Disord. 2016, 105, 369–389. [Google Scholar] [CrossRef]
- Hsieh, M. Effects of illuminance distribution, color temperature and illuminance level on positive and negative moods. J. Asian Arch. Build. Eng. 2015, 14, 709–716. [Google Scholar] [CrossRef]
- Khoa, T.A.; Nhu, L.M.B.; Son, H.H.; Trong, N.M.; Phuc, C.H.; Phuong, N.T.H.; Van Dung, N.; Nam, N.H.; Chau, D.S.T.; Duc, D.N.M. Designing efficient smart home management with IoT smart lighting: A case study. Wirel. Commun. Mob. Comput. 2020, 2020, 1–18. [Google Scholar] [CrossRef]
- Kandasamy, K.N. Smart lighting system using ANN-IMC for personalized lighting control and daylight harvesting. Build. Environ. 2018, 139, 170–180. [Google Scholar] [CrossRef]
- Zarindast, A.; Wood, J.; Sharma, A. A data-driven personalized smart lighting recommender system. arXiv 2021, arXiv:2104.02164. [Google Scholar]
- Tarasevičienė, A.P.; Morkevičius, N.; Janavičiūtė, A. The usage of artificial neural networks for intelligent lighting control based on residents behavioral pattern. Electron. Air Elektrotechnika 2015, 21, 72–79. [Google Scholar]
- Chen, Y.T.; Chen, W.N.; Zhang, X.Z. Fly face recognition based on deep convolution neural network. Opt. Precis. Eng. 2020, 28, 1558–1567. [Google Scholar] [CrossRef]
- Fan, L.L.; Zhao, H.W.; Zhao, H.Y. Overview of target detection based on deep convolution neural network. Opt. Precis. Eng. 2020, 28, 1152–1164. [Google Scholar]
- Sun, X.; Lv, M. Facial Expression Recognition Based on a Hybrid Model Combining Deep and Shallow Features. Cogn. Comput. 2019, 11, 587–597. [Google Scholar] [CrossRef]
- Indolia, S.; Goswami, A.K.; Mishra, S.; Asopa, P. Conceptual understanding of convolutional neural network—A deep learning approach. Procedia Comput. Sci. 2018, 132, 679–688. [Google Scholar] [CrossRef]
- Ren, K.Q.; Hu, H. Discriminant face recognition algorithm based on deep convolution neural network. J. Huazhong Univ. Sci. Technol. 2019, 47, 127–132. [Google Scholar]
- Long, J.; Shel, H.E.; Darrell, T. Fully Convolutional Networks for Semantic Segmentation. IEEE Trans. Pattern Anal. Mach. Intell. 2015, 39, 640–651. [Google Scholar]
- Lu, P.; Song, B.; Xu, L. Human face recognition based on convolutional neural network and augmented dataset. Syst. Sci. Control Eng. 2021, 9, 29–37. [Google Scholar] [CrossRef]
- Du, Y.; Lim, Y.; Tan, Y. A Novel Human Activity Recognition and Prediction in Smart Home Based on Interaction. Sensors 2019, 19, 4474. [Google Scholar] [CrossRef] [PubMed]
- Park, J.Y.; Dougherty, T.; Fritz, H.; Nagy, Z. LightLearn: An adaptive and occupant centered controller for lighting based on reinforcement learning. J. Affect. Disord. 2012, 147, 397–414. [Google Scholar] [CrossRef]
- Li, X. Research on the Design Strategy of Natural Ventilation Building’s Light and Thermal Environment Considering Rhythm Coordination; Dalian University of Technology: Dalian, China, 2020; p. 0519. [Google Scholar]
- Alam, M.R.; Reaz, M.B.I.; Ali, M.A.M. SPEED: An inhabitant activity prediction algorithm for smart homes. IEEE Trans. Syst. Man Cybern.—Part A Syst. Hum. 2011, 42, 985–990. [Google Scholar] [CrossRef]
- Yang, K.; Zhao, L. Intelligent lighting system based on VLC and PLC. Laser J. 2019, 40, 72–75. [Google Scholar]
- Yang, W.; Jeon, J.Y. Effects of correlated colour temperature of LED light on visual sensation, perception, and cognitive performance in a classroom lighting environment. Sustainability 2020, 12, 4051. [Google Scholar] [CrossRef]
- Schonlau, M.; Zou, R.Y. The random forest algorithm for statistical learning. Stata J. 2020, 20, 3–29. [Google Scholar] [CrossRef]
- Xu, M.; Watanachaturaporn, P.; Varshney, P.K.; Arora, M.K. Decision tree regression for soft classification of remote sensing data. Remote Sens. Environ. 2005, 97, 322–336. [Google Scholar] [CrossRef]
- Ostertagová, E. Modelling using polynomial regression. Procedia Eng. 2012, 48, 500–506. [Google Scholar] [CrossRef]
- Smola, A.J.; Schölkopf, B. A tutorial on support vector regression. Stat. Comput. 2004, 14, 199–222. [Google Scholar] [CrossRef]
- McDonald, G.C. Ridge regression. Wiley Interdiscip. Rev. Comput. Stat. 2009, 1, 93–100. [Google Scholar] [CrossRef]
- Ranstam, J.; Cook, J.A. LASSO regression. J. Br. Surg. 2018, 105, 1348. [Google Scholar] [CrossRef]
- Hans, C. Elastic Net Regression modeling with the orthant normal prior. J. Am. Stat. Assoc. 2011, 106, 1383–1393. [Google Scholar] [CrossRef]
- Song, Y.; Liang, J.; Lu, J.; Zhao, X. An efficient instance selection algorithm for k nearest neighbor regression. Neurocomputing 2017, 251, 26–34. [Google Scholar] [CrossRef]

Disclaimer/Publisher’s Note: The statements, opinions and data contained in all publications are solely those of the individual author(s) and contributor(s) and not of MDPI and/or the editor(s). MDPI and/or the editor(s) disclaim responsibility for any injury to people or property resulting from any ideas, methods, instructions or products referred to in the content. |
© 2023 by the authors. Licensee MDPI, Basel, Switzerland. This article is an open access article distributed under the terms and conditions of the Creative Commons Attribution (CC BY) license (https://creativecommons.org/licenses/by/4.0/).