Article

Psychometric Properties of the Slovenian Version of the Brief Sense of Community Scale

Department of Psychology, Faculty of Arts, University of Ljubljana, SI-1000 Ljubljana, Slovenia
*
Author to whom correspondence should be addressed.
Sustainability 2023, 15(21), 15394; https://doi.org/10.3390/su152115394
Submission received: 22 September 2023 / Revised: 15 October 2023 / Accepted: 25 October 2023 / Published: 28 October 2023

Abstract

:
A sense of community plays an important role in promoting sustainable behaviors and values. Therefore, when measuring sense of community, it is important to ensure that such measurement instruments have excellent psychometric properties. In this study, we start from the model that sense of community is related to a person’s perception of his or her relationship with a community, particularly in terms of need fulfillment, sense of connectedness and emotional connection, and perceived impact on the community. The Brief Sense of Community Scale (BSCS) is an 8-item self-report scale designed specifically for the assessment of individuals’ relation with their neighborhood. The aim of this study was to investigate the factor structure and reliability of a new Slovenian version. A sample of 502 adults from Slovenia completed the scale. The data did not support the original hierarchical four-factor model. On the other hand, a one-factor model with autoregressive effects on the unique factors fitted well. The reliability of the sum score was excellent, while only two out of the four subscales had acceptable reliability. The results support the use of the Slovenian version of the BSCS as a unidimensional scale and allow the use of this measure in research on sense of community and possibly as a rigorous measure in further studies of sustainable development in different cultures.

1. Introduction

A sense of community contributes to the sustainable development of society. It nurtures and supports the development and implementation of sustainable innovations while fostering the collective efforts necessary for sustainable development [1]. It is therefore important that the metrics used to measure the impact of sustainable development and sustainable innovation are as effective as possible. Unfortunately, only a small number of scales measuring sense of community have been developed. Additionally, they are predominantly written in English and validated for use in English-speaking societies. For an adapted version to be relevant for another linguistic environment, a back translation must be conducted, and the adequacy of the psychometric properties in the new population must be established. The functioning of a scale in different linguistic contexts also depends on the culture. Since culture might influence individuals’ sense of community [2,3], it is important to examine whether the psychological sense of community is conceptualized similarly between different cultures. In this article, we investigate the psychometric properties of the newly adapted Slovenian version of the Brief Sense of Community Scale (BSCS) [4].
The Brief Sense of Community Scale (BSCS) developed by the authors of Ref. [4] is based on McMillan and Chavis’ multidimensional model of sense of community [5], which identifies the following domains:
-
Need fulfillment through belonging to the community;
-
A sense of belonging and interconnectedness or a sense of membership; this sense marks the boundary between those who belong and those who do not belong to the community;
-
A sense of importance to the community and, conversely, a sense of importance and influence in the community;
-
Shared emotional connectedness or feelings of commitment to the community and shared emotions; it is a sense of deep involvement in collective experiences.
The revision [4] of the model of sense of community [5] was applied to the built environment and neighborhood. The authors developed a multidimensional model that includes the following domains:
-
Fulfillment of neighborhood needs;
-
Membership or affiliation with the neighborhood in which one lives;
-
Influence or sense of positive interaction between neighbors;
-
Emotional relationship with the neighborhood.
We illustrate this model using the diagram in Figure 1.
The original Brief Sense of Community Scale (BSCS) [4] is an 8-item self-report scale, designed specifically for the assessment of individuals’ relation to their neighborhood. A five-point Likert response format ranging from “strongly agree” to “strongly disagree” is used.
To the best of our knowledge, BSCS has been used mainly in the US [6,7,8]. Nevertheless, this scale has also been used to assess the sense of community of members of different cultural groups such as Hispanic/Latin and African American/Black [6,7,9] youth. In doing so, the authors [6,7,9] used the English language version designed by Peterson et al. [4]. Chiessi et al. [10] also adapted the scale to measure neighborhood sense of community in adolescence, as the original scale was intended for adults only. Linguistic adaptations have been made for the German [11], Slovak [12,13], Italian [10], and Spanish [14,15] languages, as well as for some Asian languages such as Chinese [16], Japanese [17], and Vietnamese [18].
Peterson et al. [4] found support for a hierarchical factor model with four first-order factors and a single second-order factor. The 4-factor structure of the BSCS was confirmed for English- [6,7,8], German- [11], Slovak- [12], and Japanese [17]-speaking cultures. Adaptations for Chinese [16] and Vietnamese [18] either confirmed the unidimensional structure or did not address the dimensions at all but assessed the scale as a whole. Research [14,15] conducted on Puerto Rican participants has yielded mixed results.
The BSCS has demonstrated a high degree of internal consistency and reliability. Peterson et al. [4] reported that the coefficient alphas for the subscales were 0.86 for need fulfillment, 0.94 for group membership, 0.77 for influence, and 0.87 for emotional connectedness; for the total score, the alpha was 0.92. For a translated version, researchers have reported coefficient alphas in the range of 0.66–0.93 (Mdn = 0.85) for the total score [14,15,16,17,18], while the alphas for subscale scores [12,15,17] ranged from 0.64 to 0.95 (Mdn = 0.87). It should be noted that some studies only reported the reliability for total scores or for subscales.
In this study, we adapted the BSCS for the Slovenian language, which belongs to the Slavic languages. Being from the same Indo-European language family, these languages are similar to each other, which facilitates mutual communication and understanding between the different Slavic nations. The Slavic nations also share a common historical background, having lived in similar geographical areas and having been exposed to similar political events and challenges. Apart from their commonalities, Slavic nations are, of course, very different, but we decided to adapt the questionnaire for one of them, more precisely, for Slovenian participants, thus paving the way to study the phenomenon of sense of community in this geolinguistic area.
In the past, sense of community was emphasized and stressed differently in Slavic countries than in Anglo-Saxon and other geopolitical areas because the socialist and communist political regimes demanded a different understanding of community from their citizens. They emphasized the development of a collective identity and propagated a strong sense of national identity and patriotism. Socialist and communist ideologies prioritize the collective over the individual, which partially results in limited personal freedom and self-expression [19]. On the other hand, former socialist countries have also maintained an individualistic value orientation that presents unique challenges to local populations [20]. Despite the collapse of such ideologies over several decades, their consequences can still be seen. This is why rigorous adaptations of instruments that measure sense of community in different cultural contexts are so important.
The first attempt at a brief study with a Slovenian sample was conducted in 2021 [21] and included 230 gender-heterogeneous participants. The coefficient alpha for the total score was 0.84; for need fulfillment, it was 0.50; for membership, it was 0.80; for congruence, it was 0.64; and for emotional attitudes, it was 0.86. Kobal Grum [21] also performed principal component analysis and first extracted two components based on the Kaiser–Guttman criterion, which explained 74.4% of the total variance; they additionally extracted four components following the original four-factor model, which explained 87.1% of the total variance. For the present study, we collected a larger sample and performed a more rigorous statistical evaluation.

Problem of the Study

The aim of the present study was to explore the psychometric properties of the Slovenian adaptation of the BSCS. In the first step, we investigated the dimensionality of the BSCS, and in the second step, we estimated the scores’ reliability. We attempted to compare the following models:
  • The original second-order model [4] that includes four first-order factors and one second-order general factor;
  • The one-factor congeneric model, thus simplifying the original model by omitting the first-order factors;
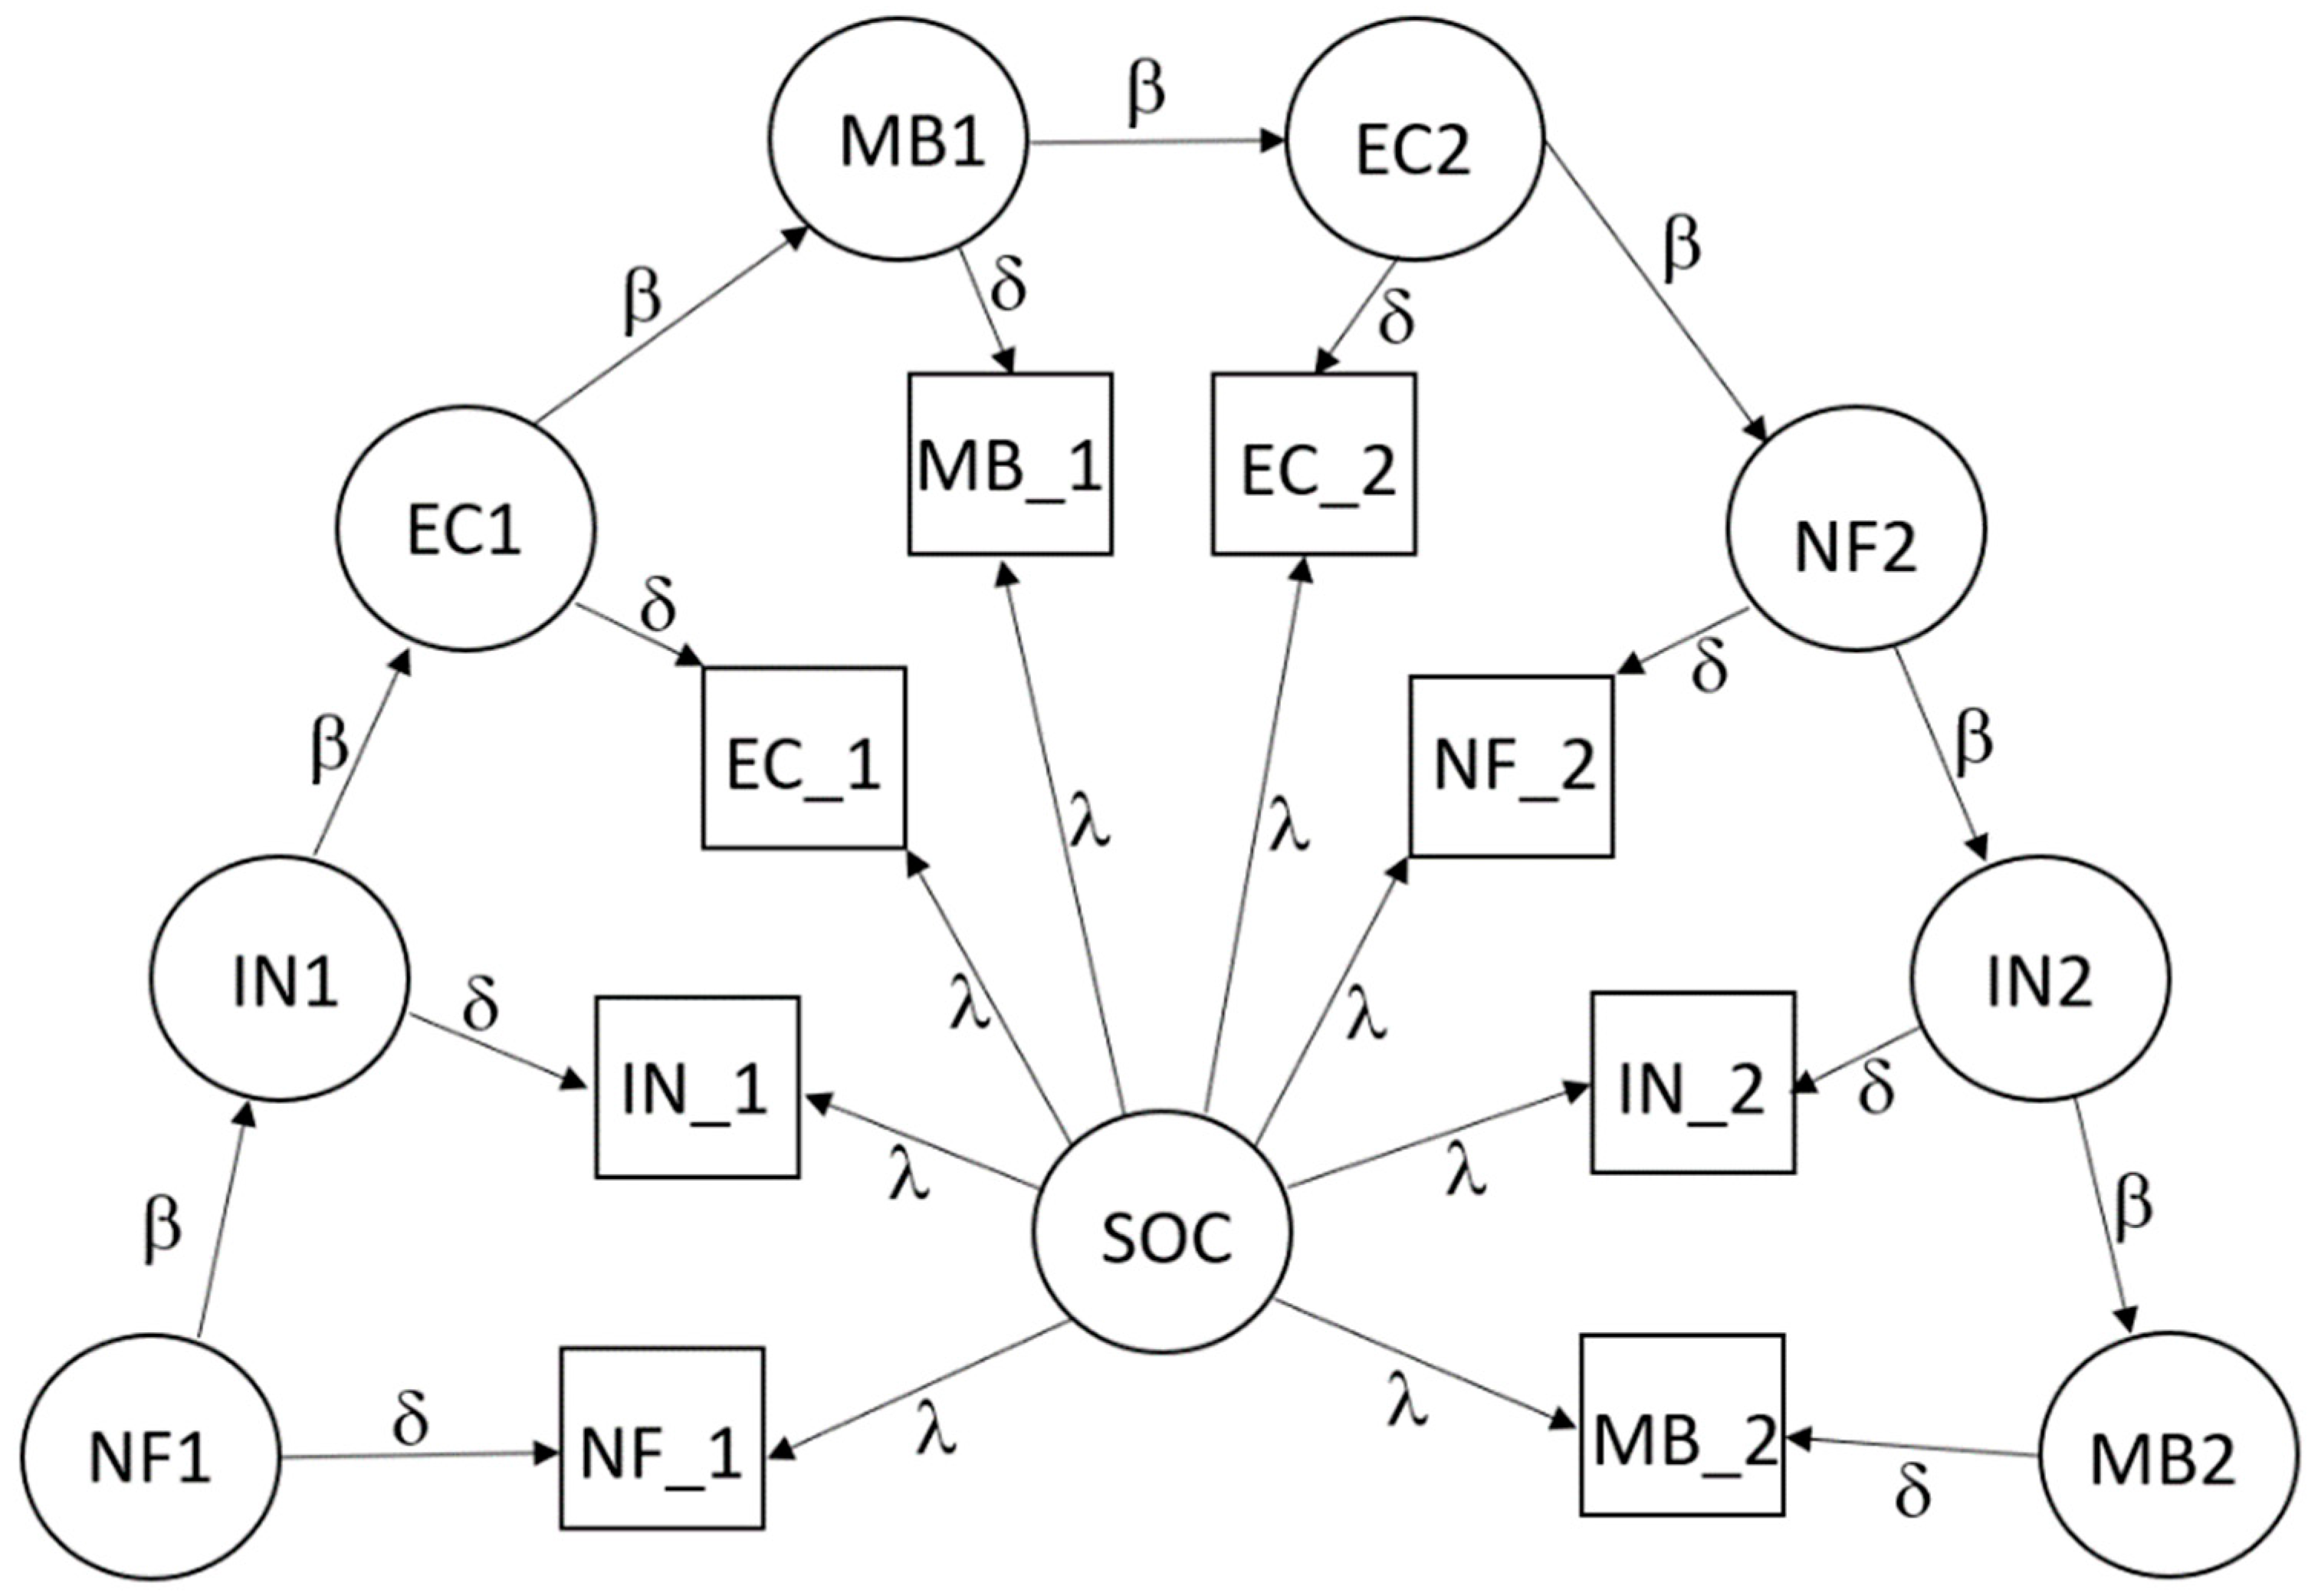
  • The four-factor model with a moving-average structure of unique factors;
  • The one-factor model with a moving-average structure of unique factors.
The use of the last two models was motivated by the fact that, since the items were administered as a single group of items, autoregressive effects could emerge. As demonstrated already by [22], such effects not only deteriorate the fit of the standard factor models, but may also seriously distort values of the internal consistency coefficients which assume independent errors. We tested a simple moving-average model where each unique factor (except the first one) was regressed on the unique factor pertaining to the previously administered item. Model 4 is outlined in Figure 2. Besides the common factor (sense of community—SOC), a latent variable was assigned to each item. To identify the model and to make these variables equivalent to unique factors, both the items’ unique variances and the correlations among the latent variables were all fixed to zero. The variances explained by each of the eight single-indicator latent variables can thus be interpreted as unique variances. There are three types of paths in the model: common factor loadings are denoted by λ, unique factor loadings (disturbances) are denoted by δ, and the autoregressive effects between successive items are denoted by β.

2. Materials and Methods

2.1. Participants

This study included 502 Slovenian adults, with a nearly even gender distribution: 51.8% of them were male (260 participants), while 48.0% were female (241 participants). When looking at the age groups, 43.4% of the participants (218 individuals) fell into the 18–34-year-old category. The largest group was the 35–65-year-old category, comprising 49.2% of the participants (247 individuals). The smallest group was composed of those older than 65, making up 7.0% of the participants (35 individuals). In terms of education, only a small portion of the participants, 4.4% (22 individuals), had completed only elementary school. Those with a secondary school degree made up 40.2% of the participants (202 individuals), closely followed by those with a university or equivalent degree at 39.0% (196 individuals). Participants with a postgraduate degree accounted for 16.3% of the total (82 individuals). There were 149 (29.7%) participants living in the city center, 135 (26.9%) participants reported living on the outskirts, 131 (26.1%) lived in a compact rural settlement, 72 (14.3%) lived in a scattered rural settlement, and 15 (3.9%) participants reported living in a remote area. Most participants (282 or 56.2%) owned their dwelling, 88 (17.5%) participants lived in rented housing, 59 (11.8%) participants lived in not-for-profit rented housing, and the same number of participants lived with relatives. The remaining 14 (2.8%) participants lived in another or unknown type of property. Finally, 176 (35.1%) participants lived in an apartment building, 317 (63.1%) participants lived in a house, while for the remaining 9 (1.8%) participants, the type of building was other or unknown.

2.2. Procedure

The questionnaire was administered as part of a larger survey which included assessments of the participants’ satisfaction with their dwelling, their neighborhood, and their life in general.
The survey was conducted in the period from 2018 to 2022. Participants were recruited using the snowball method, using social network contacts and the assistance of students of psychology who were asked to invite their acquaintances and relatives; they were encouraged to invite as heterogeneous participants as possible.
The survey was administered in both paper and online forms. Both forms had identical contents and graphical design.

2.3. Instrument

The participants responded to the Slovenian version of The Brief Sense of Community Scale (BSCS). The scale consists of eight statements, all of them being phrased in the positive sense (that is, a higher response indicates a higher sense of community). The participants rated their agreement on a five-point scale, where 1 means “completely disagree” and 5 means “completely agree”.

2.4. Data Analysis

Four participants skipped the response to a single item. Their missing responses were imputed using the missForest package [23] prior to analysis. The lavaan package [24] was used for factor analysis and structural equation modeling. We used the MLMV estimator for non-normal numeric variables. We treated the item responses as numeric variables because the self-rating scale was essentially numeric, with only the extreme points labeled. Besides the chi-squared test statistic, we considered the following values to indicate a good fit: RMSEA ≤ 0.06, CFI ≥ 0.95, and SRMR ≤ 0.08 [25]. For comparison of non-nested models, we relied on guidelines by Burnham and Anderson (2004): an AIC difference between 4 and 7 means considerably lower support, and a difference ≥10 means essentially no support for the model with the higher AIC value. The α = 5% significance level was used for hypothesis testing.

3. Results

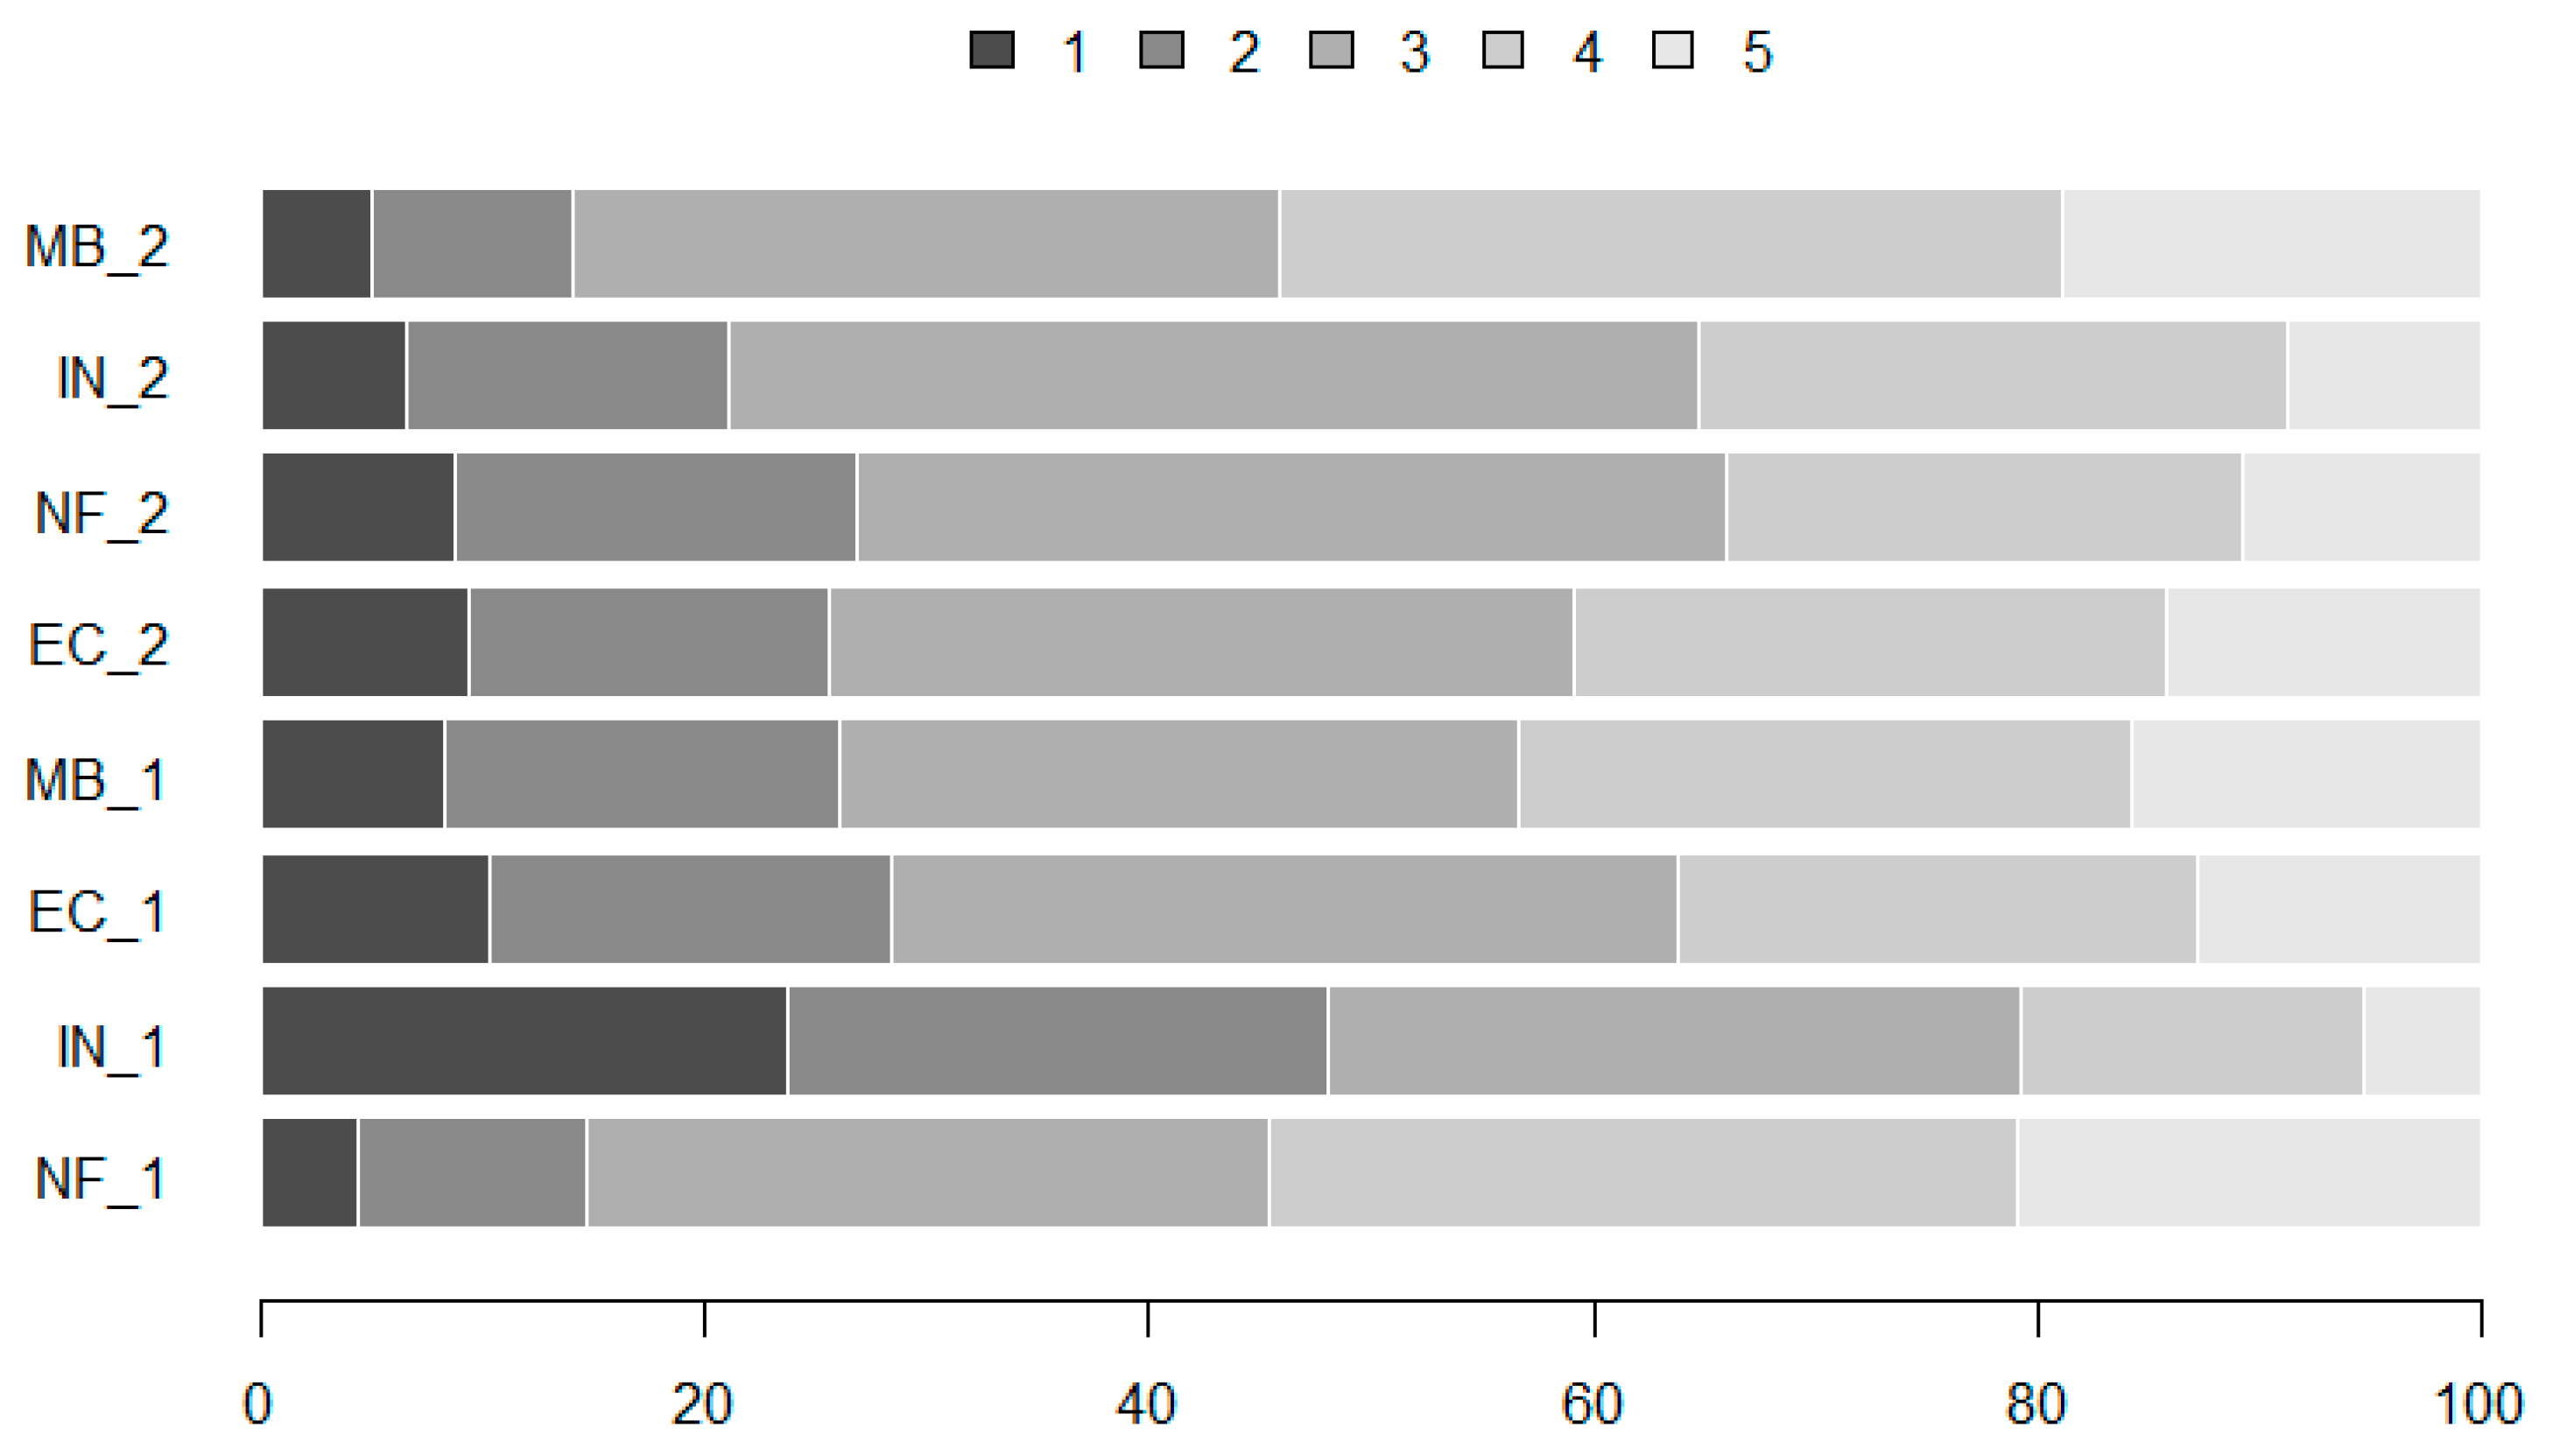
3.1. Descriptive Statistics

Figure 3 presents the percentages of item responses across items, and Table 1 presents the descriptive statistics for item responses. While all item means were close to the scale midpoint (i.e., 3), the average responses to both MB_2 and NF_1 were somewhat higher due to a smaller percentage of ratings of 1 and a higher percentage of ratings of 5, compared to other items. On the other hand, item IN_1 had a higher percentage of low ratings and a lower percentage of high ratings, resulting in a somewhat lower average.
Table 2 presents the item inter-correlations. They were all positive, ranging between 0.16 and 0.88. The median correlation was 0.61. The correlations with the first item (NF_1) were notably lower than the rest.

3.2. Internal Structure

When fitting the factor analysis models, the estimation of the second-order hierarchical model and of the four-factor moving-average model did not converge normally. Instead of the second-order model, we then fitted the first-order model with four correlated factors. Table 3 presents the fit statistics for the three fitted models. We also present the results of the χ2 difference test between the one-factor model and the other two models. The four-factor model and the moving-average model are not nested and cannot be compared by means of the χ2 difference test; however, their fit can still be compared using the information criterion values (AIC and SABIC, respectively).
Both the four-factor model and the moving-average model fitted significantly better than the one-factor model. However, the four-factor model had some serious issues. First, the correlation between the factors Membership and Emotional Connection had to be constrained to prevent its estimate being larger than one. Additionally, the correlations between the factors Influence and Membership and between Influence and Emotional Connection were very high as well (0.91 and 0.97, respectively). Such high correlations imply a low discriminant validity of the four first-order constructs. Finally, the Need Fulfillment factor was almost identical to the values of the item NF_2 (the standardized loadings of its indicators were 0.30 and 0.98). On the other hand, the results for the moving-average model were meaningful; In addition, this was the only model that was not rejected by the χ2 test and had excellent values of all approximate fit indices (RMSEA, CFI, and SRMR, respectively). It was also the best model according to AIC (the difference of 74.8 was much larger than the cutoff of 10 as recommended by [26]) and SABIC. Therefore, we decided to retain the one-factor moving-average model and subsequently treated the latent structure of BSCS as unidimensional.
Table 4 presents the standardized factor loadings for the items and their 95% confidence intervals. Although all loadings are significantly different from zero (that is, none of the confidence intervals includes zero), item NF_1 is the weakest indicator of sense of community. Most of the items, however, have standardized loadings close to or higher than 0.8, indicating a strong relationship with the measured trait.

3.3. Reliability

For the sum score, we computed the values of two internal consistency reliability coefficients (coefficient alpha and Guttman’s λ2) and their respective 95% bootstrap confidence intervals. The results are presented in Table 5. While the values of both coefficients are high (both above 0.90), and the narrow confidence intervals indicate that these estimates are highly accurate, and both coefficients are likely to be inflated due to the non-independence of residuals. Therefore, we also computed McDonald’s omega, which is based on factor loadings and takes the relations between residuals into account. This value shows that about 87% of the sum score variance can be explained by the common factor.

4. Discussion

The first aim of this study was to investigate the dimensionality of the Slovenian adaptation of the Brief Sense of Community Scale. In contrast to the original study by [4] and some recent validation studies [6,7,8,17], we concluded that a unidimensional model with autoregressive effects on unique factors best describes the latent structure of our data. Apart from the less favorable fit indices, the four-factor model and the second-order model, respectively, had issues with non-convergence, inadmissible parameter values (i.e., correlation higher than one), and low discriminant validity of the first-order constructs. The latter issue was reflected in the very high intercorrelations between the first-order factors. The fact that one of the correlations even needed to be constrained in order to not exceed one contributed to the non-convergence of the second-order model, as the estimation algorithm attempted to fit the general factor to a non-positive definite first-order covariance structure.
Our conclusions regarding dimensionality are not so diverging from previous research as it might seem. In fact, all validation studies of BSCS that we have found report strong effects of the general SOC factor. For instance, in the study by the authors of [4], the highest general factor standardized loadings were 0.94 and 0.97. In [8], three out of four general factor loadings were at least 0.97. It is, thus, a common finding that the general factor determines the item responses to a rather high extent. While we acknowledge the merit of the multidimensional approach to SOC when it comes to understanding the aspects of sense of community, the practical value of the scores related to the first-order factors is limited if the measured factors are so highly correlated. In practical measurement situations, the discrimination among the four factors would be additionally blurred by the non-negligible amount of measurement error due to the short scale length (that is, two items per scale).
At this point, we can only speculate about why the four-factor structure did not emerge in the Slovenian sample. Could the reason behind this picture be attributed to the variations in value orientations among the cultures under examination? The Slovenian sample revealed a dominant one-dimensional structure, a common trait in the adaptation for Chinese [16], Korean [27], and Vietnamese [18] samples, who were from collectivist-oriented countries [28,29,30]. Considering this trend, one might expect a similar pattern in Slovakia [12,13], another Slavic language-speaking nation, due to its combination of collectivist values (influenced by socialism) and individualist tendencies [20]. However, in the Slovak adaptation, the individualistic orientation appears to have prevailed over the collectivistic one, as the authors [12,13] discovered a 4-factor structure. This outcome aligns with what is typically observed in the US ([6,7,8]) and Germany [11], the countries we identified as presenting adaptations of the BSCS in individualist cultures in our study. The interpretation of the results in a Japanese study [17], however, remains puzzling. Could it be possible that the value orientations in Japan significantly differ from those in the former socialist countries, yet they still develop a sense of group membership typical of more individualistic nations? This intriguing aspect warrants further research. Understanding how culture impacts sense of community poses a significant challenge that demands additional exploration.
In the second step, we evaluated the score reliability. The total score reliability, as assessed using McDonald’s coefficient omega, was 0.87. This is a very satisfactory value, bearing in mind that the BSCS is primarily intended for research purposes. It is also comparable to values found in other studies that have adapted BSCS for non-English cultures. Although the values of coefficient alpha and Guttman’s λ2 were even higher, they were most likely somewhat inflated by the presence of autoregressive effects on residuals. In contrast, only two out of the four originally proposed subscales had a reliability estimate close to or higher than 0.80, which is generally considered an appropriate reliability for group-level analyses [31]. In fact, the reliability of the scores on the Need Fulfillment and Influence scales was too low for any practical purpose. The low subscale reliability is, thus, another pragmatic argument in favor of the use of BSCS as a unidimensional scale.
This paper has two main contributions. First, it presents a second validation of the BSCS in a Slavic language (after the Slovak adaptation, [12,13]) and provides evidence that the BSCS is a useful measure of sense of community in the Slovenian cultural and linguistic context. Second, it serves as an example of the usefulness of modeling the error structure in item-level factor analyses. We demonstrated that taking autoregressive effects into account may improve model fit and provide more realistic reliability estimates. In our case, the comparison between the coefficients α and λ2, on the one hand, and the coefficient ω, on the other hand, indicates a non-negligible bias in the former coefficients, which is due to the autoregressive effects of measurement error in one item on the measurement error in the successive item.
The main limitation of our study was the use of non-random sampling. We also do not know whether the sample was representative in terms of neighborhood types. It is, therefore, possible that our estimates of some statistical parameters like score means and variances are distorted. However, since the main goal of this study was the assessment of psychometric properties, rather than estimating the distribution of scores, we presume that this limitation should not be detrimental to the main results.
Notwithstanding these limitations, we think that it is useful to study the construct of sense of community in different cultures by examining how models of this construct function in different cultural contexts. It is this insight that opens up possibilities for understanding sense of community as one of the fundamental building blocks of sustainable development. We can conclude that sustainable development cannot be approached in the same way in all cultural contexts but must first be approached locally to anticipate the global positive impacts of sustainable development in the future.
Taken together, the results of the present study provide evidence for the reliability and validity of the scores of the Slovenian-language version of the BSCS, and further support the use of this measure in research related to sense of community, as well as potentially as a rigorous measure in further studies of sustainable development in different cultures.

Author Contributions

Conceptualization, G.S. and D.K.G.; methodology, G.S.; software, G.S.; validation, G.S.; formal analysis, G.S.; investigation, G.S.; resources, G.S. and D.K.G.; data curation, G.S.; writing—original draft preparation, G.S. and D.K.G.; writing—review and editing, G.S. and D.K.G.; visualization, G.S. and D.K.G.; supervision, G.S. and D.K.G.; project administration, G.S. and D.K.G.; funding acquisition, D.K.G. All authors have read and agreed to the published version of the manuscript.

Funding

This research was supported by the Slovenian research agency (grant numbers J5-3112, J7-4599, P5-0110, and P5-0062).

Institutional Review Board Statement

Not applicable.

Informed Consent Statement

Informed consent was obtained from all subjects involved in the study.

Data Availability Statement

The raw data supporting the conclusions of this article will be made available by the authors, without undue reservation.

Conflicts of Interest

The authors declare that this research was conducted in the absence of any commercial or financial relationships that could be construed as a potential conflict of interest.

References

  1. Akbarinejad, T.; Salaj, A.T.; Johansen, A. Implementing the Integrated Social Sustainability Assessment to Norway: A Citizen-Centric and Expert-Weighted Approach. Sustainability 2023, 15, 12107. [Google Scholar] [CrossRef]
  2. Williams, S.M.; Ferrari, J.R. Identification among first-generation citizen students and first-generation college students: An exploration of school sense of community. J. Community Psychol. 2015, 43, 377–387. [Google Scholar] [CrossRef]
  3. Arafat, S.Y.; Chowdhury, H.R.; Qusar, M.S.; Hafez, M.A. Cross cultural adaptation & psychometric validation of research instruments: A methodological review. J. Behav. Health 2016, 5, 129–136. [Google Scholar]
  4. Peterson, N.A.; Speer, P.W.; McMillan, D.W. Validation of a brief sense of community scale: Confirmation of the principal theory of sense of community. J. Community Psychol. 2008, 36, 61–73. [Google Scholar] [CrossRef]
  5. McMillan, D.W.; Chavis, D. Sense of community: A definition and theory. J. Community Psychol. 1986, 14, 6–23. [Google Scholar] [CrossRef]
  6. Opara, I.; Lardier, D.T.; Garcia-Reid, P.; Reid, R.J. Testing the Factor Structure of the Brief Sense of Community Scale among Black Girls and the Relationship with Ethnic Identity, Empowerment and Social Support. Child. Youth Serv. Rev. 2021, 127, 106095. [Google Scholar] [CrossRef]
  7. Lardier, D.T., Jr.; Opara, I.; Cantu, I.; Garcia-Reid, P.; Reid, R.J. The brief sense of community scale: Testing dimensionality and measurement invariance by gender among Hispanic/Latinx youth. J. Community Psychol. 2022, 50, 409–425. [Google Scholar] [CrossRef] [PubMed]
  8. Griffin, J.A.; Eldridge-Smith, E.D.; Kridel, M.M.; Draheim, A.A.; Stepleman, L.M. Validation of the Brief Sense of Community Scale in a lesbian, gay, and bisexual sample. J. Community Psychol. 2022, 50, 576–591. [Google Scholar] [CrossRef]
  9. Lardier, D.T.; Reid, R.J.; Garcia-Ried, P. Validation of the brief sense of community scale among youth of color from an underserved urban community. J. Community Psychol. 2018, 46, 1062–1074. [Google Scholar] [CrossRef]
  10. Chiessi, M.; Cicognani, E.; Sonn, C. Assessing Sense of Community on adolescents: Validating the brief Scale of Sense of Community in Adolescents (SOC-A). J. Community Psychol. 2010, 38, 276–292. [Google Scholar] [CrossRef]
  11. Wombacher, J.T.S.; Bürgi, T.; MacBryde, J. Measuring sense of community in the military: Cross-cultural evidence for the validity of the brief sense of community scale and its underlying theory. J. Community Psychol. 2010, 38, 671–687. [Google Scholar] [CrossRef]
  12. Stračárová, J.; Halamova, J. Community Psychology in Slovakia 2015 [Komunitná Psychológia na Slovensku 2015]; Halamova, J.S., Ed.; Univerzita Komenského v Bratislave: Bratislava, Slovakia, 2015; Chapter 3; p. 25. [Google Scholar]
  13. Halamova, J. Psychological sense of community: Examining McMillan—Chavis’ and Peck’s concepts. Stud. Psychol. 2001, 43, 137–148. [Google Scholar]
  14. Rivera-Segarra, E.; Rivera-Medina, C.L.; Varas-Diaz, N. Validating the factor structure of the brief sense of community scale with a musical community in Puerto Rico. J. Community Psychol. 2016, 44, 111–117. [Google Scholar] [CrossRef]
  15. Buckley, T.K.K.; Burnette, D. A Confirmatory Factor Analysis of the Brief Sense of Community Scale for Spanish-Speaking Older Adults in Puerto Rico. Innov. Aging 2020, 4, 108. [Google Scholar] [CrossRef]
  16. Au, A.; Lai, D.W.; Yip, H.M.; Chan, S.; Lai, S.; Chaudhury, H.; Scharlach, A.; Leeson, G. Sense of community mediating between age-friendly characteristics and life satisfaction of community-dwelling older adults. Front. Psychol. 2020, 11, 86. [Google Scholar] [CrossRef]
  17. Yu, K.-R.; Asai, K.; Hiraizumi, T.; Nakashima, K. Japanese version of the Brief Sense of Community Scale: Construct validity and reliability. BMC Psychol. 2022, 10, 301. [Google Scholar] [CrossRef] [PubMed]
  18. Le, T.H.; Nagakawa, Y.; Kobayashi, Y. Conditions under which rural-to-urban migration enhances social and economic sustainability of home communities: A case study in Vietnam. Sustainability 2021, 13, 15. [Google Scholar] [CrossRef]
  19. Gajda, A.; Oie, M. Between Individualism and Collectivism: Perception and Profiles of Creativity in Poland and Japan. Creativity. Theor. Res. Appl. 2017, 4, 198–217. [Google Scholar] [CrossRef]
  20. Oyserman, D.; Coon, H.M.; Kemmelmeier, M. Rethinking individualism and collectivism: Evaluation of theoretical assumptions and meta-analyses. Psychol. Bull. 2002, 128, 3–72. [Google Scholar] [CrossRef] [PubMed]
  21. Kobal Grum, D. Knowing, Wanting, Feeling [Vem, Hočem, Čutim]; Znanstvena založba, Univerza v Ljubljani: Ljubljana, Slovenia, 2021. [Google Scholar]
  22. Green, S.B.; Hershberger, S.L. Correlated errors in true score models and their effect on coefficient alpha. Struct. Equ. Model. 2000, 7, 251–270. [Google Scholar] [CrossRef]
  23. Stekhoven D., J.; Buehlmann, P. MissForest - non-parametric missing value imputation for mixed-type data. Bioinformatics 2012, 28, 112–118. [Google Scholar] [CrossRef] [PubMed]
  24. Rosseel, Y. lavaan: An R Package for Structural Equation Modeling. J. Stat. Softw. 2012, 48, 1–36. [Google Scholar] [CrossRef]
  25. Hu, L.-T.; Bentler, P.M. Cutoff criteria for fit indexes in covariance structure analysis: Conventional criteria versus new alternatives. Struct. Equ. Model. 1999, 6, 1–55. [Google Scholar] [CrossRef]
  26. Burnham, K.P.; Anderson, D.R. Multimodel inference: Understanding AIC and BIC in model selection. Sociol. Methods Res. 2004, 33, 261–304. [Google Scholar] [CrossRef]
  27. Kim, J.I.; Kono, A.; Yoshiyuki, N.; Kang, J. Korean translation and validation of the Community Commitment Scale for preventing social isolation in older adults. Geriatr. Gerontol. Int. 2018, 18, 806–812. [Google Scholar] [CrossRef] [PubMed]
  28. Hofstede, G. Cultures and Organizations: Software of the Mind; McGraw-Hill: New York, NY, USA, 1991. [Google Scholar]
  29. Hofstede, G.; Hofstede, G.J.; Minkov, M. Cultures and Organizations: Software of the Mind: Intercultural Cooperation and its Importance for Survival; McGraw-Hill: New York, NY, USA, 2010. [Google Scholar]
  30. Triandis, H.C. Individualism and Collectivism; Westview: Boulder, CO, USA, 1995. [Google Scholar]
  31. Nunnally, J.C.; Bernstein, I.H. Psychometric Theory, 3rd ed.; McGraw-Hill: New York, NY, USA, 1994; pp. 264–265. [Google Scholar]
Figure 1. A multidimensional model of neighborhood sense of community (based on [4,5]).
Sustainability 15 15394 g001
Figure 2. Conceptual path diagram for Model 4. Note: Variables are labeled according to their respective subscales: NF = need fulfillment, IN = influence, EC = emotional connection, MB = membership, SOC = sense of community.
Sustainability 15 15394 g002
Figure 3. Percentages of item responses.
Sustainability 15 15394 g003
Table 1. Descriptive statistics of item responses.
Item LabelMMdnSDSkew.Kurtosis
1NF_13.5641.07−0.45−0.33
2IN_12.5431.160.25−0.80
3EC_13.1031.15−0.10−0.69
4MB_13.2531.17−0.21−0.76
5EC_23.2031.15−0.21−0.68
6NF_23.0931.09−0.09−0.51
7IN_23.1631.00−0.20−0.16
8MB_23.5441.05−0.49−0.17
Sum 25.45266.82−0.09−0.46
Note. Min = 1, Max = 5 for all variables. Variables are labeled according to their respective subscales: NF = need fulfillment, IN = influence, EC = emotional connection, MB = membership, Sum = sum score. The item order is the same as in [4].
Table 2. Item inter-correlations.
NF_1IN_1EC_1MB_1EC_2NF_2IN_2
IN_10.30
EC_10.180.58
MB_10.160.530.88
EC_20.180.500.780.82
NF_20.290.490.680.670.69
IN_20.190.480.660.660.680.64
MB_20.170.420.660.660.690.630.60
Note: p < 0.05 for all correlations.
Table 3. Fit statistics and model comparisons for the confirmatory factor analysis models.
Modelχ2dfpRMSEACFISRMRAICSABIC
1F99.020<0.0010.1150.9520.0449599.29615.9
4F63.814<0.0010.1090.9710.0389556.39579.3
4F vs. 1F45.56<0.001
1F-MA22.1130.0540.0420.9960.0239481.59505.5
1F-MA vs. 1F54.07<0.001
Note. 1F = 1-factor model, 4F = 4-factor model, 1F-MA: 1-factor moving-average model; RMSEA = root-mean-square error of approximation; SRMR = standardized root-mean-square residual; AIC = Akaike information criterion; SABIC = Sample-size-adjusted Bayesian information criterion.
Table 4. Standardized factor loadings for the one-factor moving-average model.
95% CI
ItemλLBUB
NF_10.2390.1460.331
NF_20.8110.7590.863
MB_10.8290.7800.878
MB_20.7860.7320.840
IN_10.5740.5060.641
IN_20.7930.7370.849
EC_10.8330.7850.881
EC_20.8620.8170.907
Note. λ = standardized factor loading; CI = confidence interval; LB = lower bound; UB = upper bound.
Table 5. Reliability estimates for the BSCS scores.
ScaleSum ScoreNFECINMB
Coefficientαλ2ωαααα
Value0.9010.9110.8670.4500.8730.6450.790
LB0.8870.8990.8360.3400.8410.5770.736
UB0.9140.9220.8880.5450.8970.7010.832
Disclaimer/Publisher’s Note: The statements, opinions and data contained in all publications are solely those of the individual author(s) and contributor(s) and not of MDPI and/or the editor(s). MDPI and/or the editor(s) disclaim responsibility for any injury to people or property resulting from any ideas, methods, instructions or products referred to in the content.

