Article

A Novel Photovoltaic Panel Cleaning and Cooling Approach through Air Conditioner Condensate Water

by
Ali Hasan Shah
1,
Abdulrahman Alraeesi
2,3,*,
Ahmed Hassan
4 and
Mohammad Shakeel Laghari
1
1
Department of Electrical Engineering, United Arab Emirates University, Al Ain P.O. Box 15551, United Arab Emirates
2
Department of Chemical and Petroleum Engineering, United Arab Emirates University, Al Ain P.O. Box 15551, United Arab Emirates
3
National Water and Energy Research Center, United Arab Emirates University, Al Ain P.O. Box 15551, United Arab Emirates
4
Department of Architectural Engineering, United Arab Emirates University, Al Ain P.O. Box 15551, United Arab Emirates
*
Author to whom correspondence should be addressed.
Sustainability 2023, 15(21), 15431; https://doi.org/10.3390/su152115431
Submission received: 31 July 2023 / Revised: 29 September 2023 / Accepted: 24 October 2023 / Published: 30 October 2023

Abstract

:
The elevated temperature and dust accumulation over the photovoltaic (PV) surface are the main causes of power loss in hot and desert climates. Traditionally, PV cleaning and cooling are addressed separately, and accordingly, solutions have been developed that require extensive energy and/or manpower to cool and clean the PV panels. However, these solutions are less effective due to a lack of synergy in the devised solution, affecting both energy use and the economics of the system. A highly synergic method to cool and clean PV panels in a singular embodiment is developed, involving flowing air conditioning condensate water over the PV front surface. The current article assesses the performance of the proposed system to cool and clean the panels efficiently. The experimental results showed an up to 14% increase in the power output of the PV panels through the proposed condensate water-based cooling and cleaning method.

1. Introduction

The energy produced by the photovoltaic modules is directly proportional to the available radiation to the PV cell passing through the glazed cover and inversely proportional to the panel temperature [1]. The increased radiation increases PV current output while, paradoxically, the increased temperature decreases open circuit voltage, with the magnitude depending upon the type of PV cells [2,3].
Beside loss in power production, the structural stability of a PV panel also deteriorates with increased temperature and dust accumulation over time [4], which warrants frequent cooling and cleaning of the PV panels. The problem aggravates to the extent of PV plant failures in hot and desert climates due to the occurrence of frequent sandstorm spells and prolonged extreme temperatures in summer [5]. The conventional techniques address PV cleaning and PV cooling as separate issues, and accordingly, solutions were developed, thus requiring a tremendous amount of water and/or human resources to clean and cool the panels [6,7]. Pradhan et al. tested flowing water over the PV front surface, which reduced the temperature by 5 °C and increased maximum power and efficiency by 2% [6].
Conventional PV cleaning methods include manual as well as automated cleaning using robotic systems with water or air jets [8]. Both manual and automated cleaning methods can effectively remove dust, dirt, and other debris from PV panels but require heavy investments in equipment and human resources. Alternatively, some emerging systems involving chemical cleaning, electrostatic precipitator cleaning, nano-film-based self-cleaning, and dry cleaning are being investigated but have several technical and economic limitations in their widespread adaptation [9]. Eventually, water-based cleaning will remain the most effective method, although it is less sustainable due to higher water consumption [10]. Novel methods to secure and apply water in an efficient and sustainable manner are being tested, including atmospheric water generation [11]. Several passive and active systems have been developed to collect water from the air, such as fog harvesting, mechanically cooling air to condense it, pressurizing the air, or exposing it to desiccants. Passive means involving hygroscopic materials are low-cost and easy to use, but their water generation capacity is often lower [12,13], making them less reliable for applications demanding large amounts of water, such as PV cleaning. Active systems, in contrast, can produce the desired large amount of water on demand but are highly energy inefficient due to a series of compacted processes, including cooling coils, adsorbent materials, and membrane filtration [14,15]. Electrically powered atmospheric water generation systems (AWG) are relatively simpler and highly effective in producing on-demand water requiring external power sources, but they are expensive at larger scales [16]. The research is underway to improve the efficiency of the systems through the application of nanotechnology [17] to render them feasible at larger scales. As an alternative means of securing water, research is underway to exploit less energy-intensive water recycling systems from air conditioning condensate. A study [18] presents an integrated HVAC system that combines air conditioning and water extraction from air to enhance water sustainability. Preliminary findings show that the system can meet almost half of the water needs of a modern hotel through condensation. A study [19] explores the treatment of condensate water from air conditioning units in hot and humid regions to produce high-quality drinking water. A membrane-based hybrid system effectively reduces contaminants, achieving a recovery rate of over 97%. The study [20] finds that Atmospheric Water Generators (AWGs) perform significantly better during warm seasons than colder ones, with summers showing the highest water production and winters being the least efficient. However, this study acknowledges limitations due to limited data, assumptions, and environmental factors, making accurate short-term predictions challenging. Future work could focus on improving production models, energy consumption models, and analyzing AWG performance in different regions with varying environmental and economic factors. The study [21] investigates condensate water generation from air conditioning systems under different weather and operational conditions. The most influential factors are time, the temperature difference between outdoor and indoor environments, and the humidity difference. This study proposes an empirical equation to estimate condensate water generation and suggests recycling this water to reduce demand from city water supply systems during hot and humid months, alleviating pressure on precious ground and surface water resources. However, this study acknowledges limitations such as limited types of air conditioning systems and the absence of condensate water quality analysis, which can be a focus of future research.
The current article assesses the feasibility of utilizing air conditioning condensate water to cool and clean the PV panels in the extremely hot and desert climates of the UAE. The approach is particularly designed for building integrated PV panels, where both problems of cleaning and cooling exist, in close proximity to the air conditioning system in the built environment. The concurrence of air conditioning in the hot and desert climates of the UAE, coupled with a high relative humidity that produces a tremendous amount of condensate water along with extremely expensive clean water, renders the proposed approach very promising. A simplified mathematical model is used to validate the produced water from the Air Conditioner (A/C), while a machine learning technique to predict the generation of A/C condensate water has been presented in this study as a future approach.

2. Materials and Methods

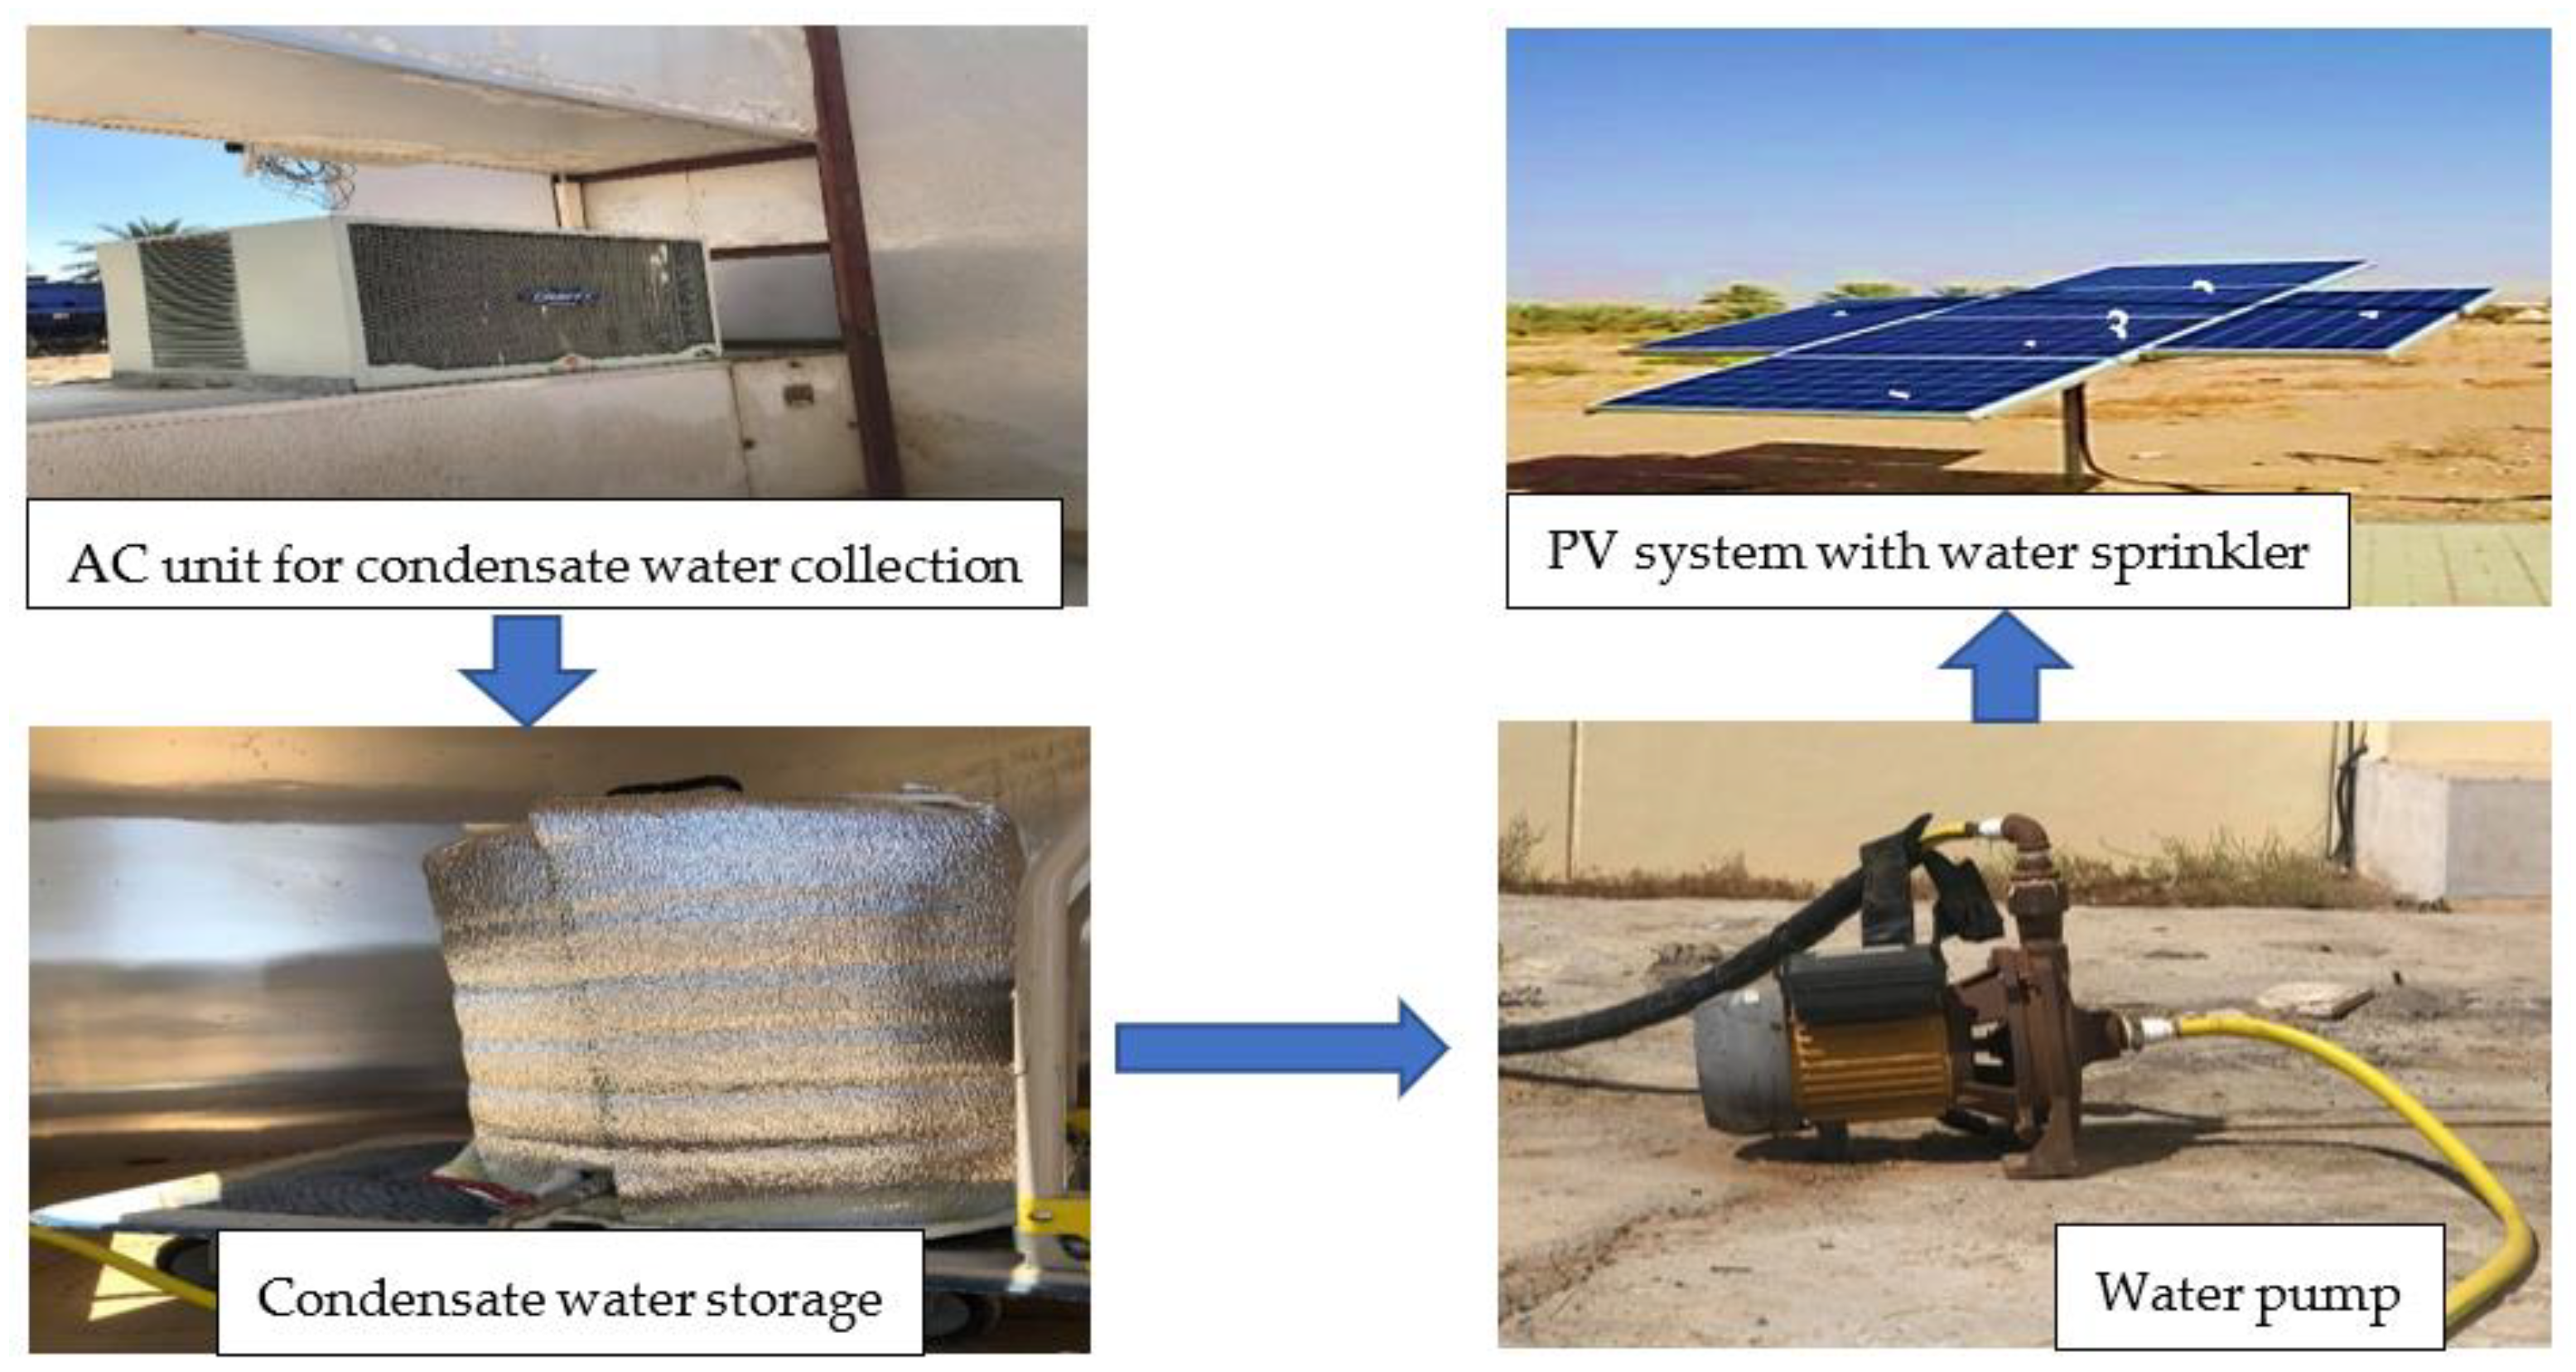
2.1. Methodology and Setup

The experiment has been carried out at the ‘‘Renewable Energy Laboratory’’ of Falaj Hazza Campus, United Arab Emirates University, Al Ain City, United Arab Emirates. The site is situated at a latitude and longitude of 24.9° N-55.5° E, respectively. The campus is located between a residential and an industrial area, surrounded by some date palm trees and a nearby road to simulate air movement and airborne particle deposition typical of UAE residential building settings. The experiment was conducted for three days with consistent PV system configurations, in similar weather, and at constant water flow parameters. The results are presented from a single day because the ambient conditions were almost identical for all three days and yielded nearly matching results. This approach was taken to streamline the presentation and ensure a clear and concise understanding of the data.
The site weather data, including ambient temperature, solar radiation intensity, wind speed, and air humidity, were measured through the “Davis Vantage Pro2” weather station to understand their impact on PV performance. One array containing six monocrystalline photovoltaic modules with dimensions of 99 cm × 165 cm and a rated capacity of 255 W each was installed at the site. The module’s electrical performance was confirmed by measuring open-circuit voltage (Voc) and short-circuit current (Isc) prior to the experiment. The performance of the PV panels was measured through the National Instruments data acquisition system (DAQ) interfaced with LabView software 2014 version 14.0, which recorded the voltage, current, and temperature of the PV panels. An air-conditioned (AC) system with a rated power of 2 kW was installed and kept running for 24 h to produce the condensate water that was stored in an insulated water tank to be used for PV cleaning and cooling. The water storage tank was kept under shade to avoid heat transfer from the ambient temperature and to preserve the cooling of the condensate water. A pump was installed with a system to circulate water from a storage tank to a copper water pipe installed atop the photovoltaic (PV) system to facilitate water flow.
Several equally spaced water jets, measuring 1.5 mm in diameter, were integrated into the copper pipe of 0.65 cm diameter meant to carry and flow the water stream over PV panels. The pipe was mounted on top of the PV frame to assure uniform water flow through water jets under low pressure. The cooled water was released gently from equally spaced water jets over the PV panel’s front surface to create a laminar water layer intended to cool and clean the panel. The flowing water under gravity from the leading edge to the trailing edge of the PV panel helped sweep away the dust along with cooling the PV panel, as shown in Figure 1.

2.2. Experimental Design

The experiment was designed with the following objectives:
To determine the appropriate time to flow water in a single run on one panel for effective cleaning.
To determine the time required for one cooling run to ensure keeping the temperature below the reference temperature.
To evaluate the effectiveness of cooling and cleaning one panel compared to cooling four panels (to represent array design) while flowing the same amount of water over panels.
To assess the added benefit from the proposed configuration of cooling and cleaning setups compared to cleaning only.
In order to achieve the above-stated objectives, two configurations were tested involving six PV panels, as shown in Figure 1.

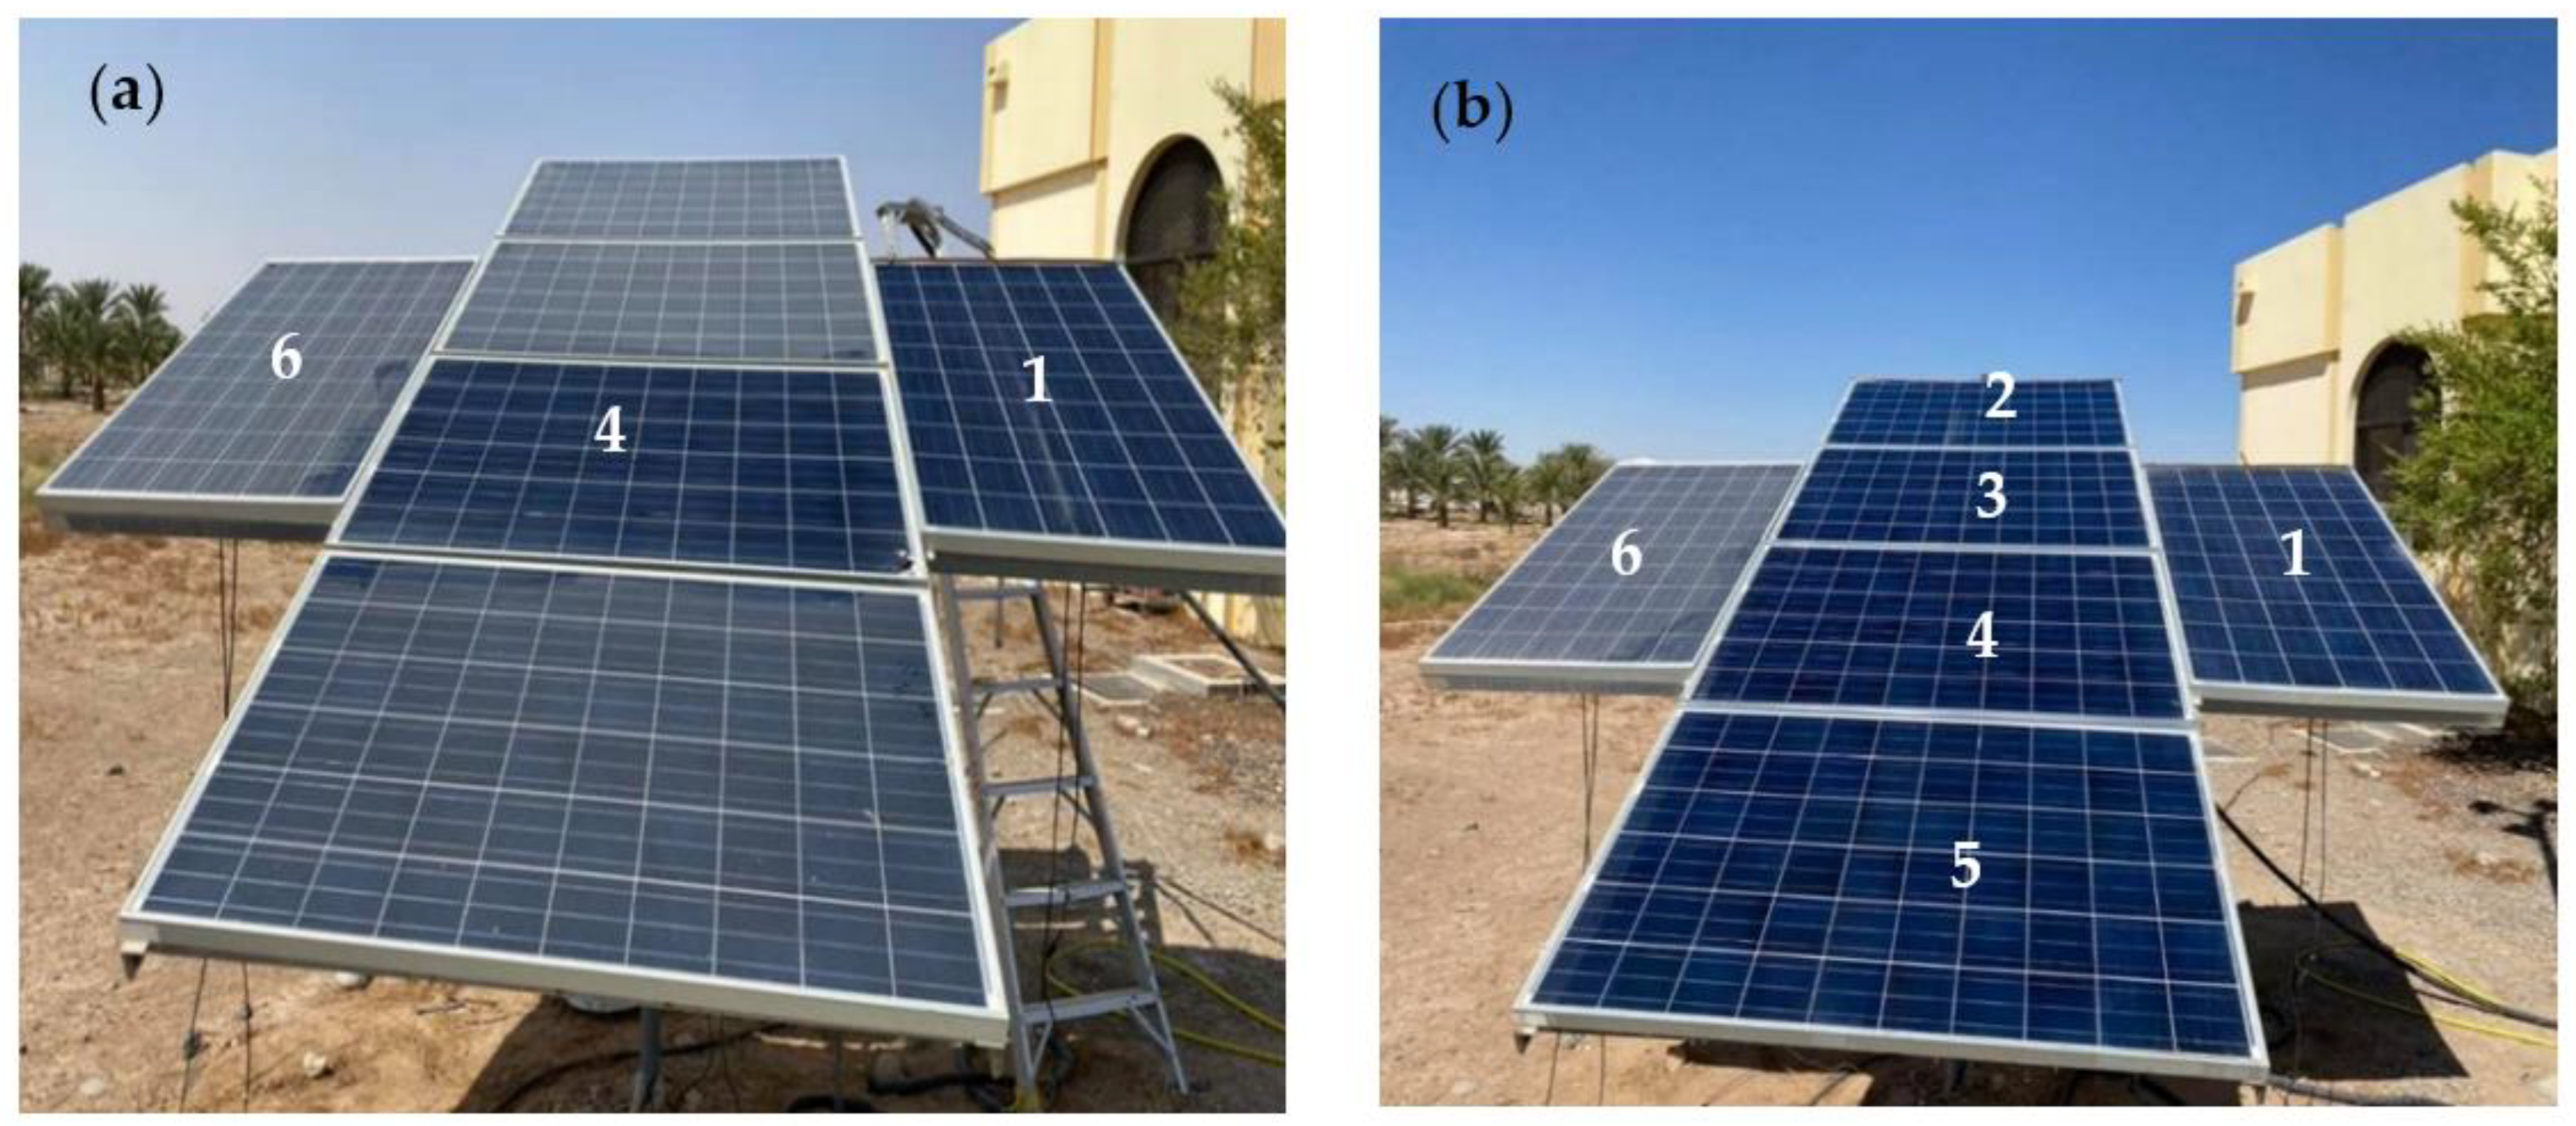
2.2.1. Configuration 1 (Single Panel Cooling and Cleaning)

In this particular setup, three panels underwent testing, as shown in Figure 2a. Panel 6 was kept uncleaned and uncooled as a reference; Panel 4 was cleaned with a microfiber cloth wiper representing traditional household cleaning but not cooled; and Panel 1 was cooled and cleaned with condensate water flown over its front surface.
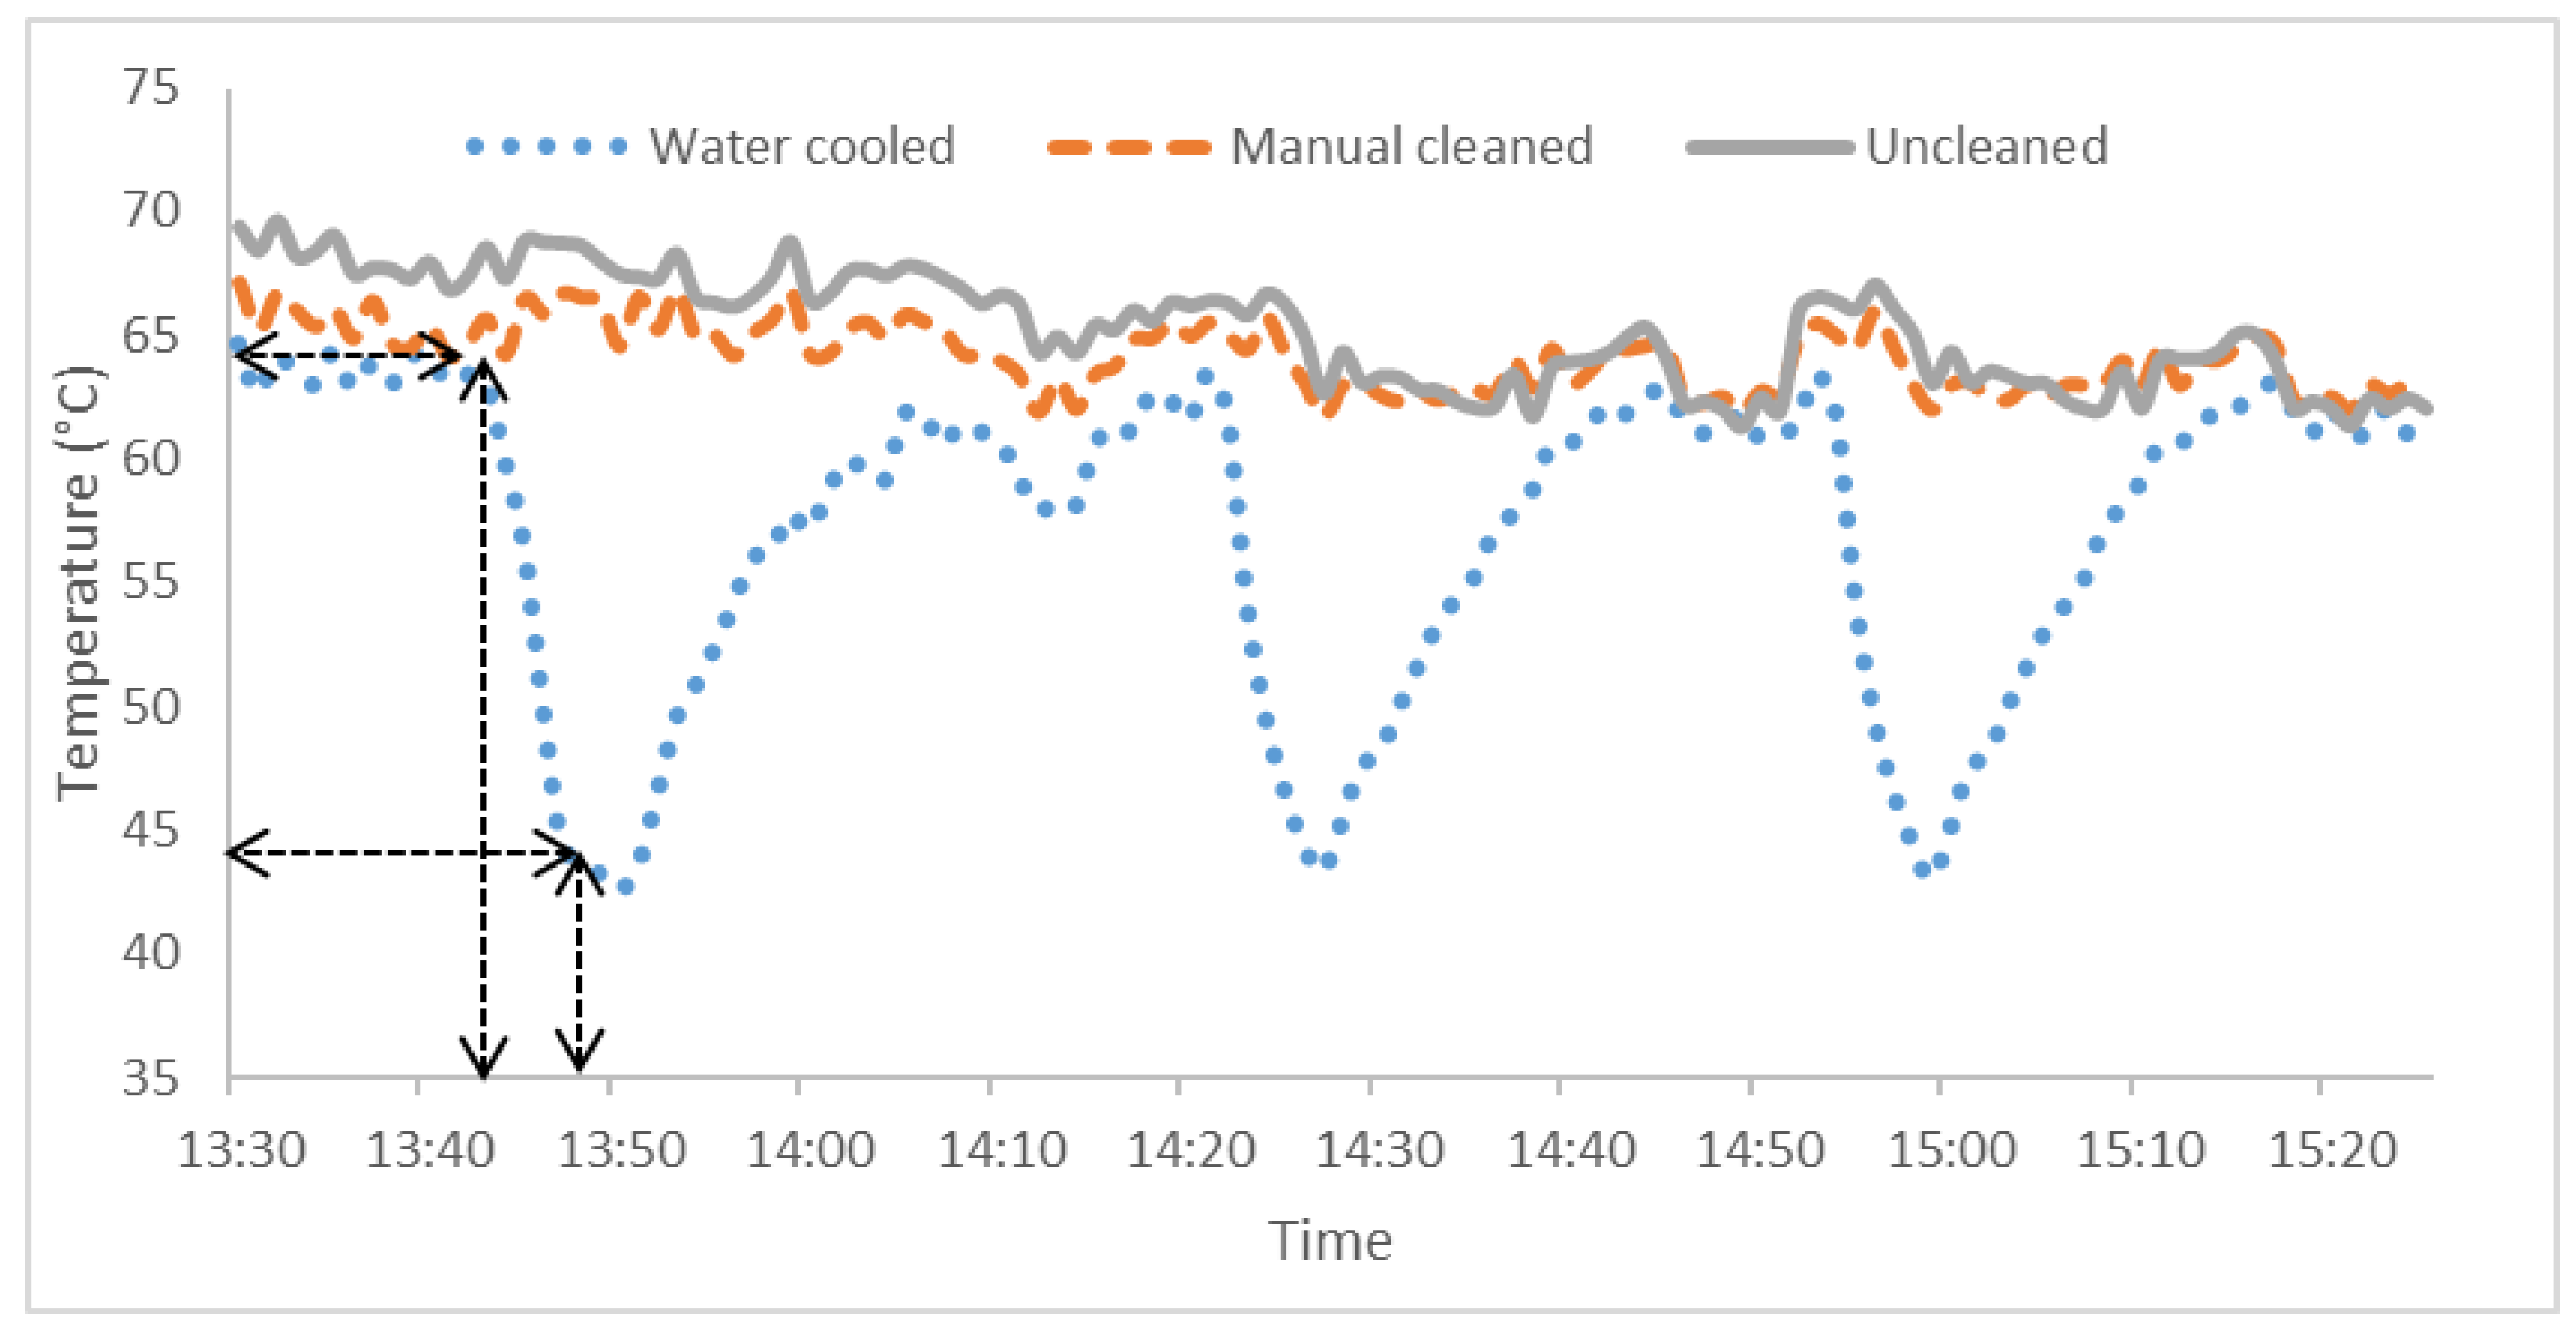
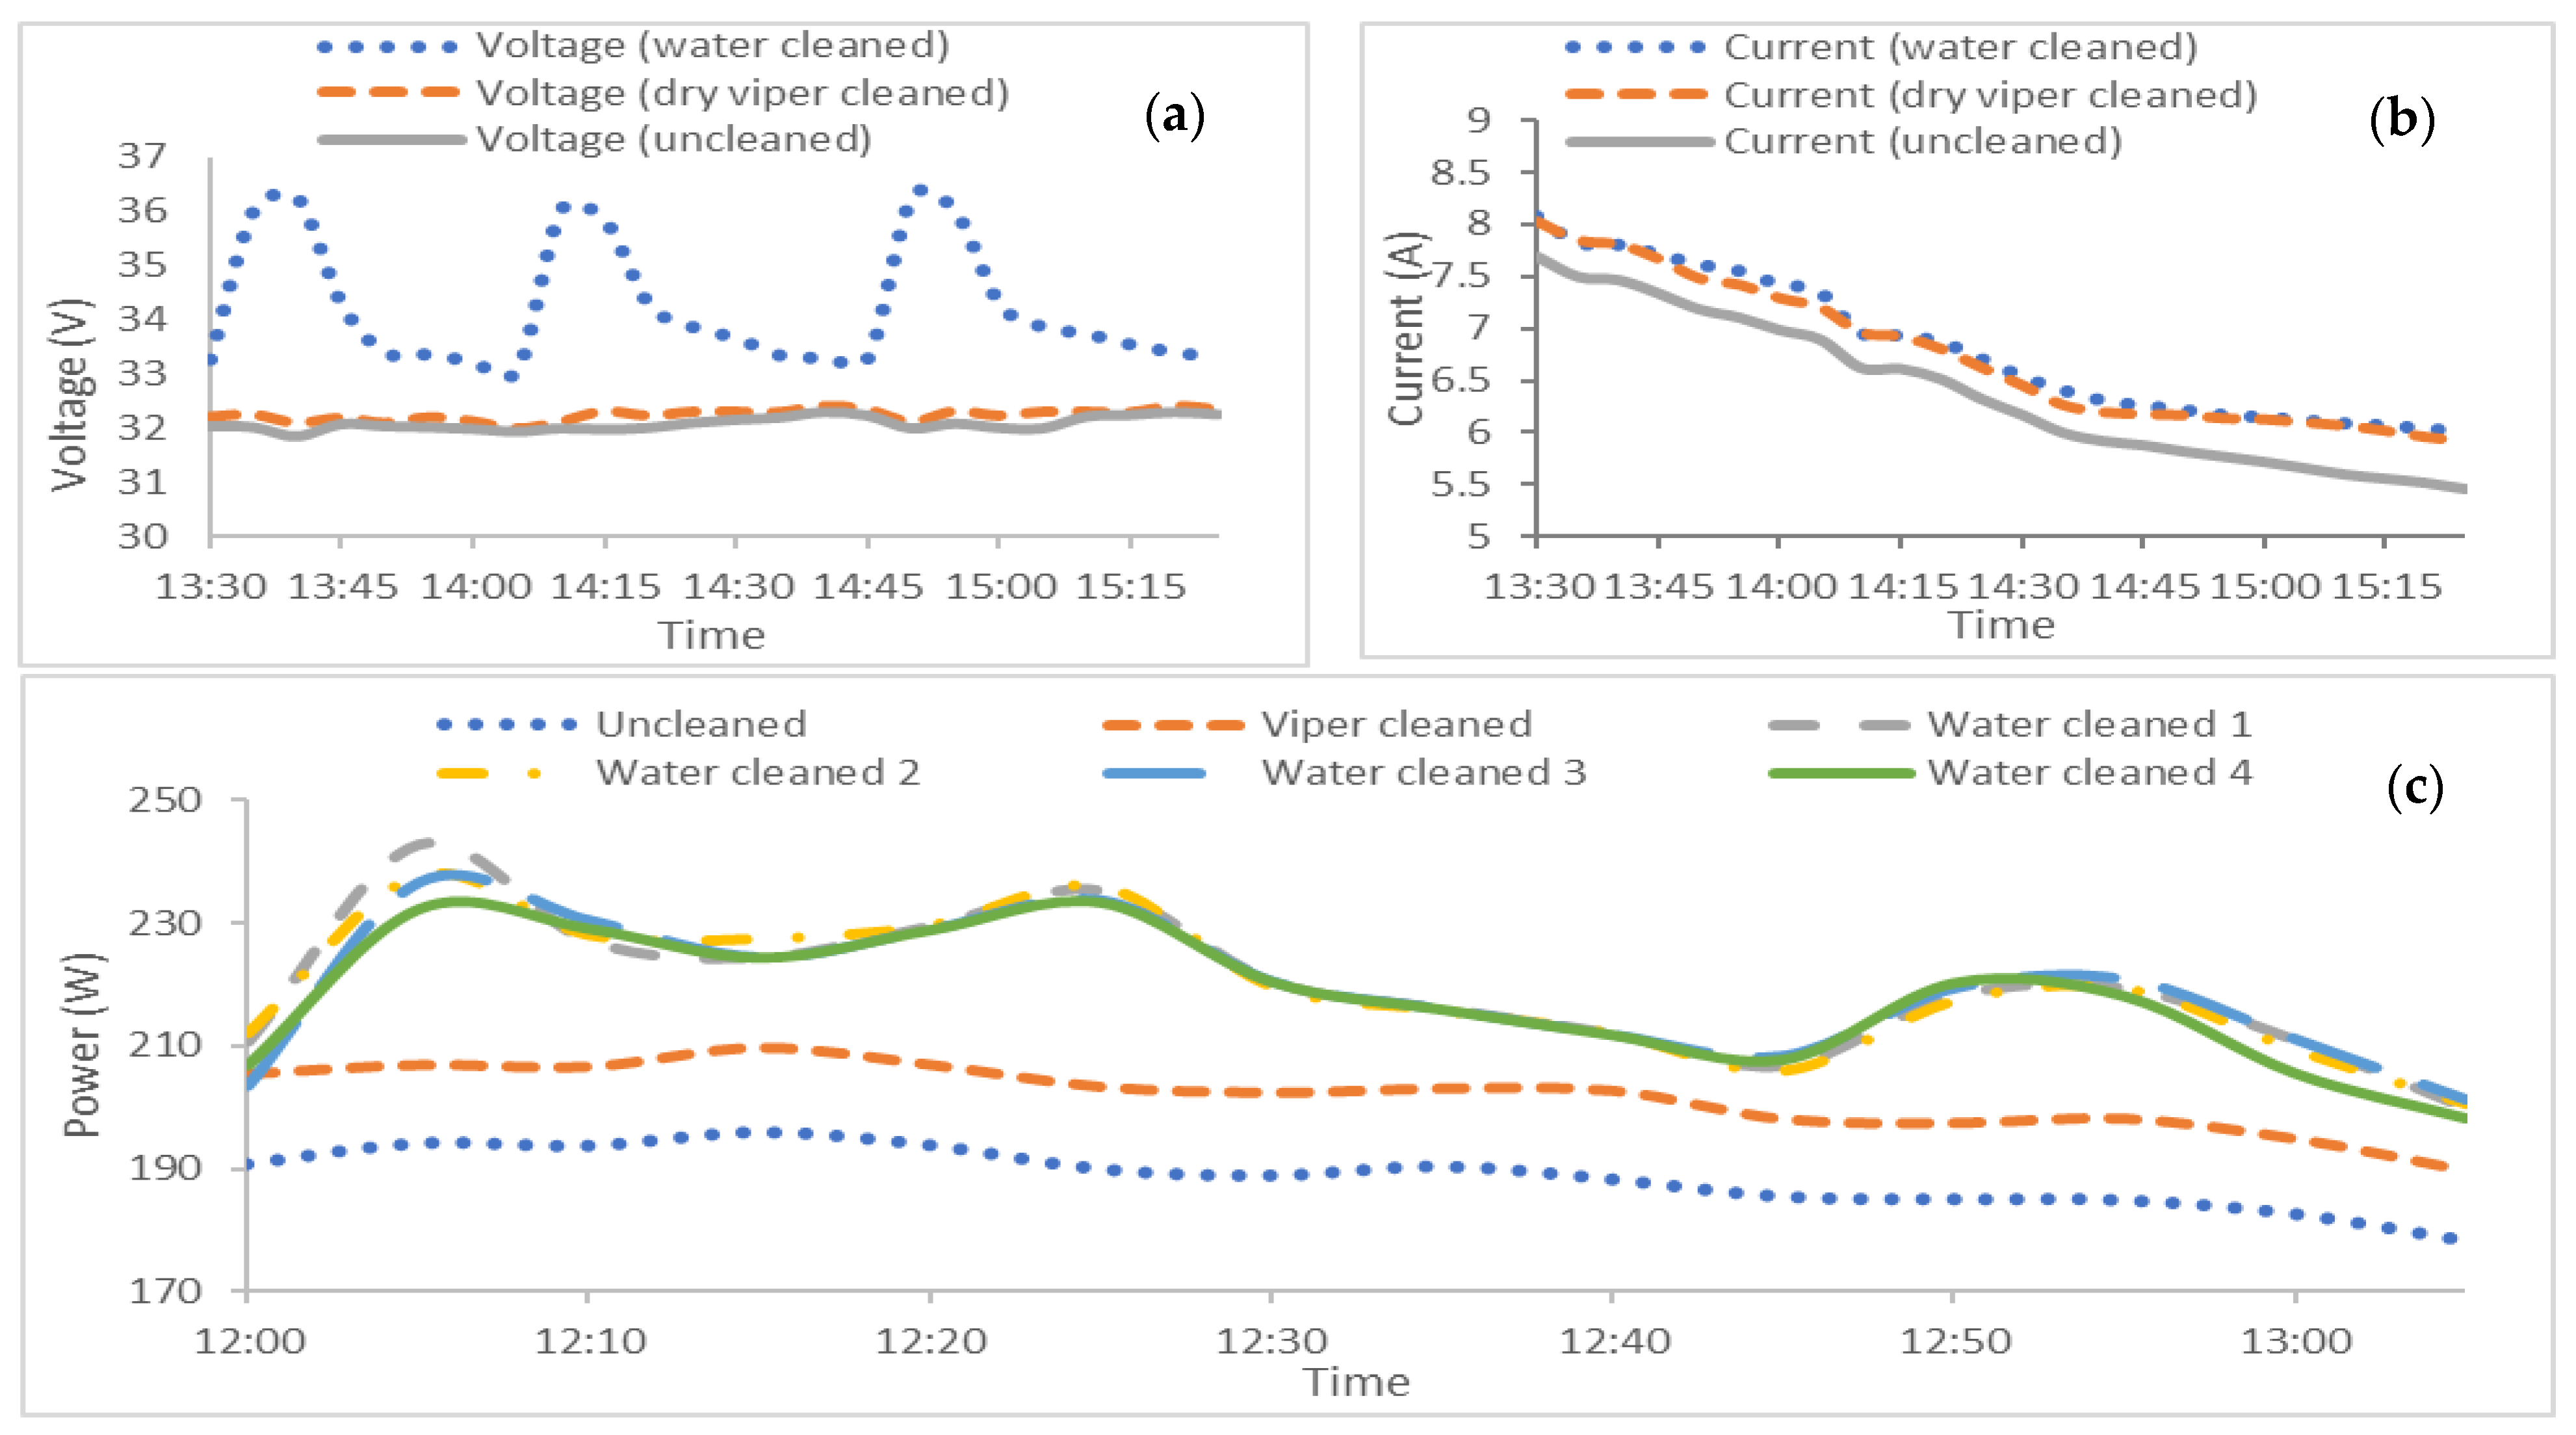
In the first run, water was flown over panel 1’s front surface for five minutes to cool and clean the panel. The temperature as well as the electrical performance were recorded during water flow and afterwards until the cooled panel got back to (or was near) the original steady-state temperature before cooling. This measure provided the minimum temperature achieved by the panel when cooled with water and the duration for which the cooled panel got back to the initial temperature after stopping the flow.
In the second experimental run, the water flow duration was reduced to one minute in order to compare the cleaning achieved in the 1 min run to that in the 5 min run, as represented by the panel’s electrical performance. The objective was to determine whether comparable panels’ performance could be maintained while reducing water consumption by a factor of five by reducing the flow duration while keeping the constant flow rate.

2.2.2. Configuration 2 (4 PV Panels Array Cooling and Cleaning)

In Configuration 2, all six panels depicted in Figure 2b were subjected to testing. Panel 6 was kept uncooled and uncleaned to serve as a reference; Panel 1 was dry cleaned without cooling using a microfiber cloth wiper; and Panels 2, 3, 4, and 5 were cooled and cleaned with condensate water. This configuration aimed to compare the cleaning and cooling of four panels and the cleaning and cooling of one panel while utilizing the same quantity of water in both cases.
Water was flushed over the four PV panels for one minute and stopped. The temperature and electrical performance, measured by open circuit voltage and short circuit current, of these panels were recorded to quantify the cooling and cleaning achieved by the proposed system.

2.3. Air Conditioner Condensate Water Prediction

To create a mathematical model for predicting air conditioner water generation, there is an immense need to understand the underlying principles and variables involved. Ambient temperature and relative humidity are the two most important parameters influencing water generation in an air conditioner. Here is a simple mathematical model that takes these parameters into account:
W = k × T T d × A
Let us denote:
  • W: The rate of water generation is in liters per hour.
  • k: The coefficient represents the efficiency and cooling capacity of the air conditioner.
  • T: The ambient temperature is measured in degrees Celsius.
  • Td: Dew point temperature in Degree Celsius.
  • A: Surface area of the air conditioner’s evaporator coil in meters squared.
Assumptions:
  • A constant cooling capacity and efficiency for the air conditioner.
  • Neglect other factors, such as the air conditioner’s insulation and specific design.
The “k” coefficient, representing the efficiency and cooling capacity of the air conditioner, can be calculated using the equation:
k = C o o l i n g   c a p a c i t y S e a s o n a l   e n e r g y   e f f i c i e n c y   r a t i o = C C S E E R
The formula for calculating the dew point temperature, known as the Magnus-Tetens formula [22], is presented below:
T d = 237.3 × 17.27 × T 237.3 + T + l n ( R H ) 17.27 17.27 × T 237.3 + T + l n ( R H )
where RH represents the relative humidity expressed as a decimal value (for example, 0.85 for 85% humidity).
The above formula considers the temperature, relative humidity, and dew point temperature relationships. It computes the dew point temperature using the Magnus-Tetens approach, which is frequently used for calculating atmospheric moisture.
Experiments or measurements employing a specific air conditioning system might be considered to determine the value of k. Alternatively, study the manufacturer’s system specifications or review current data or research studies relating to your air conditioner model. The value of k is not a universal constant and will vary depending on the air conditioning system.
The proportional relationship between the rate of water generation and the temperature difference is a simplification designed to convey the overall tendency that as the temperature difference increases, so does the possibility for condensation and water creation. This assumption is based on the fact that the dew point temperature reflects the temperature at which air gets saturated, and condensation happens when the ambient temperature falls below the dew point temperature.
A more complex link between the variables may exist, but a simplified model has been introduced in this study to validate the water generation. Experimentation or data analysis would also be required to determine the coefficient k and the surface area A for a particular air conditioning system.
The above model is based on the concept of steady-state operation. Additional considerations may be needed in a comprehensive model for transient effects and other factors, including airflow, system design, and maintenance practices that affect water generation.

3. Results

The experiment was conducted for three days with consistent PV system configurations, in similar weather, and at constant water flow parameters. The experiment maintained consistent PV system configurations, similar weather conditions, and constant water flow parameters over a three-day period. However, we chose to present the results from a single day since the ambient conditions remained nearly identical across all three days, leading to nearly identical outcomes. This decision was made to simplify the presentation and facilitate a clear and concise comprehension of the data. The air conditioning produced 20 L of condensed water in a day with an average temperature of 20 °C, which was stored in the insulated tank.

3.1. Configuration 1

As indicated in Figure 3, after the first flushing of water for 5 min, the Panel 1 temperature dropped by 22 °C (from 64 °C to 42 °C), indicating the lowest possible temperature at this flow rate. Once the water flushing stopped, the panel temperature started to rise again, and in approximately 25 min, it got back to the initial high temperature of 64 °C. In the subsequent two runs, based on learning from the previous run, water was flushed for only 1 min, i.e., less water was used. After stopping the water flush, the temperature of Panel 1 started to rise again and reached back to the initial temperature after only 20 min, i.e., faster, mainly due to changes in the radiation intensity and the ambient temperature around the panel throughout the day. It indicates that the time taken by the PV panel to reach the initial hot side temperature varies with the ambient conditions. Since the ambient temperature and radiation intensity keep changing all day and across different days, an automation setup would be required to trigger water release to cool and clean the panel once it reaches a set hot side temperature.
Figure 4a–c shows the short circuit current, open circuit voltage, and electrical power for uncooled and uncleaned reference, traditional wiper-cleaned, and proposed water-cooled and cleaned PV panels in configuration 1. The power produced is calculated from the open-circuit voltage and short-circuit current multiplied by a temperature-dependent fill factor. The temperature-dependent FF is calculated by subtracting the drop in FF due to temperature from the reference FF of 0.75 taken at standard test conditions (STC) from the PV panel catalog FF. The drop in FF was calculated by multiplying the temperature-based FF drop coefficient of 0.0013/°C [23] by the rise in temperature beyond the STC panel temperature of 25 °C. Before flowing water over Panel 1, the voltage and current for all three panels were almost the same, with a minimal difference since the panels were equally uncleaned. Figure 4a shows that the current was slightly improved in both the dry-clean and water-clean PV panels (Panel 4 and Panel 1). Since the short-circuit current is in direct relation to the solar radiation intensity passing through the glazed layer to the cell, which represents panel clarity, it indicates that both dry-cleaned and water-cleaned panels were equally clear, proving the efficacy of the proposed water-cleaning method. In addition, it indicates that the presence of a water layer over the panel glazing had no negative impact on the radiation transmission to the cell.
On the other hand, Figure 4b shows that both the reference dusty panel and dry clean panel produced a consistently lower voltage compared to water-cleaned panels, with a peak difference of 4.4 V. Since the voltage is a direct function of panel temperature, it can be concluded that, besides cleaning, the condensate water layer significantly cooled the panel.
Figure 4c shows the Power-Curve of the three panels. It can be seen that the water-cooled and cleaned panel produced the highest power, followed by the dry-clean panel, while the reference uncleaned panel produced the lowest power. Statistically, the cooled and cleaned panel produced 8.13% higher power than the cleaned-only panel and 13.7% higher than the uncleaned panel.

3.2. Configuration 2

Figure 5 shows the temperature profile of the panels for configuration 2. The temperature trend shows that after water flushing, the peak temperature of panels 2, 3, 4, and 5 decreased from 71 ± 1 to 42 ± 2, a peak drop of 30 °C. Slight variations across the different panel temperatures are noticed, which can be attributed to the time delay in the flow from the top to the bottom panel. After stopping the water flush, the temperature started to rise again and reached back to the initial-highest value in almost 30 min, with slight variation in this behavior across the four panels due to different start point temperatures. For all the remaining runs, the same trend was observed with minimal variations (see Figure 5). For the whole duration of the experiments in all runs (during flow and without flow), the water-cleaned and cooled panels maintained, on average, a temperature 12 °C lower compared to dry cleaning and uncleaned panels.
The short-circuit current, open-circuit voltage, and power produced for water-cleaned, wiper-cleaned, and uncleaned PV panels in the second configuration are shown in Figure 6, Figure 7 and Figure 8, respectively. Before flushing water, the voltages and currents for all these panels were almost the same, with minimal difference. After flushing water, the water cooled and cleaned the panel and maintained a consistently higher voltage with a peak difference of 3.7 V and 3.3 V compared to the uncleaned and wiper-cleaned panels, respectively (see Figure 7). The current in wiper-cleaned PV panels also improved by 6.5% when compared to the uncleaned panel, as indicated in Figure 6. The water-cleaned panels produced, on average, 8% more power than the dry-cleaned panels and 14% more power compared to the uncleaned panels (refer to Figure 8).

3.3. Prediction of Generated A/C Condensate Water

The model was used to predict the volume of water from the air conditioner system under local conditions, as illustrated in Figure 9.
The dewpoint temperature was determined using Equation (1), the k coefficient using Equation (2), and the water generation was forecasted using Equation (3). The surface area “A” of the 1 ton air conditioner’s evaporator coils, used in Equation (1) to calculate the water generation, is around 0.41 m2.
The results indicate that the peak water generation of 2.24 L occurred at noontime (12:00 p.m.), when the ambient temperature was at its highest and the dewpoint temperature was at its lowest. If the system operates continuously throughout the day, it is projected to produce approximately 30 L of water.

4. Discussion

As previously discussed, the air conditioner unit with a power rating of 3.5 kW and installed in the experimental setup has produced 2 L of condensed water in 1 h operation at UAE climate conditions. A typical 3 BHK (bedroom, hall, and kitchen) house utilizes an 18 W air conditioning system and is hence capable of collectively producing 150 L of condensed water per day (i.e., in 15 h). The initial studies and results indicated that the sprinklers consumed approximately 20 L of water to cool and clean the 1 kW PV array for 2 peak hours. In comparison, the 150 L of water generated by an 18 kW air conditioning system can cool and clean a 7–8 kW PV array. Based on the earlier findings of the experiments, it is expected that by applying the most optimized flow rates, achieving a critically thin water layer over PV panels, and triggering the right time of flow, the water consumption can be dropped to one-half when compared to the reported results. By achieving this target, the house producing 150 L of water on average can independently keep a 15–18 kW PV array cooled and cleaned daily during the 2 peak hours without additional water and labor demand, which is a significant step to achieve water and energy efficient integration in a sustainable system. The current preliminary results represent the way forward pillar to achieve the stated objective with more in-depth research on the following key challenges: (i) optimizing the water flow time by water release automation; (ii) optimizing the thickness of the water layer by optimizing the water jet orifice size.
The generation prediction of condensate water from air conditioning systems using the mathematical model for a peak hour is 2.24 L, which is close to the experimental value. The water generation from air conditioners can also be accurately predicted through the utilization of machine learning techniques. The subsequent content presents a comprehensive framework for a machine learning (ML) model designed to forecast the generation of water by air conditioners. It is important to note that the specific implementation of this model may differ based on the unique characteristics and requirements of the particular system. The following is a proposed general approach [24,25] that can be taken into consideration:
  • Data acquisition: Proceed with the acquisition of relevant information from the air conditioning system. This includes the collection of various inputs, such as ambient temperature, humidity levels, and cooling capacity, alongside the corresponding measurements of water generation.
  • Preprocess the data: The second step in the research process involves the preprocessing of the data. This includes the rigorous cleaning and preprocessing of the data set to eliminate any potential outliers or missing values that may adversely impact the accuracy and reliability of the subsequent analyses. To ensure consistency and comparability among the numerical features, it may be necessary to normalize them to a common scale.
  • Feature engineering: The relevant characteristics within the data set that could potentially impact water generation shall be identified and extracted. The dew point temperature, also known as the temperature of saturation, refers to the specific temperature at which the air becomes fully saturated with water vapor, leading to the onset of condensation.
  • Split the data: The data set should be divided into two distinct subsets, namely a training set and a test set. The training set will be utilized for the purpose of training the model, whereas the test set will be employed to assess and evaluate the performance of the model.
  • Select a regression model: To accurately capture the relationship between the input features and the target variable, it is important to select an appropriate regression model. Linear regression, decision trees, and random forests are widely employed methodologies for addressing prediction tasks of this kind.
  • Train the model: The chosen regression model should be applied to the training data in order to assess its performance and predictive capabilities. The proposed model aims to acquire the ability to establish a functional relationship between the input features and the target variable.
  • Evaluate the model: The evaluation of the trained model’s performance can be conducted using the test set. In order to assess the accuracy of predictions, it is common practice to employ metrics such as mean squared error (MSE) or root mean squared error (RMSE). These metrics provide quantitative measures that allow researchers to evaluate the quality of predictions made by a given model. By calculating the MSE or RMSE, one can gain insights into the average squared difference between predicted values and actual values. This information aids in determining the level of accuracy achieved by the predictive model under consideration.
  • Fine-tune the model: In case the performance of the model does not meet expectations, researchers may explore alternative models, fine-tune hyperparameters, or consider including additional features as possible approaches to enhance the accuracy of predictions.
  • Predict water generation: Upon successfully training and validating a model, it becomes feasible to employ an addressed model for the purpose of predicting water generation based on novel input data. To estimate water generation, the model requires input features such as ambient temperature, humidity levels, and other relevant factors.
It is important to clarify that flow rate optimization requires quite extensive and detailed studies involving orifice size, orifice geometry, pumping arrangement, water release mechanisms, PV panel surface structure, PV panel integration schemes, environmental conditions (i.e., humidity and wind conditions around the panel), and nature of dust, to say the least. Since the current study is proposing a concept with validated performance data, the optimization study will be the way forward scope of the project.
Furthermore, the above discussion provides a comprehensive summary, while the specific details of its execution may differ based upon particular requirements and the characteristics of the data. To optimize the results, it is important to engage in a process of experimentation and iteration within the model.

5. Conclusions

The temperature elevation of the Photovoltaic panels and the dust accumulation at their surfaces are the main causes of the overall power output drop. The conventional techniques address PV cleaning and PV cooling as separate issues, and accordingly, existing solutions are developed. The traditional solution seems to work less effectively due to a lack of synergy in both economic and energy terms. A combined approach is proposed in the current research, in which both cleaning and cooling issues are integrated into one solution or in a single setup to solve the problem more effectively and make it economically more feasible. Two configurations were tested to evaluate the cleaning and cooling effects on the output power of PV panels where the cooled water is obtained from the air conditioning condensate. Under the climatic conditions of the UAE, the air conditioning unit, which has a power rating of 3.5 kW, generated 2 L of condensed water during one hour of operation. The findings demonstrate that the proposed combined approach results in a significant improvement in power output compared to traditional cleaning methods. In Configuration 1, a notable enhancement in maximum power output was observed for the cooled and cleaned panel when compared to both the fiber-cleaned and the dusty PV panels. Specifically, the maximum power improvement was observed to be 8.13% and 13.7% for the cooled and cleaned panels, respectively, in comparison to the fiber-cleaned and dusty PV panels. In the second configuration, the maximum power output was observed to increase by 14% for water-cooled and cleaned PV panels as compared to the dusty panel and by 8% as compared to fiber-cleaned PV panels. These findings suggest that the application of water over the PV front surface not only cleans the panel but also reduces its temperature, in contrast to the use of microfiber cleaning methods. Therefore, it can be inferred that the utilization of water as a cleaning agent for PV panels, even for a brief duration, can have a dual effect of enhancing the panel’s power output and reducing its operating temperature.

Author Contributions

A.H.S.: data curation and validation, formal analysis, investigation, writing review, and editing. A.A.: funding acquisition, project administration, data analysis and results interpretation and validation, and writing review and editing. A.H.: conceptualization, methodology, and writing review and editing. M.S.L.: Writing review and editing. All authors have read and agreed to the published version of the manuscript.

Funding

This research was funded by the National Water and Energy Research Center (NWERC) at the United Arab Emirates University (UAEU). Grant # 12R161.

Institutional Review Board Statement

Not applicable.

Informed Consent Statement

Not applicable.

Data Availability Statement

Not applicable.

Acknowledgments

The authors would like to thank the United Arab Emirates University and the National Water and Energy Research Center for the facilities and the administrative support to execute the project and conduct the experiments.

Conflicts of Interest

The authors declare no conflict of interest.

Abbreviations

AArea
AWGAtmospheric water generation
BHKBedroom, hall kitchen
CCCooling capacity
DAQData acquisition system
HWACHeating ventilation air conditioning
IscShort circuit current
kThe coefficient represents the efficiency and cooling capacity of an air conditioner
MLMachine Learning
MSEMean square error
PPower
PVPhotovoltaic
RHRelative humidity
RMSERoute mean square error
TThe ambient temperature in Degrees Celsius
TdDew point temperature in Degree Celsius
VocOpen circuit voltage
WWater
A/CAir Conditioner

References

  1. Skoplaki, E.; Palyvos, J.A. On the temperature dependence of photovoltaic module electrical performance: A review of efficiency/power correlations. Sol. Energy 2009, 83, 614–624. [Google Scholar] [CrossRef]
  2. Radziemska, E. The effect of temperature on the power drop in crystalline silicon solar cells. Renew. Energy 2003, 28, 1–12. [Google Scholar] [CrossRef]
  3. Moharram, K.A.; Abd-Elhady, M.S.; Kandil, H.A.; El-Sherif, H. Enhancing the performance of photovoltaic panels by water cooling. Ain Shams Eng. J. 2013, 4, 869–877. [Google Scholar] [CrossRef]
  4. Liu, X.; Yue, S.; Lu, L.; Li, J. Investigation of the dust scaling behaviour on solar photovoltaic panels. J. Clean. Prod. 2021, 295, 126391. [Google Scholar] [CrossRef]
  5. Shenouda, R.; Abd-Elhady, M.S.; Kandil, H.A. A review of dust accumulation on PV panels in the MENA and the Far East regions. J. Eng. Appl. Sci. 2022, 69, 8. [Google Scholar] [CrossRef]
  6. Pradhan, A.; Parashar, S.K.S.; Ali, S.M.; Paikray, P. Water cooling method to improve efficiency of photovoltaic module. In Proceedings of the 2016 International Conference on Signal Processing, Communication, Power and Embedded System (SCOPES), Paralakhemundi, India, 3–5 October 2016; IEEE: Piscataway, NJ, USA, 2016; pp. 1044–1047. [Google Scholar]
  7. Younis, A.; Onsa, M. A brief summary of cleaning operations and their effect on the photovoltaic performance in Africa and the Middle East. Energy Rep. 2022, 8, 2334–2347. [Google Scholar] [CrossRef]
  8. AlMallahi, M.N.; El Haj Assad, M.; AlShihabi, S.; Alayi, R. Multi-criteria decision-making approach for the selection of cleaning method of solar PV panels in United Arab Emirates based on sustainability perspective. Int. J. Low-Carbon Technol. 2022, 17, 380–393. [Google Scholar] [CrossRef]
  9. Salamah, T.; Ramahi, A.; Alamara, K.; Juaidi, A.; Abdallah, R.; Abdelkareem, M.A.; Amer, E.-C.; Olabi, A.G. Effect of dust and methods of cleaning on the performance of solar PV module for different climate regions: Comprehensive review. Sci. Total Environ. 2022, 827, 154050. [Google Scholar] [CrossRef]
  10. Zhou, X.; Lu, H.; Zhao, F.; Yu, G. Atmospheric water harvesting: A review of material and structural designs. ACS Mater. Lett. 2020, 2, 671–684. [Google Scholar] [CrossRef]
  11. Chen, K.; Tao, Y.; Shi, W. Recent Advances in Water Harvesting: A Review of Materials, Devices and Applications. Sustainability 2022, 14, 6244. [Google Scholar] [CrossRef]
  12. Ahmad, F.F.; Ghenai, C.; Al Bardan, M.; Bourgon, M.; Shanableh, A. Performance analysis of atmospheric water generator under hot and humid climate conditions: Drinkable water production and system energy consumption. Case Stud. Chem. Environ. Eng. 2022, 6, 100270. [Google Scholar] [CrossRef]
  13. Meng, Y.; Dang, Y.; Suib, S.L. Materials and devices for atmospheric water harvesting. Cell Rep. Phys. Sci. 2022, 3, 100976. [Google Scholar] [CrossRef]
  14. Liu, X.; Beysens, D.; Bourouina, T. Water harvesting from air: Current passive approaches and outlook. ACS Mater. Lett. 2022, 4, 1003–1024. [Google Scholar] [CrossRef]
  15. Inbar, O.; Gozlan, I.; Ratner, S.; Aviv, Y.; Sirota, R.; Avisar, D. Producing safe drinking water using an atmospheric water generator (AWG) in an urban environment. Water 2020, 12, 2940. [Google Scholar] [CrossRef]
  16. Mendoza-Escamilla, J.A.; Hernandez-Rangel, F.J.; Cruz-Alcántar, P.; Saavedra-Leos, M.Z.; Morales-Morales, J.; Figueroa-Diaz, R.A.; Valencia-Castillo, C.M.; Martinez-Lopez, F.J. A feasibility study on the use of an atmospheric water generator (AWG) for the harvesting of fresh water in a semi-arid region affected by mining pollution. Appl. Sci. 2019, 9, 3278. [Google Scholar] [CrossRef]
  17. Feng, A.; Akther, N.; Duan, X.; Peng, S.; Onggowarsito, C.; Mao, S.; Fu, Q.; Kolev, S.D. Recent Development of Atmospheric Water Harvesting Materials: A Review. ACS Mater. Au 2022, 2, 576–595. [Google Scholar] [CrossRef]
  18. Magrini, A.; Cattani, L.; Cartesegna, M.; Magnani, L. Water production from air conditioning systems: Some evaluations about a sustainable use of resources. Sustainability 2017, 9, 1309. [Google Scholar] [CrossRef]
  19. Hosseinkhani, O.; Kargari, A. Production of high-quality drinking water from chillers and air conditioning units’ condensates using UV/GAC/MF/NF hybrid system. J. Clean. Prod. 2022, 368, 133177. [Google Scholar] [CrossRef]
  20. Moghimi, F.; Ghoddusi, H.; Asiabanpour, B.; Behroozikhah, M. Atmospheric water generation (AWG): Performance model and economic analysis. In Advances in Production Management Systems. Towards Smart Production Management Systems: IFIP WG 5.7 International Conference, APMS 2019, Austin, TX, USA, 1–5 September 2019, Proceedings, Part II; Springer International Publishing: New York, NY, USA, 2019; pp. 151–158. [Google Scholar]
  21. Ali, M.A.; Saifur, S.; Ali, M.A. Quantification of condensate water generated from air conditioning system. Glob. Sci. Technol. J. 2018, 6, 44–56. [Google Scholar]
  22. Snyder, R.L.; Shaw, R.H. Converting Humidity Expressions with Computers and Calculators; University of California. Division of Agriculture and Natural Resources: Oakland, CA, USA, 1984. [Google Scholar]
  23. Chander, S.; Purohit, A.; Sharma, A.; Arvind; Nehra, S.; Dhaka, M. A study on photovoltaic parameters of mono-crystalline silicon solar cell with cell temperature. Energy Rep. 2015, 1, 104–109. [Google Scholar] [CrossRef]
  24. Banerjee, K.; Bali, V.; Nawaz, N.; Bali, S.; Mathur, S.; Mishra, R.K.; Rani, S. A machine-learning approach for prediction of water contamination using latitude, longitude, and elevation. Water 2022, 14, 728. [Google Scholar] [CrossRef]
  25. Khoi, D.N.; Quan, N.T.; Linh, D.Q.; Nhi, P.T.T.; Thuy, N.T.D. Using machine learning models for predicting the water quality index in the La Buong River, Vietnam. Water 2022, 14, 1552. [Google Scholar] [CrossRef]
Figure 1. Diagrammatic flow of the experiment.
Sustainability 15 15431 g001
Figure 2. PV array with two different configurations of sprinkler installation for the cooling and cleaning tests at the Falaj Hazza campus. (a) Configuration 1: Panel 1 (cooled and cleaned with condensate water), Panel 4 (dry cleaned with microfiber cloth wiper), and Panel 6 (reference: uncooled and uncleaned). (b) Configuration 2: Panel 1 (dry cleaned with microfiber cloth wiper), Panels 2, 3, 4, and 5 (cooled and cleaned with condensate water), and Panel 6 (reference: uncooled and uncleaned).
Sustainability 15 15431 g002
Figure 3. Temperature of uncleaned, wiper-cleaned, and water-cleaned PV panels for the first configuration as a function of peak daytime. The dash line arrows indicate the highest and lowest temperature drops with respect to time.
Sustainability 15 15431 g003
Figure 4. The data of (a) Voltage, (b) Current, and (c) Power as a function of peak day-time for the PV panels in their first configuration.
Sustainability 15 15431 g004
Figure 5. Temperature variation in PV panels for Configuration 2 as a function of peak day-time.
Sustainability 15 15431 g005
Figure 6. Currents for PV panels in the second configuration as a function of day-time.
Sustainability 15 15431 g006
Figure 7. Voltages for PV panels in the second configuration as a function of peak day-time.
Sustainability 15 15431 g007
Figure 8. Powers for PV panels in the second configuration as a function of peak day-time.
Sustainability 15 15431 g008
Figure 9. Water generation prediction using the mathematical model.
Sustainability 15 15431 g009
Disclaimer/Publisher’s Note: The statements, opinions and data contained in all publications are solely those of the individual author(s) and contributor(s) and not of MDPI and/or the editor(s). MDPI and/or the editor(s) disclaim responsibility for any injury to people or property resulting from any ideas, methods, instructions or products referred to in the content.

