Article

Evaluation of Green and Low-Carbon Development Level of Chinese Provinces Based on Sustainable Development Goals

College of Environmental Science and Engineering, Nankai University, 38 Tongyan Road, Jinnan District, Tianjin 300350, China
*
Author to whom correspondence should be addressed.
Sustainability 2023, 15(21), 15449; https://doi.org/10.3390/su152115449
Submission received: 10 September 2023 / Revised: 27 October 2023 / Accepted: 28 October 2023 / Published: 30 October 2023

Abstract

:
Green and low-carbon development are important initiatives to promote the realization of the Sustainable Development Goals (SDGs). In this study, a systematic evaluation method for regional green and low-carbon development levels was established by referring to the evaluation methods of other literature. The evaluation method includes assessing the overall green and low-carbon development levels of the evaluation objects, as well as analyzing the coupling coordination of the two subsystems of green development and low-carbon development. The results show that China’s green low-carbon development level shows a rising trend year by year from 2012 to 2021, but there is still much space for progress. As for 2021, 2 provinces are in the Fair stage, 25 provinces are in the Accepted stage, and 4 provinces are in the Good stage. Provinces with higher levels of green and low-carbon development are characterized by spatial clustering, and the level of green and low-carbon development in the southeast coastal provinces is significantly higher than that in the northwest inland provinces. This study measures the coupling coordination degree of the two subsystems of green development and low-carbon development in each province. The average coupling coordination degree of China’s green and low-carbon development shows a rising trend year by year from 2012 to 2021. By 2021, the coupling coordination degree of China’s 29 provinces belongs to the High level type, and only two provinces belong to the Low level type. This study provides a provincial map of China’s green and low-carbon development levels and a distribution map of the coupling coordination degree of the green and low-carbon development subsystems, which provides support for an in-depth understanding of the spatial–temporal distribution of and development trends in China’s green and low-carbon development level. This study provides support for a deeper understanding of the spatial and temporal distribution and development trend of China’s green and low-carbon development level. The study also provides data to support China’s efforts to promote synergies in reducing pollution and carbon emissions.

1. Introduction

Green development is considered to be able to balance the relationship between promoting social progress and strengthening ecological and environmental protection [1,2], and realizing the decoupling between economic growth and resource consumption. Low-carbon development is a key initiative to combat climate change, slow or stop the deterioration of the human living environment [3], and guard the well-being of human beings. In the post-COVID-19 era, green and low-carbon development plays a key role in the pathway to achieving sustainable development goals (SDGs).
Scholars have explored the green–low-carbon development path from multiple views. In science and technology, relying on green technological innovation to reduce the level of carbon emissions has received attention from scholars [4,5]. The results of several studies in the field of finance have proved that green finance contributes to the reduction in carbon emission intensity [6,7], and is mainly realized through the channels of improving energy efficiency and developing renewable energy [8]. Industrial structure upgrading from the perspective of green development is considered an important way to reduce carbon emission intensity [9]. Scholars have begun to assess the level of green and low-carbon development in Chinese regions. Yang et al. [10] used a super-efficiency epsilon-based measure model to assess the green development efficiency of seven urban agglomerations in China. Cheng et al. [11] took China’s low-carbon pilot cities as research objects to explore whether the implementation of low-carbon policies promotes urban growth. However, existing studies lack the evaluation of the overall synergy between green development and low-carbon development, and green development in some regional scenarios may not contribute to local carbon emission reduction [12]. To realize sustainable development goals under the requirements of resource conservation, environmental protection and low carbon emissions, it is particularly important to assess the synergies between green development and low-carbon development. In recent years, several studies have demonstrated that the rational implementation of environmental regulation will contribute to the green development and low-carbon development of a country (province or city) [13,14,15]. This suggests that the comprehensive governance capacity of the government is an important factor reflecting the level of green and low-carbon development. For example, recent studies have shown that new urbanization can positively regulate urban green total factor energy efficiency through interaction with industrial upgrading and technological innovation [16,17], and thus synergistically promote urban green development and low-carbon development [18]. The level of waste disposal also reflects the comprehensive governance capacity of the government [19,20], so to assess the level of green and low-carbon synergistic development, the waste disposal capacity of the research objects should also be taken into account. Economic development is an important criterion for measuring green and low-carbon development, and several empirical studies have shown that a high level of economic development promotes a region’s capacity for green and low-carbon development [21,22,23]. Guo et al. [24] found that the level of urban economic development is positively correlated with the capacity of green and low-carbon development, and the level of industrial structure and agglomeration is positively correlated with the efficiency of green and low-carbon development. Industrial structure and degree of agglomeration showed a U-shaped relationship with green and low-carbon development. Science and technology innovation can achieve the goal of climate change mitigation and improve environmental governance through the channels of renewable energy research and development, energy efficiency improvement, digitalization popularization and intelligent application [25,26,27,28,29]. We must emphasize the link between resources and technological innovation because scientific and technological progress is the foundation and driving force of development [30,31].
China is the largest developing and transition economy [32] and has experienced tremendous economic growth since its reform and opening up [33,34]. Formulating a green and low-carbon development strategy has become an important concern for China to achieve the SDGs nowadays [35]. The establishment of a green and low-carbon development level assessment index system based on SDGs can scientifically measure China’s green and low-carbon development level and help to efficiently implement China’s green and low-carbon development strategy. For example, our measurement system includes indicators on energy consumption intensity, energy efficiency, and the scale of clean energy development, and provincial scores on these indicators reflect China’s progress in implementing SDG7 (affordable and clean energy) during the study year. The data monitoring helps China to scientifically analyze which provinces are leading the country to actively implement SDG7 and which provinces are contributing to the slowdown of the country’s SDG7 implementation. Therefore, it is necessary to develop a system for evaluating China’s green and low-carbon development levels that reflects both China’s performance in green and low-carbon development and the synergistic links between the two subsystems, respectively. Provinces are an important unit for the implementation of China’s green and low-carbon development strategy. Therefore, in chapter 2, we selected 31 provinces in China’s administrative regions (including provinces, municipalities and autonomous regions) from 2012 to 2021 to conduct a case study and constructed a system for evaluating the level of green and low-carbon development. In chapter 3, based on the established measurement system, we conducted a spatial–temporal analysis of the level of green and low-carbon development of China’s provinces in recent years. In chapter 4, we have summarized the research process and results, and proposed ensuing recommendations. The results of the study provide data support for China to formulate a more scientific and detailed strategic plan for green and low-carbon development, as well as provide case references for countries or regions around the world to explore green–low-carbon development paths.

2. Method and Data

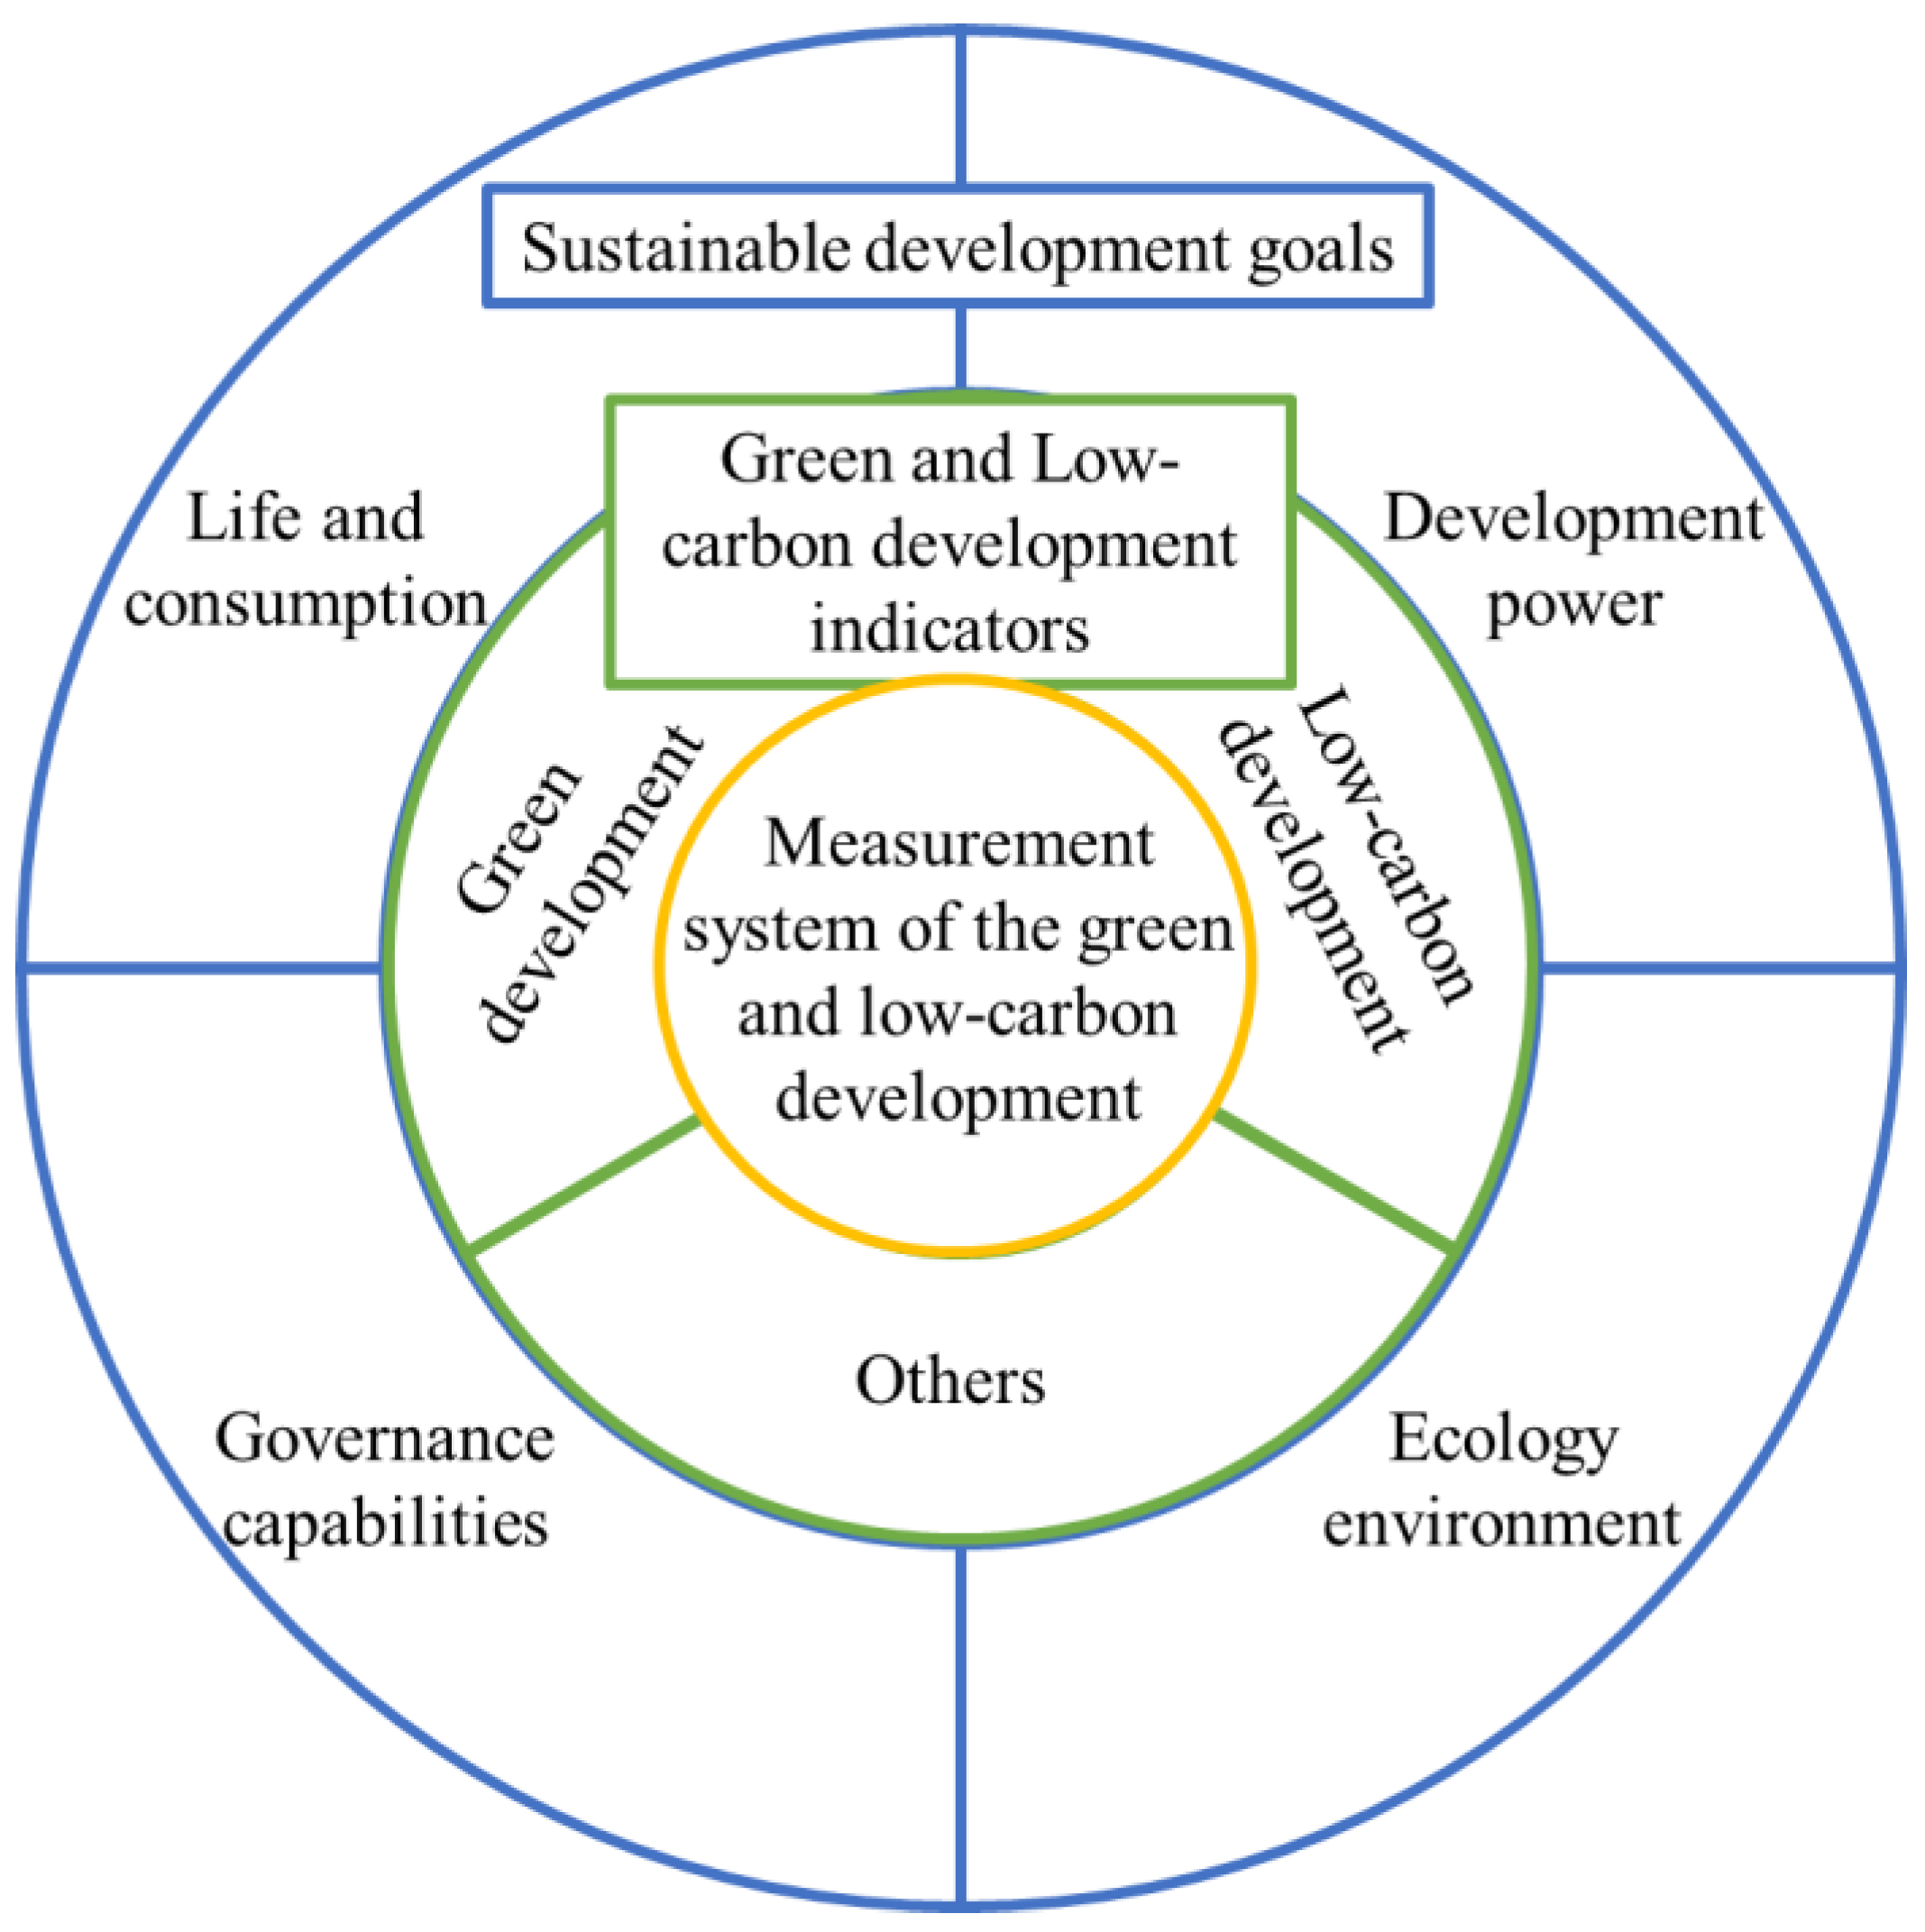
2.1. Measurement System

The construction of an evaluation system for the level of green and low-carbon development is a key step in exploring the pursuit of green and low-carbon development in the process of sustainable development. A single indicator cannot truly reflect the green and low-carbon development levels of the evaluation objects. Although there are differences between green development and low-carbon development in terms of process design, implementation path and goal orientation, the ultimate goal of both development paths is to realize sustainable development. According to the understanding of the SDG concepts [36,37], this study divides the measurement system into four dimensions: Life and consumption, Development power, Ecology environment and Governance capabilities. The construction of the indicator set focuses on the screening of indicators in green and low-carbon development. To ensure the robustness and comprehensiveness of the measurement system, we also include some other indicators (economic indicators, social indicators, etc.) in the indicator set. Figure 1 shows the framework for constructing the measurement system.
Regarding the selection of indicators, this study first collects the indicators related to green and low-carbon development from the global indicator framework of the 2030 Agenda for SDGs and the Environmental Performance Index (EPI) to create a globalized indicator set. Subsequently, some indicators whose statistical caliber does not apply to provinces and China’s development situation are eliminated. Secondly, indicators from China’s progress report on the implementation of the 2030 Agenda for SDGs and some standard documents issued by the Chinese government on green and low-carbon development are added to the set to form a localized indicator set for assessing China’s green and low-carbon development level. The indicator set, combined with the system framework, constitutes the measurement system for green and low-carbon development. Table 1 reports on the measurement system constructed in this study. The measurement system for green and low-carbon development is divided into 4 dimensions and 34 indicators. Because each indicator has a different focus, some indicators can directly reflect the green development level of the study object, some indicators place more emphasis on reflecting the low-carbon development level of the province, and other indicators, such as economic factors [38] and social factors [39], can also indirectly affect the green and low-carbon development level of the province. Therefore, we classify all indicators into three types: Green type (G), Low-carbon type (L) and Others (O). The specific indicators are shown in Table 1. See Table S1 for a detailed description of each indicator.

2.2. Method

2.2.1. Thresholds for Indicators

The determination of indicator thresholds is very important when evaluating the level of green and low-carbon development. We need to deal with extreme values and outliers in the dataset to prevent a large impact on the assessment results. When determining the upper limit of the indicator threshold, the scenario method is used to determine the optimal value of the indicator, and the specific rules are shown in the Table 2. In determining the lower limit of the indicator, the worst value for the national provinces after eliminating the 5% observations in the worst performance is used as the lower limit of the indicator.

2.2.2. Data Standardization

Due to the differences in the scale, order of magnitude and other characteristics of each indicator, the attributes of each indicator are different, and it is not possible to make a comprehensive comparison between different indicators directly. Therefore, in this study, the target progressive standardization method was used to standardize the indicators [40], so that the indicators were transformed into scores ranging from 0 to 100. For the indicators, Equation (1) was used for standardization
X i j = X i j m i n ( X j ) m a x ( X j ) m i n ( X j ) × 100
where Xij is the standardized score of the jth indicator of evaluation unit i; Xi is the statistical value of the jth indicator of evaluation unit i; min (Xj) and max (Xj) are the worst and the best values of the jth indicator, respectively.

2.2.3. The Weights of Indicators

In this study, the entropy weight method is used to calculate the weights of each indicator, which is used to assign weights to the evaluation indicators of the index system for assessing the level of green and low-carbon development of Chinese provinces. The weight of each indicator is calculated as in Equations (2) and (3).
Assuming a total of n indicators and m evaluation objects:
E j = ln ( m ) 1 × i P i j l n P i j
where Ej is the information entropy, P i j = X i j / i X i j . If Pji = 0, then define the limit of PijlnPij as Pji converges to 0.
The indicator weights Wj are calculated based on the information entropy Ej:
W j = ( 1 E j ) / ( n j E j )

2.2.4. The Index of Green and Low-Carbon Development

The green and low-carbon development level index (GLD) of each province is shown in Equation (4):
G L D = j W j X i j
To facilitate the assessment of the current situation and trends in the provinces, we have divided the GLD into five stage types, with the division criteria shown in Table 3.

2.2.5. Data Sources

The data for this study can be obtained from public platforms. These data are mainly from some statistical yearbooks and statistical bulletins such as CHINA STATISTICAL YEARBOOK (Link: http://www.stats.gov.cn/sj/ndsj/ accessed on 27 September 2023.), CHINA CITY STATISTICAL YEARBOOK (Link: https://data.cnki.net/ accessed on 27 September 2023), reliable macro-statistical databases, and relevant academic studies. In the process of organizing the data, this study uses the interpolation method to supplement the data for some indicators that appear to have missing data. There are 34 provincial administrative regions in China, and Taiwan Province, Hong Kong Special Administrative Region and Macao Special Administrative Region are not included in this study due to the availability of data. This study is based on the R language environment to calculate the weights of the indicators; SPSS22.0 software was used to calculate the indicator scores and analyze the trend of the scores.

2.3. Coupling Coordination Analysis

Coupling coordination is an important appraisal credential to guarantee that green development and low-carbon development promote each other and realize the SDGs. By analyzing the degree of coupling and coordination of green development and low-carbon development in China, the relationship between various elements of the system and the development level and stage can be clarified, which is conducive to improving the overall development level of the composite system. This paper uses the coefficient of variation method to value the degree of coupling coordination between green development and low-carbon development subsystems in China [41]:
H = F G F ( L ) / ( F G + F ( L ) / 2 ) 2 2
Among them, H represents the coupling degree of the green and low-carbon development composite system, and F(G) and F(L) represent the index of the green development and low-carbon development subsystems, respectively. Only calculating the H value cannot reflect the level of coordinated development between subsystems. To further quantify the level of coordination between green development and low-carbon development systems, this paper refers to the study using the coupled coordination degree model, and the calculation formula is as follows [42]:
D = C × S × 0.01
S = a f G + b f ( L )
Among these, D represents the value of their coupling and coordination. S is the comprehensive coordination index of the green development and low-carbon development system, and a and b represent the weights of the two systems, respectively. Since the two subsystems are equally important for realizing sustainable development, this paper assigns a value of 0.5 to a and b respectively. To better study the coordination between green development and low-carbon development, the division is based on the value of the coupling coordination degree D (Table 4).

3. Results and Discussion

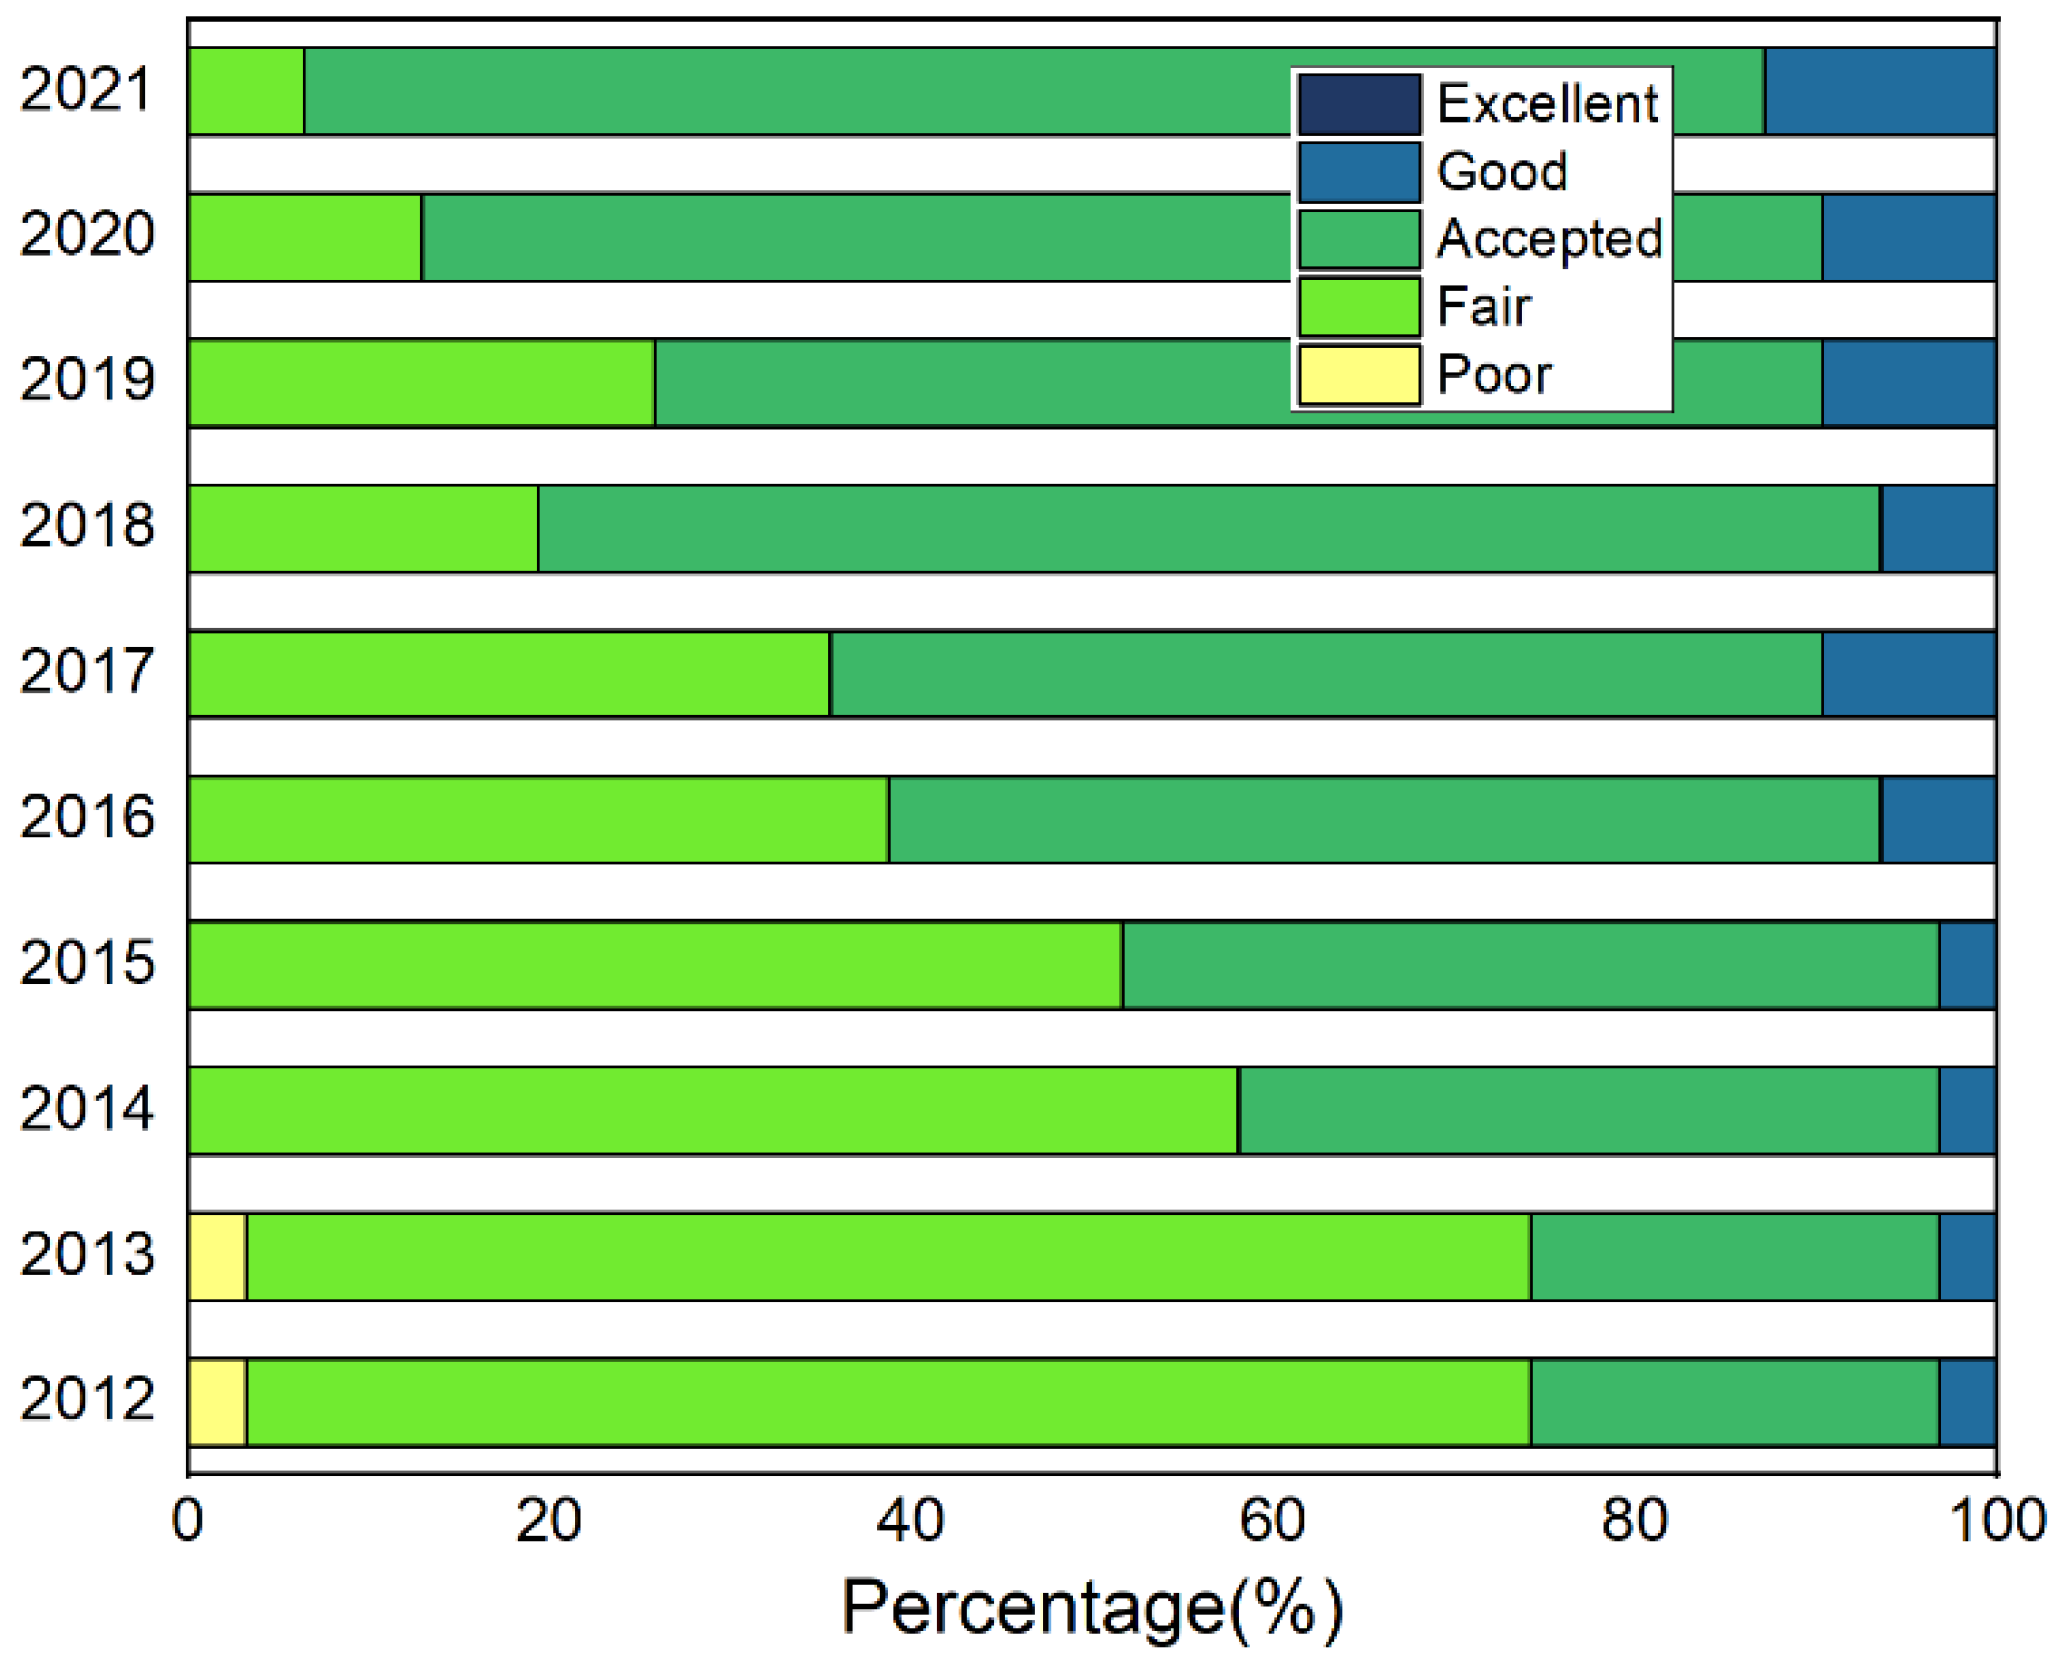
3.1. Assessment of Overall Green and Low-Carbon Development Levels in China’s Provincial Areas

From the overall level, in 2012, the average level of green and low-carbon development of all provinces was low, at the Fair stage. The overall trend of the average level of green and low-carbon development of all provinces is steadily increasing, and the average level of green and low-carbon development of China’s provinces began to rise to the Accepted stage in 2015 and stayed at this stage for 7 years. From Figure 2, it can be seen that the average GLD score of Chinese provinces shows an increasing tend year by year, from 35.45 to 51.43, with a 10-year score increase of more than 40%. The average GLD score of all provinces increased faster from 2013 to 2018, and the growth of the average score slowed down from 2018 to 2021. From 2012 to 2020, the number of provinces with scores above the current year’s GLD average score has not reached half of all provinces. Until 2021, the number of provinces exceeding the average GLD score for that year is more than half.
Figure 3 shows the distribution of provinces in China’s green and low-carbon development from 2012 to 2021. 2012 and 2013 were the same, with one province in the Poor stage and one in the Good stage, and most provinces were in the Fair stage, while a few provinces reached the Accepted stage of green and low-carbon development. Starting from 2014, all provinces are out of the Poor stage development dilemma, and with the number of Good stage provinces remaining stable, the proportion of Fair stage and Accepted stage cities shows a complementary relationship. Over time, the number of Good-stage provinces rose in 2016, and the share of Accepted stage provinces exceeded that of Fair stage provinces, and maintained an upward trend year by year, except for a brief rebound in the share of provinces in the Fair stage in 2019. Until 2021, the share of Good stage provinces exceeds 10%, while the share of Fair stage provinces is less than 10%. The vast majority of provinces are in the Accepted stage, and combined with the trend of changes in the average GLD score shown in Figure 2, several provinces will enter the Good stage of green low-carbon development in the next five years, but no province has reached the Excellent stage of green and low-carbon development.

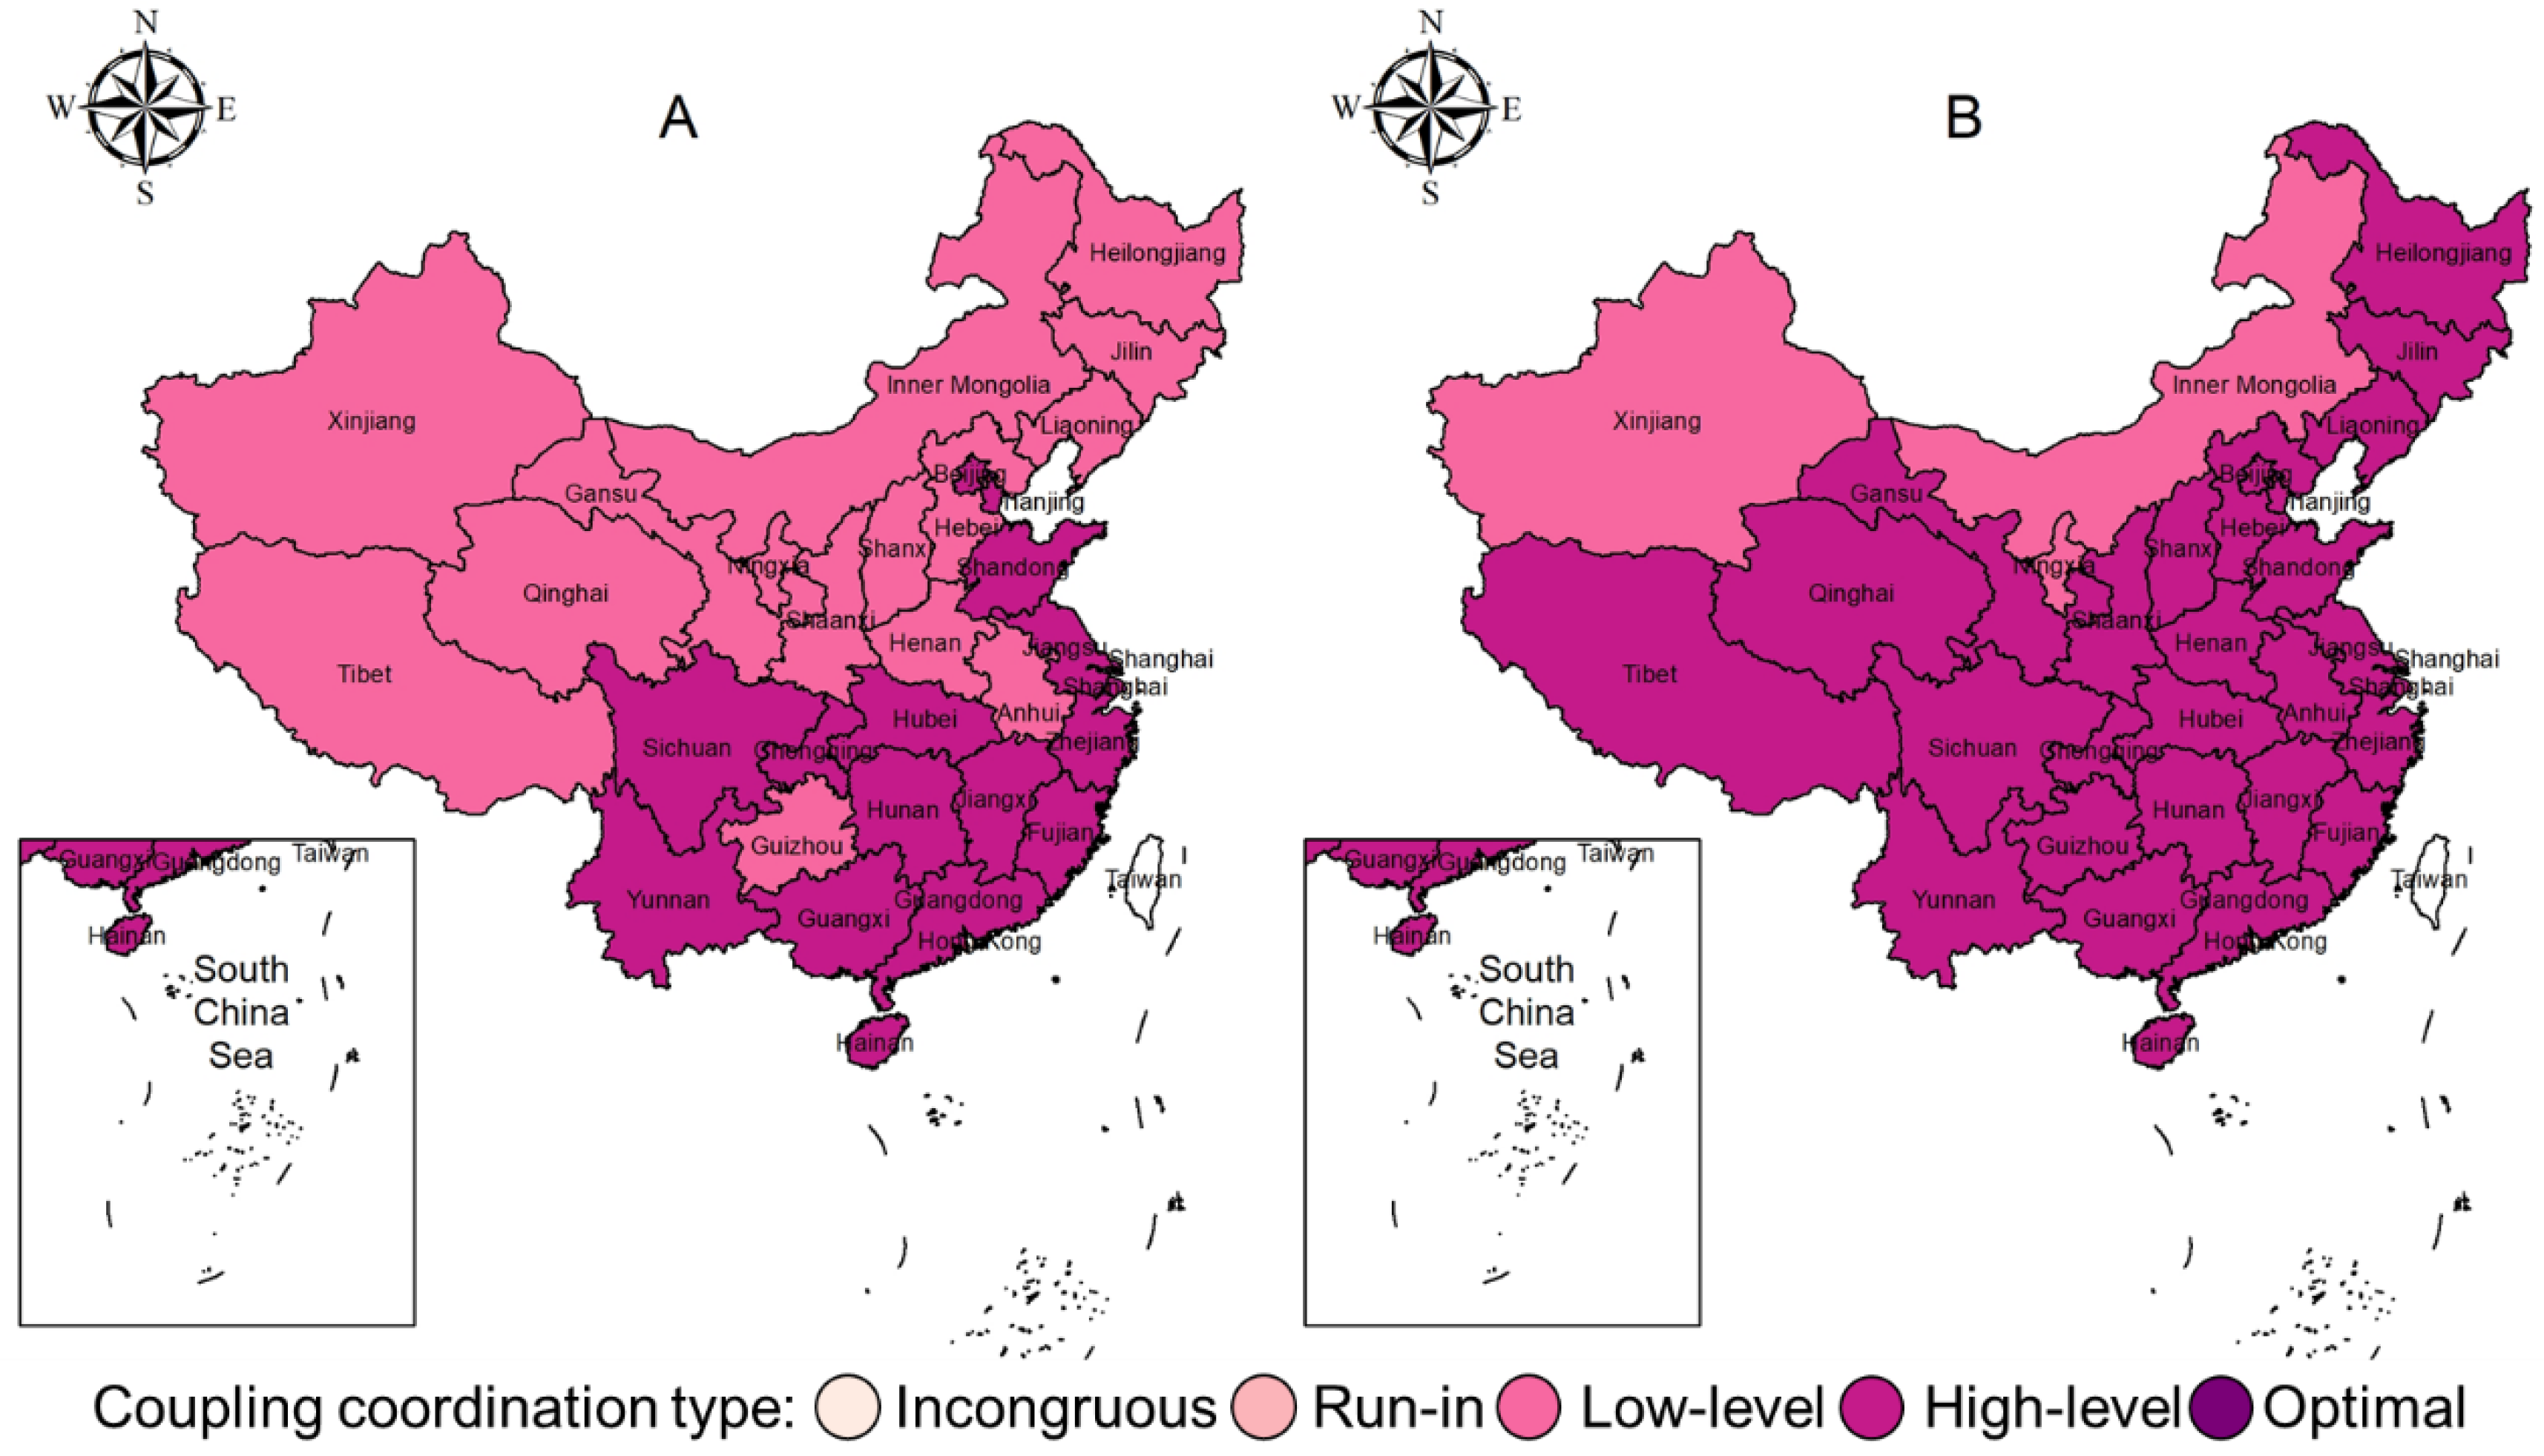
3.2. Spatial and Temporal Analysis of Green and Low-Carbon Development Levels

From the perspective of spatial layout, the study finds that the stage of green low-carbon development level of Chinese provinces has obvious regional distribution characteristics (Figure 4). Overall, the level of green and low-carbon development in the southeast coastal provinces is higher than that in the northwest inland provinces, and the distribution of GLD scores shows a pattern of “southeast high, northwest low”. From Figure 4A, we can see that, in 2012, the cities with higher levels of green and low-carbon development were Beijing, Chongqing and the four provinces along the southeast coast, and only Xinjiang Autonomous Region was in the Poor stage; in 2015 (Figure 4B), the green and low-carbon development levels of some provinces in the central and southern regions entered the Accepted stage. In 2018 (Figure 4C), all the provinces in the central and southern regions have reached or exceeded the Accepted stage, and some provinces in the northwestern and northern regions have reached the Accepted stage. By 2021 (Figure 4D), only two autonomous regions, Xinjiang and Inner Mongolia, are at the Fair stage, and we find that provinces are usually adjacent to or near provinces that are one level above them before they move to the next higher level of green and low-carbon development. In addition to the fact that some of China’s green and low-carbon-related policies are implemented in more developed regions first [43], spillover effects [44] may be one of the factors explaining the above phenomenon.
In terms of specific provinces, Beijing, Chongqing, Guangdong and Shanghai are the four best-performing regions, reaching the Good stage of green and low-carbon development in 2021. Beijing has always been ahead of the national average in terms of green and low-carbon development, and in 2012 Beijing entered the Good stage of green and low-carbon development with a GLD score of 60.84. By 2021, Beijing’s GLD score had grown to 77.54, a 10-year increase of 27.4%. Two autonomous regions, Xinjiang and Inner Mongolia, are lagging in terms of green and low-carbon development: in 2012 Xinjiang’s GLD score was only 16.43, compared to Inner Mongolia’s 30.02. By 2021, Xinjiang’s GLD score has increased 32.36 and Inner Mongolia’s 39.62. Even if the two autonomous regions’ GLD scores increase by a higher percentage in 10 years, it is difficult for them to catch up to the national average level of green and low-carbon development at the current rate of development due to their weak foundation level. Except for the six provinces mentioned above, all other provinces have increased their green and low-carbon development levels throughout the study, and 12 of them have increased their GLD scores by more than 50% in 2021 compared to 2012.

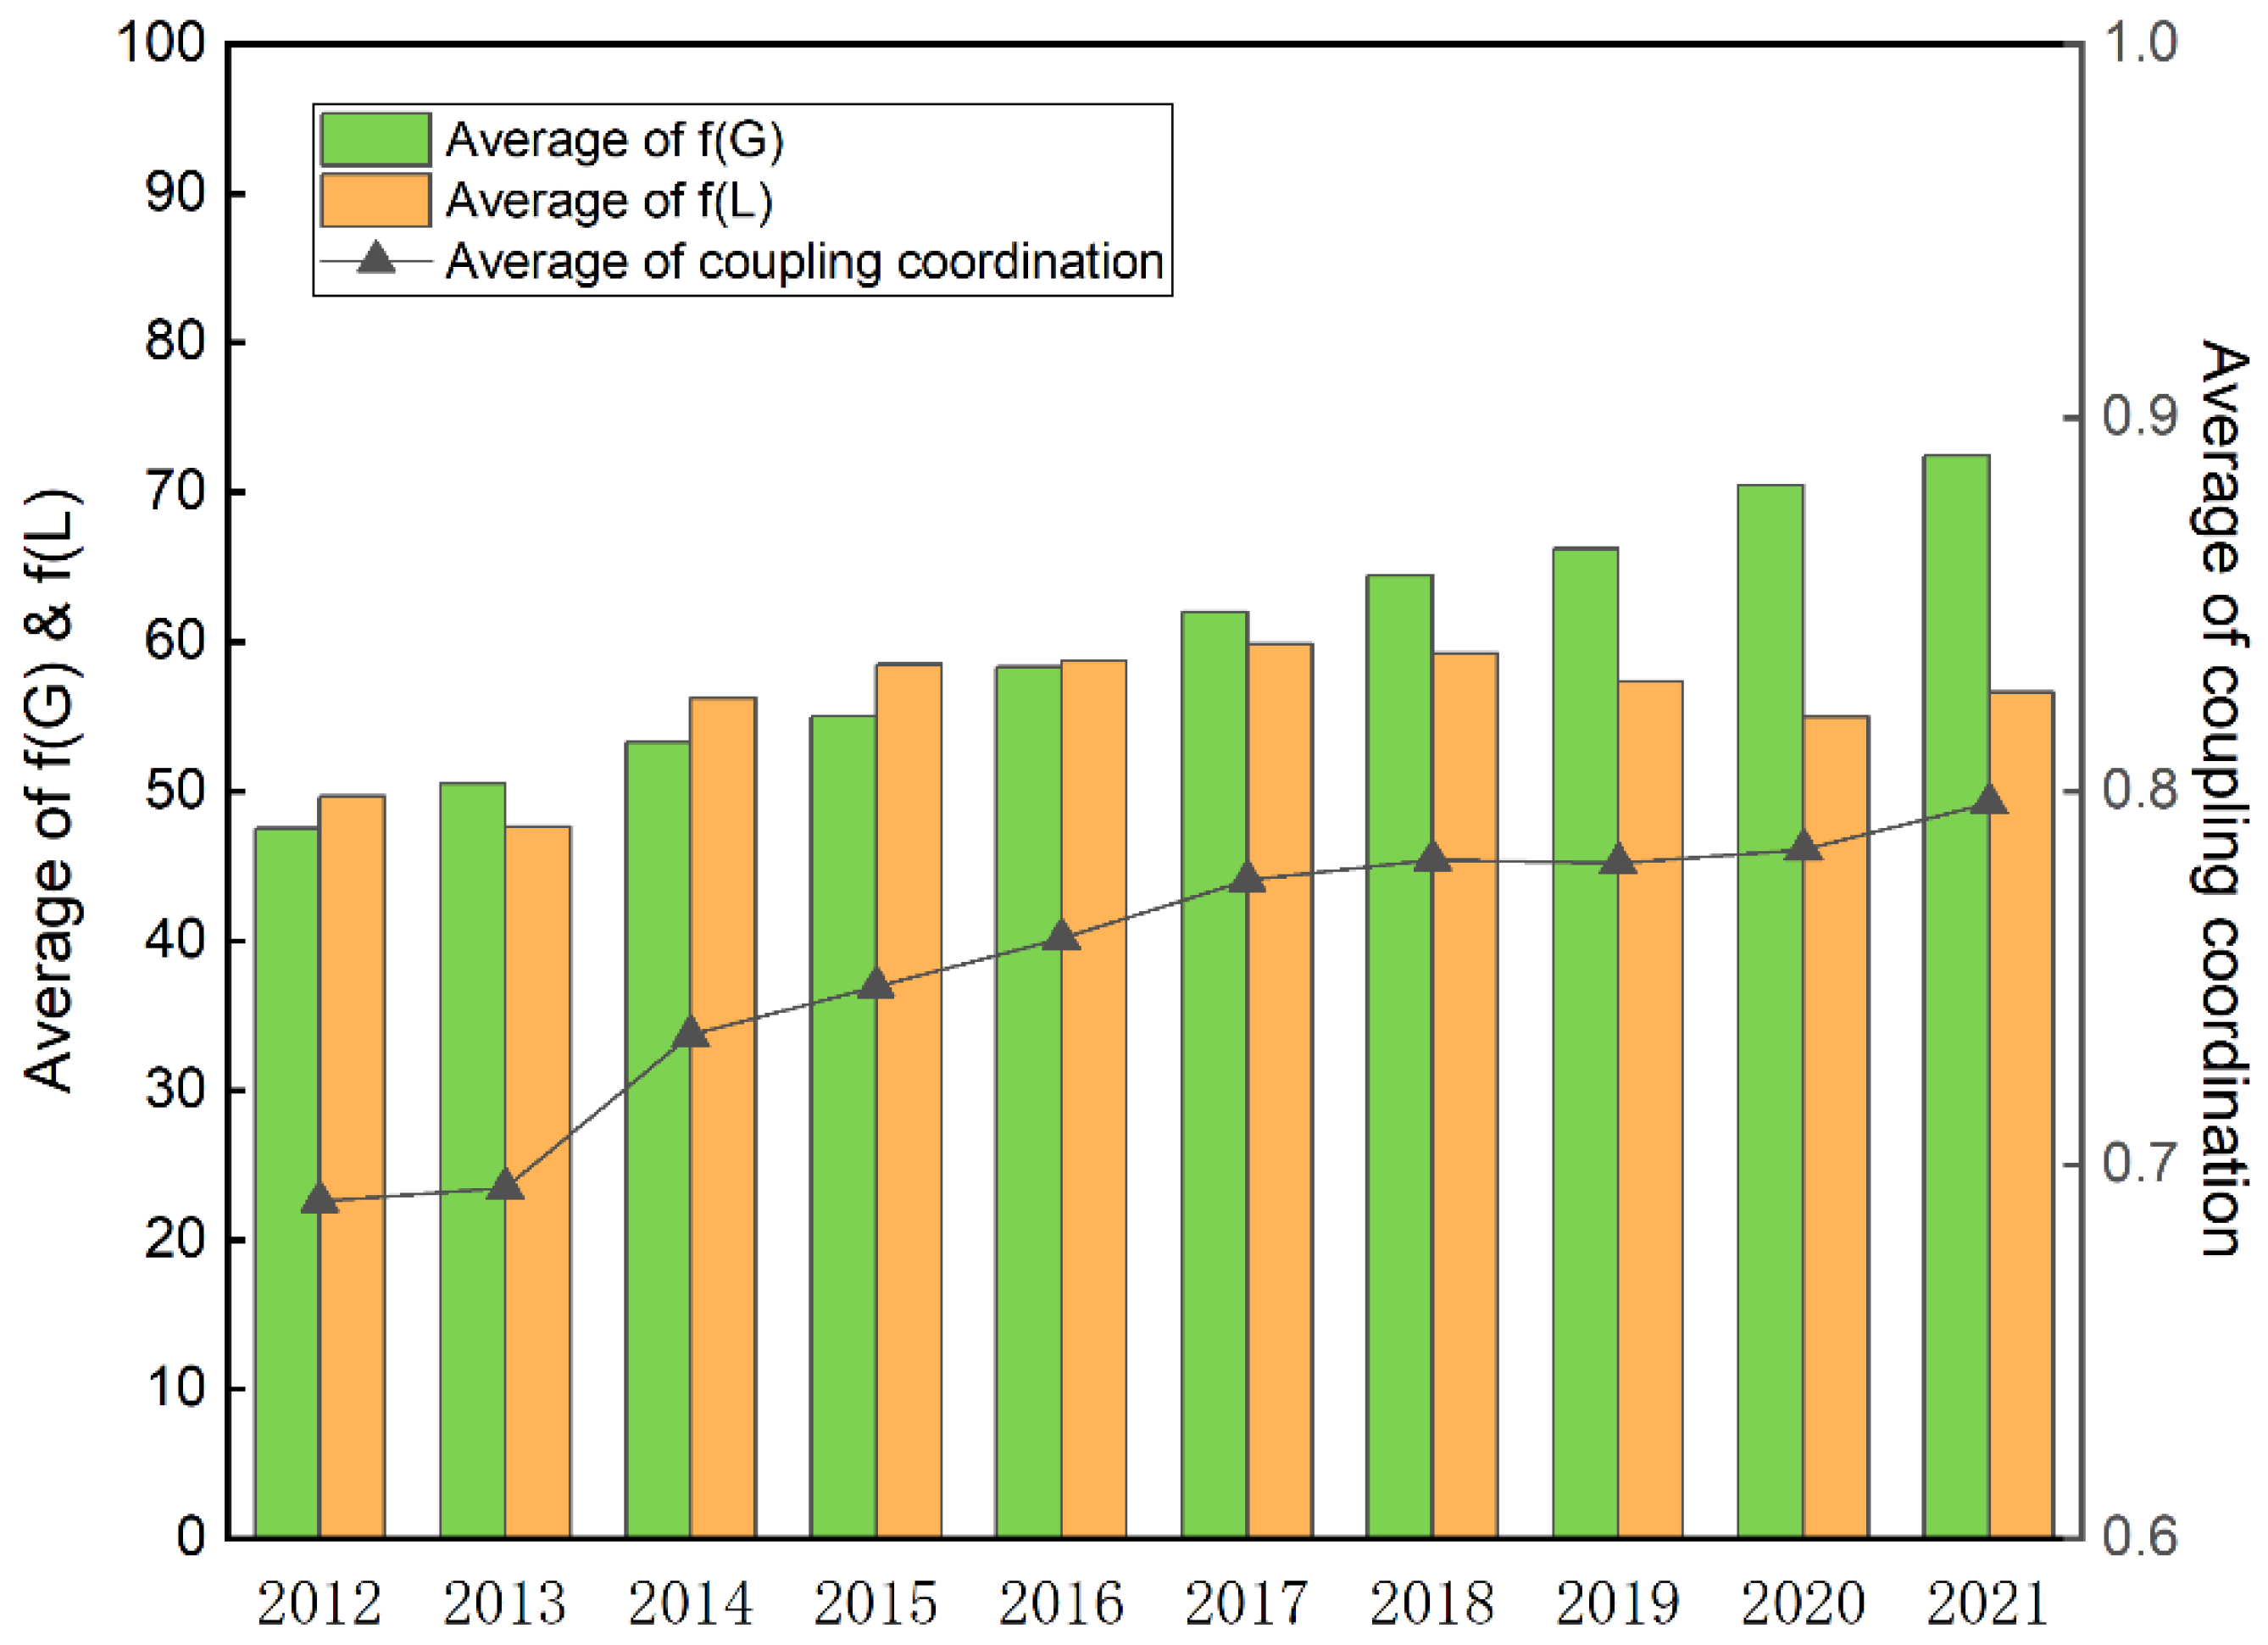
3.3. Coupling Coordination Results

According to Figure 5, in 2012, the mean value of coupling coordination for 31 provinces in China was 0.69, which was at the Low level type, and the mean value of coupling coordination for 31 provinces in China exceeded 0.7 in 2014, which entered into the High level. From 2013 to 2017, the average value of the coupling coordination degree of each province increased year by year, indicating that the synergistic effect of the two subsystems of green development and low-carbon development in China had become more and more obvious during this period. The mean value of coupling coordination for 31 provinces in China from 2017 to 2020 had been 0.78 and then increased to 0.80 in 2021. The data show that the mean value of coupling coordination for 31 provinces in China has maintained the trend of increasing steadily from 2012 to 2021, but the average value of the index of green development (f(G)) and low-carbon development (f(L)) reveal different trends. For 2012–2017 the average of f(G) and f(L) have the same upward trend. In 2018 and beyond, f(G) still maintains a steady upward trend, while f(L) starts to decline year by year, and the gap with f(G) gradually increases until 2021 when f(L) starts to rise. This also corresponds to the fact that the average value of the coupling coordination degree of Chinese provinces has remained at the same level starting from 2017–2020, and does not start to increase until 2021. In 2012, 18 of China’s 31 provinces were in the lagging category of green development (f(G) < f(L)), and 13 were in the lagging category of low-carbon development (f(G) > f(L)). By 2021, only 2 provinces belong to the green development lag type and 29 provinces are low-carbon development lag type. From the comparison results, it can be concluded that China’s overall green development level is higher than the low-carbon development level as of 2021. This may be related to the fact that China has revised a more complete ecological and environmental protection legal system in the last decade [45,46], and some indicators related to ecological environment have been incorporated into the annual assessment of provinces so that the capacity of the ecological environment governance and protection has been improved more systematically.
In terms of the specific situation of each province, in 2012, the coupling coordination degree of a total of 16 provinces in China belonged to the High level type, and was mainly concentrated in the south-central and southeastern coastal areas (Figure 6A), while the coupling coordination degree of the remaining 15 provinces belonged to the Low level type, showing the phenomenon of “south high and north low”. With time, the coupling coordination degree of more and more provinces is upgraded from Low level to High level, and the phenomenon of “south high and north low” is eliminated. By 2021 (Figure 6B), except for Xinjiang, Inner Mongolia and Ningxia, which are still in the Low level type, the coupling coordination degree of the other 28 provinces reaches the High level type, and it is worth noting that the coupling coordination degree of Beijing, Chongqing and Yunnan is still in the Low level type in 2021. It is worth noting that in 2021, the coupling harmonization degree of Beijing, Chongqing and Yunnan is 0.86, 0.88 and 0.88, respectively, which is close to the Optimal type. The coupling coordination degree of green development and low-carbon development of most of the provinces in China in 2021 belongs to the High level type, but the analysis of the data in Figure 5 shows that in recent years the scores for the low-carbon development level of provinces have declined, and the scores for the low-carbon development level of provinces are still in the Low level type. However, from the data analysis of Figure 5, it can be concluded that the scores for low-carbon development level of each province have declined in recent years, which will lead to a gradual widening of the gap between the scores of green development, and the coupling degree of coordination of each province is at the risk of declining. Therefore, to improve the green and low-carbon development level of each province, it is important to focus on the synergistic implementation of green and low-carbon development objectives when formulating relevant policies.

4. Conclusions and Discussion

4.1. Conclusions

To study the level of China’s green and low-carbon development and the trend of change, this paper constructs the measurement system of the green and low-carbon development, to measure the 31 provinces in China from 2012 to 2021. The study also introduces the coupling and coordination degree model to analyze the synergy between the two subsystems of green and low-carbon development in each province in China. The study of empirical results shows that China’s overall green and low-carbon development level shows an increasing trend by year from 2012 to 2021. Starting from 2014, all Chinese provinces entered into the development stage of Fair and above. As time goes by, the level of green low-carbon development of most provinces gradually enters the Accepted stage, and a few provinces enter the Good stage. As of 2021, the average level of China’s green low-carbon development is in the Accepted stage, and there is still a long way to go. From the map, the stage of green and low-carbon development of each province in China has obvious regional distribution characteristics, and the level of green and low-carbon development of the southeast coastal provinces is higher than that of the northwest inland provinces. After analyzing the coupling degree of each province, it is found that the average value of the coupling degree of China’s green development and low-carbon development subsystems maintains a steady upward trend from 2012 to 2021, and the type of coupling degree of coordination increases from the Low level in 2012 to the High level in 2021. In 2012, most of the provinces’ development belonged to the lagging type of green development, and by 2021 most of the provinces belonged to the low-carbon development type. In 2021, most provinces fall into the low-carbon development lag type. The measurement system, parameters and coupled coordination calculations used in this study can provide methodological ideas for other studies. The results of this paper can provide reference to support policymakers in further developing action plans to promote green and low-carbon development.

4.2. Implications

Drawing on the above research outcomes, three ensuing recommendations are as follows:
1. Promoting clean technology research and development and application. The Government can encourage and support enterprises to increase research and development into clean technologies and provide financial support through tax incentives and research and development grants. In addition, the government can establish a green innovation fund to provide venture capital and financial support to encourage innovative enterprises to develop more environmentally friendly technologies and products. This will help upgrade China’s industrial structure, promote the development of clean energy, environmental technology, renewable energy and other industries, and reduce carbon emissions.
2. Promoting the integration and upgrading of the green industrial chain. Governments can encourage enterprises to integrate and upgrade in the green industrial chain so as to improve the greening of the industrial structure. This can be achieved by providing tax incentives, reducing environmental regulatory costs and encouraging the efficient use of resources. The Government can also encourage enterprises to adopt more environmentally friendly production and supply chain management practices, thereby reducing the carbon footprint of the entire industrial chain.
3. Reducing imbalances in China’s green and low-carbon development. Governments can formulate policies to encourage key regions for green development to provide support and resources to underdeveloped regions. This could include the provision of financial incentives to encourage cross-regional cooperation and facilitate the cross-regional transfer and sharing of green technologies and green industries. In addition, the Government can formulate tax policies to encourage enterprises to invest in and build green projects in underdeveloped regions by providing tax breaks or incentives.

4.3. Limitation and Future Research

The limitation of this paper is reflected in the fact that the measurement index system for green and low-carbon development constructed by the study can only reflect the level of green and low-carbon development in each province, and the deeper reasons for this phenomenon deserve further exploration. For example, Inner Mongolia’s green and low-carbon development level and coupling coordination degree are lower than the national average, which may be related to the strategic layout of China’s industries. Inner Mongolia is an important energy production base in China [47] (including thermal power generation, wind power, etc.), and the power generated in Inner Mongolia will be integrated into the grid system and transmitted to other provinces through the high-voltage power lines to supply the energy needs of production and life in other provinces. This decoupling between energy production and consumption in the region may increase the burden of pollutant and greenhouse gas emissions in Inner Mongolia while promoting green and low-carbon development in provinces other than Inner Mongolia. This ultimately leads to Inner Mongolia’s low GLD score. This study lacks further research on China’s energy structure, energy production layout, and energy technology application, and therefore cannot shed more light on the internal mechanisms underlying Inner Mongolia’s poorer level of green and low-carbon development. Under the general trend that China’s economic growth is accompanied by a steady increase in the demand for energy use [48], Inner Mongolia’s low GLD score may not be fundamentally improved in the short term. When we select the optimal value of the indicator, in Situation. C (Table 2), we use the average of the top 5% data for this indicator. Sometimes there is a big gap between the top 5% of the data set of the indicator and the bottom 95% of the data set as a whole, which leads to a small part of the evaluation unit performing well in this indicator and most of the evaluation units perform close to each other in this indicator, which adds some uncertainty to the subsequent determination of the weights of the indicator using the entropy weighting method. In the future, our study can further explore the level of green and low-carbon development at the city level in detail, and try to explore the influencing factors that have contributed to the current state of green and low-carbon development in various regions of China.

Supplementary Materials

The following supporting information can be downloaded at: https://www.mdpi.com/article/10.3390/su152115449/s1, Table S1. Description of the indicators.

Author Contributions

Data curation, Z.L.; formal analysis, Z.L.; methodology, C.S.; funding acquisition, C.S.; investigation, F.W. and R.D.; supervision, R.D.; writing—original draft, Z.L.; writing—review and editing, R.D. All authors have read and agreed to the published version of the manuscript.

Funding

This work was supported by the National Key Research and Development Project of China [grant numbers 2022YFC3802902].

Institutional Review Board Statement

Not applicable.

Informed Consent Statement

Not applicable.

Data Availability Statement

Data and materials are available from the authors upon request.

Acknowledgments

The authors would like to thank the anonymous reviewers and the editor for their constructive comments and suggestions for this paper.

Conflicts of Interest

The authors declare no conflict of interest.

References

  1. Chen, X.; Chen, Z. Can Green Finance Development Reduce Carbon Emissions? Empirical Evidence from 30 Chinese Provinces. Sustainability 2021, 13, 12137. [Google Scholar] [CrossRef]
  2. Cai, X.; Wang, W.; Rao, A.; Rahim, S.; Zhao, X. Regional Sustainable Development and Spatial Effects From the Perspective of Renewable Energy. Front. Environ. Sci. 2022, 10, 859523. [Google Scholar] [CrossRef]
  3. Belmonte-Ureña, L.J.; Plaza-Úbeda, J.A.; Vazquez-Brust, D.; Yakovleva, N. Circular economy, degrowth and green growth as pathways for research on sustainable development goals: A global analysis and future agenda. Ecol. Econ. 2021, 185, 107050. [Google Scholar] [CrossRef]
  4. Lin, B.Q.; Ma, R.Y. Green technology technology innovations, urban innovation environment and CO2 emission reduction in China: Fresh evidence from a partially linear functional-coefficient panel model. Technol. Forecast. Soc. Chang. 2022, 176, 121434. [Google Scholar] [CrossRef]
  5. Chen, J.; Gao, M.; Cheng, S.; Liu, X.; Hou, W.; Song, M.; Li, D.; Fan, W. China’s city-level carbon emissions during 1992–2017 based on the inter-calibration of nighttime light data. Sci. Rep. 2021, 11, 3323. [Google Scholar] [CrossRef]
  6. Sun, Y.P.; Guan, W.; Cao, Y.; Bao, Q. Role of green finance policy in renewable energy deployment for carbon Evidence from China. Renew. Energy 2022, 197, 643–653. [Google Scholar] [CrossRef]
  7. Zhang, M.L.; Liu, Y. Influence of digital finance and green technology innovation on China’s carbon emission efficiency: Empirical analysis based on spatial metrology. Sci. Total Environ. 2022, 838, 156463. [Google Scholar] [CrossRef]
  8. Rasoulinezhad, E.; Taghizadeh-Hesary, F. Role of green finance in improving energy efficiency and renewable energy development. Energy Effic. 2022, 15, 14. [Google Scholar] [CrossRef]
  9. Cheng, Z.H.; Li, L.S.; Liu, J. Industrial structure, technical progress and carbon intensity in China’s provinces. Renew. Sustain. Energy Rev. 2018, 81, 2935–2946. [Google Scholar] [CrossRef]
  10. Yang, T.; Zhou, K.L.; Zhang, C. Spatiotemporal patterns and influencing factors of green development efficiency in China?s urban agglomerations. Sustain. Cities Soc. 2022, 85, 104069. [Google Scholar] [CrossRef]
  11. Cheng, J.H.; Yi, J.; Dai, S.; Xiong, Y. Can low-carbon city construction facilitate green growth? Evidence from China’s pilot low-carbon city initiative. J. Clean. Prod. 2019, 231, 1158–1170. [Google Scholar] [CrossRef]
  12. Sun, C.H. How are green finance, carbon emissions, and energy resources related in Asian sub-regions? Resour. Policy 2023, 83, 103648. [Google Scholar] [CrossRef]
  13. Wu, H.T.; Li, Y.; Hao, Y.; Ren, S.; Zhang, P. Environmental decentralization, local government competition, and regional green development: Evidence from China. Sci. Total Environ. 2020, 708, 135085. [Google Scholar] [CrossRef]
  14. Du, K.R.; Cheng, Y.Y.; Yao, X. Environmental regulation, green technology innovation, and industrial structure upgrading: The road to the green transformation of Chinese cities. Energy Econ. 2021, 98, 105247. [Google Scholar] [CrossRef]
  15. Qiu, S.L.; Wang, Z.L.; Liu, S. The policy outcomes of low-carbon city construction on urban green development: Evidence from a quasi-natural experiment conducted in China. Sustain. Cities Soc. 2021, 66, 102699. [Google Scholar] [CrossRef]
  16. Dong, F.; Zhu, J.; Li, Y.; Chen, Y.; Gao, Y.; Hu, M.; Qin, C.; Sun, J. How green technology innovation affects carbon emission efficiency: Evidence from developed countries proposing carbon neutrality targets. Environ. Sci. Pollut. Res. 2022, 29, 35780–35799. [Google Scholar] [CrossRef]
  17. Zhu, B.Z.; Zhang, M.; Zhou, Y.; Wang, P.; Sheng, J.; He, K.; Wei, Y.-M.; Xie, R. Exploring the effect of industrial structure adjustment on interprovincial green development efficiency in China: A novel integrated approach. Energy Policy 2019, 134, 110946. [Google Scholar] [CrossRef]
  18. Shao, J.; Wang, L.H. Can new-type urbanization improve the green total factor energy efficiency? Evidence from China. Energy 2023, 262, 125499. [Google Scholar] [CrossRef]
  19. Chen, X.; Xing, L.; Zhou, J.; Wang, K.; Lu, J.; Han, X. Spatial and temporal evolution and driving factors of county solid waste harmless disposal capacity in China. Front. Environ. Sci. 2023, 10, 1056054. [Google Scholar] [CrossRef]
  20. Ko, S.; Kim, W.; Shin, S.-C.; Shin, J. The economic value of sustainable recycling and waste management policies: The case of a waste management crisis in South Korea. Waste Manag. 2020, 104, 220–227. [Google Scholar] [CrossRef]
  21. Sun, W.; Huang, C.C. How does urbanization affect carbon emission efficiency? Evidence from China. J. Clean. Prod. 2020, 272, 122828. [Google Scholar] [CrossRef]
  22. Yin, X.L.; Xu, Z.R. An empirical analysis of the coupling and coordinative development of China’s green finance and economic growth. Resour. Policy 2022, 75, 102476. [Google Scholar] [CrossRef]
  23. Zhou, X.G.; Tang, X.M.; Zhang, R. Impact of green finance on economic development and environmental quality: A study based on provincial panel data from China. Environ. Sci. Pollut. Res. 2020, 27, 19915–19932. [Google Scholar] [CrossRef] [PubMed]
  24. Guo, Y.H.; Tong, L.J.; Mei, L. The effect of industrial agglomeration on green development efficiency in Northeast China since the revitalization. J. Clean. Prod. 2020, 258, 120584. [Google Scholar] [CrossRef]
  25. Zhang, J.N.; Lyu, Y.; Li, Y.; Geng, Y. Digital economy: An innovation driving factor for low-carbon development. Environ. Impact Assess. Rev. 2022, 96, 106821. [Google Scholar] [CrossRef]
  26. Zhang, H.Y.; Gao, S.Z.; Zhou, P. Role of digitalization in energy storage technological innovation: Evidence from China. Renew. Sustain. Energy Rev. 2023, 171, 113014. [Google Scholar] [CrossRef]
  27. Wang, J.; Dong, K.; Dong, X.; Taghizadeh-Hesary, F. Assessing the digital economy and its carbon-mitigation effects: The case of China. Energy Econ. 2022, 113, 106198. [Google Scholar] [CrossRef]
  28. Zhao, X.X.; Zheng, M.B.; Fu, Q. How natural disasters affect energy innovation? The perspective of environmental sustainability. Energy Econ. 2022, 109, 105992. [Google Scholar] [CrossRef]
  29. Geddes, A.; Schmidt, T.S.; Steffen, B. The multiple roles of state investment banks in low-carbon energy finance: An analysis of Australia, the UK and Germany. Energy Policy 2018, 115, 158–170. [Google Scholar] [CrossRef]
  30. Caputo, F.; Garcia-Perez, A.; Cillo, V.; Giacosa, E. A knowledge-based view of people and technology: Directions for a value co-creation-based learning organisation. J. Knowl. Manag. 2019, 23, 1314–1334. [Google Scholar] [CrossRef]
  31. Li, L.; Li, G.; Ozturk, I.; Ullah, S. Green innovation and environmental sustainability: Do clean energy investment and education matter? Energy Environ. 2022, 34, 2705–2720. [Google Scholar] [CrossRef]
  32. Jiakui, C.; Abbas, J.; Najam, H.; Liu, J.; Abbas, J. Green technological innovation, green finance, and financial development and their role in green total factor productivity: Empirical insights from China. J. Clean. Prod. 2023, 382, 135131. [Google Scholar] [CrossRef]
  33. Imran, M.; Jian, Z.; Haque, A.U.; Urbański, M.; Nair, S.L.S. Determinants of Firm’s Export Performance in China’s Automobile Industry. Sustainability 2018, 10, 4078. [Google Scholar] [CrossRef]
  34. Shao, J.; He, Z.W. How does social media drive corporate carbon disclosure? Evidence from China. Front. Ecol. Evol. 2022, 10, 971077. [Google Scholar] [CrossRef]
  35. Li, X.S.; Shu, Y.X.; Jin, X. Environmental regulation, carbon emissions and green total factor productivity: A case study of China. Environ. Dev. Sustain. 2022, 24, 2577–2597. [Google Scholar] [CrossRef]
  36. Xu, Z.C.; Chau, S.N.; Chen, X.; Zhang, J.; Li, Y.; Dietz, T.; Wang, J.; Winkler, J.A.; Fan, F.; Huang, B.; et al. Assessing progress towards sustainable development over space and time. Nature 2020, 577, 74–78. [Google Scholar] [CrossRef]
  37. Nerini, F.F.; Sovacool, B.; Hughes, N.; Cozzi, L.; Cosgrave, E.; Howells, M.; Tavoni, M.; Tomei, J.; Zerriffi, H.; Milligan, B. Connecting climate action with other Sustainable Development Goals. Nat. Sustain. 2019, 2, 674–680. [Google Scholar] [CrossRef]
  38. Wang, J.B.; Xue, Y.F.; Han, M.Y. Impact of carbon emission price and natural resources development on the green economic recovery: Fresh insights from China. Resour. Policy 2023, 81, 103255. [Google Scholar] [CrossRef]
  39. Wang, J.L.; Wang, W.; Ran, Q.; Irfan, M.; Ren, S.; Yang, X.; Wu, H.; Ahmad, M. Analysis of the mechanism of the impact of internet development on green economic growth: Evidence from 269 prefecture cities in China. Environ. Sci. Pollut. Res. 2022, 29, 9990–10004. [Google Scholar] [CrossRef] [PubMed]
  40. Tang, Z. An integrated approach to evaluating the coupling coordination between tourism and the environment. Tour. Manag. 2015, 46, 11–19. [Google Scholar] [CrossRef]
  41. Liu, N.N.; Liu, C.; Xia, Y.; Da, B. Examining the coordination between urbanization and eco-environment using coupling and spatial analyses: A case study in China. Ecol. Indic. 2018, 93, 1163–1175. [Google Scholar] [CrossRef]
  42. Yang, C.; Zeng, W.; Yang, X. Coupling coordination evaluation and sustainable development pattern of geo-ecological environment and urbanization in Chongqing municipality, China. Sustain. Cities Soc. 2020, 61, 102271. [Google Scholar] [CrossRef]
  43. Lee, C.C.; Lee, C.C. How does green finance affect green total factor productivity? Evidence from China. Energy Econ. 2022, 107, 105863. [Google Scholar] [CrossRef]
  44. Pan, X.F.; Li, M.; Wang, M.; Chu, J.; Bo, H. The effects of outward foreign direct investment and reverse technology spillover on China’s carbon productivity. Energy Policy 2020, 145, 111730. [Google Scholar] [CrossRef]
  45. Fang, Z.M.; Kong, X.; Sensoy, A.; Cui, X.; Cheng, F. Government’s awareness of Environmental protection and corporate green innovation: A natural experiment from the new environmental protection law in China. Econ. Anal. Policy 2021, 70, 294–312. [Google Scholar] [CrossRef]
  46. Gao, X.W.; Liu, N.; Hua, Y.J. Environmental Protection Tax Law on the synergy of pollution reduction and carbon reduction in China: Evidence from a panel data of 107 cities. Sustain. Prod. Consum. 2022, 33, 425–437. [Google Scholar] [CrossRef]
  47. Zeng, B.; Zeng, M.; Xue, S.; Cheng, M.; Wang, Y.; Feng, J. Overall review of wind power development in Inner Mongolia: Status quo, barriers and solutions. Renew. Sustain. Energy Rev. 2014, 29, 614–624. [Google Scholar] [CrossRef]
  48. Rehman, A.; Ma, H.; Chishti, M.Z.; Ozturk, I.; Irfan, M.; Ahmad, M. Asymmetric investigation to track the effect of urbanization, energy utilization, fossil fuel energy and CO2 emission on economic efficiency in China: Another outlook. Environ. Sci. Pollut. Res. 2021, 28, 17319–17330. [Google Scholar] [CrossRef]
Figure 1. Construction of the measurement system for green and low-carbon development.
Sustainability 15 15449 g001
Figure 2. China’s GLD scores by province, 2012–2021.
Sustainability 15 15449 g002
Figure 3. Distribution of stages of green and low-carbon development in Chinese provinces, 2012–2021.
Sustainability 15 15449 g003
Figure 4. Distribution of stages of green and low-carbon development levels by province in China, 2012 (A), 2015 (B), 2018 (C), 2021 (D).
Sustainability 15 15449 g004
Figure 5. Coupling coordination of green and low-carbon development in Chinese provinces over the years, green development and low-carbon development scores.
Sustainability 15 15449 g005
Figure 6. Distribution of the coupling and coordination degree of green and low-carbon development by provinces in China, 2012 (A), 2021 (B).
Sustainability 15 15449 g006
Table 1. Measurement index system for green and low-carbon development.
DimensionIndicatorWeightType
Life and consumptionEngel’s coefficient0.0146031O
Domestic electricity use per capita0.0097941L
Daily domestic water use per capita0.0140664G
Area of parkland per capita0.0287866G
CO2 emissions per capita0.0172428L
Public transportation passengers per capita0.0419623L
Development powerGDP per capita0.0277562O
Urbanization rate0.019945O
Disposable income per capita0.0336448O
Share of non-fossil energy in primary energy consumption0.0895867L
Share of renewable energy in total electricity generation0.0637569L
Water consumption per 10,000 yuan GDP0.0148017G
Energy consumption per 10,000 yuan GDP0.0177554L
Energy consumption elasticity coefficient0.0502642L
Construction land area per capita0.0189288O
Value added of tertiary sector as a share of GDP0.0281711O
Patents per 10,000 people0.0993802O
R&D share of GDP0.0410256O
Ecology environmentPM2.5 concentration0.0218065G
Proportion of good waters0.0267063G
Forest cover0.0212723G
Wetland protection rate0.020639G
Ecological quality index0.0212645G
Greening coverage of built-up area0.0179714G
Governance capabilitiesCentralized sewage treatment rate0.0143161G
Recycled water utilization rate0.0405179G
Non-hazardous treatment rate of domestic waste0.0148262G
The comprehensive utilization rate of general industrial solid waste0.0357899O
Energy saving and environmental protection guarantee capacity 0.0245373O
CO2 emissions per unit of GDP0.0127008L
NOx emissions per unit of GDP0.0132064G
SO2 emissions per unit of GDP0.0159366G
Number of buses for 10,000 people0.0211027L
Length of public transportation routes for 10,000 people0.0459342L
Table 2. The basis for selecting the optimal value of indicators.
SituationsSelection Method
  • There are clear guidance types in SDGs, EPI, or relevant national standard indicators
Referencing absolute values
B.
Indicators with no clear requirements but recognized ideal values
Select recognized ideal values
C.
Others
Using the average of the top 5% data for this indicator
Table 3. GLD degree classification.
GLD Value IntervalStage Type
0 ≤ GLD < 20Poor
20 ≤ GLD < 40Fair
40 ≤ GLD < 60Accepted
60 ≤ GLD < 80Good
80 ≤ GLD ≤ 100Excellent
Table 4. Classification of the value of coupling coordination degree.
D ValueCoupling Coordination Type
0 ≤ D < 0.3Incongruous
0.3 ≤ D < 0.5Run-in
0.5 ≤ D < 0.7Low level
0.7 ≤ D < 0.9High level
0.9 ≤ D ≤ 1.0Optimal
Disclaimer/Publisher’s Note: The statements, opinions and data contained in all publications are solely those of the individual author(s) and contributor(s) and not of MDPI and/or the editor(s). MDPI and/or the editor(s) disclaim responsibility for any injury to people or property resulting from any ideas, methods, instructions or products referred to in the content.

