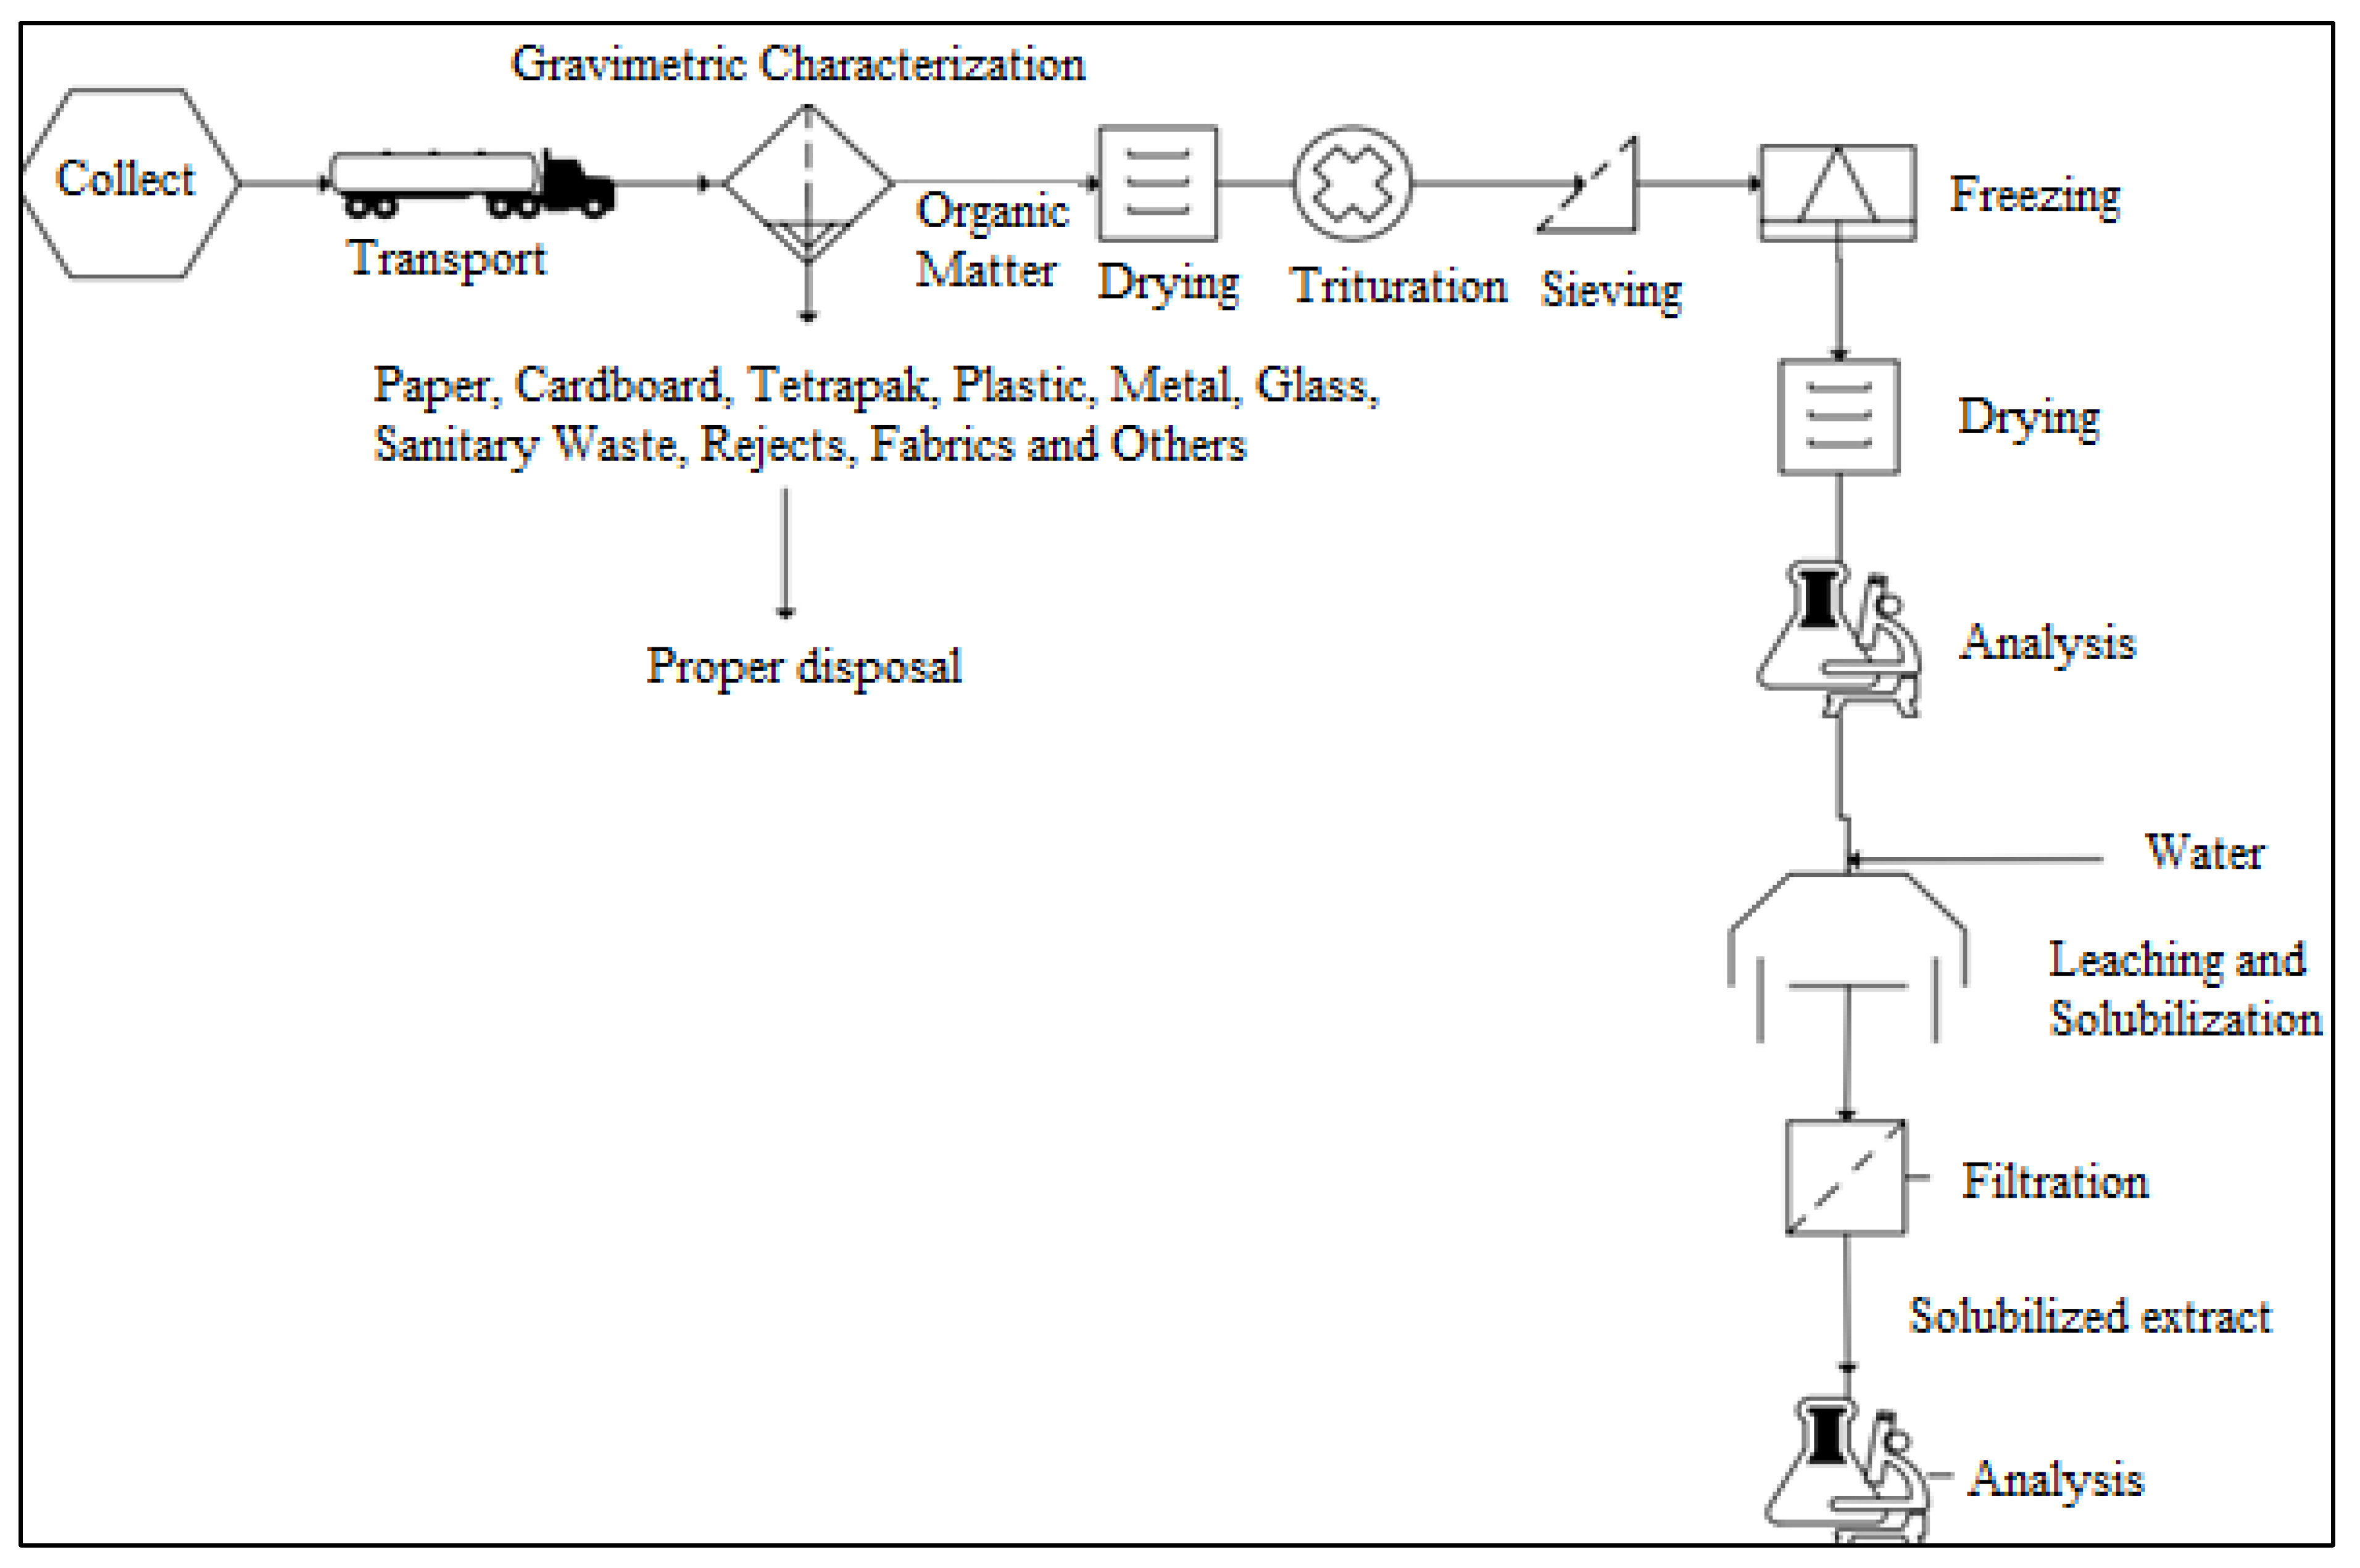
Figure 1.
Process flowsheet of collection, classification/segregation and pretreatment of the organic fraction of MSW and obtainment of the solubilized extract.
Figure 1.
Process flowsheet of collection, classification/segregation and pretreatment of the organic fraction of MSW and obtainment of the solubilized extract.
Figure 2.
Neighborhoods served by Terraplena in Belém.
Figure 2.
Neighborhoods served by Terraplena in Belém.
Figure 3.
Procedure for obtaining the solubilized extract.
Figure 3.
Procedure for obtaining the solubilized extract.
Figure 4.
Proportions of waste fractions collected in the municipality of Belém.
Figure 4.
Proportions of waste fractions collected in the municipality of Belém.
Figure 5.
Comparison between the color and turbidity values of the solubilized extract obtained in relation to the regions delimited in the methodology.
Figure 5.
Comparison between the color and turbidity values of the solubilized extract obtained in relation to the regions delimited in the methodology.
Figure 6.
Concentration of the analyzed nitrogen series parameters for the delimited regions, according to the research methodology.
Figure 6.
Concentration of the analyzed nitrogen series parameters for the delimited regions, according to the research methodology.
Figure 7.
Concentration of the analyzed phosphorous series parameters for the delimited regions, according to the research methodology.
Figure 7.
Concentration of the analyzed phosphorous series parameters for the delimited regions, according to the research methodology.
Figure 8.
Concentration of the analyzed organic matter parameters for the delimited regions, according to the research methodology.
Figure 8.
Concentration of the analyzed organic matter parameters for the delimited regions, according to the research methodology.
Figure 9.
Comparison between the pH values raised by other authors and the pH values obtained in the research [
13,
14,
15,
16,
17,
18,
19].
Figure 9.
Comparison between the pH values raised by other authors and the pH values obtained in the research [
13,
14,
15,
16,
17,
18,
19].
Figure 10.
Comparison between the values of solids raised by other authors and the values obtained in the research [
16,
17,
19,
21].
Figure 10.
Comparison between the values of solids raised by other authors and the values obtained in the research [
16,
17,
19,
21].
Figure 11.
Comparison between the values of ammoniacal nitrogen given by other authors and the values obtained in the research [
16,
17,
19,
20,
21].
Figure 11.
Comparison between the values of ammoniacal nitrogen given by other authors and the values obtained in the research [
16,
17,
19,
20,
21].
Figure 12.
Comparison between the values of nitrate determined by other authors and the values obtained in the research [
16,
17,
19,
21].
Figure 12.
Comparison between the values of nitrate determined by other authors and the values obtained in the research [
16,
17,
19,
21].
Figure 13.
Comparison between the values of total phosphorous determined by other authors and the values obtained in the research [
17,
20,
43].
Figure 13.
Comparison between the values of total phosphorous determined by other authors and the values obtained in the research [
17,
20,
43].
Figure 14.
Comparison between the values of COD determined by other authors and the values obtained in the research [
15,
16,
17,
19,
20,
21].
Figure 14.
Comparison between the values of COD determined by other authors and the values obtained in the research [
15,
16,
17,
19,
20,
21].
Table 1.
Socioeconomic classification in the municipality of Belém in Pará, Brazil, based on minimum salary [
34].
Table 1.
Socioeconomic classification in the municipality of Belém in Pará, Brazil, based on minimum salary [
34].
| Socioeconomic Classification |
|---|
| Classes | Family Income (Minimum/Basic Salary) |
|---|
| A | Over 20 salaries |
| B | From 10 to 20 salaries |
| C | From 4 to 10 salaries |
| D | From 2 to 4 salaries |
| E | Up to 02 salaries |
Table 2.
Socioeconomic classification, population, average family income in reais (BRL) and grouping into sectors of all the neighborhoods in the municipality of Belém in Pará, Brazil [
34].
Table 2.
Socioeconomic classification, population, average family income in reais (BRL) and grouping into sectors of all the neighborhoods in the municipality of Belém in Pará, Brazil [
34].
| Region | Sectors | Neighborhoods | Average Family Income (BRL) | Population
(Inhabitants) | Socioeconomic Classification |
|---|
| Region 1 | Sector 1 | Aura | 354.51 | 1.827 | E |
| Águas Lindas | 344.47 | 17.520 | E |
| Sector 2 | Curió-Utinga | 708.53 | 16.642 | E |
| Guanabara | 381.58 | 1.588 | E |
| Castanheira | 748.87 | 24.424 | E |
| Sector 3 | Souza | 1291.02 | 13.190 | D |
| Marco | 1326.37 | 65.844 | D |
| Region 2 | Sector 4 | Canudos | 821.81 | 13.804 | E |
| Terra Firme | 414.65 | 61.439 | E |
| Guamá | 525.80 | 94.610 | E |
| Sector 5 | Condor | 483.06 | 42.758 | E |
| Jurunas | 633.08 | 64.478 | E |
| Sector 6 | Fátima | 656.14 | 12.385 | E |
| Region 3 | Sector 7 | Umarizal | 1991.17 | 30.090 | D |
| São Brás | 1971.37 | 19.936 | D |
| Cremação | 1093.94 | 31.264 | D |
| Sector 8 | Batista Campos | 2537.63 | 19.136 | C |
| Nazaré | 3036.30 | 20.504 | C |
| Reduto | 2964.30 | 6.373 | C |
| Sector 9 | Campina | 2035.60 | 6.156 | D |
| Cidade Velha | 1235.27 | 12.128 | D |
| Total population | - | 576.096 | - |
Table 3.
Physical–chemical parameters analyzed in the solubilized extract.
Table 3.
Physical–chemical parameters analyzed in the solubilized extract.
| Parameter | Method | Parameter | Method |
|---|
| Hydrogenionic potential | SMWW-4500H+ | Organic nitrogen | SMWW-4500-Norg |
| Turbidity | SMWW-2130 | Ammoniacal nitrogen | SMWW-4500-NH3 |
| Apparent color | SMWW-2120 B | Nitrite | SMWW-4500-NO2 |
| True color | SMWW-2120 B | Nitrate | SMWW-4500-NO3 |
| Electric conductivity | SMWW-2510 | Total phosphorus | SMWW-4500-P |
| Total dissolved solids | SMWW-2540 C | Reactive phosphorus | SMWW-4500-P |
| Total alkalinity | SMWW-2320 | Hydrolyzable phosphorus | SMWW-4500-P |
| Free CO2 | SMWW-CO2 | Condensable phosphorus | SMWW-4500-P |
| Chloride | SMWW-4500-Cl− | Organic phosphorus | SMWW-4500-P |
| Cyanide | SMWW-4500-CN− | Total hardness | SMWW-2340 |
| Fluoride | SMWW-4500-F− | Magnesium hardness | SMWW-2340 |
| Sulfide | SMWW-4500-S2− | Calcium hardness | SMWW-2340 |
| Sulfate | SMWW-4500-SO42− | Total COD | SMWW-5520 |
| Total nitrogen | SMWW-4500-N | COD filtered | SMWW-5520 |
| Total Kjeldahl N | SMWW-4500-N | - | - |
Table 4.
Results of the gravimetric characterization for the nine sectors in relation to the percentage of the collected mass of waste, collected in the municipalities of Belém and Ananindeua, state of Pará, between 4 November 2021 to 13 May 2022.
Table 4.
Results of the gravimetric characterization for the nine sectors in relation to the percentage of the collected mass of waste, collected in the municipalities of Belém and Ananindeua, state of Pará, between 4 November 2021 to 13 May 2022.
| Class of MHSW | Sectors |
|---|
| S1 (%) | S2 (%) | S3 (%) | S4 (%) | S5 (%) | S6 (%) | S7 (%) | S8 (%) | S9 (%) |
|---|
| Paper | 1.24 | 2.30 | 6.38 | 6.13 | 5.01 | 1.67 | 4.70 | 6.45 | 11.95 |
| Cardboard | 2.26 | 3.11 | 1.87 | 2.63 | 4.82 | 2.66 | 5.39 | 3.17 | 2.90 |
| Tetra Pak | 0.31 | 0.68 | 0.48 | 0.34 | 0.63 | 0.99 | 0.92 | 0.87 | 3.25 |
| Hard plastic | 3.72 | 3.29 | 3.98 | 2.25 | 4.10 | 3.25 | 4.53 | 3.37 | 3.70 |
| Soft plastic | 7.96 | 11.69 | 9.50 | 10.15 | 8.44 | 8.17 | 10.66 | 15.25 | 7.90 |
| Metal | 2.03 | 2.39 | 1.39 | 1.68 | 3.09 | 2.35 | 2.58 | 1.20 | 1.25 |
| Organic matter | 61.12 | 54.15 | 60.43 | 49.45 | 53.71 | 57.61 | 54.33 | 54.79 | 54.55 |
| Glass | 2.87 | 4.29 | 0.53 | 0.00 | 0.43 | 2.93 | 0.63 | 1.39 | 3.65 |
| Sanitary waste | 16.67 | 13.00 | 15.44 | 20.34 | 12.78 | 18.78 | 12.72 | 10.34 | 8.25 |
| Fabrics | 1.81 | 5.10 | - | 1.87 | 6.17 | 1.58 | 3.55 | 3.17 | 2.60 |
| Waste | - | - | - | 5.17 | 0.82 | - | - | - | - |
| Total | 100 | 100 | 100 | 100 | 100 | 100 | 100 | 100 | 100 |
Table 5.
Mean, standard deviation, median, variance, maximum and minimum values of percentages of waste fractions collected in collection campaigns and gravimetric characterization results.
Table 5.
Mean, standard deviation, median, variance, maximum and minimum values of percentages of waste fractions collected in collection campaigns and gravimetric characterization results.
| Class of MHSW | Mean ± SD | Median | Variance | Maximum | Minimum |
|---|
| Paper | 4.85 ± 3.28 | 5.01 | 10.76 | 11.95 | 1.24 |
| Cardboard | 2.96 ± 1.16 | 2.90 | 1.35 | 5.39 | 1.87 |
| Tetra Pak | 0.70 ± 0.90 | 0.68 | 0.81 | 3.25 | 0.31 |
| Hard plastic | 3.33 ± 0.65 | 3.70 | 0.42 | 4.53 | 2.25 |
| Soft plastic | 9.72 ± 2.38 | 9.50 | 5.68 | 15.25 | 7.90 |
| Metal | 1.75 ± 0.66 | 2.03 | 0.43 | 3.09 | 1.20 |
| Organic matter | 55.33 ± 3.62 | 54.55 | 13.09 | 61.12 | 49.45 |
| Glass | 1.61 ± 1.59 | 1.39 | 2.53 | 4.29 | 0.00 |
| Sanitary waste | 14.01 ± 3.91 | 13.00 | 15.29 | 20.34 | 8.25 |
| Fabrics | 2.99 ± 1.66 | 2.89 | 2.75 | 6.17 | 1.58 |
| Waste | 2.75 ± 3.08 | 3.00 | 9.46 | 5.17 | 0.82 |
Table 6.
Hydrogenionic potential (pH), electric conductivity (EC), total dissolved solids (TDS), total alkalinity (TA), carbon dioxide (CO2), chloride, cyanide, fluoride, sulfite and sulfate. QL represents values below the limit of quantification.
Table 6.
Hydrogenionic potential (pH), electric conductivity (EC), total dissolved solids (TDS), total alkalinity (TA), carbon dioxide (CO2), chloride, cyanide, fluoride, sulfite and sulfate. QL represents values below the limit of quantification.
| Region | pH | EC (mS·cm−1) | TDS (mg·L−1) | TA (mg·L−1) | CO2 (mg·L−1) | Chloride (mg·L−1) | Cyanide (mg·L−1) | Fluoride (mg·L−1) | Sulfite (µg·L−1) | Sulfate (mg·L−1) |
|---|
| R1 | 3.69 | 10.13 | 5330 | >QL | 18.70 | 223.00 | <0.005 | <0.005 | 110 | 25 |
| R2 | 4.77 | 15.67 | 8040 | 2900 | 10.20 | 349.30 | <0.005 | <0.005 | 130 | <2 |
| R3 | 4.92 | 15.99 | 8030 | 3650 | 12.80 | 230.40 | <0.005 | <0.005 | 420 | <2 |
Table 7.
Turbidity, apparent color, true color, total hardness, calcium hardness and magnesium hardness values obtained in laboratory analyses.
Table 7.
Turbidity, apparent color, true color, total hardness, calcium hardness and magnesium hardness values obtained in laboratory analyses.
| Region | Turbidity (TU) | Apparent Color (CU) | True Color (CU) | Total Hardness (mg·L−1) | Calcium Hardness (mg·L−1) | Magnesium Hardness (mg·L−1) |
|---|
| R1 | 1072.00 | 8500.00 | 6000.00 | 371.00 | 207.00 | 164.00 |
| R2 | 791.00 | 12,500.00 | 9000.00 | 234.00 | <0.05 | 234.00 |
| R3 | 1733.00 | 12,000.00 | 1400.00 | 255.00 | <0.05 | 235.00 |
Table 8.
Total nitrogen, total Kjeldahl nitrogen, organic nitrogen, ammoniacal nitrogen, nitrite and nitrate values obtained in laboratory analyses.
Table 8.
Total nitrogen, total Kjeldahl nitrogen, organic nitrogen, ammoniacal nitrogen, nitrite and nitrate values obtained in laboratory analyses.
| Region | Total Nitrogen (mg·L−1) | Total Kjeldahl Nitrogen (mg·L−1) | Organic Nitrogen (mg·L−1) | Ammoniacal Nitrogen (mg·L−1) | Nitrite (mg·L−1) | Nitrate (mg·L−1) |
|---|
| R1 | 201.80 | 191.00 | 30.00 | 161.00 | 0.80 | 10.00 |
| R2 | 310.30 | 270.00 | 40.00 | 230.00 | 0.30 | 40.00 |
| R3 | 359.90 | 319.00 | 30.00 | 289.00 | 0.90 | 40.00 |
Table 9.
Total phosphorous, total phosphate, reactive phosphate, hydrolyzed phosphate, condensable phosphate and organic phosphate values obtained in laboratory analyses.
Table 9.
Total phosphorous, total phosphate, reactive phosphate, hydrolyzed phosphate, condensable phosphate and organic phosphate values obtained in laboratory analyses.
| Region | Total Phosphorous (mg·L−1) | Total Phosphate (mg·L−1) | Reactive Phosphate (mg·L−1) | Hydrolyzed Phosphate (mg·L−1) | Condensable Phosphate (mg·L−1) | Organic Phosphate (mg·L−1) |
|---|
| R1 | 52.30 | 160.80 | 138.00 | 126.00 | 12.00 | 34.00 |
| R2 | 55.30 | 169.36 | 100.00 | 96.00 | 4.00 | 73.36 |
| R3 | 166.80 | 510.40 | 456.00 | 404.00 | 52.00 | 106.40 |
Table 10.
Total chemical oxygen demand and filtered chemical oxygen demand values obtained in laboratory analyses.
Table 10.
Total chemical oxygen demand and filtered chemical oxygen demand values obtained in laboratory analyses.
| Region | Total Chemical Oxygen Demand (mg·L−1) | Filtered Chemical Oxygen Demand (mg·L−1) |
|---|
| R1 | 28,701.00 | 24,469.00 |
| R2 | 38,608.00 | 29,260.00 |
| R3 | 34,428.00 | 30,078.00 |
Table 11.
Verification of compliance of the analyzed parameters of the solubilized extract of Region 1 according to the Brazilian environmental and public health agencies.
Table 11.
Verification of compliance of the analyzed parameters of the solubilized extract of Region 1 according to the Brazilian environmental and public health agencies.
| Parameter | MS/GM 888/2021 | CONAMA 357/2005 | Parameter | MS/GM 888/2021 | CONAMA 357/2005 |
|---|
| Hydrogenionic potential | No | No | Sulfide | No | No |
| Turbidity | No | No | Sulfate | Yes | Yes |
| Apparent color | No | - | Total nitrogen | - | No |
| True color | - | No | Ammoniacal nitrogen | - | No |
| Total dissolved solids | No | No | Nitrite | Yes | Yes |
| Chloride | Yes | Yes | Nitrate | Yes | Yes |
| Cyanide | - | Yes | Total phosphorus | - | No |
| Fluoride | Yes | Yes | | | |
Table 12.
Verification of compliance of the analyzed parameters of the solubilized extract of Region 2 according to the Brazilian environmental and public health agencies.
Table 12.
Verification of compliance of the analyzed parameters of the solubilized extract of Region 2 according to the Brazilian environmental and public health agencies.
| Parameter | MS/GM 888/2021 | CONAMA
357/2005 | Parameter | MS/GM 888/2021 | CONAMA 357/2005 |
|---|
| Hydrogenionic potential | No | No | Sulfide | No | No |
| Turbidity | No | No | Sulfate | Yes | Yes |
| Apparent color | No | - | Total nitrogen | - | No |
| True color | - | No | Ammoniacal nitrogen | - | No |
| Total dissolved solids | No | No | Nitrite | Yes | Yes |
| Chloride | No | No | Nitrate | No | No |
| Cyanide | - | Yes | Total phosphorus | - | No |
| Fluoride | Yes | Yes | Total hardness | No | - |
| Cyanide | - | Yes | | | |
Table 13.
Verification of compliance of the analyzed parameters of the solubilized extract of Region 3 according to the Brazilian environmental and public health agencies.
Table 13.
Verification of compliance of the analyzed parameters of the solubilized extract of Region 3 according to the Brazilian environmental and public health agencies.
| Parameter | MS/GM 888/2021 | CONAMA
357/2005 | Parameter | MS/GM 888/2021 | CONAMA 357/2005 |
|---|
| Hydrogenionic potential | No | No | Sulfide | No | No |
| Turbidity | No | No | Sulfate | Yes | Yes |
| Apparent color | No | - | Total nitrogen | - | No |
| True color | - | No | Ammoniacal nitrogen | - | No |
| Total dissolved solids | No | No | Nitrite | Yes | Yes |
| Chloride | Yes | Yes | Nitrate | No | No |
| Cyanide | - | Yes | Total phosphorus | - | No |
| Fluoride | Yes | Yes | Total hardness | No | - |


